 Open Access Article
Creative Commons Attribution 3.0 Unported Licence
Incorporating biochar to make hydrogel composites with improved structural properties, valorized from waste-paper mill sludge and forestry residues using energy efficient protocols†
Keerthana
Ketheeswaran
,
Shegufta
Shetranjiwalla
*,
Manokararajah
Krishnapillai
and
Lakshman
Galagedara
 *
*
School of Science and the Environment, Memorial University of Newfoundland, Corner Brook, NL A2H 5G4, Canada. E-mail: lgalagedara@mun.ca; sshetranjiwa@mun.ca
First published on 23rd September 2024
Abstract
The transformation of waste-paper mill sludge into high-value materials with minimized chemical and energy consumption addresses the 12th United Nations Sustainable Development Goal, Responsible Consumption and Production. In this study, cellulose was recovered from dewatered sludge (DS), procured from a local paper mill, using energy-efficient microwave and ultrasonication techniques. Crosslinked hydrogel composites were synthesized from the recovered cellulose and citric acid, as agricultural amendments to optimize water consumption. Powdered biochar (BC) was incorporated into the crosslinked hydrogels, as a biocompatible filler to further enhance thermal stability and water retention. Four hydrogel composite samples were prepared containing BC compositions of 0 g (CH), 0.5 g (BH0.5), 1 g (BH1.0) and 1.5 g (BH1.5). The physicochemical composition, functional groups, thermal stability, water retention, gel fraction, and degradation rate of the extracted cellulose (EC) and prepared hydrogel composites were compared. The energy-efficient extraction process successfully yielded a high EC yield (81.5%) with a cellulose fraction of 93.8% compared to the raw DS at 66.6%, resulting in a conversion efficiency of 140.8%. Incorporating 1 g BC into the hydrogel matrix (BH1.0) improved water absorbency by 992% over CH. Water retention for the hydrogel composites enhanced in the order of BH1.0 > CH > BH0.5 > BH1.5. BC addition also improved the gel fraction, and the thermal stability of the composites increased by up to 60%. Biodegradation studies using the soil burial method showed that cellulose-biochar composites degraded by 40% in 50 days, exhibiting promising potential as agricultural amendments for podzolic soils in the northern boreal ecosystem.
Sustainability spotlightThe global paper industry, vital for economic growth, faces the significant challenge of managing paper mill sludge. Our research addresses this challenge by valorizing PMS in an energy-efficient manner to create cellulose-based hydrogels. Incorporating biochar from forestry biomass into the hydrogel matrix enhances water retention, thermal stability, and biodegradability. These hydrogel composites offer a circular solution that reduces landfill dependency, improves water retention, and fosters a bioeconomy, aligning with the UN SDGs. This eco-friendly approach not only addresses the challenge of PMS disposal but also contributes to sustainable agriculture. By utilizing renewable resources and minimizing environmental impacts, our approach aligns with SDG 12 (Responsible Consumption and Production), while also supporting SDG 2 (Zero Hunger) and SDG 3 (Good Health and Well-being). |
1 Introduction
The pulp & paper industry is one of the largest and growing sectors of the world's economy. Large volumes of paper mill sludge (PMS), rich in cellulose, are generated by pulp & paper mills at different stages of the papermaking process. Global population growth and economics predict an increase in PMS generation by 48 to 86% in the next 50 years.1 Disposing of PMS in landfills, currently a common practice in some countries, is costly and resource-intensive in terms of both land and energy.2,3 This approach is environmentally sensitive, risking the generation and release of greenhouse gases into the atmosphere and contamination of nearby soil and water systems through the leaching of harmful substances.4–6 In many developing nations, these waste materials are incinerated to produce energy.7 Even though this incineration technique allows for the recycling of some biomass waste for energy recovery, the high water content in biomass limits the resulting utilization values. Although PMS possesses a significant amount of cellulose, its use is limited to land spreading, animal bedding, and energy recovery through incineration.8–10 The local paper mill in Corner Brook, Newfoundland, Canada, Corner Brook Pulp and Paper Ltd (CBPPL), produces 50![[thin space (1/6-em)]](https://www.rsc.org/images/entities/char_2009.gif) 000 megagrams of PMS annually. It faces a significant challenge in first treating and then disposing of the PMS to the landfill, incurring significant economic costs of approximately $250,000 per annum and environmental costs from the landfilled waste.11 These criteria motivated the valorizing of PMS in a way that was both effective and environmentally friendly, contributing to a circular, local solution, addressing the 12th United Nations Sustainable Development Goal (UN SDG).
000 megagrams of PMS annually. It faces a significant challenge in first treating and then disposing of the PMS to the landfill, incurring significant economic costs of approximately $250,000 per annum and environmental costs from the landfilled waste.11 These criteria motivated the valorizing of PMS in a way that was both effective and environmentally friendly, contributing to a circular, local solution, addressing the 12th United Nations Sustainable Development Goal (UN SDG).
The boreal ecosystem has dry, acidic podzolic soils.12 This soil is not suitable for growing crops due to the low water retention and acidic pH. However, the potential longer growing season in the boreal ecozone, driven by warmer temperatures from climate change, presents an oppurtunity. Amendments that improve water and nutrient retention could make these soils more productive, contributing to ehnhance food and nutrient security for communities in these regions. Local solutions in these areas would contribute to UN SDG 2 (zero hunger) and UN SDG 3 (good health and well-being). Therefore, this work aims to prepare water-retaining hydrogels from the recovered cellulose from PMS as agricultural amendments that enhance soil properties suitable for crop growth. We aim to use biochar (BC) that is also derived from forestry biomass, contributing to a circular bioeconomy and promoting a waste-to-wealth approach but also contributing to water retention properties that improve pH and soil properties for crop growth.
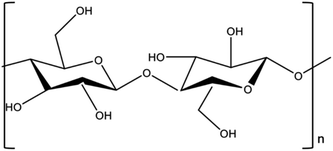
Cellulose is a linear homopolymer composed of D-anhydro glucopyranose units (AGUs) that consist of (β 1–4)-glycosidic bonds (Fig. 1).13–15 It is an essential structural component of the primary cell wall of plants, numerous species of algae, and oomycetes.16,17 Cellulose is widely used in various industries, including those dealing with wood and paper, personal care products, textiles, and pharmaceuticals, and it is anticipated to play a major role in the emerging bioeconomy.18,19
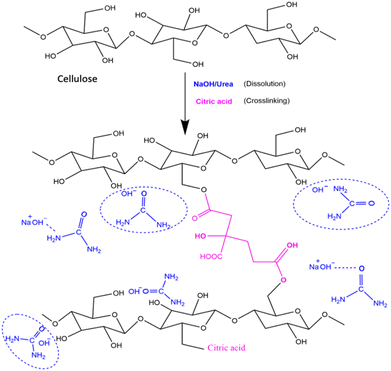
Hydrogels are three-dimensional hydrophilic polymers having a loosely crosslinked hydrophilic network that can absorb and hold large volumes of water or aqueous solutions (hundreds of times their weight) without disintegrating.20 Natural polymers such as cellulose have multiple hydroxyl groups (Fig. 1) that bond with water creating superabsorbent hydrogels with crosslinking agents.21 That renders them as promising candidates for storing surplus water and nutrients in agricultural soils.22 In a dry environment, hydrogels can gradually release up to 95% of their stored water, and then rehydrate when re-exposed to water.23 However, traditional, commercially available hydrogels are primarily synthetic, acrylate-based polymers made from non-renewable resources. Although they currently have a better cost-to-efficiency ratio, they are typically made from virgin or non-renewable fossil-based resources,24 and are non-biodegradable,25,26 potentially persisting in soil for decades or fragmenting into toxic compounds.27 The current state of the climate crisis and need for meeting the UN SDGs calls for urgently adopting resource-efficient and “greener” environmentally friendly alternatives. Biopolymers such as polysaccharides, chitosan, cellulose, alginate, and their derivatives are being studied because of their biocompatibility, biodegradability, and low cost.28–31 However, hydrogels derived from biomass have lower mechanical, thermal and structural properties than hydrogels derived from synthetic polymers.32–34 Therefore, one potential pathway is to increase crosslinking density of the hydrogels by forming hydrogel composites35,36 that enhance the structural, water-retention and thermal stability of biomass-derived hydrogels. It is established that biochar (BC) enhances water retention characteristics of soils due to BC's relatively high surface area and porosity.37,38 Therefore, integrating BC within the hydrogel matrix has the potential to enhance its crosslinking density, swelling capacity, and thermal stability. The current conventional methods for cellulose extraction and hydrogel composite production, which can compare to commercial synthetic analogues, involve physical, chemical, and physicochemical techniques that have limitations including prolonged processing times, excessive energy use and low cellulose recovery.39–41
This work aims to
(I) Investigate the energy-efficient cellulose extraction in high yields from dewatered sludge received from CBPPL using microwave and ultrasonication methods and
(II) Develop biodegradable cellulose-based hydrogels from the extracted cellulose and incorporate biochar to produce hydrogel composites with enhanced water retention, thermal and biodegradation properties.
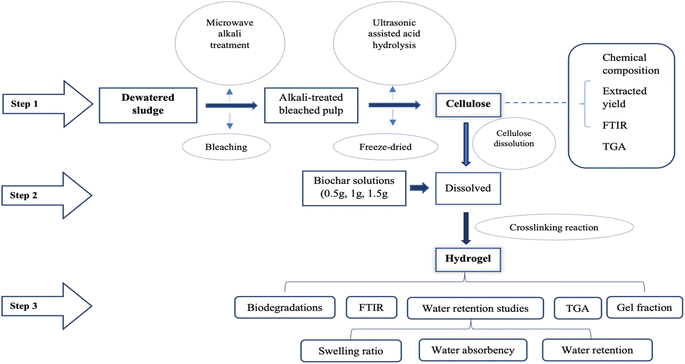
Fig. 2 shows the design of experiments that include pretreatment of the dewatered sludge, cellulose extraction and recovery, and formation of the hydrogel and hydrogel composites. Characterization of the derived bioproducts was conducted comprehensively at all stages, including structural analysis using Fourier Transform Infrared Spectroscopy (FTIR), thermal analysis using Thermogravimetric Analysis (TGA), and water retention and biodegradation potentials with degradation and swelling ratio studies (Fig. 2).
2 Methodology
2.1. Materials and sample preparations
Sodium hydroxide pellets (NaOH), citric acid, urea, 30% hydrogen peroxide (H2O2), glacial acetic acid (glacial CH3COOH), potassium hydroxide (KOH), acetone ((CH3)2CO), and sulphuric acid (H2SO4) (99.9% purity) were purchased from Sigma-Aldrich (Oakville, Ontario, Canada). All chemicals were used as received and working solutions were prepared with deionized water (DW).The powdered BC (Maple Hardwood) used in this study was purchased from ABRI Tech Inc. Quebec, Canada (slow pyrolysis of yellow pine wood at 500 °C for 30 min). The DS was collected from CBPPL, Corner Brook, Newfoundland and Labrador, Canada. The DS was air-dried at room temperature for one week and screened to remove plastic, glass, and other contaminating materials (grid removal). Tiny impurities were removed from DS samples by washing. The DS sample was filled in a 2 L beaker, soaked overnight with DW, and washed three times with DW. After washing, excess water was allowed to drain, air-dried at room temperature for three days, and stored for further use.42
2.2. Extraction of cellulose from dewatered sludge
![[thin space (1/6-em)]](https://www.rsc.org/images/entities/char_2009.gif) :
:![[thin space (1/6-em)]](https://www.rsc.org/images/entities/char_2009.gif) 30 (i.e., 1 g of DS was treated with 30 mL of 2.5 M NaOH). During microwave pretreatment, the power was kept at 350 W and the sample was treated for 45 min at a temperature of 90 °C. The treated DS was then cooled to room temperature and subsequently filtered through Whatman filter paper No. 3 (Sigma-Aldrich, Oakville, Ontario, Canada). Hereafter, the microwave-treated DS sample was denoted as pulp. The obtained pulp was washed with hot DW several times until it reached neutral pH (portable pH/EC/TDS/Temperature meter-HANNA—HI9813-6 with CAL Check, ON, Canada).43
30 (i.e., 1 g of DS was treated with 30 mL of 2.5 M NaOH). During microwave pretreatment, the power was kept at 350 W and the sample was treated for 45 min at a temperature of 90 °C. The treated DS was then cooled to room temperature and subsequently filtered through Whatman filter paper No. 3 (Sigma-Aldrich, Oakville, Ontario, Canada). Hereafter, the microwave-treated DS sample was denoted as pulp. The obtained pulp was washed with hot DW several times until it reached neutral pH (portable pH/EC/TDS/Temperature meter-HANNA—HI9813-6 with CAL Check, ON, Canada).43
![[thin space (1/6-em)]](https://www.rsc.org/images/entities/char_2009.gif) :
:![[thin space (1/6-em)]](https://www.rsc.org/images/entities/char_2009.gif) 1. The bleaching process was repeated two times until it was white in colour, as observed visually. The bleached pulp was rinsed well in extra DW until neutral pH and then oven-dried at 60 °C overnight and then stored in an airtight container for further processing.43
1. The bleaching process was repeated two times until it was white in colour, as observed visually. The bleached pulp was rinsed well in extra DW until neutral pH and then oven-dried at 60 °C overnight and then stored in an airtight container for further processing.43
2.3. Hydrogel synthesis
2.4. Characterization studies
![[thin space (1/6-em)]](https://www.rsc.org/images/entities/char_2009.gif) :
:![[thin space (1/6-em)]](https://www.rsc.org/images/entities/char_2009.gif) 4) for 15 min, filtrated, and washed thoroughly with DW. The filtrate residue was further treated with 40 mL of 24% KOH for 4 h at 25 °C, and the KOH treated sample was washed thoroughly with DW and dried at 80 °C overnight. The same sample was again treated with 50 mL of 72% H2SO4 for 3 h to hydrolyze the cellulose and then refluxed with 60 mL of 5% H2SO4 for 2 h. H2SO4 was removed completely by washing it with DW and dried at 80 °C in the oven overnight and the dried mass of the sample was accounted as a lignin fraction.
4) for 15 min, filtrated, and washed thoroughly with DW. The filtrate residue was further treated with 40 mL of 24% KOH for 4 h at 25 °C, and the KOH treated sample was washed thoroughly with DW and dried at 80 °C overnight. The same sample was again treated with 50 mL of 72% H2SO4 for 3 h to hydrolyze the cellulose and then refluxed with 60 mL of 5% H2SO4 for 2 h. H2SO4 was removed completely by washing it with DW and dried at 80 °C in the oven overnight and the dried mass of the sample was accounted as a lignin fraction.
![[thin space (1/6-em)]](https://www.rsc.org/images/entities/char_2009.gif) :
:![[thin space (1/6-em)]](https://www.rsc.org/images/entities/char_2009.gif) 100, w/w) followed by pressing the mixture into ultra-thin pellets. After that, the prepared samples were loaded onto the FTIR instrument. The spectra were obtained in absorbance mode from a total of 32 scans with a resolution of 4 cm−1 over 600–4000 cm−1.
100, w/w) followed by pressing the mixture into ultra-thin pellets. After that, the prepared samples were loaded onto the FTIR instrument. The spectra were obtained in absorbance mode from a total of 32 scans with a resolution of 4 cm−1 over 600–4000 cm−1.
2.4.4.1. Swelling ratio. The prepared hydrogels' network structure and effective crosslinking density were investigated by studying their swelling properties in DW.57,58 The swelling ratio (SR) was determined using the teabag method.59 Fully dried hydrogel samples, weighing 1.5 g each, were placed in teabags and immersed in DW. At regular time intervals (time t = 10, 20, 30, 40, 50, and 60 h), the swollen hydrogels were taken out, placed on a filter paper and gently wiped off the teabags to remove excess water and then weighed and recorded (Wt). The dry and wet empty tea bags were weighed separately to do the mass correction. The SR of hydrogels at the time t was calculated by applying the following eqn (1).35
 | (1) |
2.4.4.2. Water absorbency and water retention. The mass of the hydrogel samples in the teabags was weighed at the equilibrium state after removing excess water from the teabags. The equilibrium water absorbency (WA) was estimated by eqn (2).
 | (2) |
After samples reached swelling equilibrium in the water absorbency test, the swollen hydrogel composites were left in the open air to study the water retention and weighed at several time intervals (t = 10, 20, 30, 40, 50, and 60 h). The value of water retention (WR) was calculated by eqn (3).35
 | (3) |
2.4.4.3. Gel fraction. Gel fractions (GF) of the samples were determined by weighing these samples and putting them in tea bags. The samples were then immersed in DW until they reached a swelling equilibrium. After reaching equilibrium, the teabag gels were dried at 50 °C. The mass of the dry samples before (W0) and after (Wd) swelling were used to calculate the GF by eqn (4).60
 | (4) |
 | (5) |
2.5. Statistical analysis
Statistical analyses of the synthesized hydrogel composites was conducted using analysis of variance (ANOVA). The Fisher's least significant difference (LSD) was used to compare the treatment means at alpha = 0.05. XLSTAT (Addinsoft (2024), statistical and data analysis software, New York, USA) was used for statistical analyses, and graphical visualization was done through MS Excel.3 Results and discussion
3.1. Physicochemical characteristics of dewatered sludge
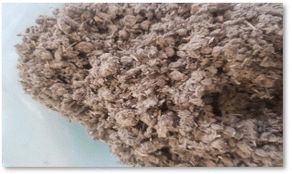
Table 1 shows the basic physicochemical characteristics of DS.| Moisture (%) | 68.03% ± 1.08 |
| Bulk density (g cm−3) | 0.78 ± 0.07 |
| pH | 8.14 ± 0.01 |
| Colour and appearance | Grey granulated fibers (Fig. 4 below) |
The gravimetric moisture content value was comparable with the moisture content of previously studied PMS samples (45–80%).61–63 High moisture content in DS resulted from water absorption due to the hygroscopic nature of cellulose fibres present in the sample.64 The bulk density of PMS samples depends on the pulping process employed and the physical properties of the source material.65 The pH of DS was alkaline as expected (8.14, Table 1) and it was comparable with the pH value of PMS from previous studies.64,66–68 The higher alkalinity is attributed to the presence of calcium carbonate (CaCO3) in the sludge from the paper making processes.69
The chemical composition of the DS and the EC are given in Table 2.
| Treatment | Cellulose | Hemi cellulose | Lignin |
|---|---|---|---|
| Dewatered sludge (DS) | 66.56 ± 0.24 | 19.11 ± 0.41 | 12.31 ± 0.33 |
| Extracted cellulose (EC) | 93.75 ± 0.47 | 4.22 ± 0.11 | 0.67 ± 0.22 |
DS showed high cellulose content in proportion to lignin and hemicellulose. The high cellulose content in the DS can be attributed, at least in part, to the mechanical and chemical degradation of wood polysaccharides occurring during pulping, paper manufacturing, and bleaching processes at the paper mill.70 Since PMS's cellulose and lignin composition directly affect cellulose production, a high cellulose and low lignin DS qualifies as a good resource for extractable cellulose.1,62,71–73
As indicated in Table 2 and Fig. 2, the cellulose content increased as expected upon microwave-assisted alkali pre-treatment and ultrasonic acid hydrolysis. The results confirm that the applied method is effective in selectively extracting cellulose (93%) in high yield from hemicellulose (4%) and lignin (0.7%) in DS (Table 1) achieving objective 1 of this work. When the treatment was completed, nearly all of the lignin had been removed, resulting in almost pure cellulose. This is attributed to the breaking down of the intermolecular-ether linkage between lignin and hemicellulose during the microwave alkaline treatment, which facilitates the removal of hemicellulose and lignin.74 Subsequent bleaching with H2O2 facilitates the oxidation of the aromatic ring of lignin, promoting its dissolution.75 This eliminates the chromophore groups.76 The removal of lignin is crucial to liberate cellulose fibers. However, a trace amount of hemicellulose remained in the EC, as shown in Table 2. The obtained results were consistent with reported results, where microwave-assisted alkali pretreatment followed by ultrasonic acid hydrolysis completely removed lignin from dry jute stalks.43
3.2. Structural characterization
The FTIR spectra for the structural characterization of DS, EC, and hydrogel samples are presented in Fig. 5a–c.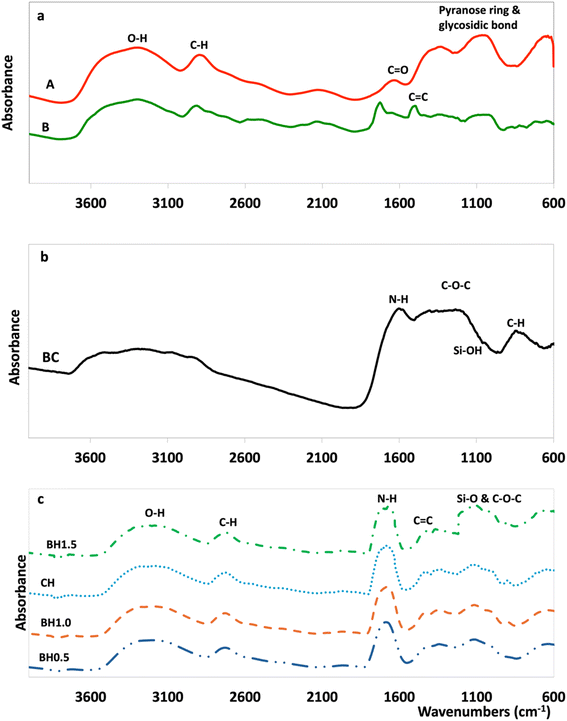 | ||
| Fig. 5 FTIR spectra of (a) extracted cellulose (EC) (A) and dewatered sludge (DS) (B); (b) biochar (BC); (c) hydrogel composites. | ||
Fig. 5a shows the characteristic absorption bands for functional groups of DS and the EC. The broad peak in the 3394–3390 cm−1 range is assigned to the stretching vibrations of the H-bonded hydroxyl groups present in cellulose, water, and lignin (Fig. 1 and 5a). The peaks between 2800 cm−1 and 2900 cm−1 exhibit the C–H stretching vibrations of the cellulose ring structure.77,78 The C–O–C stretching vibration of the pyranose ring and glycosidic ether linkage between the glucose unit in cellulose is observed at 1055 cm−1 for all samples confirming the extraction of a polysaccharide such as cellulose.79 The peak observed between 1500 cm−1 and 1510 cm−1 in the DS sample represents the aromatic ring vibration of lignin.80,81 In addition, the peak at 1734 cm−1 corresponds to the C![[double bond, length as m-dash]](https://www.rsc.org/images/entities/char_e001.gif) O stretching vibration of the acetyl group from hemicellulose/lignin.44 However, the peak in these regions almost disappears in the FTIR spectrum of EC confirming the effective removal of lignin with residual hemicellulose remaining in the EC (Fig. 5a). This is attributed to the process during the microwave-assisted alkali pre-treatment, where NaOH is expected to penetrate the lignocellulosic structure more efficiently, thus initiating the disruption of some bonds associated with lignin and hemicellulose causing degradation.43 Similar observations were previously reported for the microwave-assisted alkaline pre-treatment and ultrasonic acid hydrolysis of jute stalk, and oil palm trunk and empty fruit bunch.43,82 In the BC (Fig. 5b), the peaks between 700 cm−1 and 800 cm−1 represent C–H wagging vibrations of aromatic and heteroaromatic compounds while the peak near 1587 cm−1 associated with the amide group present in the BC.22 The hydrogel composites show characteristic –NH peaks of BC at 1683 cm−1 and strong C–O and Si–O vibrations at 1064 cm−1 (Fig. 5c), confirming the successful integration of the of BC in the hydrogel matrices.
O stretching vibration of the acetyl group from hemicellulose/lignin.44 However, the peak in these regions almost disappears in the FTIR spectrum of EC confirming the effective removal of lignin with residual hemicellulose remaining in the EC (Fig. 5a). This is attributed to the process during the microwave-assisted alkali pre-treatment, where NaOH is expected to penetrate the lignocellulosic structure more efficiently, thus initiating the disruption of some bonds associated with lignin and hemicellulose causing degradation.43 Similar observations were previously reported for the microwave-assisted alkaline pre-treatment and ultrasonic acid hydrolysis of jute stalk, and oil palm trunk and empty fruit bunch.43,82 In the BC (Fig. 5b), the peaks between 700 cm−1 and 800 cm−1 represent C–H wagging vibrations of aromatic and heteroaromatic compounds while the peak near 1587 cm−1 associated with the amide group present in the BC.22 The hydrogel composites show characteristic –NH peaks of BC at 1683 cm−1 and strong C–O and Si–O vibrations at 1064 cm−1 (Fig. 5c), confirming the successful integration of the of BC in the hydrogel matrices.
The FTIR spectra of the various hydrogel composites, shown in Fig. 5c, display the characteristic peaks at 3428 cm−1 for the O–H stretching of alcoholic, carboxylic, and phenolic groups from the EC and BC. Additionally, the peak observed at 1570 cm−1 for the C![[double bond, length as m-dash]](https://www.rsc.org/images/entities/char_e001.gif) O stretching indicates the incorporation of the acid functional groups. The peaks at 1448 cm−1, 1385 cm−1, 1045 cm−1, and 874 cm−1 are attributed to the CH2 scissoring vibrations and C–H asymmetric, aromatic C
O stretching indicates the incorporation of the acid functional groups. The peaks at 1448 cm−1, 1385 cm−1, 1045 cm−1, and 874 cm−1 are attributed to the CH2 scissoring vibrations and C–H asymmetric, aromatic C![[double bond, length as m-dash]](https://www.rsc.org/images/entities/char_e001.gif) C and C–O stretching vibrations, respectively.83,84 The peaks in the hydrogel spectra between 950 cm−1 and 1030 cm−1 showed Si–O stretching vibration peaks. Raw BC (Fig. 5b) showed these characteristics because silica is a crucial component of plant phytoliths and can prevent the breakdown of plant carbon.85 The peaks observed in the 990 cm−1–1215 cm−1 region of the hydrogel spectra are attributed to several overlapping contributions as follows; (i) C–O–C stretching vibrations from the cellulose and BC surfaces from the polysaccharide matrices (ii) Si–O stretching vibrations from the BC surface. Therefore, the peaks observed in the 990 cm−1–1215 cm−1 regions of the composite hydrogel spectra likely have a combined contribution from both the C–O–C groups of the cellulose and BC, as well as the Si–O groups present in the BC component. This evidence the establishment of an extensive BC-cellulose network in the hydrogel composites. The presence of all recognizable peaks for cellulose and BC, together with a clear integration of the Si–O and C–O–C peaks in the hydrogel composites (Fig. 6c), further confirms this. This finding was in line with the findings of previous studies, such as cellulose/BC hydrogel,22 carboxymethyl cellulose/graphene oxide composite,86 and chitosan/BC hydrogel.87
C and C–O stretching vibrations, respectively.83,84 The peaks in the hydrogel spectra between 950 cm−1 and 1030 cm−1 showed Si–O stretching vibration peaks. Raw BC (Fig. 5b) showed these characteristics because silica is a crucial component of plant phytoliths and can prevent the breakdown of plant carbon.85 The peaks observed in the 990 cm−1–1215 cm−1 region of the hydrogel spectra are attributed to several overlapping contributions as follows; (i) C–O–C stretching vibrations from the cellulose and BC surfaces from the polysaccharide matrices (ii) Si–O stretching vibrations from the BC surface. Therefore, the peaks observed in the 990 cm−1–1215 cm−1 regions of the composite hydrogel spectra likely have a combined contribution from both the C–O–C groups of the cellulose and BC, as well as the Si–O groups present in the BC component. This evidence the establishment of an extensive BC-cellulose network in the hydrogel composites. The presence of all recognizable peaks for cellulose and BC, together with a clear integration of the Si–O and C–O–C peaks in the hydrogel composites (Fig. 6c), further confirms this. This finding was in line with the findings of previous studies, such as cellulose/BC hydrogel,22 carboxymethyl cellulose/graphene oxide composite,86 and chitosan/BC hydrogel.87
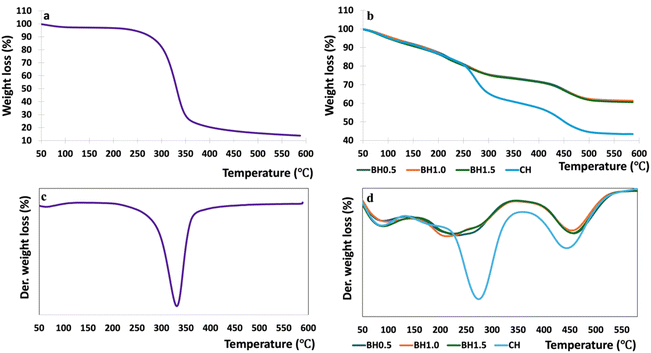 | ||
| Fig. 6 Weight loss (a & b) and derivative weight loss (c & d) thermograms for the cellulose (a & c) and hydrogel composites (b & d) at various biochar content. | ||
3.3. Thermogravimetric analysis
The TGA results for EC are illustrated in Fig. 6a and c, respectively. The thermal characteristics of the extracted cellulose were consistent with previous findings reported in the literature.71,88,89 There was no residual ash in EC, indicated by the 100% weight loss in Fig. 6a. All the prepared hydrogels showed weight loss in the near 100 °C corresponding to the samples typical of hygroscopic cellulose-derived materials (Fig. 6b).85 The second stage of weight loss observed in EC between 200 °C and 300 °C and can be attributed to the loss of labile functional groups on cellulose, leading to CO and CO2 evaporation of volatile components and absorbed water from formation,90 and the presence of low molecular weight acids and amorphous components present in BC and cellulose.913.4. Swelling ratio, water retention and gel fraction of the hydrogel composites
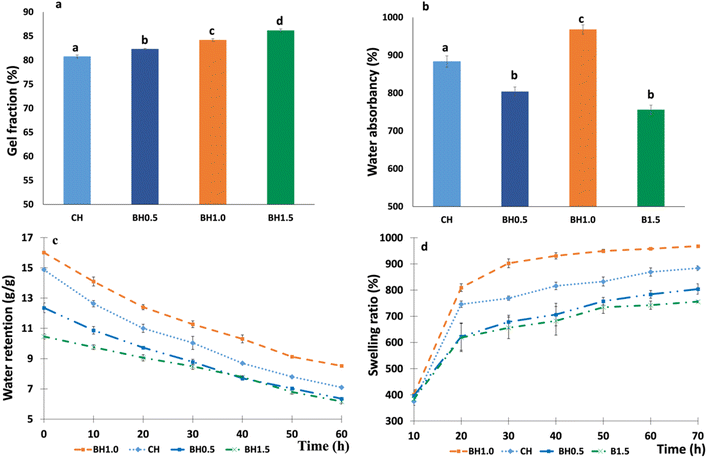
The GF, SR, WA, and WR in DW of prepared hydrogel composites are shown in Fig. 7.The percentage of GF of each hydrogel composite is shown in Fig. 7a. GF is correlated with the degree of crosslinking in the structure of the hydrogel polymer network.92 The gel fraction for the hydrogel composites decreased in the order of BH1.5 > BH1.0 > BH0.5 > CH. This phenomenon is influenced by the concentration of BC. BH1.5 exhibits the lowest WR due to its higher GF compared to the other composites (Fig. 7b), primarily due to its higher BC content, which leads to a higher crosslinking density. Higher crosslinking density within the hydrogel network corresponds directly to a higher percentage of gel content, leading to a rigid hydrogel structure.44,93 Higher crosslinking density in the hydrogel network also lowers water absorption as increased crosslinking restricts the uptake of water molecules by the hydrogel, leading to a decrease in swelling capacity.92,94 Based on the findings reported in the literature by Mondal et al. (2022), a greater GF indicates a superior hydrogel quality.93 A maximum WA of 902.3 ± 14.87% was obtained for BH1.0, whereas CH showed 883.8 ± 12.14%. WA of BH1.0 and CH was significantly greater than the BH0.5 and BH1.5 (Fig. 7b). Interestingly, the percentage of water retained is still as high even after 3 days, which demonstrates the superior WR properties of the prepared hydrogels. WR was maximum for CH and BH1.0 samples. The SR of different hydrogel composites versus time is illustrated in Fig. 7d. As shown in Fig. 7d, when BC increased to 1 g, the SR significantly increased. Further increase of BC amount to 1.5 g made the SR decrease to 755.9 ± 12.5%. Within the first 30 h, the SR of all hydrogel composites increased rapidly. After 30 h, the increasing rate plateaued as shown in Fig. 7d. As results shown in Fig. 7, the variation in the water retention characteristics of the hydrogel composites is due to the diversity in their polarity and hydrophilic functional groups, porosity, and degree of crosslinking.44 A small amount of BC on the hydrogel composite surface might combine with the surface functional group. On the other hand, too much BC in the hydrogel networks may increase the crosslinking density (Fig. 7a) and result in a compacted hydrogel matrix. This may stop the hydrogel from absorbing water, which would limit the network's expansion and stop it from swelling too much.95–97 Nevertheless, the optimum amount of BC within the hydrogel matrix improves the network, simultaneously increasing the presence of hydrophilic groups. This enhancement may further increase the hydrophilic functions of the hydrogel.84 Some previous studies also reported that several kinds of clay would increase the swelling capacity of the inorganic polymer-based hydrogel.98,99
3.5. Biodegradation rate in soils
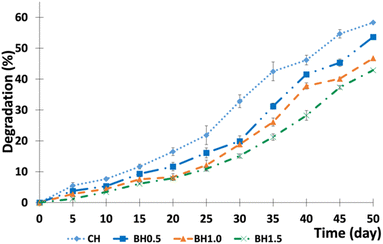
The rate of weight loss (%) at various burying times (days) is presented in Fig. 8.As shown in Fig. 8, the rate of decomposition was initially modest, but increased rapidly over time, indicating the degradability of the hydrogel composites. The degradation rates of CH, BH0.5, BH1.0, and BH1.5 buried in the soil after 50 days were 58.33%, 53.66%, 46.78%, and 42.89%, respectively. The results prove that adding BC inhibits the rate of biodegradation and increases the stability of the hydrogel composites. Besides that, the obtained results also prove that an increase in the burial time augments the biodegradation (%) of the hydrogel. The decomposition of the hydrogel depends on several soil factors that affect the growth of soil-living microorganisms, such as available oxygen, moisture content, pH, temperature, humidity, and mineral nutrient contents of soil.57,100 When the hydrogel composites were buried in soil, they could slowly absorb available water from the soil solutions and swell, which facilitated more interaction and soaking up of more soil microorganisms in the 3-D network of hydrogel composites with soil microorganisms and enzymes, which enhanced the degradation.57,101 According to Wen et al. (2016), the hydrogel composites started to decompose via the hydrolysis of β-(1–4)-bonds in cellulose, which reduced their cross-linking density.102 This allowed the interaction of microorganisms and enzymes that eventually led to the disintegration of the 3-D network. Moreover, microorganisms easily disintegrate cellulose.103 The obtained results in this present work were aligned with previous studies and demonstrated that as-prepared hydrogel composites are degradable and could be applied in agriculture.99,102 However, long-term biodegradation studies are essential to fully understand the degradation mechanism and the ultimate fate of biodegradation products in different environmental settings. Therefore, future research should focus on investigating the long-term environmental impacts in more detail focusing on the degradation mechanism and the final biodegradation product.
Table 3 provides a comparative analysis of the synthesized cellulose-based hydrogel, evaluating its cost-effectiveness, performance metrics, and environmental footprint relative to existing synthetic hydrogel used in similar applications.
| Aspect | Details |
|---|---|
| Cost comparison | Used waste-paper mill sludge as raw material |
| Energy efficient synthesis43 | |
| Potentially reducing production costs104,105 | |
| Performance comparison | The water retention capacity is comparable to that of existing polyacrylamide hydrogels58,105 |
| Degrade more than 40% within 50 days, while polyacrylamide hydrogels degrade less than 20%106 | |
| Environmental impact | Lower carbon footprint107 |
| Reduced energy consumption108 | |
| Sustainable synthesis methods109 | |
| Non-toxic byproducts110 |
4 Conclusion
This study explored a circular and sustainable method for the preparation of entirely biobased hydrogel composites valorized from waste-paper mill sludge (PMS) and biochar derived from forestry residues using energy-efficient microwave and ultrasound techniques. Cellulose fibrils were successfully isolated from the PMS to create crosslinked hydrogels with enhanced physical properties, suitable for use in the acidic and dry podzolic soils of northern Canada's boreal ecosystem. The hydrogels, crosslinked with citric acid and incorporated with powdered biochar (BC) in various ratios, demonstrated excellent water retention properties. FTIR analysis confirmed the presence of characteristic peaks for cellulose and BC, as well as the integration of Si–O and C–O–C peaks, indicating an extensive cellulose-biochar network within the hydrogel composites. Thermogravimetric analysis (TGA) revealed that the addition of BC increased the thermal stability of the composite by 60%. The optimal composition of 1% BC (BH1.0) significantly enhanced the water retention, thermal stability and gel fraction, and exhibited superior biodegradability with a 46.78% degradation after 50 days. These entirely biobased hydrogel composites, utilizing upcycled cellulose from PMS, show promising potential as soil amendments for podzolic agricultural environments.This energy-efficient technique holds significant potential for industrial scalability by optimizing process parameters and scaling up equipment to enhance cellulose extraction while minimizing energy consumption and operational costs. However, while the research outcomes are promising on a laboratory scale, scaling this energy efficient-environmentally sound method to an industrial level has both opportunities and challenges. The potential impacts of industrial expansion include a significant reduction in PMS and a decrease in reliance on synthetic polymers for hydrogel production. Furthermore, the energy-efficient protocols utilized in this study could lead to lower operational costs and reduce carbon emissions, making the process both economically and environmentally viable. Nonetheless, practical viability will depend on various factors, such as the safe handling of raw materials, the adaptability of existing industrial infrastructure, and the overall cost-effectiveness of scaling these techniques. Further research is needed to address these aspects, focusing on pilot studies and cost–benefit analyses that could pave the way for large-scale implementation. In conclusion, the scalability of these methods holds substantial promise for the industrial production of sustainable hydrogels, contributing to broader environmental and economic benefits.
Data availability
The data supporting this article have been included as part of the ESI.†Author contributions
KK: conceptualization, data curation, formal analysis, investigation, methodology, visualization, writing – original draft; SS: methodology, resources, supervision, validation, writing – review & editing; MK: methodology, supervision, validation, writing – review & editing; LG: conceptualization, funding acquisition, methodology, project administration, resources, supervision, validation, writing – review & editing.Conflicts of interest
There are no conflicts to declare.Acknowledgements
The author would like to acknowledge the financial support provided by the Natural Sciences and Engineering Research Council of Canada (NSERC-DG: RGPIN-2019-04614), Industry, Energy and Technology (IET) of the Government of Newfoundland and Labrador (Grant no: 5404-1962-102), and Memorial University of Newfoundland (MUN). We also would like to give special thanks to Corner Brook Pulp & Paper Ltd, for providing us with sludge samples and information on the mill process for this study.References
- S. M. Duncan, M. Alkasrawi, R. Gurram, F. Almomani, A. E. Wiberley-Bradford and E. Singsaas, Energies, 2020, 13, 4662 CrossRef CAS.
- M. Balkaya, Desalin. Water Treat., 2019, 172, 70–77 CrossRef CAS.
- S. Navaee-Ardeh, F. Bertrand and P. R. Stuart, Drying Technol., 2006, 24, 863–878 CrossRef CAS.
- S. Fang, Z. Yu, Y. Lin, S. Hu, Y. Liao and X. Ma, Energy Convers. Manage., 2015, 101, 626–631 CrossRef.
- R. Pöykiö, H. Nurmesniemi, P. Perämäki, T. Kuokkanen and I. Välimäki, Chem. Speciation Bioavailability, 2005, 17, 1–9 CrossRef.
- A. M. Schiopu and M. Gavrilescu, Clean: Soil, Air, Water, 2010, 38, 1101–1110 CAS.
- N. Saha, A. Saba, P. Saha, K. McGaughy, D. Franqui-Villanueva, W. J. Orts, W. M. Hart-Cooper and M. T. Reza, Energies, 2019, 12, 858 CrossRef CAS.
- J. Camberato, B. Gagnon, D. Angers, M. Chantigny and W. Pan, Can. J. Soil Sci., 2006, 86, 641–653 CrossRef.
- M. C. Monte, E. Fuente, A. Blanco and C. Negro, Waste management, 2009, 29, 293–308 CrossRef CAS PubMed.
- M. Pervaiz and M. Sain, Clean: Soil, Air, Water, 2015, 43, 919–926 CAS.
- D. Churchill and A. Kirby, Phase, 2010, 1, 09–14 Search PubMed.
- M. Nadeem, T. H. Pham, A. Nieuwenhuis, W. Ali, M. Zaeem, W. Ashiq, S. S. M. Gillani, C. Manful, O. A. Adigun and L. Galagedara, Plant Sci., 2019, 283, 278–289 CrossRef CAS PubMed.
- B. G. Prates, H. R. Neto, A. V. N. de Carvalho Teixeira and D. de Jesus Silva, O Papel, 2021, 82, 84–89 Search PubMed.
- Y. Nishiyama, J. Sugiyama, H. Chanzy and P. Langan, J. Am. Chem. Soc., 2003, 125, 14300–14306 CrossRef CAS PubMed.
- S. Van de Vyver, J. Geboers, P. A. Jacobs and B. F. Sels, ChemCatChem, 2011, 3, 82–94 CrossRef CAS.
- C. McCarthy, A Tale of Two Clades: Genome Evolution of Oomycetes and Fungi, National University of Ireland, Maynooth (Ireland), 2019 Search PubMed.
- S. Pérez and K. Mazeau, Polysaccharides: Structural diversity and functional versatility, 2005, vol. 2, pp. 41–68 Search PubMed.
- A. H. Tayeb, E. Amini, S. Ghasemi and M. Tajvidi, Molecules, 2018, 23, 2684 CrossRef PubMed.
- M. A. Mohamed, M. Abd Mutalib, Z. A. M. Hir, M. Zain, A. B. Mohamad, L. J. Minggu, N. A. Awang and W. Salleh, Int. J. Biol. Macromol., 2017, 103, 1232–1256 CrossRef CAS PubMed.
- N. Thombare, S. Mishra, M. Siddiqui, U. Jha, D. Singh and G. R. Mahajan, Carbohydr. Polym., 2018, 185, 169–178 CrossRef CAS PubMed.
- C. D. V. Nascimento, R. W. Simmons, J. P. de Andrade Feitosa, C. T. dos Santos Dias and M. C. G. Costa, J. Arid Environ., 2021, 189, 104496 CrossRef.
- Y. Wu, C. Brickler, S. Li and G. Chen, Polym. Test., 2021, 93, 106996 CrossRef CAS.
- A. Kalhapure, R. Kumar, V. P. Singh and D. Pandey, Curr. Sci., 2016, 111, 1773–1779 CrossRef CAS.
- K. Mali, S. Dhawale, R. Dias, N. Dhane and V. Ghorpade, Indian J. Pharm. Sci., 2018, 80, 657–667. CAS.
- K. Kabiri, H. Omidian, M. Zohuriaan-Mehr and S. Doroudiani, Polym. Compos., 2011, 32, 277–289 CrossRef CAS.
- D. Klemm, B. Heublein, H. P. Fink and A. Bohn, Angew. Chem., Int. Ed., 2005, 44, 3358–3393 CrossRef CAS PubMed.
- N. E. B. Ammar, M. Barbouche and A. H. Hamzaoui, in Hydrogels Based on Natural Polymers, Elsevier, 2020, pp. 459–479 Search PubMed.
- S. Kyle, Z. M. Jessop, A. Al-Sabah, K. Hawkins, A. Lewis, T. Maffeis, C. Charbonneau, A. Gazze, L. W. Francis and M. Iakovlev, Carbohydr. Polym., 2018, 198, 270–280 CrossRef CAS PubMed.
- R. Tan, Z. She, M. Wang, Z. Fang, Y. Liu and Q. Feng, Carbohydr. Polym., 2012, 87, 1515–1521 CrossRef CAS.
- S. Mecking, Angew. Chem., Int. Ed., 2004, 43, 1078–1085 CrossRef CAS PubMed.
- J. Schurz, Prog. Polym. Sci., 1999, 24, 481–483 CrossRef CAS.
- Z. Ahmad, S. Salman, S. A. Khan, A. Amin, Z. U. Rahman, Y. O. Al-Ghamdi, K. Akhtar, E. M. Bakhsh and S. B. Khan, Gels, 2022, 8, 167 CrossRef CAS PubMed.
- A. Surowiecka, J. Strużyna, A. Winiarska and T. Korzeniowski, Gels, 2022, 8, 122 CrossRef CAS PubMed.
- E. Naseri and A. Ahmadi, Eur. Polym. J., 2022, 173, 111293 CrossRef CAS.
- Y. Zhang, X. Tian, Q. Zhang, H. Xie, B. Wang and Y. Feng, J. Bioresour. Bioprod., 2022, 7, 116–127 CrossRef CAS.
- D. N. Iqbal, Z. Tariq, B. Philips, A. Sadiqa, M. Ahmad, K. M. Al-Ahmary, I. Ali and M. Ahmed, RSC Adv., 2024, 14, 8652–8664 RSC.
- K. Rasa, J. Heikkinen, M. Hannula, K. Arstila, S. Kulju and J. Hyväluoma, Biomass Bioenergy, 2018, 119, 346–353 CrossRef CAS.
- L. Xiao, L. Feng, G. Yuan and J. Wei, Environ. Geochem. Health, 2020, 42, 1569–1578 CrossRef CAS PubMed.
- S.-C. Shi and G.-T. Liu, Cellulose, 2021, 28, 6147–6158 CrossRef CAS PubMed.
- S. Magalhães, C. Fernandes, J. F. Pedrosa, L. Alves, B. Medronho, P. J. Ferreira and M. d. G. Rasteiro, Polymers, 2023, 15, 3138 CrossRef PubMed.
- R. S. Abolore, S. Jaiswal and A. K. Jaiswal, Carbohydr. Polym. Technol. Appl., 2023, 7, 100396 Search PubMed.
- H. Chen, Q. Han, K. Daniel, R. Venditti and H. Jameel, Appl. Biochem. Biotechnol., 2014, 174, 2096–2113 CrossRef CAS PubMed.
- Z. Z. Chowdhury and S. B. Abd Hamid, BioResources, 2016, 11, 3397–3415 CAS.
- G. Kadry and H. A. El-Gawad, Int. J. Biol. Macromol., 2023, 253, 127058 CrossRef CAS PubMed.
- B. Swensson, S. Lages, B. Berke, A. Larsson and M. Hasani, Carbohydr. Polym., 2021, 274, 118634 CrossRef CAS PubMed.
- J. Zhou, C. Chang, R. Zhang and L. Zhang, Macromol. Biosci., 2007, 7, 804–809 CrossRef CAS PubMed.
- K. Chowdary and D. U. Chandra, Int. J. Chem. Sci., 2009, 7, 2239–2245 CAS.
- M. M. Golor, D. Rosma, S. P. Santoso, F. E. Soetaredjo, M. Yuliana, S. Ismadji and A. Ayucitra, Indones. J. Chem., 2020, 3, 59–67 CrossRef.
- E. Motamedi, B. Motesharezedeh, A. Shirinfekr and S. M. Samar, J. Environ. Chem. Eng., 2020, 8, 103583 CrossRef CAS.
- Z. Jiang, Y. Fang, J. Xiang, Y. Ma, A. Lu, H. Kang, Y. Huang, H. Guo, R. Liu and L. Zhang, J. Phys. Chem. B, 2014, 118, 10250–10257 CrossRef CAS PubMed.
- L. S. Sobhanadhas, L. Kesavan and P. Fardim, Langmuir, 2018, 34, 9857–9878 CrossRef CAS PubMed.
- B. Xiong, P. Zhao, K. Hu, L. Zhang and G. Cheng, Cellulose, 2014, 21, 1183–1192 CrossRef CAS.
- L. Ekebafe, J. Idiaghe and M. Ekebafe, Casp. J. Appl. Sci. Res., 2013, 2, 67–75 Search PubMed.
- L. E. Wise, Chlorite Holocellulose, its Fractionation and Bearing on Summative Wood Analysis and on Studies on the Hemicelluloses, Vance, 1946 Search PubMed.
- TAPPI T-Om-93, Alpha, Beta and Gamma Cellulose of Wood and Pulp, Atlanta Georgia, USA, 1992 Search PubMed.
- A. Moubasher, S. Abdel-Hafez, H. Abdel-Fattah and A. Moharram, Mycopathologia, 1982, 78, 169–176 CrossRef.
- S. G. Warkar and A. Kumar, Polymer, 2019, 182, 121823 CrossRef.
- C. Chang, B. Duan, J. Cai and L. Zhang, Eur. Polym. J., 2010, 46, 92–100 CrossRef CAS.
- O. León, D. Soto, A. Antúnez, R. Fernández, J. González, C. Piña, A. Muñoz-Bonilla and M. Fernandez-García, Int. J. Biol. Macromol., 2019, 136, 813–822 CrossRef PubMed.
- S. Durpekova, A. Di Martino, M. Dusankova, P. Drohsler and V. Sedlarik, Polymers, 2021, 13, 3274 CrossRef CAS PubMed.
- R. Abdullah, C. F. Ishak, W. R. Kadir and R. A. Bakar, Int. J. Environ. Res. Public Health, 2015, 12, 9314–9329 CrossRef CAS PubMed.
- L. M. Bester, Development and Optimization of a Process for Cellulose Nanoparticle Production from Wastepaper Sludge with Enzymatic Hydrolysis as an Integral Part, Stellenbosch University, Stellenbosch, 2018 Search PubMed.
- V. Strezov and T. J. Evans, Waste Manage., 2009, 29, 1644–1648 CrossRef CAS PubMed.
- T. B. Jele, B. Sithole, P. Lekha and J. Andrew, Cellulose, 2022, 29, 4629–4643 CrossRef.
- J. d. A. Clark, Pulp Technology and Treatment for Paper, San Francisco: M. Freeman Publications, 1985 Search PubMed.
- C. J. Beauchamp, M.-H. Charest and A. Gosselin, Chemosphere, 2002, 46, 887–895 CrossRef CAS PubMed.
- P. Bekhta, J. Sedliačik, F. Kačík, G. Noshchenko and A. Kleinová, Eur. J. Wood Wood Prod., 2019, 77, 495–508 CrossRef CAS.
- A. Elloumi, M. Makhlouf, A. Elleuchi and C. Bradai, Polym. Compos., 2018, 39, 616–623 CrossRef CAS.
- A. Méndez, S. Barriga, J. Fidalgo and G. Gascó, J. Hazard. Mater., 2009, 165, 736–743 CrossRef PubMed.
- T. T. N. Ngo, T. H. Phan, T. M. T. Le, T. N. T. Le, Q. Huynh, T. P. T. Phan, M. Hoang, T. P. Vo and D. Q. Nguyen, Heliyon, 2023, 9, e17663 CrossRef PubMed.
- C. Adu, L. Berglund, K. Oksman, S. J. Eichhorn, M. Jolly and C. Zhu, J. Cleaner Prod., 2018, 197, 765–771 CrossRef CAS.
- H. Du, M. Parit, M. Wu, X. Che, Y. Wang, M. Zhang, R. Wang, X. Zhang, Z. Jiang and B. Li, J. Hazard. Mater., 2020, 400, 123106 CrossRef CAS PubMed.
- A. L. Leão, B. M. Cherian, S. F. de Souza, M. Sain, S. Narine, M. S. Caldeira and M. A. S. Toledo, Mol. Cryst. Liq. Cryst., 2012, 556, 254–263 CrossRef.
- B. Xiao, X. Sun and R. Sun, Polym. Degrad. Stab., 2001, 74, 307–319 CrossRef CAS.
- M. M. Caruso, D. A. Davis, Q. Shen, S. A. Odom, N. R. Sottos, S. R. White and J. S. Moore, Chem. Rev., 2009, 109, 5755–5798 CrossRef CAS PubMed.
- W. H. Danial, R. M. Taib, M. A. A. Samah, R. M. Salim and Z. A. Majid, RSC Adv., 2020, 10, 42400–42407 RSC.
- C. J. Chirayil, L. Mathew and S. Thomas, Rev. Adv. Mater. Sci., 2014, 37, 20–28 CAS.
- N. Wang, E. Ding and R. Cheng, Polymer, 2007, 48, 3486–3493 CrossRef CAS.
- A. Alemdar and M. Sain, Bioresour. Technol., 2008, 99, 1664–1671 CrossRef CAS PubMed.
- W. Chen, H. Yu, Y. Liu, Y. Hai, M. Zhang and P. Chen, Cellulose, 2011, 18, 433–442 CrossRef CAS.
- J. Sun, F. Xu, X. Sun, B. Xiao and R. Sun, Polym. Degrad. Stab., 2005, 88, 521–531 CrossRef CAS.
- L. L. Lai LongWee and A. I. Ani Idris, BioResources, 2013, 8, 2792–2804 Search PubMed.
- A. G. Adeniyi, J. O. Ighalo and D. V. Onifade, Chem. Afr., 2020, 3, 439–448 CrossRef CAS.
- Z. F. Akl, E. G. Zaki and S. M. ElSaeed, ACS Omega, 2021, 6, 34193–34205 CrossRef CAS PubMed.
- S. Li and G. Chen, Waste Manage., 2018, 78, 198–207 CrossRef CAS PubMed.
- K. Varaprasad, T. Jayaramudu and E. R. Sadiku, Carbohydr. Polym., 2017, 164, 186–194 CrossRef CAS PubMed.
- S. Tang, J. Yang, L. Lin, K. Peng, Y. Chen, S. Jin and W. Yao, Chem. Eng. J., 2020, 393, 124728 CrossRef CAS.
- H. Kargarzadeh, I. Ahmad, I. Abdullah, A. Dufresne, S. Y. Zainudin and R. M. Sheltami, Cellulose, 2012, 19, 855–866 CrossRef CAS.
- F. B. De Oliveira, J. Bras, M. T. B. Pimenta, A. A. da Silva Curvelo and M. N. Belgacem, Ind. Crops Prod., 2016, 93, 48–57 CrossRef.
- C. Zhou and Q. Wu, Nanocrystals-synthesis, Characterization and Applications, 2012, pp. 103–120 Search PubMed.
- H. Dai and H. Huang, Cellulose, 2017, 24, 69–84 CrossRef CAS.
- M. Kurniati, I. Nuraini and C. Winarti, 2021.
- M. I. H. Mondal, M. O. Haque, F. Ahmed, M. N. Pervez, V. Naddeo and M. B. Ahmed, Gels, 2022, 8, 177 CrossRef CAS PubMed.
- I. K. Abdel Maksoud, G. Bassioni, N. Nady, S. A. Younis, M. M. Ghobashy and M. Abdel-Mottaleb, Sci. Rep., 2023, 13, 21879 CrossRef CAS PubMed.
- Y. Bao, J. Ma and N. Li, Carbohydr. Polym., 2011, 84, 76–82 CrossRef CAS.
- K. Haraguchi, J. Ning and G. Li, Eur. Polym. J., 2015, 68, 630–640 CrossRef CAS.
- S. K. Patra, R. Poddar, M. Brestic, P. U. Acharjee, P. Bhattacharya, S. Sengupta, P. Pal, N. Bam, B. Biswas and V. Barek, Int. J. Polym. Sci., 2022, 2022 Search PubMed.
- J. Gao, Q. Yang, F. Ran, G. Ma and Z. Lei, Appl. Clay Sci., 2016, 132, 739–747 CrossRef.
- Z. K. Wang, T. T. Li, H. K. Peng, H. T. Ren, J. H. Lin and C. W. Lou, Water Environ. Res., 2022, 94, e10698 CrossRef CAS PubMed.
- H. Mittal, A. Maity and S. S. Ray, Int. J. Biol. Macromol., 2015, 79, 8–20 CrossRef CAS PubMed.
- S. Lu, C. Feng, C. Gao, X. Wang, X. Xu, X. Bai, N. Gao and M. Liu, J. Agric. Food Chem., 2016, 64, 4965–4974 CrossRef CAS PubMed.
- P. Wen, Z. Wu, Y. He, B.-C. Ye, Y. Han, J. Wang and X. Guan, ACS Sustain. Chem. Eng., 2016, 4, 6572–6579 CrossRef CAS.
- S. Jin, Y. Wang, J. He, Y. Yang, X. Yu and G. Yue, J. Appl. Polym. Sci., 2013, 128, 407–415 CrossRef CAS.
- J. Zhu, Z. Zhang, Y. Wen, X. Song, W. K. Tan, C. N. Ong and J. Li, J. Agric. Food Chem., 2024 DOI:10.1021/acs.jafc.4c04970.
- S. Li and G. Chen, J. Cleaner Prod., 2020, 251, 119669 CrossRef CAS.
- T. A. Adjuik, S. E. Nokes and M. D. Montross, J. Appl. Polym. Sci., 2023, 140, e53655 CrossRef CAS.
- A. Samir, F. H. Ashour, A. A. Hakim and M. Bassyouni, npj Mater. Degrad., 2022, 6, 68 CrossRef CAS.
- Q. Liu, W.-Q. He, M. Aguedo, X. Xia, W.-B. Bai, Y.-Y. Dong, J.-Q. Song, A. Richel and D. Goffin, Carbohydr. Polym., 2021, 253, 117170 CrossRef CAS PubMed.
- I. Dudeja, R. K. Mankoo, A. Singh and J. Kaur, Sustainable Chem. Pharm., 2023, 36, 101307 CrossRef CAS.
- G. Dell'Ambrogio, J. Wong and B. Ferrari, Ecotoxicological Effects of Polyacrylate, Acrylic Acid, Polyacrylamide and Acrylamide on Soil and Water Organisms, Swiss Centre for Applied Ecotoxicology, Lausanne, 2019 Search PubMed.
Footnote |
| † Electronic supplementary information (ESI) available. See DOI: https://doi.org/10.1039/d4su00332b |
| This journal is © The Royal Society of Chemistry 2024 |

