 Open Access Article
The effect of catalyst precursors on the mechanism of iron-catalysed graphitization of cellulose†
Emily C.
Hayward
 *a,
Glen J.
Smales
b,
Brian R.
Pauw
b,
Masaki
Takeguchi
 c,
Alexander
Kulak
d,
Robert D.
Hunter
e and
Zoe
Schnepp
 a
a
aSchool of Chemistry, University of Birmingham, B15 2TT, UK. E-mail: ech620@bham.ac.uk
bBundesanstalt für Materialforschung und -prüfung (BAM), Unter den Eichen 87, Berlin 12205, Germany
cCenter for Basic Research on Materials, National Institute for Materials Science, 1-2-1 Sengen, Tsukuba, Ibaraki 305-0047, Japan
dSchool of Chemistry, University of Leeds, Leeds, LS2 9JT, UK
eDepartment of Chemical Engineering, Imperial College London, London SW7 2AZ, UK
First published on 14th October 2024
Abstract
Iron-catalysed graphitization of biomass is a simple and sustainable route to carbons with high graphitic content. It uses abundant precursors and moderate processing temperatures and generates carbons with high porosity. Recently, it has been demonstrated that the choice of biomass precursor can have a significant impact on the textural and compositional properties of the resulting carbon. In this paper, we demonstrate that the choice of catalyst is also critical to the carbon structure. Aqueous iron(III) nitrate and iron(III) chloride convert cellulose to carbons with very different textural properties. This is due to the choice of iron catalyst changing the mechanism of cellulose decomposition and also the nature of the active graphitization catalyst.
Sustainability spotlightClean energy depends on many technologies that use carbons. This includes electrode materials for lithium and sodium batteries and electrocatalyst supports. An exciting route to carbons with high graphitic content is iron-catalysed graphitization, which uses simple iron salts to convert biomass to carbon at moderate temperatures. Numerous authors have employed iron and biomass to generate carbons, but the wide range of precursors and conditions hinders understanding of how to tune the properties of the carbons. This paper presents a comparative study of how different iron salts can have a dramatic effect on the textural properties of carbonized cellulose. Such understanding is essential for investigation and scale-up of iron-catalysed graphitization as a technology. |
Introduction
Carbon materials have a broad range of applications including lithium and sodium ion batteries,1,2 adsorbents for water remediation3 and supercapacitors.4 Many of these applications require a balance of properties including porosity, surface area, conductivity and the presence of graphitic or graphene-like features. Biomass is a particularly attractive precursor to carbon materials, due to the diversity of sources and potential valorisation of agricultural and forestry waste streams.5 Many different types of biomass have been investigated for carbon production, including raw lignocellulosic biomass6,7 and biomass extracts such as cellulose8 or glucose.9 These can be converted to carbons via pyrolysis,10 catalytic graphitization11 or hydrothermal carbonization.12 One of the most important factors for widespread application of carbons from biomass is the ability to reliably tune the structure and properties. While the effects of processing parameters on pyrolysis13,14 and hydrothermal carbonization15 have been studied in detail, catalytic graphitization has received a lot less attention.Catalytic graphitization is the use of metal catalysts to produce graphitic carbons at moderate temperatures. Biomass is combined with a metal-containing compound and heated in an inert atmosphere to temperatures above 700 °C. Metal nanoparticles are generated in situ and catalyse the conversion of biomass-derived amorphous carbon to graphitic nanostructures such as nanotubes.7 The impact of biomass type on the structure and properties of carbons produced by catalytic graphitization is now quite well understood.3,16,17 However, the influence of different graphitization catalysts has received a lot less attention. Across the literature, the numerous examples of catalytic graphitization use a wide range of catalyst precursors, including chloride, nitrate, citrate and acetate salts of iron, cobalt, and nickel, or metal/metal oxide nanoparticles. This makes it very difficult to make general conclusions about how different precursors impact the properties of the resulting carbon.
In this paper, we investigate of the effect of different iron salt catalysts on the mechanism of graphitization of cellulose. Cellulose is one of the most promising biomass precursors for graphitization, as it is the most abundant biopolymer on the planet, with 1.5 × 10¹² tons produced in nature each year.18 It can be extracted readily and on a very large scale from wood and agricultural waste, making it ideal as a sustainable precursor for materials and as a subject for this study. Previous reports on graphitization of cellulose have used nickel, cobalt and iron salts and shown that it is possible to generate carbons with graphitic nanostructures such as hollow graphitic shells,19 ribbon-like morphologies20,21 or multi-walled graphitic carbon nanotubes.19 It is also apparent that different iron salts can impact carbon structure. For example, cellulose spheres treated with iron nitrate produced carbons with a mixture of micro- and mesoporosity, whereas iron chloride produced highly microporous carbons.20 The authors suggested that the higher Lewis acidity of iron chloride was responsible for the different structures but the mechanism of cellulose decomposition with different iron salts was not studied. In this paper, we demonstrate that different iron salts change the structure and properties of cellulose-derived carbons by changing the cellulose decomposition mechanism and the size distribution of the graphitization catalyst. This detailed mechanistic and processing insight is critical if cellulose graphitization is to provide a real option for sustainable carbons.
Results and discussion
Characteristics of graphitic carbon
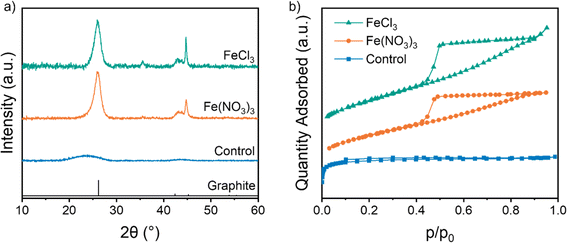
Carbons were produced by combining microcrystalline cellulose (MCC) with aqueous Fe(NO3)3 or FeCl3 and heating to 800 °C under nitrogen for 1 h. Powder X-ray diffraction (p-XRD) patterns show a sharp peak at 26.1° for both samples, characteristic of the interplanar spacing of graphitic carbon (Fig. 1a). This synthesis is highly reproducible, with separate samples producing very similar p-XRD patterns when heated under the same conditions (Fig. S1†).16,17 In contrast, a control sample of cellulose with no catalyst shows only two very broad peaks at 23.5° and 43.6°, indicative of amorphous carbon with some local stacking but no long-range order. Nitrogen porosimetry data of the two iron-catalysed cellulose samples show type IV isotherms indicating a porous structure consisting of both mesopores and micropores (Fig. 1b). In contrast, the control sample shows a type I isotherm, indicating a microporous structure. More detailed information on the surface area and pore volume is provided in Table 1.22 The presence of mesopores is consistent with the formation of graphitic structures such as shells23 and nanotubes,7 which have been observed in previous reports of iron-catalysed graphitization. These shells and nanotubes are formed by catalyst nanoparticles dissolving amorphous carbon and reprecipitating hollow graphitic nanostructures. The nanotube diameter is dependent on the size of the nanoparticle catalyst and nanoparticles within the 10–50 nm size range thus produce mesoporous carbons. Interestingly, the carbon produced from cellulose and FeCl3 contains macropores, as indicated by the continuing adsorption at p/p0 = 1 in the isotherm. This suggests that the catalyst particles are larger in the sample synthesized with FeCl3 than the one synthesized with Fe(NO3)3. The BET surface area is lower for both graphitized samples, presumably as the microporous amorphous carbon is converted to mesoporous graphitic nanostructures.| Iron salt | Specific surface area (m2 g−1) | Total pore volume (cm3 g−1) | Micropore volume (cm2 g−1) | % Micropores |
|---|---|---|---|---|
| None | 470 | 0.19 | 0.16 | 86 |
| Fe(NO3)3 | 360 | 0.24 | 0.077 | 32 |
| FeCl3 | 370 | 0.30 | 0.086 | 34 |
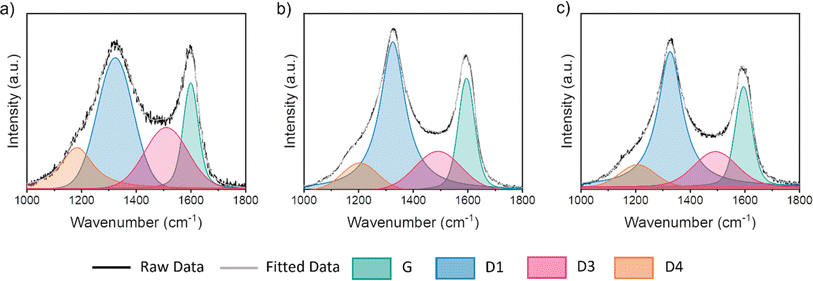
Raman microscopy was used to further investigate the nature of the graphitic carbon in each sample. Fig. 2 shows two prominent peaks at 1325 cm−1 and 1600 cm−1, corresponding to the D and G peaks respectively. In perfect graphite, only the G peak is allowed (at ∼1581 cm−1) and the D peak is forbidden. Therefore, the presence of the D peak and the deviation of the G peak from the position of perfect graphite indicates that all three cellulose-derived carbons exhibit disorder. To extract peak position and full width half maximum (FWHM) values, a 4 peak Voigt function was used, where peaks are attributed to the G, D1, D3 and D4 bands. The information acquired from this method is detailed in Table 2. The position of the G peak is confirmed to be shifted to higher wavenumber for all three samples, which is consistent with nanocrystalline domains. The ratio of the intensity of the D peak to the G peak (ID/IG) is commonly used to provide information on the level of graphitization. However, in this case, there is little difference between values of any of the carbon structures, likely owing to its sensitivity to other factors, such as surface defects. However, the ratio of intensity for the D3 peak compared to that of the G peak (ID3/IG) has been shown as a good indicator for the ratio of amorphous to graphitic carbon.24 Considering these ratios, it is clear that iron catalysts significantly increase graphitic content, but there is little difference between the two iron salts. Given the small differences between the Raman data for the two iron-containing samples, we elected not to analyse the different peak ratios any further.
| Iron salt | G peak position (cm−1) | G peak FWHM (cm−1) | I D/IG | I D3/IG |
|---|---|---|---|---|
| None | 1599 ± 1 | 66.6 ± 3 | 2.55 | 1.03 |
| Fe(NO3)3 | 1595 ± 1 | 72.2 ± 2 | 2.50 | 0.43 |
| FeCl3 | 1595 ± 1 | 72.6 ± 1 | 2.60 | 0.40 |
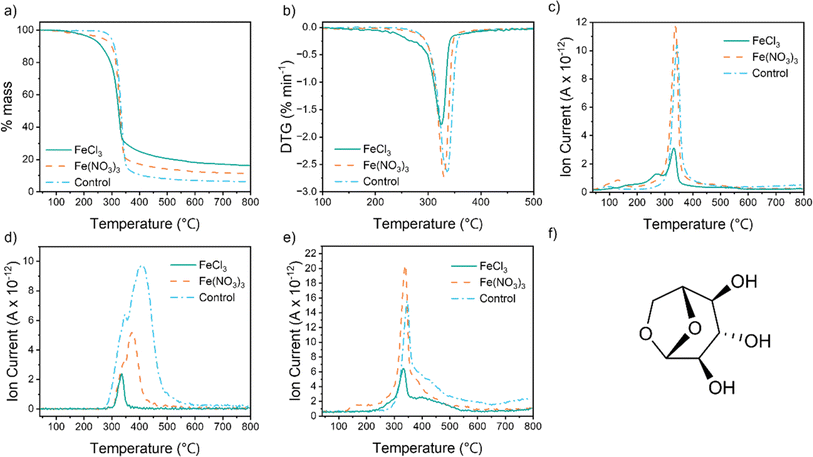
To investigate the reason for the different textural properties of carbons produced from different iron salts, we used thermogravimetric analysis coupled with mass spectrometry (TGA-MS) to probe the reaction mechanism. For all samples, the TGA data (Fig. 3a) show a single large mass loss between 300 °C and 400 °C, corresponding to thermal decomposition of the cellulose polymer. The onset of mass loss and peak mass loss is at a lower temperature for both the iron-containing samples. The differential thermogravimetric (DTG) data for the FeCl3-containing sample (Fig. 3b) also shows a shoulder at 230–280 °C. This correlates to a peak for m/z = 18 in the MS data (Fig. 3c), indicating loss of water. Cellulose pyrolysis involves multiple chemical reactions, including dehydration, depolymerization and ring opening.25 Char formation can occur via direct carbonization of the cellulose or by secondary polymerization of volatile decomposition products.26 Catalysts such as metal salts are known to influence cellulose decomposition and the DTG data suggest that FeCl3 promotes dehydration reactions at a lower temperature than Fe(NO3)3.27 This is consistent with the ability of FeCl3 to act as a Lewis acid and suppress the formation of levoglucosan (Fig. 3f) by promoting dehydration in cellulose, in addition to depolymerisation of the biopolymer.28–31 Further evidence for this comes from MS data for m/z = 60, the most prominent fragment for levoglucosan (Fig. 3d). Both iron salts drive formation of levoglucosan at lower temperatures than pure cellulose and in smaller amounts, but the peak for the cellulose–FeCl3 system is particularly small. The release of CO and CO2 are more challenging to track as CO is masked by the N2 atmosphere of the experiment (m/z = 28) and CO2 is overlaid by N2O (m/z = 44). The sharp peak for m/z = 44 for the cellulose–Fe(NO3)3 sample (Fig. 3e) is likely to be a mixture of N2O and CO2 as the highly oxidizing nitrate reacts with the cellulose. CO2 release from the FeCl3–cellulose system starts earlier than for the cellulose control and the peak is smaller. This provides further evidence that the FeCl3 is changing the decomposition reactions significantly. Regardless of the gases released, the yield of the carbon produced using FeCl3 (16%) is higher than that produced using Fe(NO3)3 (11%). Identical Fe:cellulose molar ratios were used so this indicates that the FeCl3 is promoting cellulose decomposition pathways that lower the amount of carbon lost as CO/CO2 and other volatiles like levoglucosan. This in turn will affect the evolution of pores in the carbon.
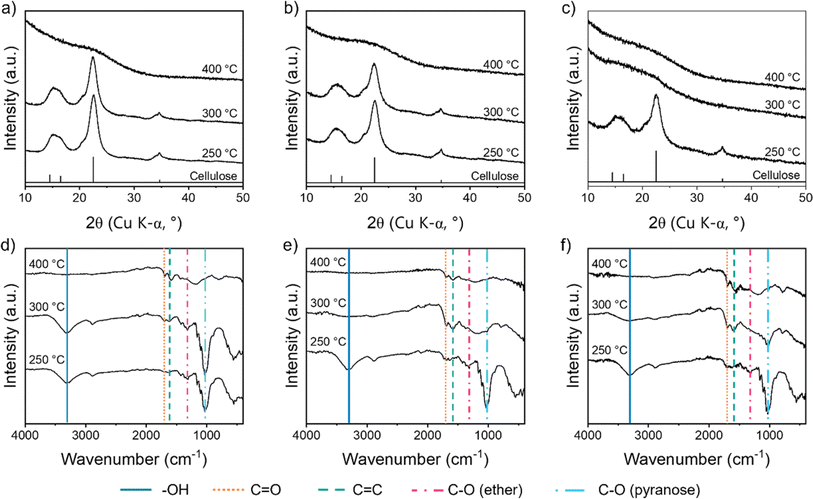
Further evidence for the early dehydration of cellulose in the presence of FeCl3 comes from p-XRD data. For raw cellulose and cellulose with Fe(NO3)3, the characteristic peaks for the cellulose structure (Fig. S2a†) can be seen clearly even after heating to 300 °C (Fig. 4a and b), whereas the peaks disappear between 250 °C and 300 °C for cellulose with FeCl3 (Fig. 4c). The crystal structure of cellulose involves a lot of intra and intermolecular hydrogen bonds, which are broken during dehydration.32 Therefore the loss of peaks below 300 °C for the cellulose–FeCl3 system is consistent with early onset of dehydration catalysed by the FeCl3. It should be noted that no crystalline iron phases are observable in the p-XRD data up to 400 °C. Investigations of related systems have shown that very small amorphous iron–oxygen clusters or iron oxide nanoparticles evolve during heating of biomass with iron salts so it is possible that similar structures exist alongside the decomposing cellulose but can't be detected by p-XRD.33
Fourier transform infrared spectroscopy (FTIR) offers more insight into the molecular transformations involved in the decomposition of cellulose in the three systems. The FTIR spectrum for the control (no iron) sample up to 300 °C (Fig. 4d) shows peaks corresponding to –OH, C–O (ether) and C–O (pyranose), which are all present in the cellulose structure (Fig. S2b†). Most of the peaks disappear by 400 °C, in line with the major mass loss observed at 300–400 °C in the TGA and the loss of peaks in the p-XRD patterns. In their place, small peaks for C![[double bond, length as m-dash]](https://www.rsc.org/images/entities/char_e001.gif) C and C
C and C![[double bond, length as m-dash]](https://www.rsc.org/images/entities/char_e001.gif) O emerge, consistent with the formation of decomposition products like levoglucosenone. For both the iron-containing samples (Fig. 4e and f), there is a significant loss of functionality below 300 °C, as indicated by a decrease in FTIR peak intensity between 250 °C and 300 °C. The OH peak is not present at 300 °C, consistent with dehydration processes. The C–O ether peak also disappears by 300 °C, which suggests a significant amount of depolymerization in both iron-containing systems. Interestingly, for the cellulose–Fe(NO3)3 system, the C–O pyranose peak disappears completely by 300 °C, suggesting ring opening is one of the decomposition pathways. Iron oxides have been shown to catalyse ring-opening during cellulose decomposition as well as participate in depolymerization and dehydration.34,35 This could indicate that small iron oxide clusters are formed during pyrolysis of cellulose–Fe(NO3)3, as has been observed in other biomass–Fe(NO3)3 systems.33 For both iron-containing systems, C
O emerge, consistent with the formation of decomposition products like levoglucosenone. For both the iron-containing samples (Fig. 4e and f), there is a significant loss of functionality below 300 °C, as indicated by a decrease in FTIR peak intensity between 250 °C and 300 °C. The OH peak is not present at 300 °C, consistent with dehydration processes. The C–O ether peak also disappears by 300 °C, which suggests a significant amount of depolymerization in both iron-containing systems. Interestingly, for the cellulose–Fe(NO3)3 system, the C–O pyranose peak disappears completely by 300 °C, suggesting ring opening is one of the decomposition pathways. Iron oxides have been shown to catalyse ring-opening during cellulose decomposition as well as participate in depolymerization and dehydration.34,35 This could indicate that small iron oxide clusters are formed during pyrolysis of cellulose–Fe(NO3)3, as has been observed in other biomass–Fe(NO3)3 systems.33 For both iron-containing systems, C![[double bond, length as m-dash]](https://www.rsc.org/images/entities/char_e001.gif) C and C
C and C![[double bond, length as m-dash]](https://www.rsc.org/images/entities/char_e001.gif) O peaks are observed from 300 °C, again showing how the iron promotes carbonization in these systems.
O peaks are observed from 300 °C, again showing how the iron promotes carbonization in these systems.
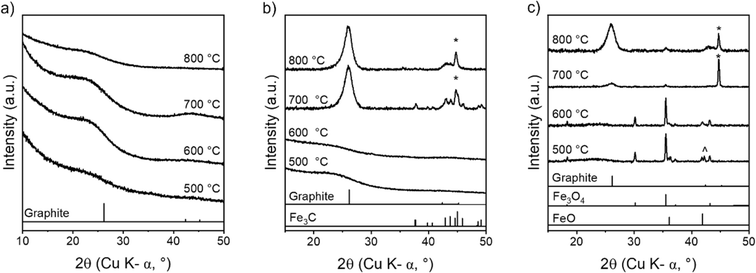
The later stages of cellulose carbonization were investigated using ex situ p-XRD. Fig. 5a shows that carbonization of pure cellulose does not produce any crystalline graphitic carbon, as expected. In contrast, the carbonization of cellulose–Fe(NO3)3 produces a characteristic peak for graphitic carbon at 26.1° (Fig. 5b). This occurs alongside peaks for Fe3C and α-Fe, which is consistent with the formation of Fe/Fe3C catalyst nanoparticles. At 600 °C and 500 °C, there are no peaks in the p-XRD patterns for the cellulose–Fe(NO3)3 system, suggesting that iron is present as very small nanoparticles or only as amorphous clusters. In contrast, the pyrolysis of cellulose with FeCl3 produces sharp peaks for iron oxide (primarily Fe3O4) from 500 °C (Fig. 5c). The lack of significant peak broadening indicates the iron oxide particles are relatively large. From 700 °C, the iron oxide peaks have been replaced by sharp peaks for α-Fe with a very small presence of graphitic carbon and by 800 °C the graphitic carbon peak is fully developed with some α-Fe replaced by Fe3C. The ex situ nature of the experiments means that we cannot make conclusions as to the identity of the catalyst in the two systems. However, the data strongly suggests two different routes to reaching the active graphitization catalysts with much larger crystalline species formed in the FeCl3 system. This would be consistent with the observation of macropores in the cellulose–FeCl3-derived carbon.
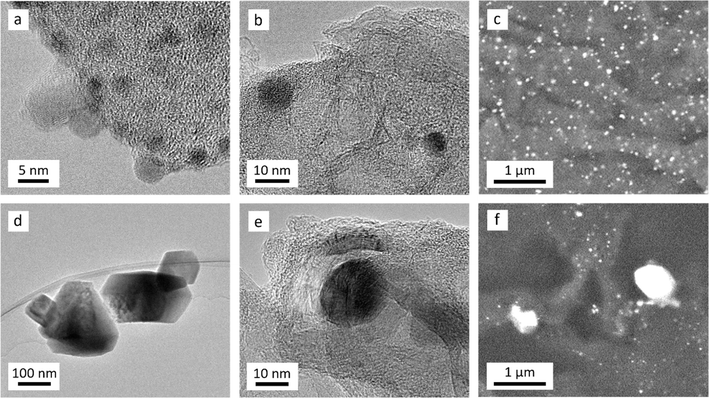
Transmission electron microscopy (TEM) was used to further probe the evolution of catalyst particles in the two cellulose–Fe systems. After heating to 600 °C (Fig. 6a), the cellulose–Fe(NO3)3 sample shows very small (<5 nm in diameter) dark spots of more electron-dense material, indicating iron-rich nanoparticles. No evidence of lattice fringes could be seen, which could indicate that the nanoparticles are amorphous. This is consistent with the lack of peaks in the p-XRD data. The nanoparticles are larger and more clearly defined with increasing temperature (Fig. 6b), consistent with the appearance of Fe3C/Fe peaks in the p-XRD data. From 700 °C, stacked layers of graphitic carbon can be seen, characteristic of hollow shells and nanotubes formed by catalytic graphitization. Scanning electron microscopy (SEM) with backscattered electron detector shows the Fe3C/Fe nanoparticles are small and evenly distributed across the carbon (Fig. 6c, full image included in Fig. S3†). In contrast, the cellulose–FeCl3 sample showed large (>100 nm in diameter), faceted particles after heating to 600 °C, many of which had become detached from the underlying carbon when dispersed on the TEM grid (Fig. 6d). This is consistent with the sharp peaks for Fe3O4 in the p-XRD. We propose that the large particles are a result of halide vapour hydrolysis, where volatile FeCl3·6H2O vaporises and reacts with water evolved during heating. The result is the deposition of large magnetite (Fe3O4) particles.36 In contrast, Fe(NO3)3 decomposes during heating and so remains spread homogeneously throughout the sample.37 After heating to 700 °C (Fig. 6e), the FeCl3–cellulose sample appears to be similar to the Fe(NO3)3–cellulose system, with dark iron-rich particles within layers of graphitic carbon nanostructures. However, the SEM shows that the particles are much more variable in size, with some particles hundreds of nm in diameter (Fig. 6f, full image included in Fig. S4†). This is consistent with porosimetry data, which indicated a mixture of meso- and macroporosity in the carbon produced using FeCl3.
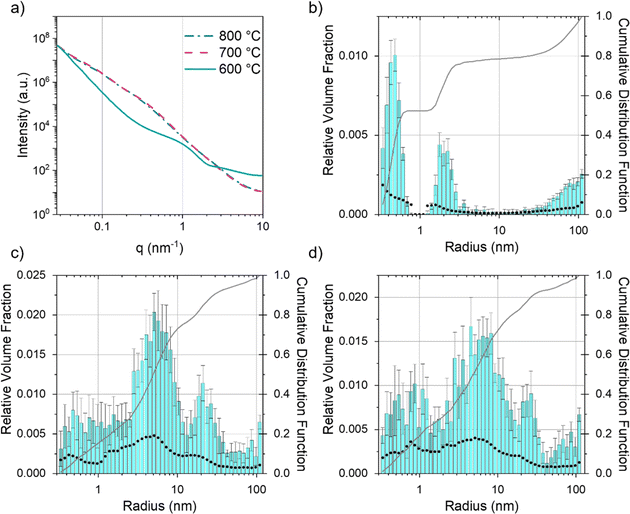
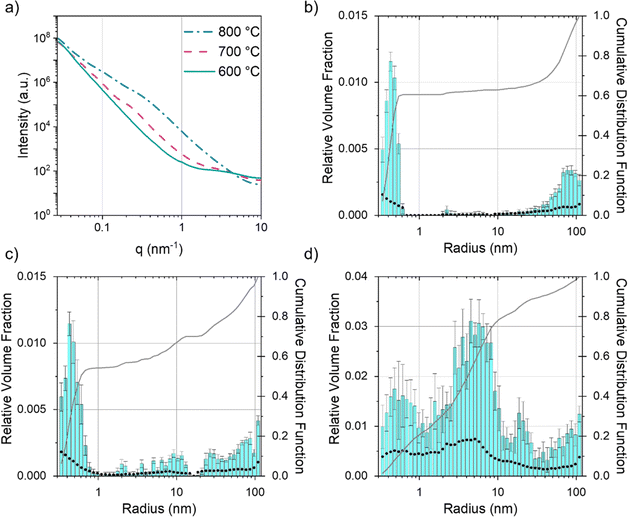
Given that SEM and TEM are microscopic techniques, small angle X-ray scattering (SAXS) was performed on bulk amounts of sample to provide averaged structural information. For carbons prepared from cellulose and Fe(NO3)3 there is a clear increase in scattering between 600 °C and 700 °C (Fig. 7a). At 600 °C, the broad peak in the scattering data around q = 1 nm−1 corresponds to scattering features around 5 nm in diameter, consistent with the small particles/clusters observed in TEM images. The data in q range 0.027 ≤ q (nm−1) ≥ 9.87 were fitted and analysed using McSAS, a Monte Carlo method to extract form-free size distributions (full details in ESI,† including full range of collected in Fig. S5† and data with fit lines in Fig. S6†).38 The size histogram for the scattering structures present in the Fe(NO3)3–cellulose system at 600 °C (Fig. 7b) shows three main features. The peak at very low radius (<1 nm) can be assigned to micropores and surface roughness (caused by scattering from the carbon–air interface). The central peak (between 2–3 nm) is ascribed to the developing iron particles and the features at large radius (>20 nm) are likely caused by larger pores from the original cellulose structure. At 700 °C and 800 °C (Fig. 7c and d), the main contribution to the scattering comes from features in the 3–40 nm size range, consistent with both the catalyst nanoparticles and the mesopores in the graphitic nanostructures. The FeCl3–cellulose system shows a similar increase in scattering from 600 °C to 800 °C (Fig. 8a). However, the broad peak centred around q = 1 nm−1 is not present at 600 °C and there is a corresponding lack of features in the 3–40 nm size range in the histogram (Fig. 8b). This is consistent with TEM, which only showed large, faceted crystals, unlike the small nanoparticles/clusters seen in the Fe(NO3)3–cellulose system. The large crystals would be well outside of the size range probed by SAXS. At 700 °C, the histogram (Fig. 8c) indicates the emergence of some scattering features around 10 nm in radius, consistent with the observation of nanoparticles in the TEM. At 800 °C, the scattering profile and histogram (Fig. 8d) are both similar to those of the Fe(NO3)3–cellulose system, again consistent with the observation of nanoparticle catalysts and graphitic nanostructures with mesopores.
Conclusions
This study has comprehensively examined the impact of using Fe(NO3)3 and FeCl3 as catalysts for the iron-catalysed graphitization of cellulose. The influence of the counterion (NO3− or Cl−) on yield and textural properties is considerable, with FeCl3 promoting a higher yield of carbon with nitrogen porosimetry data providing evidence that porosity extends from micro to macropores. This is in comparison to a primarily mesoporous carbon produced from cellulose with Fe(NO3)3. The reason for the difference in material properties is that the iron salts promote different decomposition pathways, presumably due to the different Lewis acidity of the salts. Iron chloride promotes dehydration of cellulose and strongly suppresses the formation of levoglucosan, a volatile decomposition product. This in turn means that the iron chloride generates a higher carbon yield than iron nitrate. Another major difference between the two systems is the volatility of FeCl3. Vaporization of the chloride and subsequent hydrolysis results in the deposition of large iron oxide crystallites. These in turn produce large Fe/Fe3C catalyst particles which generate graphitic macropores. This is in contrast to the Fe(NO3)3–cellulose system, which remains amorphous until >600 °C, with the iron highly dispersed. The resulting catalyst particles are much smaller, resulting in a mesoporous graphitic structure. Thus, a simple change in metal salt can have a significant impact on material properties in pyrolysis. This is a powerful tool for tuning carbon porosity and structure.Experimental
Materials
Microcrystalline cellulose (<20 μm), iron nitrate nonahydrate and iron(III) chloride hexahydrate were purchased from Sigma-Aldrich and used without any further modification.Preparation of cellulose samples with iron salts
In all cases, 0.68 mmol iron salt was dissolved in 40 mL of water at room temperature and added to 20 g of microcrystalline cellulose (MCC). The mixture was stirred manually until the liquid was absorbed and dried in a 70 °C oven overnight. For pyrolysis, 2 g of sample was placed in an alumina crucible and heated to desired temperature (250, 300, 400, 500, 600, 700 and 800 °C) at a rate of 5 °C min−1 under N2 atmosphere with flow rate 1 L min−1. The samples were held at this temperature for 1 h before cooling to room temperature.Fourier transformed infrared spectroscopy
Infrared spectroscopy was collected using Bruker Alpha FT-IR spectrometer with an ATR attachment.Thermogravimetric analysis
Thermogravimetric analysis was carried out using Netzsch STA 449 F3 Jupiter and mass spectrometry data collected by QMS 403 Aeolos Quadro. Thermograms were collected with average sample mass between 5–10 mg and heated at 10 °C min−1 between 40–800 °C under N2 atmosphere.Powder X-ray diffraction
Samples were ground into a fine powder and placed on low-background silicon wafer sample holders. p-XRD experiments were performed using a PANalytical Empyrean diffractometer with a copper anode (wavelengths: Kα1 = 1.5406 Å, Kα2 = 1.5443 Å) and a Pixel 2D detector. The diffractometer did not have a monochromator but the Kβ radiation was removed with a nickel filter.Raman spectroscopy
Samples were ground to a fine powder and placed on a glass slide. Raman spectroscopy was taken using Renishaw inVia Raman microscope using a red laser at 10% power with wavelength of 633 nm. Peak fitting was completed using assuming a 4-peak Voigt function. The 5-peak fit was not used owing to significant overlap between the G and D2 peaks in the spectra.Scanning electron microscopy
Samples were mounted on an SEM stub using an adhesive copper tape. Samples were viewed with a FEM-SEM FEI Nova 450 using a CBS detector, operating at 5 kV with deceleration mode.Small angle X-ray scattering
Samples were ground into a fine powder and distributed across a hole in a paper sample holder between two pieces of Scotch Magic tape. The wide-range SAXS experiments were performed using the Multi-scale Analyser for Ultrafine Structures (MAUS) at the Federal Institute for Materials Research and Testing (BAM), Berlin. Copper and molybdenum anodes (8 eV and 17 eV photons, respectively) were used to measure over a wide q range.Transmission electron microscopy
Approx. 50 mg of sample was dispersed in approx. 1 mL ethanol and sonicated for around 10 minutes. Subsequently samples were drop cast onto an E-chip for the Protochips FUSION heating holder. Samples were observed using a JEOL JEM-2100F in TEM mode at 200 kV acceleration voltage.Nitrogen sorption
Nitrogen sorption measurements were carried out using a Quantachrome Nova 1000 series volumetric gas sorption analyser at 77 K. 50–200 mg sample was ground to fine powder and degassed at 100 °C for 24 h under vacuum. Isotherms were carried out with sample tubes calibrated for filler rods over the pressure range p/p0 0.015–0.095. BET surface areas were calculated using the Rouquerol correction to select range p/p0 0.015–0.04 using the method recommended by the International Organization for Standardization (ISO) 9277.39 The total pore volume was obtained from the isotherm plateau and the micropore volume was obtained using the t-plot method, according to ISO 15901–2.40Data availability
All data associated with this paper are openly available from https://doi.org/10.25500/edata.bham.00001143.Conflicts of interest
There are no conflicts to declare.Acknowledgements
The authors acknowledge the Leverhulme Trust (Grant RPG-2020-076) and the University of Birmingham (EH PhD studentship) for funding. This work made use of Aalto University Bioeconomy Facilities.References
- H. Zhu, F. Shen, W. Luo, S. Zhu, M. Zhao and B. Natarajan, Nano Energy, 2017, 33, 37–44 CrossRef.
- M. Drews, J. Büttner, M. Bauer, J. Ahmed, R. Sahu, C. Scheu, S. Vierrath, A. Fischer and D. Biro, Chemelectrochem, 2021, 8, 4750–4761 CrossRef.
- R. D. Hunter, J. Davies, S. J. A. Hérou, A. Kulak and Z. Schnepp, Philos. Trans. R. Soc., A, 2021, 379, 20200336 CrossRef PubMed.
- S. Herou, P. Schlee, A. B. Jorge, M. Titirici and C. Opin, Green Sustain. Chem., 2018, 9, 18–24 Search PubMed.
- C. O. Tuck, Science, 2012, 337, 695–699 CrossRef PubMed.
- H. M. Coromina, D. A. Walsh and R. Mokaya, J. Mater. Chem. A, 2016, 4, 280–289 RSC.
- E. Thompson, A. E. Danks, L. Bourgeois and Z. Schnepp, Green Chem., 2015, 17, 551–556 RSC.
- M. Sevilla and A. B. Fuertes, Chem. Phys. Lett., 2010, 490, 63–68 CrossRef CAS.
- M. Sevilla, C. Sanchís, T. Valdés-Solís, E. Morallón and A. B. Fuertes, Carbon, 2008, 46, 931–939 CrossRef CAS.
- L. Li, C. Fan, B. Zeng and M. Tan, Mater. Chem. Phys., 2020, 242, 122380 CrossRef.
- R. D. Hunter, J. Ramírez-Rico and Z. Schnepp, J. Mater. Chem. A, 2022, 10, 4489–4516 RSC.
- B. P. Abbott, R. Abbott, T. D. Abbott, B. P. Abbott, R. Abbott, T. D. Abbott, M. Titirici, S. G. Baird, T. D. Sparks, S. M. Yang, A. Brandt-talbot, O. Hosseini, D. P. Harper, R. M. Parker, S. Vignolini, L. A. Berglund, Y. Li, H. Gao, L. Mao, S. Yu, N. Díez, C. J. Stubbs, J. C. Worch, G. A. Ferrero, M. Sevilla, P. Agota, O. Westhead, C. Roy, I. E. L. Stephens, S. A. Nicolae, S. C. Sarma, R. P. Oates, C. Wang, Z. Li and X. J. Loh, J. Phys.: Mater., 2022, 5, 032001 Search PubMed.
- T. Kan, V. Strezov and T. J. Evans, Renewable Sustainable Energy Rev., 2016, 57, 1126–1140 CrossRef.
- D. V. Suriapparao and R. Tejasvi, Process Saf. Environ. Prot., 2022, 162, 435–462 CrossRef.
- G. Ischia and L. Fiori, Waste Biomass Valorization, 2021, 12, 2797–2824 CrossRef.
- R. D. Hunter, J. L. Rowlandson, G. J. Smales, B. R. Pauw, V. P. Ting, A. Kulak and Z. Schnepp, Adv. Mater., 2020, 1, 3281–3291 RSC.
- R. D. Hunter, E. C. Hayward, G. J. Smales, A. Kulak, S. G. De and Z. Schnepp, Adv. Mater., 2023, 4, 2070–2077 RSC.
- D. Klemm, B. Heublein, H. P. Fink and A. Bohn, Angew. Chem., Int. Ed., 2005, 44, 3358–3393 CrossRef PubMed.
- J. Hoekstra, A. M. Beale, F. Soulimani, M. Versluijs-helder, J. W. Geus and L. W. Jenneskens, J. Phys. Chem. C, 2015, 119, 10653–10661 CrossRef.
- J. Hoekstra, A. M. Beale, F. Soulimani, M. Versluijs-helder, D. Van De Kleut, J. M. Koelewijn, J. W. Geus and L. W. Jenneskens, Carbon, 2016, 107, 248–260 CrossRef.
- C. Chen, K. Sun, A. Wang, S. Wang and J. Jiang, Bioresources, 2018, 13, 3165–3176 Search PubMed.
- M. Thommes, K. Kaneko, A. V. Neimark, J. P. Olivier, F. Rodriguez-Reinoso, J. Rouquerol and K. S. W. Sing, Pure Appl. Chem., 2015, 87, 1051–1069 CrossRef.
- Z. Schnepp, M. J. Hollamby, M. Tanaka, Y. Matsushita, Y. Xu and Y. Sakka, Chem. Commun., 2014, 50, 5364–5366 RSC.
- A. C. Ferrari and D. M. Basko, Nat. Nanotechnol., 2013, 8, 235–246 CrossRef PubMed.
- H. Yang, M. Gong, J. Hu, B. Liu, Y. Chen, J. Xiao, S. Li, Z. Dong and H. Chen, Energy Fuels, 2020, 34, 3412–3421 CrossRef.
- Y. C. Lin, J. Cho, G. A. Tompsett, P. R. Westmoreland and G. W. Huber, J. Phys. Chem. C, 2009, 113, 20097–20107 CrossRef.
- F. X. Collard, A. Bensakhria, M. Drobek, G. Volle and J. Blin, Biomass Bioenergy, 2015, 80, 52–62 CrossRef.
- Z. Xu, Z. Sun, Y. Zhou, W. Chen, T. Zhang, Y. Huang and D. Zhang, Colloids Surf., A, 2019, 582, 123934 CrossRef.
- N. Shimada, H. Kawamoto and S. Saka, J. Anal. Appl. Pyrolysis, 2008, 81, 80–87 CrossRef.
- H. Zhang, X. Meng, C. Liu, Y. Wang and R. Xiao, Fuel Process. Technol., 2017, 167, 484–490 CrossRef.
- H. Kawamoto, D. Yamamoto, S. Saka and J. Wood, Sci, 2008, 54, 242–246 Search PubMed.
- M. Zhang, Z. Geng and Y. Yu, Energy Fuels, 2011, 25, 2664–2670 CrossRef.
- M. S. Chambers, D. S. Keeble, D. Fletcher, J. A. Hriljac and Z. Schnepp, Inorg. Chem., 2021, 60, 7062–7069 CrossRef.
- Y. Jia and J. Lei, Energy Explor. Exploit., 2023, 41, 1663–1675 CrossRef.
- Y. Liu, S. Wu, H. Zhang and R. Xiao, Fuel Process. Technol., 2022, 235, 107367 CrossRef.
- L. B. Robinson, W. B. White and R. Roy, J. Mater. Sci., 1966, 1, 336–345 CrossRef.
- X. Zhu, F. Qian, Y. Liu, D. Matera, G. Wu, S. Zhang and J. Chen, Carbon, 2016, 99, 338–347 CrossRef.
- I. Bressler, B. R. Pauw and A. F. Thünemann, J. Appl. Crystallogr., 2015, 48, 962–969 CrossRef PubMed.
- ISO, Determination of the Specific Surface Area of Solids by Gas Adsorption. BET Method. ISO 9277, 2022, pp. 1–21 Search PubMed.
- ISO. Pore Size Distribution and Porosity of Solid Materials by Mercury Porosimetry and Gas Adsorption – Part 2: Analysis of Nanopores by Gas Adsorption, ISO 15901-2, 2022, pp. 1–28 Search PubMed.
Footnote |
| † Electronic supplementary information (ESI) available. See DOI: https://doi.org/10.1039/d4su00365a |
| This journal is © The Royal Society of Chemistry 2024 |

