 Open Access Article
Solid-state sodium batteries with P2-type Mn-based layered oxides by utilizing anionic redox†
Steven
Kmiec
 ,
Panawan
Vanaphuti
 and
Arumugam
Manthiram
 *
*
Materials Science and Engineering Program & Texas Materials Institute, The University of Texas at Austin, Austin, TX 78712, USA. E-mail: rmanth@mail.utexas.edu
First published on 28th December 2023
Abstract
Recently, P2-type manganese-based sodium layered cathodes have gained considerable attention as a viable option for grid-scale energy storage due to their high natural abundance, low cost, and high specific capacity from both cationic and anionic redox activity. We report here a solid-state battery with a cobalt/nickel-free layered Na0.72Li0.24Mn0.75Si0.01O2 cathode, sodium bis(fluorosulfonyl)imide (NaFSI)-based polymer composite solid electrolyte (CSE), and a sodium-metal anode. Electrochemical measurements confirm both reversible cationic (Mn-redox) and anionic (O-redox) can be achieved in solid-state sodium metal batteries (SSNMBs) with a CSE and layered Na0.72Li0.24Mn0.75Si0.01O2 cathode. Solid-state cells were found to achieve a maximum specific capacity of 180 mA h g−1 with capacity retention of 72% after 50 cycles at C/2 rate at 1.50–4.50 V at 60 °C. Post mortem analysis reveals capacity fade can be primarily attributed to an increase in cell polarization at the cathode-electrolyte interphase (CEI), specifically oxidation/degradation of the infiltrated solid polymer electrolyte. To improve the cycle performance, the oxidative stability of a solid-electrolyte with the high-voltage cathode needs to be considered to minimize the formation of resistive CEI layers, which limit capacity utilization. Altogether, this work provides a promising strategy to utilize anionic redox-based cathodes in solid-state batteries, which in turn can aid the development of practically viable SSNMBs.
1 Introduction
With the rapidly expanding global demand for energy, it is more important than ever to continue the development of renewable energy technologies to power society for many years to come.1 While portable electronics and electrified vehicles often consider lithium-based systems for their high specific capacity and gravimetric energy density, these performance metrics often come at high costs, limiting their practical ability to be implemented at a grid-scale.2 To combat this issue, development of sodium-based electrochemical systems need to be conducted to identify safe, low-cost, high-capacity, and Co/Ni-free cathodes.3The most common sodium cathodes are layered metal oxides (NaMO2 with M = transition metal), and polyanion oxides, such as Na3V2(PO4)3. Unfortunately, while many of these materials perform well on a lab scale, they rely on raw materials that are not scalable to meet the needs of grid-scale storage. To overcome this difficulty, the composition of the cathodes must be rich in iron (Fe) or manganese (Mn) to lower the cost, but also achieve both a high specific capacity and stable long-term cycling. In particular, recent reports have shown that high specific capacities can be achieved in P2-type Mn-based layered oxide cathodes, especially when doped with Mg2+, Li+, or Zn2+ in the transition metal layer. However, this family of cathodes is prone to poor cycle stability at high cut-off voltages, leading to electrolyte decomposition and loss of cathode active material due to irreversible phase transitions (P2–O2). According to previous studies, the possibility of P2-NMO cathodes with a composition of Na0.72Li0.24Mn0.76O2 to utilize the anionic redox stems from the introduction of Li into transition-metal sites.4–8 This allows the formation of unhybridized O 2p orbitals and stabilizes the adjacent oxygen layer, which raises the specific capacity to as high as 220 mA h g−1. By applying a voltage cut-off beyond 4.2 V, this favours the P2–O2 phase transition that is not fully reversible upon cycling, resulting in degradation. To prolong the cycle life, doping and surface coating are among the most efficient strategies.9 For instance, doping a small amount of inactive elements, such as tetravalent Si4+ ion, has shown to enhance the cycle stability of this cathode class.10 Thus, Na0.72Li0.24Mn0.75Si0.01O2 is employed in this study as a cathode.
Despite the current wide-spread use of liquid electrolytes in the batteries of consumer electronics, they are often comprised of flammable, hazardous solvents and suffer from instabilities when used with sodium-metal anodes. On the other hand, the quickly growing class of solid-state electrolytes (SSE), while often less conductive, have great potential for improving the energy density of sodium-based systems, while eliminating the use of flammable liquid electrolytes. In addition to safety, SSEs have also been shown to suppress dendrite penetration and prevent degradation due to chemical crossover of dissolved species between the two electrodes.11 While there have been many sodium conducting materials discovered, there is still no front-runner that meets the requirements for practical battery applications. This is often due to their limited ability to be formed as a thin, self-standing separator capable of suppressing dendrites with low over potentials.12–15 Unlike liquid electrolytes, the use of NaFSI salt in the cross-linked solid polymer electrolyte was found to promote stable striping and plating of sodium metal, with little observable degradation when cycled to 4.50 V vs. Na/Na+.
Here, we present the first use of P2-Na0.72Mn0.75Li0.24Si0.01O2 cathode with anionic redox activity in a solid-state sodium-metal battery, demonstrating a reversible specific capacity of 180 mA h g−1. The solid-state cells are comprised of a sodium-metal anode, glass-fiber-polymer CSE separator, and a cathode composite infiltrated with a polymer electrolyte and cycled at 60 °C. To identify the kinetics and reversibility of the manganese and oxygen redox, operando electrochemical impedance spectroscopy (EIS) and extended cycling of cells with 4.50 and 4.80 V cut-off voltages are investigated. Post mortem analysis of the electrode reveals polarization growth, resulting from electrolyte degradation, as the primary mechanism for capacity decay. More importantly, we introduce, for the first time, anionic redox-based P2-type cathodes in SSNMB with a high specific capacity of 180 mA h g−1 at a broad voltage range of 1.5–4.5 V.
2 Experimental
2.1 Sample preparation
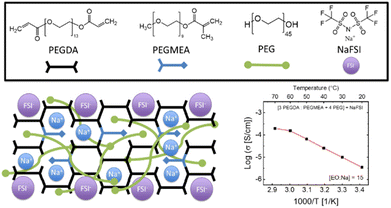
Polyethylene glycol diacrylate (PEGDA) – MW 700 g mol−1 (Sigma-Aldrich), polyethylene glycol methyl ether acrylate (PEGMEA) – MW 300 g mol−1 (Sigma-Aldrich), polyethylene glycol (PEG) – MW 1900–2100 g mol−1 (Sigma-Aldrich), sodium bis(fluro)sulfimide (NaFSI) 99.9% (Solvionic), and acetonitrile (ACN) redi-dry 99.9% (Sigma-Aldrich) were used in the preparation of the monomer solution. The PEG was dried at 80 °C for 2 h under vacuum to remove any residual water and transferred to an argon-filled glove box along with NaFSI salt. The PEGDA and PEGMEA solutions were stored at ∼0 °C and used without further modification. The inorganic, 20 μm thick, glass fiber matrix was provided by Alkegen Corporation and described in more detail in our previous work.162.2 Sample characterization
X-ray diffraction (XRD) experiments were conducted on a MiniFlex benchtop X-ray diffractometer with Cu K-α radiation source (λ = 0.154 nm). The data for each sample was collected from 10 to 80° with a scan rate of 0.02° per second. Scanning electron microscopy (SEM) images were collected on an Apreo 2 C LoVac SEM instrument to characterize the active material and the cathode composites. Cyclic voltammetry measurements of solid-state Si-NMO cells were collected with a Biologic-S3 system at 60 °C in a coin-cell format, with a sweep rate of 0.01 mV s−1 from 1.50 to 4.50 V. The Raman spectra were collected with a Renishaw inVia 513 nm Coherent Laser Raman microspectrometer equipped with a 50× optical objective (1.3 mm working distance). Spectra were recorded with 15–20 scans from 150–1015 cm−1 with a power between 0.5 and 1.2 mW and a 60 second exposure time per scan. The FTIR spectra of the CSE separators were collected under ambient conditions on a Thermo Scientific Nicoleti-S5 ATR instrument from 500 to 3600 cm−1. Each spectrum is the co-addition of 32 scans, each with 4 cm−1 resolution. Ion-milling (IM4000 Plus) was employed to prepare the cross-sectional electrodes with an acceleration voltage of 5 kV and a discharge voltage of 1 kV.2.3 Electrochemical impedance spectroscopy
 | (1) |
2.4 Electrochemical testing
Cathode electrodes were prepared with a composition of 80.0 wt% active material (Si-NMO), 10.0 wt% Super P, and 10.0 wt% polyvinylidene fluoride (PVDF) binder. The mixture was dispersed in N-methyl-2-pyrrolidone (NMP) and mixed in a Thinky AR-310 centrifugal mixer at 2000 rpm until the slurry was of uniform appearance. The electrode slurry was then blade-cast onto a carbon-coated Al foil (MTI) with an active mass loading of 2–5 mg cm−2 and dried a 120 °C in a vacuum oven overnight. The as-cast electrodes were then punched into 12 mm samples and infiltrated with 15 μl of the pre-polymer solution. To ensure complete wetting of the cathode composite and removal of solvent, electrodes were left at 60 °C under vacuum overnight. The infiltrated electrodes were then cured with UV light (254 nm) for 15 min and transferred to a high-quality Ar-filled glovebox for later cell assembly.The half-cells were assembled in triplicate within an argon-filled glovebox with the cathode, Na-metal anode, and CSE separator. All cells were tested with an Arbin battery tester at 1.50–4.50 V vs. Na/Na+ at 60 °C (1C = 200 mA h g−1). Prior to cycling, cells underwent two formation cycles at 0.1C rate, followed by 0.5C rate for 50 cycles.
The electrochemical stability of the CSE was determined through linear sweep voltammetry (LSV) with a sweep rate of 1.0 mV s−1 (Fig. S2†). The CSE stability against Na metal was investigated with symmetric cell cycling at 60 °C (Fig. S3†).
3 Results and discussion
3.1 Structural characterization of P2-type Na0.72[Li0.24Mn0.75Si0.01]O2 active material
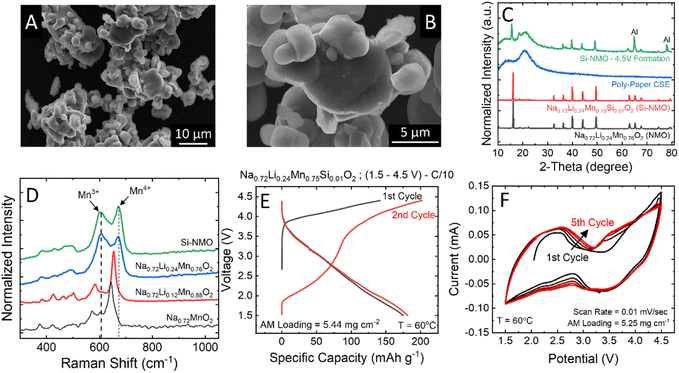
SEM micrographs of the Si-NMO samples prepared via solid-state synthesis (Fig. 2A and B) reveal coarse agglomerations of irregularly shaped particles ranging from 1 to 10 μm in diameter. Energy-dispersive X-ray spectroscopy (EDS) mapping provided in Fig. S4 in the ESI† shows a uniform distribution of Si across all NMO particles. The P2-type structure in the NMO and Si-NMO samples was confirmed with XRD (Fig. 2C), alongside that of the polymer-paper CSE, and the cathode composite after a formation cycle to 4.50 V vs. Na/Na+.To better understand the effect of lithium doping on the sodium P2-type structure, Raman spectra of the Na0.72LixMn1−xO2 series were collected and are presented in Fig. 2D. The primary modes in the undoped sample (Na0.72MnO2) are centered at 644, 605, and 575 cm−1 and assigned, respectively, to the A1g and Eg modes of Mn4+ sites and the A1g mode of the Mn3+ sites.17 With the incorporation of lithium into the structure, a systematic shift is observed in the primary A1g mode, from 644 cm−1 in Na0.72MnO2 to 672 cm−1 in Na0.72Li0.24Mn0.76O2, confirming the incorporation of the high field-strength Li+ cation near the Mn4+ site.18 At the higher lithium concentrations (x = 0.25), the Mn3+ and Mn4+ modes are uniform in area, suggesting the incorporation of Li+ increases the concentration of Mn3+ sites within the active material. However, Mn3+ ions can induce structural instability due to Jahn–Teller distortion, so the higher lithium concentrations are not used in this study.19,20
The first and second-cycle voltage profiles of a solid-state cell are given in Fig. 2E, exhibiting a second-cycle charge capacity of 180 mA h g−1 and a discharge capacity of 178 mA h g−1 at a C/10 rate. The CV curve of the Si-NMO cell for the first five cycles at 1.50 to 4.50 V (Fig. 2F) reveals a reversible redox reaction of both Mn4+/Mn3+ at ∼2.45 V (oxidation)/2.25 V (reduction) and O2/O2n−/O2− at 4.00 V (oxidation)/3.50 V (reduction). This confirms a moderate structural stability of the Si-NMO with CSE separator at this potential range. It is worth mentioning that the 1 mol% Si doped NMO was used instead of pristine NMO due to its improvement in the cycle stability, as shown in Fig. S5.† Based on the previous study, 1 mol% Si in NMO can enhance the cycle performance of NMO by providing a stabilization to both the surface and to some extend in the bulk.10 In SSNMB, the Si4+ ions on the surface of NMO form Si–OH species, which can promote the formation of Si–O–C bonding between the Si-NMO particles and the polymer electrolyte via a condensation reaction of silanol group (Si–OH) and the OH-terminated PEG chains.21,22
To gain insight on the extent of oxygen redox, a potential range of 1.50–4.80 V was also examined. As expected, compared to 4.50 V, more oxygen will participate in the redox reaction at 4.80 V, as shown in Fig. S6.† However, the discharge capacity is similar for both potential ranges (∼150 mA h g−1). This suggests that there is a limitation for the oxygen redox to be reversibly accessible and that too high of a voltage can hasten the side reactions. Fig. S3† shows the charge–discharge profiles of the two initial cycles up to, respectively, 4.5 and 4.8 V. Evidently, the 4.8 V leads to more anionic redox than the 4.5 V (∼50 mA h g−1), but this additional capacity is unavailable upon discharge. This is only seen extensively during the first formation cycle. In addition, the peak beyond 4.1 V in the dQ/dV plot verifies the presence of anionic redox where with a 4.5 V cut-off, less oxygen redox is accessed when compared to 4.8 V. Meanwhile, this peak is less significant after the first cycle. Based on this data, we selected a cut-off voltage of 4.5 V to minimize the structural change of P2-NMO cathode and avoid electrolyte instability at 4.8 V. In addition, Fig. S7† displays the XRD patterns of cycled Si-NMO with the CSE cells after the formation cycle at 4.50 and 4.80 V, which evident the less structural change in the bulk. The EIS data at 4.80 V confirms the increase in the charge-transfer resistance, which may relate to the increase in the thickness of CEI layer. This is consistent with the SEM images in Fig. S8† that verify a denser surface of the Si-NMO electrode at 4.80 V compared to 4.50 V. Thus, a voltage range of 1.50–4.50 V was applied to the rest of the study.
3.2 Operando EIS of Na|CSE|Si-NMO cells
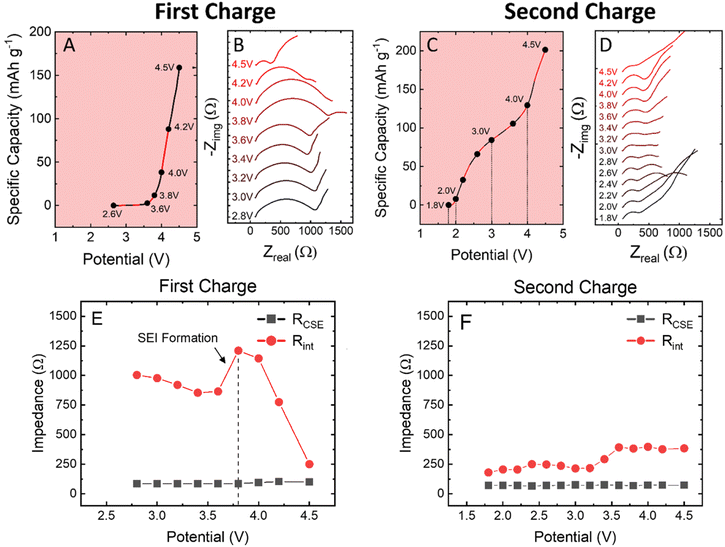
To further understand the redox transitions within the cathode composite, operando EIS was performed to identify the effects of the 4.5 V formation cycle on the full cell impedance. In previous work, a similar PEGDA + PEG + NaFSI CSE was shown to exhibit low resistance and a robust anode-electrolyte interface (AEI) with Na-metal after only two hours at 60 °C.16 For these operando experiments, all cells were rested at 60 °C for three hours prior to testing to ensure the formation of a stable sodium AEI layer.16 At the as-assembled OCV, EIS shows a bulk CSE resistance of ∼150 Ω, and a combined cell resistance of 1100 Ω for anode electrolyte interface (AEI) + cathode composite + CEI, as shown in Fig. 3A and B.Upon cycling at a rate of C/40, the EIS spectra of the cells do not appear to vary from OCV 2.60 V to 3.60 V. However, between 3.60 and 3.80 V, activation of oxygen redox begins as indicated by the growth in cell resistance imparted by the sluggish activation kinetics of anionic redox. With this, a new time-constant is formed within the EIS spectra, assigned to charge transfer within the electrode, and with each subsequent increase in the voltage up to 4.50 V, the cell resistance continues to decrease. This decrease in cell resistance can be attributed to the completion of the activation/conditioning cycle.
On second charge, the EIS spectra follow a normal trend based on the state of charge. At low and high potentials, the cell presents an increased Warburg impedance as a result of Na+ diffusion limitations within the active material upon depletion/saturation. However, when compared to the first charge, the impedance is notably lower after the formation cycle. The discharge curves for the operando experiment are presented in Fig. S9,† and despite the minor increase in low frequency impedance, a specific capacity of 180 mA h g−1 was achieved on the second discharge.
3.3 Cycling stability of Na|CSE|Si-NMO solid-state cells
The PEGDA-MEA + PEG + NaFSI CSE was used with Si-NMO cathode and sodium-metal anode to test its performance in a practical cell design. Here, we can see in Fig. 4A that the CSE and infiltration process allows for a good utilization of the active cathode material, exhibiting an initial capacity of ∼180 mA h g−1 (theoretical capacity of 200 mA h g−1) for the voltage window of 1.50–4.50 V vs. Na/Na+ at a charge/discharge rate of C/2 or lower. The all-solid-state cell design can show relatively stable cycling performance over 50 cycles with a capacity retention of 72% and a specific capacity of 100 mA h g−1. Although the capacity fade in these solid-state cells is more severe than that observed in a liquid electrolyte cell at comparable rates,10,23,24 the cycle performance reported here with a wide voltage range is a considerable achievement in the development of high-energy-density SSNMBs. This capacity fade may originate from the degradation of the CSE separator at these high voltage conditions.In Si-NMO, Mn and oxygen are the redox active elements that contribute to the overall specific capacity; Li and Si are redox inactive elements and only impact the structural ordering and stability of transition-metal layers. The inclusion of Li can significantly minimize the complicated phase transitions in P2-type Mn-based layer oxide cathodes.10 As is evident in Fig. 4B, the voltage profiles retain their characteristic shape over the 50 cycles, retaining the smooth Mn3+/Mn4+ and the P2–OP4 phase transition. In addition, the evolution of the differential capacity curves (dQ/dV) in Fig. 4C suggests a reversible oxygen redox activity after the first formation cycle. Although the initial cycles show good structural reversibility, there is a gradual decline after the 10th cycle. The oxygen redox reaction peak from O2 to O2n− does not notably change from the first cycle. However, the irreversibility of the Mn redox reaction and the corresponding peak shifts in terms of ΔV seems to be more significant. These findings are consistent with an increase in the formation of CEI layer due to side reactions and its contribution to polarization growth during cycling.
3.4 Post mortem analysis of the cells
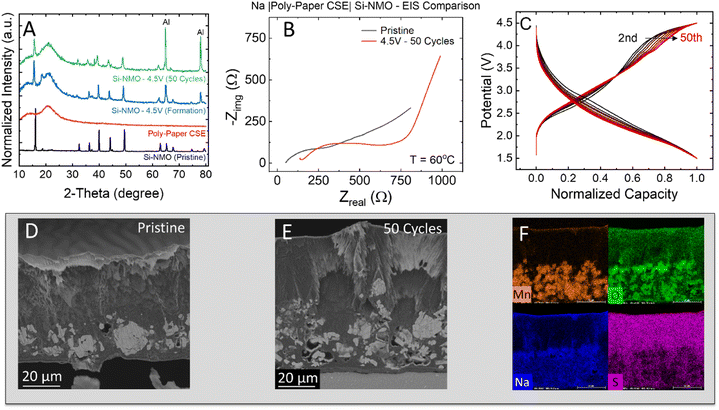
To identify the cause of the capacity fade, post mortem analysis was performed on cycled electrodes and separators. The XRD patterns of the cycled Si-NMO electrodes show little evidence of structural degradation over the 50 cycles, as shown in Fig. 5A. All peaks of the cycled Si-NMO are similar to those at the pristine state with the presence of a CSE amorphous halo. This indicates the bulk structure of Si-NMO is well-maintained after 50 cycles. Note that the peak intensities of the cycled electrodes exhibit a lower intensity when compared to the pristine active material powder due to polymer electrolyte coverage, and other components in the slurry cast electrode. While the Si-NMO did not undergo any major apparent structural changes, comparison of the EIS curves in Fig. 5B reveals a noticeable increase in the resistance of the cycled cell.To rule out sources of cell resistance, previous reports have shown NaFSI + PEGDA + PEG based CSE can form a highly stable interface with sodium-metal anodes, conducive to stripping and plating.16 Thus, the increased resistance in the cycled cells can likely be attributed to the growth of a resistive CEI layer and current driven overpotential. Fig. S10† highlights the effects of current density on the growth of resistance. Consistent with these findings, the normalized capacity plot in Fig. 5C further suggests a fade mechanism to be associated with the growth of cell polarization during cycling. This is evidenced by the voltage drop from 2nd to 50th cycle.
To better understand the underlying source of capacity fade in these solid-state cells, pristine and cycled electrodes were cross-sectioned with ion-milling to confirm if any pulverization of active material particles occurred during cycling. A cross-sectioned SEM micrograph of the pristine electrode (Fig. 5D) shows a uniform distribution of electrolyte and dense Si-NMO particles within the composite. In addition to infiltrating the electrode, it was revealed that the 15 μl loading of pre-polymer solution resulted in a layer of excess polymer electrolyte of ∼20–40 μm in thickness. While this layer improves contact with the separator and is not particularly thick, it does add unwanted polarization to the cell.
In contrast, the cross-section of the cycled electrode (Fig. 5E) reveals many cracked particles. This particle pulverization originates from the P2–OP4 phase transition accompanied with a gliding of planes at a high de-sodiation state.25,26 In general, the pulverized particles are dislodged from the electrode matrix during cycling and hinder the Na diffusion pathway. This can result in a lower capacity due to the limitation of ion and electron accessibility. Meanwhile, the cycled electrode surface also shows a thicker CEI layer. Moreover, the EDS mapping of the cycled electrodes (Fig. 5F) reveals a full wetting of the electrode with the PEGDA-MEA electrolyte and no clear dissolution of active materials. From the electrochemical testing and post mortem analysis, there is clear evidence of an increase in cell polarization and a degradation of CSE separator. Therefore, it is necessary to understand the degradation mechanism of the CSE separator with the anionic redox-based cathode, which will be examined in the next section.
3.5 Post mortem analysis of composite solid electrolyte
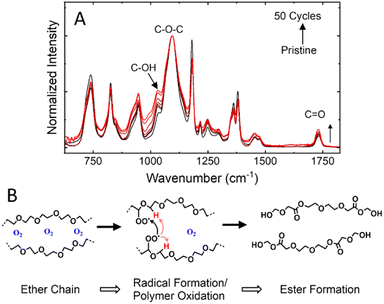
Upon disassembly of the cell, the CSE remained intact, but appeared discolored when removed from the electrodes. The FTIR spectra (Fig. 6A) of the cycled separator reveals a minor increase in the νas(C–OH) band and νas(C–O–C) band, respectively centered at 1030 cm−1 and 1095 cm−1.27 An increase in these modes suggests a decomposition of polymer chains along the C–O–C backbone to form peroxide radicals and the ester groups via auto-oxidation in the presence of oxygen.28 While the cells were formed inside an argon filled glovebox, the high cut-off voltage used in this study has the potential to form oxygen radicals on charging to 4.50 V. In this case (Fig. 6B), oxide radicals formed at high voltages from the anion-redox process could promote the degradation of ether chains (e.g., PEG or PEGDA-MEA) to ester-rich chains. While the formation of ester groups increases the total number of solvating oxygens, it negatively affects the solvation structure needed for fast-ion transport within the polymer electrolyte.29–31 Thus, as more ester groups are formed, the ionic conductivity of the affected area will drop, increasing the cell resistance.32,33 While the polymer electrolyte in this case only experienced minor degradation in the Si-NMO cells, the degradation limit access to the active material particles and reduce capacity utilization. It should be noted that when used in a similar P2-type Na0.67Ni0.33Mn0.67O2 electrode, decomposition of the PEGDA-MEA polymer electrolyte was far greater. This difference can be attributed to the greater catalytic effects of Ni bearing layered metal oxides when compared to the Ni-free analog.34 To combat this issue, coating strategies have been employed to the cathode particles to minimize unwanted interactions and stave off electrolyte degradation.94 Conclusions
In this work, we have demonstrated reversible cationic (Mn-redox) and anionic (O-redox) can be achieved in solid-state sodium-metal batteries with a CSE and a layered metal oxide cathode. Solid-state cells were found to achieve a maximum specific capacity of 180 mA h g−1 and a capacity retention of 72% (∼100 mA h g−1) after 50 cycles at C/2 rate at 1.50–4.50 V at 60 °C. Post mortem analysis reveals capacity fade can be primarily attributed to an increase in cell polarization of the cathode composite where an oxidation reaction of the infiltrated polymer electrolyte and the formation of a more resistive pathway within the electrode occur. Additionally, the SEM cross-section of the cycled cathodes reveal a notable degree of particle cracking, suggesting the capacity fade can be, to a lesser extent, also attributed to active material loss. While the cycle stability presented in this study can certainly be improved, this work achieves the highest specific capacity in a solid-state sodium cell containing a layered metal oxide cathode to date. Future efforts must be made to harness the low-cost, high specific capacity of anionic redox in solid-state batteries. To improve the cycle stability, one must carefully select a solid-electrolyte compatible with the cathode composite at high voltages to minimize the formation of resistive CEI layers, which increase cell polarization and limit capacity utilization.Conflicts of interest
The authors declare no competing financial interest.Acknowledgements
This work was supported by the U.S. Department of Energy, Office of Basic Energy Sciences, Division of Materials Science and Engineering under award number DE-SC0005397.References
- K. Sada, J. Darga and A. Manthiram, Adv. Energy Mater., 2023, 2302321 CrossRef CAS.
- J. Darga, J. Lamb and A. Manthiram, Energy Technol., 2020, 8, 2000723 CrossRef CAS.
- J. Ma, Y. Li, N. S. Grundish, J. B. Goodenough, Y. Chen, L. Guo, Z. Peng, X. Qi, F. Yang, L. Qie, C.-A. Wang, B. Huang, Z. Huang, L. Chen, D. Su, G. Wang, X. Peng, Z. Chen, J. Yang, S. He, X. Zhang, H. Yu, C. Fu, M. Jiang, W. Deng, C.-F. Sun, Q. Pan, Y. Tang, X. Li, X. Ji, F. Wan, Z. Niu, F. Lian, C. Wang, G. G. Wallace, M. Fan, Q. Meng, S. Xin, Y.-G. Guo and L.-J. Wan, J. Phys. D: Appl. Phys., 2021, 54, 183001 CrossRef CAS.
- X. Rong, E. Hu, Y. Lu, F. Meng, C. Zhao, X. Wang, Q. Zhang, X. Yu, L. Gu, Y.-S. Hu, H. Li, X. Huang, X.-Q. Yang, C. Delmas and L. Chen, Joule, 2019, 3, 503–517 CrossRef CAS.
- K. Du, J. Zhu, G. Hu, H. Gao, Y. Li and J. B. Goodenough, Energy Environ. Sci., 2016, 9, 2575–2577 RSC.
- N. Yabuuchi, R. Hara, M. Kajiyama, K. Kubota, T. Ishigaki, A. Hoshikawa and S. Komaba, Adv. Energy Mater., 2014, 4, 1301453 CrossRef.
- L. Yang, X. Li, X. Ma, S. Xiong, P. Liu, Y. Tang, S. Cheng, Y.-Y. Hu, M. Liu and H. Chen, J. Power Sources, 2018, 381, 171–180 CrossRef CAS.
- G. Assat and J.-M. Tarascon, Nat. Energy, 2018, 3, 373–386 CrossRef CAS.
- R. Tatara, H. Suzuki, M. Hamada, K. Kubota, S. Kumakura and S. Komaba, J. Phys. Chem. C, 2022, 126, 20226–20234 CrossRef CAS.
- P. Vanaphuti, Z. Yao, Y. Liu, Y. Lin, J. Wen, Z. Yang, Z. Feng, X. Ma, A. C. Zauha, Y. Wang and Y. Wang, Small, 2022, 18, 2201086 CrossRef CAS PubMed.
- Y. J. Nam, D. Y. Oh, S. H. Jung and Y. S. Jung, J. Power Sources, 2018, 375, 93 CrossRef CAS.
- X. Yu, L. Xue, J. B. Goodenough and A. Manthiram, Adv. Funct. Mater., 2021, 31, 2002144 CrossRef CAS.
- F. Tsuji, N. Tanibata, A. Sakuda, A. Hayashi and M. Tatsumisago, Chem. Lett., 2018, 47, 13–15 CrossRef CAS.
- X. Zheng, J. Wu, X. Wang and Z. Yang, Chem. Eng. J., 2022, 446, 137194 CrossRef CAS.
- S. Ohno and W. G. Zeier, Nat. Energy, 2022, 7, 686–687 CrossRef.
- S. Kmiec, E. Ruoff, J. Darga, A. Bodratti and A. Manthiram, ACS Appl. Mater. Interfaces, 2023, 15, 20946–20957 CrossRef CAS.
- S. Bernardini, F. Bellatreccia, A. Casanova Municchia, G. Della Ventura and A. Sodo, J. Raman Spectrosc., 2019, 50, 873–888 CrossRef CAS.
- R. Stoyanova, D. Carlier, M. Sendova-Vassileva, M. Yoncheva, E. Zhecheva, D. Nihtianova and C. Delmas, J. Solid State Chem., 2010, 183, 1372–1379 CrossRef CAS.
- J. H. Stansby, N. Sharma, M. Avdeev, H. E. A. Brand, B. Johannessen, E. Gonzalo, N. E. Drewett, N. Ortiz-Vitoriano and T. Rojo, Chem. Mater., 2021, 33, 3905–3914 CrossRef CAS.
- C. Zhao, Q. Yang, F. Geng, C. Li, N. Zhang, J. Ma, W. Tong and B. Hu, ACS Appl. Mater. Interfaces, 2021, 13, 360–369 CrossRef CAS.
- L. Ramanauskaite and V. Snitka, Nanoscale Res. Lett., 2015, 10, 133 CrossRef PubMed.
- A. Akbari, R. Yegani and B. Pourabbas, Colloids Surf., A, 2015, 484, 206–215 CrossRef CAS.
- Z. Cheng, B. Zhao, Y. J. Guo, L. Yu, B. Yuan, W. Hua, Y. X. Yin, S. Xu, B. Xiao, X. Han, P. F. Wang and Y. G. Guo, Adv. Energy Mater., 2022, 12, 2103461 CrossRef CAS.
- C. Zhao, Z. Yao, Q. Wang, H. Li, J. Wang, M. Liu, S. Ganapathy, Y. Lu, J. Cabana, B. Li, X. Bai, A. Aspuru-Guzik, M. Wagemaker, L. Chen and Y.-S. Hu, J. Am. Chem. Soc., 2020, 142, 5742–5750 CrossRef CAS PubMed.
- E. de la Llave, E. Talaie, E. Levi, P. K. Nayak, M. Dixit, P. T. Rao, P. Hartmann, F. Chesneau, D. T. Major, M. Greenstein, D. Aurbach and L. F. Nazar, Chem. Mater., 2016, 28, 9064–9076 CrossRef CAS.
- J. Hu, L. Li, E. Hu, S. Chae, H. Jia, T. Liu, B. Wu, Y. Bi, K. Amine, C. Wang, J. Zhang, J. Tao and J. Xiao, Nano Energy, 2021, 79, 105420 CrossRef CAS.
- P. Gijsman, e-Polym., 2008, 8(1), 65 Search PubMed.
- A. Collier, H. Wang, X. Zi Yuan, J. Zhang and D. P. Wilkinson, Int. J. Hydrogen Energy, 2006, 31, 1838–1854 CrossRef CAS.
- Z. S. Stillman, B. M. Jarai, N. Raman, P. Patel and C. A. Fromen, Polym. Chem., 2020, 11, 568–580 RSC.
- X. Yang, M. Jiang, X. Gao, D. Bao, Q. Sun, N. Holmes, H. Duan, S. Mukherjee, K. Adair, C. Zhao, J. Liang, W. Li, J. Li, Y. Liu, H. Huang, L. Zhang, S. Lu, Q. Lu, R. Li, C. V. Singh and X. Sun, Energy Environ. Sci., 2020, 13, 1318–1325 RSC.
- J. Mindemark, M. J. Lacey, T. Bowden and D. Brandell, Prog. Polym. Sci., 2018, 81, 114–143 CrossRef CAS.
- G. Lu, Y. Zhang, J. Zhang, X. Du, Z. Lv, J. Du, Z. Zhao, Y. Tang, J. Zhao and G. Cui, Carbon Energy, 2022, 5(2), e287 CrossRef.
- Z. Lin, Q. Xia, W. Wang, W. Li and S. Chou, InfoMat, 2019, 1, 376–389 CrossRef CAS.
- S. Periyasamy, P. Subramanian, E. Levi, D. Aurbach, A. Gedanken and A. Schechter, ACS Appl. Mater. Interfaces, 2016, 8, 12176 CrossRef CAS.
Footnote |
| † Electronic supplementary information (ESI) available. See DOI: https://doi.org/10.1039/d3ta05790a |
| This journal is © The Royal Society of Chemistry 2024 |

![[thin space (1/6-em)]](https://www.rsc.org/images/entities/char_2009.gif) :
: