 Open Access Article
Ultralow thermal conductivity in defect pyrochlores: balancing mass fluctuation scattering and rattling modes†
Natasha
Ormerod
a,
Anthony V.
Powell
 *a,
Ricardo
Grau-Crespo
 a,
Richard K. B.
Gover
b and
Christina J.
Cox
b
aDepartment of Chemistry, University of Reading, Whiteknights, Reading, RG6 6DX, UK. E-mail: a.v.powell@reading.ac.uk
bAWE Plc, Reading RG7 4PR, Berks, UK
First published on 29th July 2024
Abstract
Defect pyrochlores are promising candidates for thermally-insulating materials for use in technological applications. Preparation of materials of general formula K1−xCsxTa1−yNbyWO6 (0 ≤ x ≤ 1; y = 0, 0.5) has enabled the impact on thermal conductivity of chemical substitution at both framework and non-framework sites to be investigated. Water is detected in the as-prepared potassium-containing materials (x < 1.0) below 200 °C, the amount of which correlates with the potassium content. Structural changes on dehydration have been followed by synchrotron powder X-ray diffraction, which reveals migration of the K+ cations towards the centre of metal–oxide cages as water is removed. Measurements of thermal diffusivity reveal that partial substitution of both non-framework A-cations and the B-type framework cations reduces the thermal conductivity of KTaWO6 by up to 33%. The magnitude of the thermal conductivity is determined by the competition between increased mass-fluctuation scattering and the decrease in the energy of the rattling mode, as potassium is progressively replaced by caesium. This is consistent with Einstein temperatures θE = 87 K and θE = 109 K, determined experimentally for the rattling vibrations of Cs+ and K+ respectively, and with our ab initio molecular dynamics simulations. The minimum thermal conductivity, κ = 0.46 W m−1 K−1, for the anhydrous materials, is observed at 300 °C in the partially-substituted phase, K0.75Cs0.25Ta0.5Nb0.5WO6.
Introduction
Thermally insulating materials play a key role in a number of advanced technological areas, including thermal-barrier coatings in gas turbines1,2 and combustion engines,3 optoelectronic devices,4 photovoltaics5 and thermal batteries.6 Improved thermally-insulating materials offer scope for enhanced performance. For example, application of a thermal barrier coating to metal alloy turbine blades, used in propulsion units in the aviation and maritime sectors, extends the operating temperature of the turbine,7 above the melting point of the blade material.8 As the efficiency of a gas turbine increases with temperature,9 the use of improved thermally-insulating materials offers efficiency gains.10,11 Similarly, in combustion engines where thermally-insulating materials are used as coatings on pistons and combustion chambers, reducing heat losses through improved thermal insulation increases the proportion of heat available to perform useful work. This improves the efficiency,12 while also reducing soot deposits13 and NOx emissions.14 In a thermal battery, where a metal oxide or sulphide cathode15 is separated from a Li-alloy anode16 by an electrolyte17 that is solid at normal temperatures and pressures, a heat pulse supplied by ignition of a pyrotechnic,18 melts the electrolyte allowing current to flow. Improved thermal insulation around the battery extends the time for which the battery is operational, by delaying re-solidification of the electrolyte. Improvements in the performance of the thermal insulator also enables the amount of insulating material and hence, the overall size of the battery package to be reduced.The current material of choice for thermal insulation in thermal batteries typically consists of a combination of alumino-silicate Fiberfrax® material and a silica-titania-quartz composite, which has a thermal conductivity <1 W m−1 K−1 at 700 °C.19 These materials, however, are compressible and can have unfavourable mechanical properties under the operating conditions of thermal batteries.20–23 Therefore, there is considerable interest in developing higher-efficiency thermally-insulating materials for use in thermal batteries and other technological applications.
In addition to the potential applications of thermally-insulating materials, there is also an intrinsic interest in understanding the factors which contribute to a reduction in thermal conductivity in solids. There are two principal contributors to heat transport in a solid. Heat is transported by free charge carriers, leading a material such as a metal, with a high concentration of charge carriers, to have a much higher thermal conductivity than an electrical insulator. In materials with low concentration of free charge carriers, heat is mainly transported through lattice vibrations (phonons), with the lower energy acoustic phonons contributing most to thermal transport. Scattering of these heat-carrying phonons can be an effective way of reducing the thermal conductivity of a material, but as demonstrated below, there is an interplay and competition between the mechanisms by which this can be achieved.
Current thermal barrier coatings commonly exploit complex oxides which adopt the pyrochlore structure, as the thermally-insulating material.24 There are several examples of oxide pyrochlores with thermal conductivities below 2 W m−1 K−1 at 700 °C, including Ln2Zr2O7 (Ln = La, Nd, Sm, Gd) (κ = 1.6 W m−1 K−1 at 700 °C![[thin space (1/6-em)]](https://www.rsc.org/images/entities/char_2009.gif) 25) and high-entropy pyrochlores (La0.2Nd0.2Gd0.2Y0.2A0.2)2Zr2O7 (A = Sm, Eu) (κ = 0.875 W m−1 K−1 at 600 °C.26 Attractive features of such materials include their electrically-insulating behaviour, their stability above 600 °C and the fact that they remain stable when subjected to high pressures.27
25) and high-entropy pyrochlores (La0.2Nd0.2Gd0.2Y0.2A0.2)2Zr2O7 (A = Sm, Eu) (κ = 0.875 W m−1 K−1 at 600 °C.26 Attractive features of such materials include their electrically-insulating behaviour, their stability above 600 °C and the fact that they remain stable when subjected to high pressures.27
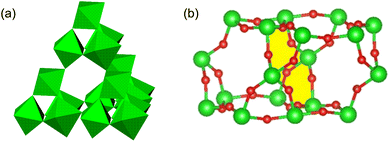
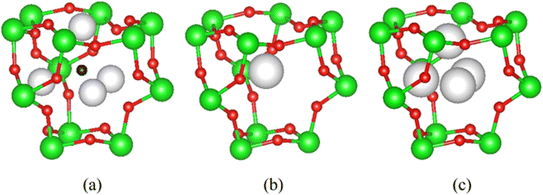
Pyrochlores28 crystallise in a cubic structure, described in the space group Fd![[3 with combining macron]](https://www.rsc.org/images/entities/char_0033_0304.gif) m, with general formula A2B2O7 (A = rare earth, B = transition metal). The pyrochlore structure consists of a network of vertex-linked BO6 octahedra, forming an open framework of stoichiometry B2O6 (Fig. 1a). This framework contains cages, entry to which is via either 12-membered B6O6 rings or six-membered B3O3 rings. Adjacent cages are fused through the 12-membered rings (Fig. 1b). Each cage in the A2B2O7 pyrochlore structure (Fig. 2a) has an oxide ion in the centre at a fully-occupied 8b site (3/8, 3/8, 3/8) and A-cations in fully-occupied 16d sites (0.5, 0.5, 0.5) located on each of the four cage faces defined by the 12-membered B6O6 rings.
m, with general formula A2B2O7 (A = rare earth, B = transition metal). The pyrochlore structure consists of a network of vertex-linked BO6 octahedra, forming an open framework of stoichiometry B2O6 (Fig. 1a). This framework contains cages, entry to which is via either 12-membered B6O6 rings or six-membered B3O3 rings. Adjacent cages are fused through the 12-membered rings (Fig. 1b). Each cage in the A2B2O7 pyrochlore structure (Fig. 2a) has an oxide ion in the centre at a fully-occupied 8b site (3/8, 3/8, 3/8) and A-cations in fully-occupied 16d sites (0.5, 0.5, 0.5) located on each of the four cage faces defined by the 12-membered B6O6 rings.
When the A-cation is relatively large and polarisable, the closely-related defect pyrochlore structure may be adopted by materials of general formula AB2O6.20 The defect pyrochlore structure contains the same B2O6 framework of octahedra but there is no oxide ion at the cage centre. In this case, each cage contains a single A cation, the location of which depends on the identity of A. For example, in CsTaWO6,29 the relatively large Cs+ cation (r = 1.67 Å![[thin space (1/6-em)]](https://www.rsc.org/images/entities/char_2009.gif) 30) is located at a fully-occupied 8b site31 at the centre of each cage (Fig. 2b). In the potassium analogue, KTaWO6,32 the smaller K+ cations (r = 1.38 Å
30) is located at a fully-occupied 8b site31 at the centre of each cage (Fig. 2b). In the potassium analogue, KTaWO6,32 the smaller K+ cations (r = 1.38 Å![[thin space (1/6-em)]](https://www.rsc.org/images/entities/char_2009.gif) 22) occupy 25% of the 32e sites (x, x, x; 0.375 < x < 0.5).33 The 32e sites are located along the vertices of an expanding tetrahedron centred at the 8b position (Fig. 2). An increase in the value of the x-coordinate corresponds to cations moving from the cage centre towards the cage faces, until the position (½,½,½) (16d) located at the faces of the cage, is reached.
22) occupy 25% of the 32e sites (x, x, x; 0.375 < x < 0.5).33 The 32e sites are located along the vertices of an expanding tetrahedron centred at the 8b position (Fig. 2). An increase in the value of the x-coordinate corresponds to cations moving from the cage centre towards the cage faces, until the position (½,½,½) (16d) located at the faces of the cage, is reached.
In the defect pyrochlore structure, the small size of the A-cation relative to the cavity volume results in a relatively weak bonding interaction between the A-cation and the oxide ions of the framework. This results in localised vibrational modes of the A-cations, often termed rattling vibrations, within the cavity.34 Such localised vibrational modes, which are well studied in compounds such as skutterudites, are often described as Einstein oscillators because their heat capacity contribution is given by Einstein's model for the heat capacity of a system of independent oscillators.35 Rattling modes have been exploited to effect reductions in thermal conductivity, in a range of materials adopting cage-like structures. The smaller the A-cation, relative to the size of the cage in which it is located, the greater its amplitude of vibration is likely to be.36,37 The behaviour of A-cations as Einstein oscillators in defect pyrochlores provides a mechanism for scattering heat-carrying phonons and reducing the thermal conductivity. This is exemplified by the stoichiometric quaternary phases, CsTaWO6 and KTaWO6, which exhibit thermal conductivities as low as 0.85 W m−1 K−1 and 0.6 W m−1 K−1 respectively.38 KTaWO6 has the lowest reported thermal conductivity for an oxide with the defect pyrochlore structure. The effectiveness of the smaller K+ cation in reducing thermal conductivity has been attributed to the greater size mismatch with the surrounding cavity,38 while in the related pyrochlore oxides, β-AOs2O6 (A = K, Rb, Cs), Shoko et al.39 have shown by molecular dynamics calculations that movement of the smaller K+ cation within an oxide cavity is less restricted, permitting a greater range of motions, and hence spectral broadening. This offers the potential for interactions with a wider range of the phonon spectrum. A similar demonstration of the effectiveness of the lighter K+ cation in reducing thermal conductivity is provided by antimony clathrates.40
A number of approaches to achieving ultra-low thermal conductivities (κ < 1 m−1 K−1) have recently been reported, including anharmonicity in mixed-anion systems,41 the presence of weakly bound cations,42 mass and strain fluctuation in high entropy phases43,44 and the presence of different structural motifs, leading to a hierarchy of bond strengths.45 In this work we have sought to exploit chemical substitution of both the framework and non-framework cations of KTaWO6, to effect reductions in thermal conductivity. New series of materials of general formula K1−xCsxTa1−yNbyWO6 (0 ≤ x ≤ 1; y = 0, 0.5) have been prepared, which demonstrate that reductions in thermal conductivity of up to ca. 33% can be achieved. In seeking to understand the properties of these materials, comprehensive structural investigations have been carried out using synchrotron X-ray powder diffraction, together with complementary computational studies of the dynamical properties.
Experimental and computational methods
Materials of general formula K1−xCsxTa1−yNbyWO6 (0 ≤ x ≤ 1; y = 0, 0.5) were synthesised by high-temperature methods. Mixtures of K2CO3, Cs2CO3, Nb2O5, Ta2O5 and WO3 powders (all Alfa Aesar, 99%) of the appropriate stoichiometry were ground together using an agate pestle and mortar. Mixtures were placed in alumina crucibles and heated in air at 850 °C for 24 hours then cooled at the natural cooling rate of the furnace. Powders were re-ground and cold-pressed into pellets which were sintered at 850 °C in an alumina crucible for a further 24 hours before cooling to room temperature at the natural rate of the furnace. For a sub-set of compositions, powders were consolidated by hot pressing using equipment constructed in house. As-prepared powders were loaded into graphite dies and heated at 500 °C under a pressure of 100 MPa for 60 minutes. Densities of consolidated materials prepared both by cold pressing and sintering and by hot pressing were determined by the Archimedes method using an AE Adam PW 184 balance. Cold pressing and sintering produced pellets with densities of ca. 91% of the crystallographic values. Although slightly higher densities (ca. 94% of crystallographic values) were obtained by hot pressing, this slight increase has little impact on the measured thermal conductivity, which shows a variation of <2%. Measurement of the longitudinal (vl) and transverse (vt) sound velocities were carried out at room temperature, on an ingot of dimensions: 12.7 mm (diameter) × 2.5 mm (thickness), using an Olympus 38DL PLUS Ultrasonic thickness gauge. Laboratory powder X-ray diffraction data for all products were collected at room temperature using a Bruker D8 Discover diffractometer (λ = 1.5406 Å). Data were collected over the angular range 10 ≤ 2θ/° ≤ 70, at steps of 2θ = 0.0145° in detector position, with a total counting time of 60 minutes. Synchrotron powder X-ray diffraction data were collected over the angular range 3 ≤ 2θ/° ≤ 70, using the I11 beamline46 at the Diamond Light Source, with a wavelength λ = 0.8254 Å. Data were collected at room temperature using the MAC detector with a counting time of 30 minutes. Data over the temperature range 25 ≤ T/°C ≤ 600 were collected using a position sensitive detector (PSD). The temperature was ramped continuously at 0.1 °C s−1 using a hot air blower and each data collection was carried out over a 40 s period. Least-squares Rietveld refinement was performed on synchrotron X-ray diffraction data using the GSAS program.47,48Thermogravimetric analysis was conducted using a TGA Q50 instrument (TA Instruments). Approximately 20 mg of the powdered compound was placed inside a pre-weighed alumina crucible and mounted on the instrument balance. The sample was heated from room temperature to 300 °C at a rate of 10 °C min−1 under a 60 ml min−1 flow of N2.
Infrared spectra were obtained using a PerkinElmer Spectrum 100 FTIR instrument fitted with an attenuated total reflectance (ATR) plate. Data were collected across the wavenumber range 1200 ≤ ![[small nu, Greek, macron]](https://www.rsc.org/images/entities/i_char_e0ce.gif) /cm−1 ≤ 4200, at a resolution of 4 cm−1.
/cm−1 ≤ 4200, at a resolution of 4 cm−1.
The thermal diffusivity (α) of cold-pressed and sintered pellets of K1−xCsxTa1−yNbyWO6 (0 ≤ x ≤ 1; y = 0, 0.5) in the temperature range 25 ≤ T/°C ≤ 300 was determined using a Netsch LFA 447 instrument. Top and bottom surfaces of the pellets were coated with a thin layer of graphite before performing measurements. Diffusivity data were converted into thermal conductivity (κ) using κ = αCpmρ, where Cpm is the specific heat capacity, determined by the Dulong–Petit law (0.394 ≤ Cpm/J g−1 K−1 ≤ 0.492), and ρ is the experimentally-determined density.
Ab initio molecular dynamics simulations (AIMD) were used to obtain the cation–cation radial distribution functions for K0.75Cs0.25TaWO6. Models of the material were created by using the Site Occupancy Disorder (SOD) program49 to generate a special quasirandom structure (SQS),50 representing the B cation disorder amongst the 16c positions. The dynamic behaviour of the SQS models was then studied by AIMD simulations using the CP2K software,51 which implements the calculation of interatomic forces via density functional theory (DFT); in this work, in the generalised gradient approximation with the Perdew–Burke–Ernzerhof (PBE) exchange–correlation functional.52 Simulations were performed at constant volume and temperature (298 K), using the NVT ensemble. The timestep of the simulations was 1 fs, and the total duration of each simulation was 10 ps (10![[thin space (1/6-em)]](https://www.rsc.org/images/entities/char_2009.gif) 000 steps). The output of CP2K was input into the Travis program53 to calculate the radial distribution functions for each ion. In addition, we were able to extend the molecular dynamics simulations to large supercell sizes (up to 8 × 8 × 8) and longer timescales (up to 40 ps) by fitting a machine-learned potential model54 to DFT data, using the “on-the-fly” algorithm implemented within the VASP code.55,56 This allowed us to use the Green–Kubo formula to obtain lattice thermal conductivities from the molecular dynamics simulations, as implemented in the SporTran code.57 Further details about these simulations are provided in the ESI.†
000 steps). The output of CP2K was input into the Travis program53 to calculate the radial distribution functions for each ion. In addition, we were able to extend the molecular dynamics simulations to large supercell sizes (up to 8 × 8 × 8) and longer timescales (up to 40 ps) by fitting a machine-learned potential model54 to DFT data, using the “on-the-fly” algorithm implemented within the VASP code.55,56 This allowed us to use the Green–Kubo formula to obtain lattice thermal conductivities from the molecular dynamics simulations, as implemented in the SporTran code.57 Further details about these simulations are provided in the ESI.†
Results and discussion
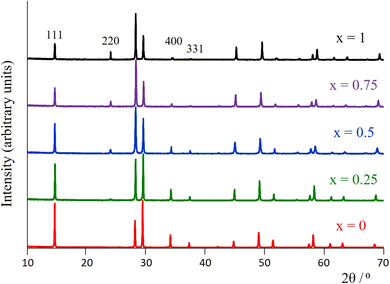
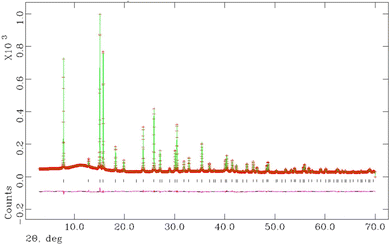
Room-temperature laboratory powder X-ray diffraction patterns (Fig. 3 for y = 0.5, Fig. S1† for y = 0) for all materials of general formula K1−xCsxTa1−yNbyWO6 (0 ≤ x ≤ 1; y = 0, 0.5) as-prepared, can be indexed on the basis of a face-centred cubic unit cell with lattice parameters in the range 10.383 ≤ a/Å ≤ 10.484, consistent with the adoption of a defect pyrochlore structure at all compositions. There is a slight decrease in a with increasing caesium content. A signature of the progressive substitution of potassium by caesium is provided by the increase in the relative intensity of the (220) reflection (2θ ≈ 24°) concomitant with the reduction in that of the (111), (400) and (331) reflections at 2θ ≈ 14°, 34° and 37.5°, respectively.The thermal conductivities of the as-prepared materials with general formula K1−xCsxTa1−yNbyWO6 (0 ≤ x ≤ 1; y = 0, 0.5) in the temperature range 25 ≤ T/°C ≤ 300 are presented in Fig. 4. At a given level of caesium substitution, the thermal conductivity of niobium-containing materials (y = 0.5, Fig. 4(b)) is ca. 10% lower than that of the niobium-free (y = 0, Fig. 4(a)) analogue. This is a consequence of the replacing half of the Ta5+ ions in the metal-oxide framework with the lighter Nb5+, resulting in mass-fluctuation scattering of heat-carrying phonons, which serves to reduce the thermal conductivity. Notably, all materials with compositions corresponding to x < 0.75 exhibit an upturn in κ(T) in the range of 50–200 °C. The extent of this increase in thermal conductivity appears to be related to the amount of potassium present and decreases with increasing levels of substitution of potassium by caesium. The thermal conductivities of the materials measured in the temperature range 25 ≤ T/°C ≤ 300, after first heating to 300 °C and then cooling to 25 °C (Fig. S5†), show no anomaly in κ(T) in the range 50 ≤ T/°C ≤ 200. The absence of such an anomaly in dehydrated materials suggests that it is associated with absorbed water.
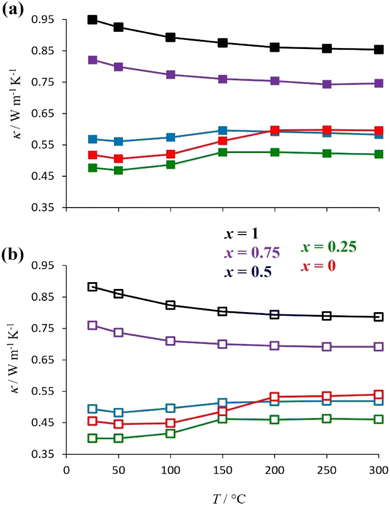 | ||
| Fig. 4 The temperature dependence of the thermal conductivity of as-prepared K1−xCsxTa1−yNbyWO6 (0 ≤ x ≤ 1) with (a) y = 0 and (b) y = 0.5. | ||
Thermogravimetric data (Fig. 5) show a reduction in mass when materials with compositions corresponding to x ≤ 0.75 are heated to 300 °C. This is consistent with the presence of absorbed water in potassium-containing materials; the extent of the mass-decrease showing a marked dependence on potassium content. Materials with higher potassium contents show larger mass losses, consistent with the presence of a larger water content (Table 1). This suggests that absorbed water is coordinated to potassium cations only and that caesium cations do not have associated water. This may be a consequence of the higher charge-density of the smaller K+ cation compared to Cs+, while steric factors may also play a role, with less free volume available to H2O molecules in cages containing the larger Cs+ cation.
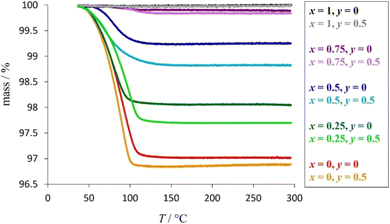 | ||
| Fig. 5 Thermogravimetric data for as-prepared K1−xCsxTa1−yNbyWO6 (0 ≤ x ≤ 1; y = 0, 0.5), with weight losses corresponding to the removal of absorbed water. | ||
| x | y | Q (moles per formula unit) | Q (moles per mole of K) |
|---|---|---|---|
| 0 | 0 | 0.88 | 0.88 |
| 0.5 | 0.86 | 0.86 | |
| 0.25 | 0 | 0.62 | 0.83 |
| 0.5 | 0.61 | 0.81 | |
| 0.5 | 0 | 0.28 | 0.55 |
| 0.5 | 0.30 | 0.61 | |
| 0.75 | 0 | 0.04 | 0.15 |
| 0.5 | 0.04 | 0.17 | |
| 1 | 0 | 0.00 | — |
| 0.5 | 0.00 | — |
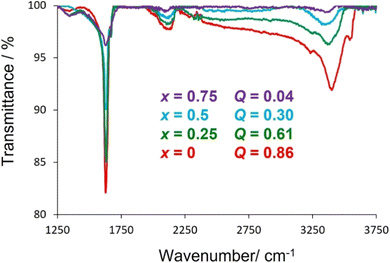
Further evidence for the absorption of water by potassium-containing phases is provided by infrared spectroscopy (Fig. 6), which reveals characteristic localised vibrational modes associated with the stretching vibrations, ν(O–H) ≈ 3550 cm−1, and bending vibrations, δ(H–O–H) ≈ 1635 cm−1, of water. The changes in intensity of these features are consistent with an increase in the amount of absorbed water with increasing potassium content. Positional and orientational disorder associated with the presence of absorbed water introduces further phonon scattering and lowers the thermal conductivity, a behaviour that has been observed in other systems with absorbate molecules.58,59 Furthermore, water bonded to a cation exhibits relatively low energy librational modes, termed rocking, bending and wagging modes,60 the energies of which (38–75 meV) are sufficiently low to interact with heat carrying acoustic modes providing an additional mechanism for reducing thermal conductivity.
Therefore, the anomalies in κ(T) evident in potassium-rich phases (x < 0.75) at temperatures below 200 °C can be associated with the loss of absorbed water, which results in an increase in thermal conductivity due to the removal of the librational and internal vibrational modes. The anomaly is more marked at higher potassium content as there is a larger amount of absorbed water to be lost.
Increasing the temperature of any K1−xCsxTa1−yNbyWO6 (0 ≤ x ≤ 1; y = 0, 0.5) material causes an increase in Umklapp phonon-scattering, contributing to a reduction in thermal conductivity. For phases with x < 0.75, when the temperature is increased across the range 25 ≤ T/°C ≤ 200, the expected decrease in κ(T) is outweighed by the increase in κ(T) from the loss of H2O so the net effect is an upturn in thermal conductivity. However, as shown in Table 1, phases with the lowest potassium content (x = 0.75), have a significantly lower proportion of H2O per mole of K+ compared to those with higher levels of potassium (x < 0.75). The loss of librational and internal vibrational modes upon removal of H2O from materials with x = 0.75 therefore has less of an impact on the overall thermal conductivity compared to those with a larger water content. Consequently for materials with compositions corresponding to x = 0.75, the underlying reduction in thermal conductivity with increasing temperature is not outweighed by the effect on κ(T) of water loss in the temperature range 25 ≤ T/°C ≤ 200.
Final observed, calculated and difference profiles from Rietveld analysis of synchrotron powder X-ray diffraction data for K0.5Cs0.5Ta0.5Nb0.5WO6 collected at room temperature, are presented in Fig. 7, with the profiles for other compositions provided as ESI (Fig. S2).† Refined structural parameters for all materials with y = 0.5 at room temperature are provided in Table 2 and the corresponding structural parameters for materials with y = 0 are presented in the ESI (Table S1).†
| x in K1−xCsxTa0.5Nb0.5WO6 | 0.00 | 0.25 | 0.50 | 0.75 |
|---|---|---|---|---|
a Space group: Fd![[3 with combining macron]](https://www.rsc.org/images/entities/char_0033_0304.gif) m. K on 32e (x, x, x); Cs on 8b (3/8, 3/8, 3/8); Nb, Ta and W on 16c (0, 0, 0); O on 48f (x, 1/8, 1/8). Site occupancy factors are set at values appropriate to the nominal stoichiometry. m. K on 32e (x, x, x); Cs on 8b (3/8, 3/8, 3/8); Nb, Ta and W on 16c (0, 0, 0); O on 48f (x, 1/8, 1/8). Site occupancy factors are set at values appropriate to the nominal stoichiometry.
|
||||
| a/Å | 10.48204(2) | 10.46094(1) | 10.42054(3) | 10.39582(1) |
| x(K) | 0.4829(2) | 0.4794(3) | 0.4681(1) | 0.4404(2) |
| U iso(K)/Å2 | 0.044(1) | 0.040(3) | 0.044(2) | 0.040(5) |
| x(O) | 0.3008(4) | 0.3186(3) | 0.3178(4) | 0.3107(1) |
| U iso(O)/Å2 | 0.0191(1) | 0.0148(2) | 0.0260(3) | 0.0244(2) |
| U iso(Ta/Nb/W)/Å2 | 0.00492(1) | 0.00533(1) | 0.00651(4) | 0.00672(8) |
| R wp/% | 3.25 | 3.45 | 3.01 | 2.56 |
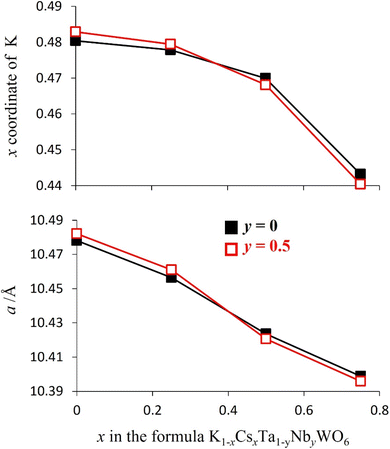
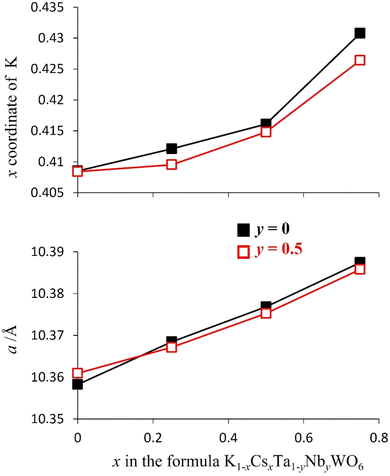
Rietveld refinement reveals that at room temperature, as the amount of caesium increases, the unit cell parameter, a, decreases (Fig. 8). This a(x) dependence is the opposite to that expected on the basis of the relative sizes of the Cs+ and K+ cations.22 The origin of this compositional dependence of the unit cell parameter is associated with the presence of absorbed water, which is coordinated to the potassium cations, thereby increasing their effective size over that of the bare, water-free caesium cations. Substitution therefore effectively corresponds to replacement of larger [K(H2O)n]+ species with smaller Cs+ cations. Rietveld refinement also demonstrates that for all mixed (K, Cs) phases, Cs+ ions are located exclusively in 8b sites at the cage centre (3/8, 3/8, 3/8) as in the end-member (x = 1) quinary phase, while K+ cations are located at 32e sites only, as in the other end-member phase (x = 0). As noted above, 32e sites correspond to locations (x, x, x) on the vertices of a tetrahedron centred at the 8b position. The coordinate (x) of a potassium ion depends on the potassium content. A higher potassium content, which corresponds to a higher water content, leads to an increase in the x-coordinate (Fig. 8). This corresponds to the potassium cation being located closer to the faces of the cage, which maximises hydrogen bonding interactions between the coordinated water molecules and the oxide ions of the framework.
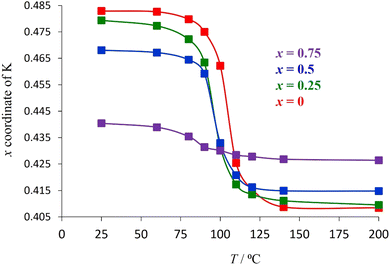
To examine the extent to which the presence of water affects the potassium position in each material, synchrotron powder X-ray diffraction data were collected over the temperature range 25 ≤ T/°C ≤ 200 (Fig. 9 for y = 0.5, Fig. S3† for y = 0), enabling the migration of the K+ cation on dehydration to be followed. Rietveld refinement reveals that, on heating, the x-coordinate of potassium (32e, (x, x, x)) decreases markedly at the temperature at which thermogravimetric data reveal that water is lost from the material. This corresponds to movement of the K+ cation towards the cage centre as water is removed and hydrogen-bonding interactions with the framework are lost. The magnitude of the shift of the K+ cation in any particular material across the temperature range 25 ≤ T/°C ≤ 200 is consistent with the amount of water present in the as-prepared phase, which provides further evidence that the increase in the x co-ordinate of potassium with increasing potassium content in the as-prepared materials (Fig. 8) is due to the increased proportion of water co-located in the cages with potassium.
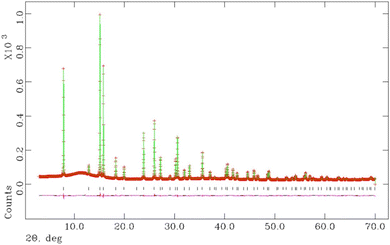
Above 200 °C, all K1−xCsxTa1−yNbyWO6 (0 ≤ x ≤ 0.75; y = 0, 0.5) materials are anhydrous. Refined parameters from Rietveld refinement using synchrotron X-ray diffraction data collected at 200 °C are presented in Table 3 for materials with y = 0.5 and the corresponding structural parameters for y = 0 are provided in the ESI (Table S2).† The final output profiles for K0.5Cs0.5Ta0.5Nb0.5WO6 appear in Fig. 10, while the corresponding profiles for the other compositions are provided in the ESI (Fig. S4).†
| x in K1−xCsxTa0.5Nb0.5WO6 | 0.00 | 0.25 | 0.50 | 0.75 |
|---|---|---|---|---|
a Space group: Fd![[3 with combining macron]](https://www.rsc.org/images/entities/char_0033_0304.gif) m. K on 32e (x, x, x); Cs on 8b (3/8, 3/8, 3/8); Nb, Ta and W on 16c (0, 0, 0); O on 48f (x, 1/8, 1/8). Site occupancy factors are set at values appropriate to the nominal stoichiometry. m. K on 32e (x, x, x); Cs on 8b (3/8, 3/8, 3/8); Nb, Ta and W on 16c (0, 0, 0); O on 48f (x, 1/8, 1/8). Site occupancy factors are set at values appropriate to the nominal stoichiometry.
|
||||
| a/Å | 10.36090(1) | 10.36711(3) | 10.37523(4) | 10.38581(1) |
| x(K) | 0.4084(4) | 0.4095(2) | 0.4148(5) | 0.4264(1) |
| U iso(K)/Å2 | 0.074(4) | 0.068(6) | 0.076(1) | 0.070(2) |
| x(O) | 0.3142(2) | 0.3193(5) | 0.31625(8) | 0.3103(2) |
| U iso(O)/Å2 | 0.0260(2) | 0.0275 (2) | 0.0283(3) | 0.028(1) |
| U iso(Ta/Nb/W)/Å2 | 0.00915(9) | 0.00998(2) | 0.01302(6) | 0.00997(8) |
| R wp/% | 3.13 | 2.52 | 2.39 | 3.06 |
In contrast with the as-prepared materials, the compositional dependence of the unit-cell parameter of the dehydrated materials follows the behaviour expected on the basis of the respective ionic radius (Fig. 11), the unit cell parameter increasing with increasing caesium content, providing further support for the role of water in increasing the effective size of the potassium cation in the as-prepared materials. In addition, in the anhydrous materials, with increasing caesium content, the K+ cation moves closer towards the faces of the cage (Fig. 9 and 11): the opposite of the behaviour observed in the as-prepared hydrated materials (Fig. 8).
There is no water present in the structural cages at 200 °C and so each K+ ion is more strongly affected by inter-cage electrostatic repulsions compared to the as-prepared materials at 25 °C. With increasing Cs content in the material, each K+ ion becomes increasingly likely to be adjacent to a cage containing a Cs+ ion rather than a K+ ion. Cs+ ions are always located in the centre of their cages and are larger than K+ ions (therefore less charge dense than K+). The energetically optimum location for a K+ ion within its (anhydrous) cage depends on the balance between its attraction to the framework oxide ions and its repulsion with the A-cations in adjacent cages. If a K+ ion is adjacent to a Cs-containing cage then that K+ ion experiences less inter-cage A-cation repulsion (than if it was adjacent to a K+-containing cage). This allows the K+ ion to be located closer towards the edge of its cage where it can experience a greater overall attraction to the framework oxide ions (compared to in the centre of its cage). Since a K+ ion is increasingly likely to be located adjacent to a cage containing a Cs+, as the caesium content increases, in the anhydrous compounds at 200 °C, the x-coordinate of K+ increases (K+ is located closer towards the edge of a cage) with increasing amounts of Cs+ (Fig. 9 and 11). The observation that the K+ ions are slightly off-centre (x co-ordinate > 0.375) in all materials suggests that it is more energetically favourable overall for each K+ ion to experience a stronger attraction to the six oxide ions of one particular ‘B6O6’ face than to experience a weaker attraction to a greater number of oxide ions (from all cage-faces equally). For the larger Cs+ ions, however, the opposite is true and Cs+ ions are located exclusively in the centre of the cage (x co-ordinate = 0.375) in which they reside.
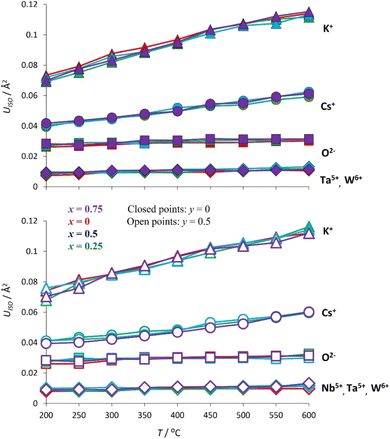
Rietveld refinement using synchrotron X-ray diffraction data, collected over the temperature range 200 ≤ T/°C ≤ 600, reveals that at all temperatures the atomic displacement parameter (Uiso) of the non-framework (A) cations are larger than those of the framework ions (Fig. 12). Moreover, Uiso of K+ exceeds that of Cs+ at all compositions. The large values of Uiso are consistent with the non-framework cations undergoing localised vibrational modes within the cavity, the energy of the modes associated with K+ being larger than those of Cs+. At temperatures above the Debye temperature, θD, (estimated as 238 K for CsTaWO6 and 197 K KTaWO6 from speed of sound measurements, see Table S4†), the Einstein temperature (θE) of each of the non-framework cations can be determined61 from the gradient of Uiso(T) for each cation, through the expression:
Further support for this view is provided by computational modelling. Molecular dynamics simulations were conducted to determine the cation–cation radial distribution functions (RDFs) for K0.75Cs0.25TaWO6 at 25 °C (Fig. 13). The width of each peak corresponds to a measure of the variation in position of each ion about its equilibrium position. As is evident from Fig. 13, the peak in the A–A RDF for each of the two A-cations is significantly broader than for the Ta–Ta RDF. This is consistent with the A-cation undergoing a localised vibrational mode within an effectively static framework structure. Similarly, the greater width of the K–K peak compared to that of the Cs–Cs peak, indicates the amplitude is greater for K+ than for Cs+.
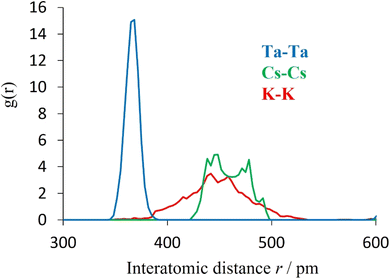 | ||
| Fig. 13 Cation–cation radial distribution functions of K0.75Cs0.25TaWO6 at 25 °C, from ab initio molecular dynamics. | ||
The thermal conductivity of the anhydrous K1−xCsxTa1−yNbyWO6 (0 ≤ x ≤ 1; y = 0, 0.5) materials (Fig. 14) initially decreases by ca. 14% when potassium is replaced by caesium but then proceeds to increase with increasing levels of substitution until the end member (x = 1) phase is reached. The same trend is observed irrespective of framework composition, with niobium-containing materials (y = 0.5) exhibiting lower thermal conductivities than their niobium-free analogues (y = 0). The initial decrease in thermal conductivity may be associated with an increase in mass fluctuation scattering of phonons when the lighter K+ cation is replaced by the heavier Cs+ cation.
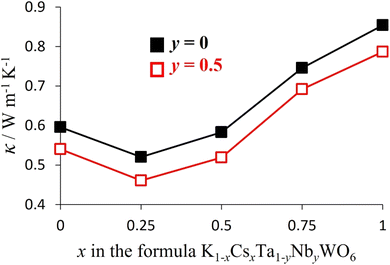 | ||
| Fig. 14 The compositional dependence of the thermal conductivity of K1−xCsxTa1−yNbyWO6 (0 ≤ x ≤ 1; y = 0, 0.5) at 300 °C. | ||
On the basis of mass fluctuation scattering alone, it would be expected that the compositional dependence of thermal conductivity, κ(x), would exhibit its lowest values at x = 0.5. The observed κ(x) dependence, however, reveals the lowest thermal conductivity occurs for materials with compositions corresponding to x = 0.25. As discussed above, the lighter K+ cation exhibits a higher-energy, higher amplitude localised vibrational mode compared with the heavier Cs+ cation. This suggests the rattling modes of K+ may be more effective in scattering heat-carrying phonons. Consequently, the measured thermal conductivity represents a balance between an increase in mass fluctuation scattering which increases phonon scattering, and a reduction in A-cation rattling which decreases phonon scattering, as potassium is progressively replaced by caesium. The differing impact of these two factors is likely to be responsible for the minimum thermal conductivity occurring at a composition in which fewer than half of the potassium cations have been substituted. This suggests the localised vibrational modes have a greater influence than the mass differences between the two A-site cations. Ohtaki and Miyaishi38 have demonstrated that fitting Slack-type conventional models to the thermal conductivity data for defect pyrochlores ATaWO6 (A = K, Rb, Cs) leads to the incorrect sequence of values of κ, with κ(K) > κ(Rb) > κ(Cs), and unrealistically high absolute values. This failure of the applicability of conventional models was attributed to the absence of terms due to rattling vibrations in the models. In contrast, our molecular dynamics simulations, provide a firmer basis for the theoretical analysis of our results, including scattering due to rattling modes. For pure CsTaWO6, the room-temperature thermal conductivity calculated from the Green–Kubo method was 0.89 W m−1 K−1, which decreased to 0.56 W m−1 K−1 for the solid with half of the Cs atoms replaced by K (i.e. K0.5Cs0.5TaWO6). These computed values compare favourably with the experimental values of 0.95 W m−1 K−1 and 0.60 W m−1 K−1, respectively. The theoretical model therefore provides good agreement with experiment in both the absolute values of κ (within less than 0.1 W m−1 K−1, or around 7%) and in the variation upon K substitution, suggesting that other scattering mechanisms not accounted for in this model, such as those from defects or grain boundaries, play a relatively minor role.
Conclusions
The partial substitution of cations at framework and non-framework sites has been shown to reduce the thermal conductivity of the defect pyrochlore KTaWO6. The lowest thermal conductivity at 25 °C (κ = 0.40 W m−1 K−1), exhibited by as-prepared K0.75Cs0.25Ta0.5Nb0.5WO6, which contains 0.81 moles of H2O per potassium cation, represents a 33% reduction from that of the quaternary phase (KTaWO6) at this temperature. The corresponding anhydrous phase exhibits the lowest thermal conductivity (κ = 0.46 W m−1 K−1) at 300 °C: a 23% reduction from that of the quaternary phase.Both thermal analysis and infra-red spectroscopy reveal that absorbed water is removed by heating, leading to an increase in thermal conductivity above this temperature. The removal of water is accompanied by subtle structural changes involving the migration of K+ cations towards the cage centre, owing to the loss of hydrogen bonding interactions between coordinated water molecules and the oxide ions of the framework. The ultralow thermal conductivities achieved for this series suggests that these materials may find applications as solid-state thermal insulators, to be used, for example, in thermal batteries. Moreover, the impact of the presence of the molecular species H2O on reducing the thermal conductivity, suggests that the partial replacement of non-framework K+ cations in a defect pyrochlore with alternative, thermally-stable, molecular species with a richer vibrational spectrum, may offer opportunities to effect further reductions in thermal conductivity. More complex molecular species exhibit additional low-energy modes, in addition to the rock, wag and twist modes of coordinated H2O, arising from torsional and deformation modes that may enhance scattering of heat-carrying acoustic phonons, leading to substantial reductions in thermal conductivity.
Data availability
The data supporting this article have been included in the ESI.†Conflicts of interest
There are no conflicts to declare.Acknowledgements
The authors thank AWE for financial support and the Diamond Light Source for synchrotron beam time. We also thank Drs Sarah Day and Stephen Thompson for their assistance in collecting synchrotron X-ray powder diffraction data, Dr Davide Tisi for help with the SporTran code, and the University of Reading for access to the Chemical Analysis Facility for TGA, IR and powder X-ray diffraction. We are grateful to the UK Materials and Molecular Modelling Hub for computational resources in the Young facility, which is partially funded by EPSRC (EP/T022213/1 and EP/W032260/1).References
- N. P. Padture, M. Cell and E. H. Jordan, Science, 2002, 296, 280–284 CrossRef CAS PubMed.
- A. K. Saini, D. Das and M. K. Pathak, Procedia Eng., 2012, 38, 3173–3179 CrossRef CAS.
- R. Prasad and N. Samria, Int. J. Mech. Sci., 1989, 31, 765–777 CrossRef.
- T. Sadi, I. Radevici and J. Oksanen, Nat. Photonics, 2020, 14, 205–214 CrossRef CAS.
- M. A. Green and S. P. Bremner, Nat. Mater., 2017, 16, 23–34 CrossRef PubMed.
- W. E. Kuper, Proceedings of the 36th Power Sources Conference, Cherry Hill, NJ, USA, 1994, pp. 300–309 Search PubMed.
- K. A. Khor and L. H. Yu, Scientometrics, 2020, 125, 1763–1781 CrossRef.
- J. Mulla, F. Kaka and R. K. Satapathy, Crit. Rev. Solid State, 2023 DOI:10.1080/10408436.2023.2245599.
- S. Tailor, R. M. Mohanty and A. V. Doub, Mater. Today: Proc., 2016, 3, 2725–2734 Search PubMed.
- A. G. Evans, D. R. Mumm, J. W. Hutchinson, G. H. Meier and F. S. Pettit, Prog. Mater. Sci., 2001, 46, 505–553 CrossRef.
- D. R. Clarke and S. R. Phillpot, Mater. Today, 2005, 8, 22–29 CrossRef CAS.
- R. Vinayagamoorthy, T. Mothilal and S. Madgavan, Int. J. Adv. Des. Manuf. Technol., 2009, 3, 63–67 Search PubMed.
- S. S. Cheng, SAE Technical Paper, 1994, p. 941892, DOI:10.4271/941892.
- A. Kawaguchi, Y. Wakisaka, N. Nishikawa, H. Kosaka, H. Yamashita, C. Yamashita, H. Iguma, K. Fukui, N. Takada and T. Tomoda, Int. J. Engine Res., 2019, 20, 805–816 CrossRef.
- P. J. Masset and R. A. Guidotti, J. Power Sources, 2008, 178, 456–466 CrossRef CAS.
- R. A. Guidotti and P. Masset, J. Power Sources, 2008, 183, 388–398 CrossRef CAS.
- R. A. Guidotti and P. Masset, J. Power Sources, 2007, 164, 397–414 CrossRef.
- E.-C. Koch, Def. Technol., 2019, 15, 254–263 CrossRef.
- R. A. Guidotti and M. Moss, SAND95-1649, UC-920, Technical Report, Sandia National Laboratory, 1995, DOI:10.2172/102467.
- K. N. Long, M. E. Stavig, C. C. Roberts and L. Mondy, SAND-2017-0370R, Technical Report, Sandia National Laboratory, 2017, DOI:10.2172/1528800.
- A. Headley, M. B. Hileman, A. S. Robbins, E. S. Piekos, E. K. Stirrup and C. C. Roberts, Int. J. Heat Mass Transfer, 2019, 129, 1287–1294 CrossRef.
- A. Headley, M. B. Hileman, A. S. Robbins, E. Piekos, P. Fleig, A. Martinez and C. C. Roberts, Int. J. Heat Mass Transfer, 2019, 135, 1278–1285 CrossRef CAS.
- R. A. Guidotti, S. T. Reed, C. S. Ashley and F. W. Reinhardt, SAE Technical Paper, 34th Intersociety Energy Conversion Engineering Conference, 1999-01-2479, 1999, DOI:10.4271/1999-01-2479.
- R. Vaβen, F. Traeger and D. Stöver, Int. J. Appl. Ceram. Technol., 2005, 1, 351–361 Search PubMed.
- H. Lehmann, D. Pitzer, G. Pracht, R. Vaβen and D. Stover, J. Am. Ceram. Soc., 2004, 86, 1338–1344 CrossRef.
- J. Wu, X. Wei, N. Padture, P. Klemens, M. Gell, E. Garcia, P. Miranzo and M. Osendi, J. Am. Ceram. Soc., 2004, 85, 3031–3035 CrossRef.
- R. Darolia, Int. Mater. Rev., 2013, 58, 316–348 Search PubMed.
- M. A. Subramanian, G. Aravamudan and G. V. Subba Rao, Prog. Solid State Chem., 1983, 15, 55–143 CrossRef CAS.
- T. Kar and R. N. P. Choudhary, Mater. Sci. Eng., B, 2002, 90, 224–233 CrossRef.
- R. D. Shannon, Acta Crystallogr., 1976, 32, 751–767 CrossRef.
- A. V. Knyazev, N. G. Chernorukov, N. N. Smirnova, N. Y. Kuznetsova and A. V. Markin, Thermochim. Acta, 2008, 470, 47–51 CrossRef CAS.
- T. Kar and R. N. P. Choudhary, J. Phys. Chem. Solids, 2001, 62, 1149–1161 CrossRef CAS.
- A. V. Knyazev, M. Maczka and N. Y. Kuznetsova, Thermochim. Acta, 2010, 506, 20–27 CrossRef CAS.
- E. Shoko, V. K. Peterson and G. J. Kearley, J. Phys.: Condens. Matter, 2013, 25, 475404 CrossRef CAS PubMed.
- R. L. P. Hermann, R. Jin, W. Schweika, F. Grandjean, D. Mandrus, B. C. Sales and G. J. Long, Phys. Rev. Lett., 2003, 90, 135505 CrossRef PubMed.
- J. Yamaura, S. Yonezawa, Y. Muraoka and Z. Hiroi, J. Solid State Chem., 2006, 179, 336–340 CrossRef CAS.
- E. Shoko, G. J. Kearley, V. K. Peterson, H. Mutka, M. M. Koza, J. Yamaura, Z. Hiroi and G. J. Thorogood, J. Phys.: Condens. Matter, 2014, 26, 305401 CrossRef PubMed.
- M. Ohtaki and S. Miyaishi, J. Electron. Mater., 2013, 42, 1299–1302 CrossRef CAS.
- E. Shoko, V. K. Peterson and G. J. Kearley, J. Mater. Sci., 2014, 49, 5468–5480 CrossRef CAS.
- K. M. Ciesielski, B. R. Ortiz, L. C. Gomes, V. Meschke, J. Adamczyk, T. L. Brade, D. Kaczorowski, E. Ertekin and E. S. Toberer, Chem. Mater., 2023, 35, 2918–2935 CrossRef CAS.
- J. Mark, W. Zhang, K. Maeda, T. Yamamoto, H. Kageyama and T. Mori, J. Mater. Chem. A, 2023, 1, 10213–10221 RSC.
- T. Pandey, A. S. Nissimagoudar, A. Mishra and A. K. Singh, J. Mater. Chem. A, 2020, 8, 13812–13819 RSC.
- Y. Tang, W. Shu, B. Su, A. Hong, W. Zhai, J. Li, G. Zhou, L. Lin, X. Zhou, Z. Yan, Q. Zhang and J. Liu, J. Mater. Chem. A, 2024, 12, 5464–5473 RSC.
- X. Zhang, M. Huang, H. Li, J. Chen, P. Xu, B. Xu, Y. Wang, G. Tang and S. Yang, J. Mater. Chem. A, 2023, 11, 8150–8161 RSC.
- J. A. Newnham, Q. D. Gibson, T. W. Surta, A. Morscher, T. D. Manning, L. M. Daniels, J. B. Claridge and M. J. Rosseinsky, J. Mater. Chem. A, 2023, 11, 15739–15748 RSC.
- S. P. Thompson, J. E. Parker, J. Potter, T. P. Hill, A. Birt, T. M. Cobb, F. Yuan and C. C. Tang, Rev. Sci. Instrum., 2009, 80, 075107 CrossRef CAS PubMed.
- A. C. Larson and R. B. Von Dreele, Report LAUR 86-748, Los Alamos National Laboratory, 2000.
- B. H. Toby, J. Appl. Crystallogr., 2001, 34, 210–213 CrossRef CAS.
- R. Grau-Crespo, S. Hamad, C. R. A. Catlow and N. De Leeuw, J. Phys.: Condens. Matter, 2007, 19, 256201 CrossRef.
- A. Zunger, S. H Wei, L. G. Ferreira and J. E. Bernard, Phys. Rev. Lett., 1990, 65, 353–356 CrossRef CAS PubMed.
- T. D. Kuhne, et al , J. Chem. Phys., 2020, 152, 194103 CrossRef PubMed.
- J. P. Perdew, K. Burke and M. Ernzerhof, Phys. Rev. Lett., 1996, 77, 3865–3868 CrossRef CAS PubMed.
- M. Brehm, M. Thomas, S. Gehrke and B. Kirchner, J. Chem. Phys., 2020, 152, 164105 CrossRef CAS PubMed.
- R. Jinnouchi, J. Lahnsteiner, F. Karsai, G. Kresse and M. Bokdam, Phys. Rev. Lett., 2019, 122, 225701 CrossRef CAS PubMed.
- G. Kresse and J. Hafner, Phys. Rev. B: Condens. Matter Mater. Phys., 1993, 47, 558 CrossRef CAS PubMed.
- G. Kresse and J. Hafner, Phys. Rev. B: Condens. Matter Mater. Phys., 1994, 49, 14251 CrossRef CAS PubMed.
- L. Ercole, R. Bertossa, S. Bisacchi and S. Baroni, Comput. Phys. Commun., 2022, 280, 108470 CrossRef CAS.
- R. G. Ross, P. Andersson and G. Backstrom, Nature, 1981, 290, 322–323 CrossRef CAS.
- H. Babaei, M. E. DeCoster, M. Jeong, Z. M. Hassan, T. Islamoglu, H. Baumgart, A. J. H. McGaughey, E. Redel, O. K. Farha, P. E. Hopkins, J. A. Malen and C. E. Wilmer, Nat. Commun., 2020, 11, 4010 CrossRef CAS PubMed.
- K. Nakamoto, Infrared and Raman Spectra of Inorganic and Coordination Compounds, Wiley, New York, 1986 Search PubMed.
- B. C. Scales, B. C. Chakoumakos, D. Mandrus and J. W. Sharp, J. Solid State Chem., 1999, 146, 528–532 CrossRef.
Footnote |
| † Electronic supplementary information (ESI) available. See DOI: https://doi.org/10.1039/d3ta06618e |
| This journal is © The Royal Society of Chemistry 2024 |

