 Open Access Article
Creative Commons Attribution 3.0 Unported Licence
A comprehensive investigation of Ag7P3X11 (X = {O, S, and Se}) solid-state silver superionic conductors†
Amin
Niksirat
 a,
Maryam
Soleimani
 a,
Ali Lashani
Zand
 a and
Mahdi
Pourfath
 *ab
*ab
aSchool of Electrical and Computer Engineering, College of Engineering, University of Tehran, Tehran 14395-515, Iran. E-mail: pourfath@iue.tuwien.ac.at; pourfath@ut.ac.ir
bInstitute for Microelectronics, TU Wien, Gusshausstrasse 27–29, A-1040 Vienna, Austria
First published on 8th May 2024
Abstract
This study carefully analyzes and proposes a new class of high-performance inorganic solid-state electrolytes with the composition Ag7P3X11 (X = {O, S, and Se}), using ab initio calculations. The structural and electronic properties, as well as electrochemical stability, were evaluated and discussed. Ionic conductivity of Ag+ was determined through ab initio molecular dynamics simulations at various temperatures. The results indicate that the room-temperature ionic conductivity of Ag7P3Se11 is approximately 13.98 mS cm−1, which is higher than that of most other solid-state electrolytes. The calculated activation energy is relatively low at 0.197 eV. The phenomenon of Ag+ ion transport was systematically studied by analyzing the diffusion minimum-energy pathways using the nudged elastic band (NEB) method. The electronic band gaps of the materials studied, calculated using the HSE06 method, ranged from 1.47 to 2.34 eV. Finally, the feasibility of synthesizing these proposed superionic materials was explored through phase stability calculations, including phonon analysis based on density functional perturbation theory (DFPT), thermodynamic stability, radial distribution function, and Gibbs free energy calculations. The results presented provide a guide for designing stable and safe superionic conductors.
1 Introduction
The accelerated adoption of electric vehicles, mobile electronic and communication devices, and the transition to renewable energy sources have spurred the development of more energy-dense, safe, and cost-effective batteries.1–3 Lithium-ion batteries (LIBs) are favored for their high power and energy density.4–6 Although LIBs with liquid electrolytes provide excellent wetting capabilities and high conductivity,7 they suffer from several drawbacks, including low ion selectivity, inadequate stability, and safety concerns.8 Solid-state electrolytes (SSEs) address these issues,9–11 enhancing safety, electrochemical and thermal stability, energy/power densities, and reducing packaging needs.12–14SSEs are generally categorized into inorganic ceramic electrolytes and organic polymeric electrolytes.15–17 An ideal SSE exhibits high ionic conductivity at room temperature, minimal activation barriers for ion diffusion, limited electronic conductivity, and maintains chemical and electrochemical stability at interfaces with the anode and cathode throughout cycling.18 Extensive research has been conducted on new solid electrolytes such as Li10GeP2S12,19 Li7P3S11,20 Li7La3Zr2O12,21,22 and Li1+2xZn1−xPS4.23 Inorganic ceramic electrolytes typically include oxides24 and sulfides,25 with sulfide-based electrolytes like Li7P3S11 offering high ionic conductivities at room temperature and mechanical properties comparable to traditional liquid electrolytes.26–28
Silver, easily recyclable and thus cost-effective and less resource-intensive,29 exhibits superior chemical stability and temperature sensitivity compared to lithium, making it ideal for battery applications in military and aerospace sectors where higher safety standards are crucial.30,31 The polarizable electron shells and ionic radius of silver facilitate its use as a fast ion medium.32 In this study, inspired by the known sulfide-based superionic conductor Li7P3S11,33 a new class of silver superionic conductors, Ag7P3X11 (X = {O, S, Se}), was explored. Using density functional theory (DFT) and ab initio molecular dynamics simulations (AIMD), the structural and electronic properties, diffusivity, and ion conductivity of Ag7P3X11 were analyzed.
2 Approach
Ab initio molecular dynamics (AIMD) and density functional theory (DFT) calculations, as implemented in the Vienna Ab Initio Simulation Package (VASP),34 were utilized in this study. The projector augmented wave method (PAW) was employed within the Perdew–Burke–Ernzerhof (PBE) form of the generalized gradient approximation (GGA) for structural relaxation,35,36 with a 12 × 6 × 6 k-point grid and a kinetic energy cutoff of 400 eV for sulfides and selenides, and 500 eV for oxides.37 Structural relaxations were carried out until the residual forces and energy differences were smaller than 0.01 eV Å−1 and 10−6 eV, respectively.The structural data for Ag7P3X11 were obtained from the Materials Project database.38 For the electronic property calculations, the triclinic crystal structure with the space group P1 was employed. All atoms were relaxed until the structure reached minimum energy, allowing the shape and volume of the supercell and the positions of the atoms to freely change until the convergence criteria were satisfied. The Heyd–Scuseria–Ernzerhof (HSE06) hybrid functional was also used to accurately evaluate the electronic properties.39
To gain insights into the interactions between Ag ions and anions in Ag7P3X11 (X = {O, S, and Se}) and to assess the extent of charge transfer between these species, Bader charge calculations were utilized.40,41 The nudged elastic band method (NEB) was employed to find the minimum-energy path for Ag+ ion migration42,43 in a large supercell comprising 2 × 2 × 1 unit cells to minimize interactions between periodic images.
AIMD simulations with the canonical ensemble (NVT) within the framework of DFT were performed to investigate diffusivity and conductivity.44,45 A relaxed 2 × 2 × 1 supercell, expanding the 64-atom triclinic unit cell to a total of 246 atoms, was utilized.46 The total AIMD simulation time was 45 ps with a time step of 2 fs, with the first 5 ps designated as equilibration time and therefore not included in the calculations.47 The temperature was controlled using a Nose–Hoover thermostat,48–51 starting at 100 K and subsequently increasing to 600 K, 750 K, 900 K, and 1200 K.52 Throughout the AIMD simulations, the trajectories of all silver ions were monitored, and the total mean squared displacement (TMSD) of silver ions was calculated for each time interval Δt using the following equation:
 | (1) |
 | (2) |
 | (3) |
D = D0![[thin space (1/6-em)]](https://www.rsc.org/images/entities/char_2009.gif) exp(−Ea/(kBT)) exp(−Ea/(kBT)) | (4) |
The atomic environment determines the forces and energy barriers that govern the behavior of diffusing atoms. The radial distribution function (RDF) is instrumental in revealing the density (g) of an element versus the distance (r) from another element during AIMD simulations:
 | (5) |
Thermodynamic stability was assessed by calculating the total energy of phases based on DFT calculations. The stability of any phase was investigated by comparing its energy with the linear combinations of the energies of other phases using the convex hull construction. All compounds listed in the Inorganic Crystal Structure Database (ICSD) and other similar systems were considered.61 The stability was quantified by the energy above the hull, which is always non-negative and indicates the magnitude of a compound's decomposition energy.27
Density functional perturbation theory (DFPT) is a powerful and commonly used ab initio method for phonon calculations.62,63 To avoid instabilities in phonon dispersion,64 a relatively large supercell, a stricter convergence criterion of 10−8 eV, and a 24 × 12 × 12 k-point grid were employed.
3 Results and discussions
3.1 Crystal structure
Yamane et al.38 reported that Li7P3S11 contains PS43− tetrahedra and P2S7 ditetrahedra, with Li ions interspersed between them. This crystal structure served as the foundation for structural relaxation calculations of Ag7P3X11 (X = {O, S, and Se}), where lithium atoms were chemically replaced by silver, and sulfur by oxygen or selenium. The relaxed crystal structure of Ag7P3X11 is depicted in Fig. 1, with the corresponding lattice parameters detailed in Table 1. The calculated structural parameters of Ag7P3X11 closely approximate those of Li7P3S11, and the space group remained unchanged after optimization. However, the unit-cell volume of Ag7P3S11 is larger than that of Li7P3S11 due to the greater ionic radius of Ag+ (129 pm) compared to Li+ (90 pm). The unit cell volume of Ag7P3O11 is approximately 40% smaller than that of Ag7P3S11, whereas the unit cell of Ag7P3Se11 is about 12% larger than Ag7P3S11. These volume differences are significantly influenced by the varying radii of the anions.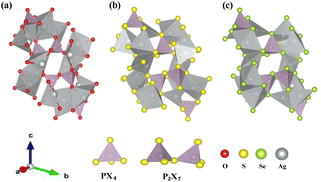 | ||
| Fig. 1 The relaxed crystal structures of (a) Ag7P3O11, (b) Ag7P3S11, and (c) Ag7P3Se11 are presented. These crystals each possess a triclinic structure and belong to the space group P1. | ||
| Composition | a (Å) | b (Å) | c (Å) | α (deg) | β (deg) | γ (deg) | Volume (Å3) | Anion radius (pm) |
|---|---|---|---|---|---|---|---|---|
| Li7P3S11 | 6.18 (6.03) | 12.12 (12.53) | 12.41 (12.50) | 107.54 (113.30) | 102.65 (102.85) | 102.22 (74.47) | 827.58 (829.35) | — |
| Ag7P3O11 | 5.70 | 10.80 | 11.20 | 108.12 | 101.36 | 100.99 | 619.69 | 126 (O2−) |
| Ag7P3S11 | 6.28 | 12.21 | 12.77 | 109.13 | 99.86 | 101.46 | 878.47 | 170 (S2−) |
| Ag7P3Se11 | 6.72 | 13.16 | 13.76 | 109.31 | 102.56 | 99.36 | 1085.14 | 184 (Se2−) |
3.2 Electronic properties
To investigate the intrinsic redox stability of the Ag7P3X11 compounds, the electronic band structure and density of states (DOS) were calculated using the HSE06 functional, as shown in Fig. 2. The bandgap of the material sets an upper limit on its electrochemical window65 and affects the self-discharge rate of electrochemical devices, with a narrower bandgap leading to increased rates. According to the results in Table 2, the studied materials exhibit semiconducting behavior, with the S-substituted Ag7P3S11 materials demonstrating a larger bandgap than the O/Se-substituted Ag7P3X11 (X = {O, Se}), suggesting greater intrinsic redox stability for the S-substituted compounds. Furthermore, the DOS results indicate that the conduction band minimum (CBM) and valence band maximum (VBM), regardless of anion chemistry, are dominated by anion states.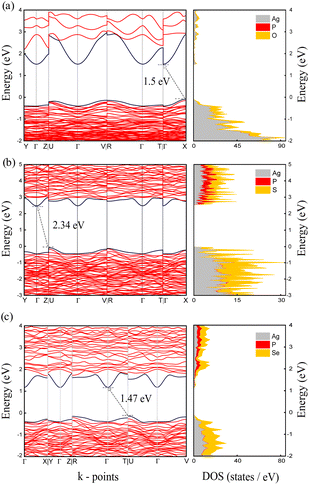 | ||
| Fig. 2 Calculated electronic band structures and densities of states for (a) Ag7P3O11, (b) Ag7P3S11, and (c) Ag7P3Se11 based on the HSE06 hybrid functional. | ||
| Composition | Energy bandgap (eV) | Small pathway energy barrier (eV) | Large pathway energy barrier (eV) |
|---|---|---|---|
| Ag7P3O11 | 1.5 | — | — |
| Ag7P3S11 | 2.34 | 0.45 | 1.99 |
| Ag7P3Se11 | 1.47 | 1 | 2.22 |
The variation in electronic bandgaps for Ag7P3O11 and Ag7P3Se11 is minimal, likely due to the competitive formation of bonds between the anions O/S (where O is a harder base than Se) with Ag (a soft acid) and P (a hard acid), which stabilize the electronic structure. In contrast, Ag7P3S11, which experiences a balanced competition for bond formation, exhibits a distinct electronic configuration and energy bandgap. The order of chemical bond energies (Ag7P3O11 > Ag7P3S11 > Ag7P3Se11) can be understood in terms of stabilization from polarization and charge transfer.
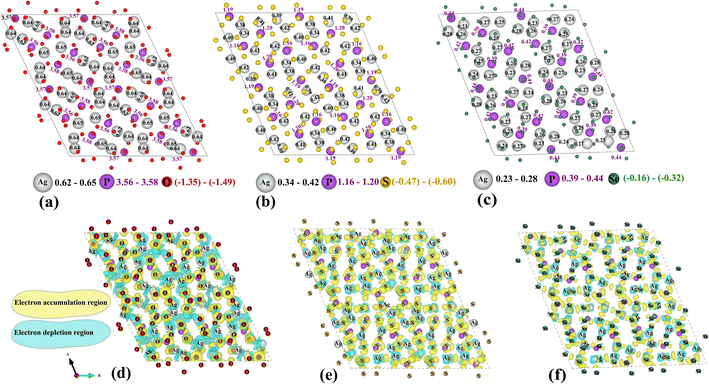
Bader analysis of Ag7P3Se11 reveals a lower electron density around Ag ions, as seen in Fig. 3a–c. This reduced electron density suggests weaker ionic bonding between Ag ions and their surrounding anions, facilitating easier movement of Ag ions and enhancing the ionic conductivity observed in Ag7P3Se11. Fig. 3d–f shows the charge density difference isosurfaces for Ag7P3X11. This charge density difference is calculated by subtracting the charge densities of individual components from that of the interacting system (ρAg7P3X11 − ρAg7 − ρP3X11). The analysis aligns with the Bader charge results, indicating smaller regions of electron accumulation around Se ions and reduced electron depletion around Ag ions in Ag7P3Se11 compared to Ag7P3S11 and Ag7P3O11.
3.3 Phase stability
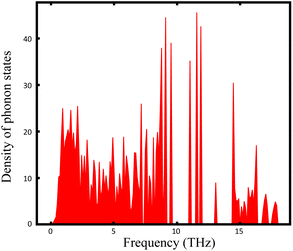
The thermal stabilities of Ag7P3X11 were investigated through AIMD simulations. Fig. S1 (ESI)† confirms these materials are stable at room temperature. However, for Ag7P3X11 (X = {O, Se}), bond breakages and notable structural distortions become apparent at extended simulation times. According to the hard and soft acids and bases (HSAB) theory,66 these structures are prone to temperature-induced changes to maintain stability. The density of states of Γ-point phonons for Ag7P3S11, depicted in Fig. 4, confirms the dynamical stability of this structure through the absence of negative frequencies in phonon dispersions.A ternary phase diagram was constructed to investigate the phase stability of Ag7P3X11, shown in Fig. 5. Compositional phase diagrams were established by selecting compounds from the Materials Project database.67 Table S1 (ESI)† presents the equilibrium decomposition energies based on DFT-calculated energies. Ag7P3O11 is found to be energetically stable against decomposition into binary and ternary compounds, whereas Ag7P3S11 and Ag7P3Se11 exhibit significantly lower stability in terms of energy changes. For more complex compositions, linear programming has been employed to accelerate materials screening and identify optimal decomposition pathways.68
Furthermore, the phase stability of Ag7P3X11 was assessed by calculating its energy above the hull (Ehull), which indicates the compound's tendency for transformation into alternative phases. Temperature-dependent Gibbs free energy changes, incorporating vibrational entropy contributions, were utilized. The decomposition into a linear combination of stable phases Ag3PX4 + Ag4P2X7 and Ag3PX4 + P2X5 were analyzed. Ag4P2O7 and Ag4P2Se7 exhibit remarkable stability at 0 K, whereas Ag4P2S7 appears metastable, potentially decomposing into Ag3PS4 + Ag4P2S7 with an Ehull of 11.95 meV per atom. Subsequent examinations reveal that Ag7P3O11 is stable, while Ag7P3S11 and Ag7P3Se11 are metastable, with Ehull values of 9.32 and 12.73 meV per atom, respectively, for decomposition into Ag3PX4 + P2X5. Decompositions result in the formation of passivation layers,57 which play a crucial role in preventing further decomposition and expanding the electrochemical window.
Fig. 6 illustrates the temperature-dependent Gibbs free energy of Ag7P3X11 for the predicted decomposition products. Considering decomposition products for each compound and the average ΔG values, one concludes that Ag7P3O11 remains thermodynamically stable even at 1000 K. In contrast, Ag7P3S11 exhibits a higher decomposition possibility, particularly towards lower-energy compounds Ag3PS4 + P2S5. Notably, the effect of phonon stabilization is most pronounced in Ag7P3Se11. At temperatures exceeding 320 K, a phonon contribution larger than 12.73 meV per atom to the total free energy effectively stabilizes the phase of Ag7P3Se11, preventing its decomposition into Ag3PSe4 + P2Se5.
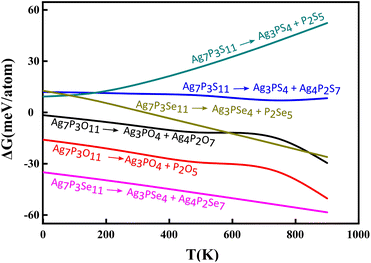 | ||
| Fig. 6 The calculated temperature-dependent Gibbs free energy change for the reverse decomposition reaction of Ag7P3X11. | ||
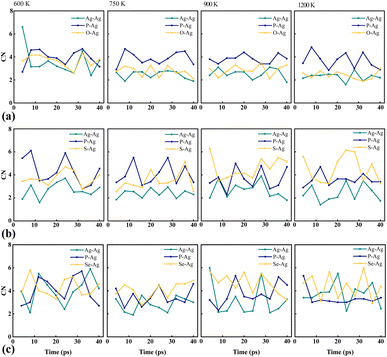
The coordination number (CN) is a key metric used to quantify the number of neighboring atoms in compounds, providing valuable insights into structural and bonding characteristics. CN is calculated by integrating the first peak of the pair count distribution with the corresponding radii of the first nearest-neighbor bonds, denoted by r (Å).69,70 Variations in CNs are indicative of transformations to new phases during ion transfer.71,72 Notably, the pronounced peaks and larger bond radii of Se–Ag in Ag7P3Se11, as illustrated in Fig. S2 (ESI)† and Table 3, suggest weaker bonds between Se atoms and Ag ions compared to those involving S and O atoms. This structural difference explains the higher conductivity observed in Ag7P3Se11, detailed in Table 4. CN analyses reveal that O is more reactive towards Ag than S and Se, making the O–Ag pair more stable, which corroborates the enhanced stability of Ag7P3O11, as discussed in Fig. 6. The fluctuations in CNs with temperature highlight the diversity in pair formation across the studied compounds, as seen in Fig. 7.
| r (Å) | Ag7P3O11 | Ag7P3S11 | Ag7P3Se11 | ||||||
|---|---|---|---|---|---|---|---|---|---|
| Pairs | Ag–Ag | Ag–P | Ag–O | Ag–Ag | Ag–P | Ag–S | Ag–Ag | Ag–P | Ag–Se |
| 600 K | 2.70 | 3.35 | 2.25 | 3.05 | 3.35 | 2.45 | 3.15 | 3.45 | 2.75 |
| 750 K | 2.72 | 3.25 | 2.20 | 3.00 | 3.40 | 2.50 | 3.10 | 3.50 | 2.65 |
| 900 K | 2.75 | 3.15 | 2.25 | 2.95 | 3.45 | 2.65 | 3.05 | 3.55 | 2.70 |
| 1200 K | 2.70 | 3.25 | 2.25 | 2.90 | 3.50 | 2.60 | 2.95 | 3.35 | 2.65 |
| Composition | RT σ (mS cm−1) | Error bound [σmin, σmax] | RT Ea (eV) |
|---|---|---|---|
| Li7P3O11 | (0.03) | — | (0.38) |
| Li7P3S11 | (45.66) | — | (0.19) |
| Li7P3Se11 | (47.94) | — | (0.18) |
| Na7P3O11 | (0.003) | — | (0.53) |
| Na7P3S11 | (10.97) | — | (0.21) |
| Na7P3Se11 | (12.56) | — | (0.21) |
| Ag7P3O11 | 0.03 | [0.001, 0.199] | 0.38 ± 0.06 |
| Ag7P3S11 | 1.21 | [0.0003, 6.282] | 0.27 ± 0.04 |
| Ag7P3Se11 | 13.98 | [1.598, 33.113] | 0.19 ± 0.03 |
3.4 Ionic diffusivity and conductivity
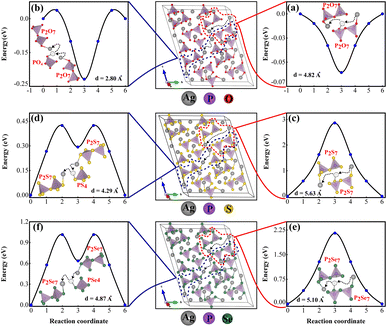
The primary reason for studying ion transport in SSEs is that ion conductivity is a crucial indicator of their performance. Understanding the ion transport mechanisms is essential for designing and optimizing SSEs with high conductivities. Ionic conductivity in crystalline materials is strongly influenced by crystal structure defects such as point defects, line defects, planar defects, volume defects, and electron defects.73 The characteristics of superionic conductors are closely linked to their crystal structure, which naturally contains specific types of vacancies that facilitate ion movement.33,74 Unlike conventional ionic solids where vacancies are typically generated by heating, these gaps are inherent to the material's crystal structure, a concept thoroughly explained by Geller et al.75Fig. 9 illustrates the energy landscape for single Ag+ ion migration across each channel, obtained through NEB calculations. It was determined that Ag+ ion diffusion through vacancies between two pyrothiophosphate P2S74− sites reduces lattice strain and significantly lowers the energy barrier. Notably, two PS4 tetrahedra share one corner S atom. The migration energy barrier for Ag+ ions depends on the density of vacancies in the lattice and the distance from the previous equilibrium position to the adjacent vacancy, enhancing diffusivity. AIMD simulations at 1200 K, sampled every 4 ps (total simulation time: 45 ps), confirm that ions preferentially utilize vacancies between P2X74− and PX43− sites for hopping, as shown in Fig. S3 (ESI).† Migration paths connecting two P2X74− sites, either directly or via an intermediate PX43−, were examined. The scenario where the Ag+ ion moves between two closely spaced PX43− tetrahedra, inducing significant lattice strain with a high energy barrier of about 30 eV for Ag7P3S11, is detailed in Fig. S4 (ESI).†
Fig. 9a demonstrates that Ag+ ions can diffuse easily through large pathways in Ag7P3O11, involving hopping mechanisms. However, as shown in Fig. 9b, Ag+ ions can be trapped in smaller pathways, potentially blocking these channels and altering the structure, potential energy surface, and migration barriers. Energy barriers for diffusion through both small and large pathways in Ag7P3X11 (X = {S, Se}) are documented in Table 2. The shorter distances and intermediate PX43− (X = {S, Se}) result in lower energy barriers.
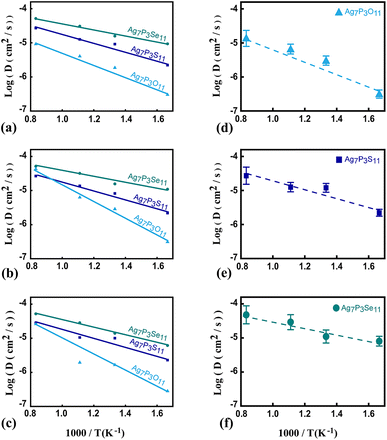
To assess Ag+ ion diffusivity in Ag7P3X11 (X = {O, S, Se}) crystals, AIMD simulations were conducted at various temperatures (600 K, 750 K, 900 K, and 1200 K) without melting the crystal structure. The Arrhenius plots for the overall diffusion coefficient (eqn (1)) at these temperatures are depicted in Fig. 8. From the extrapolated room-temperature diffusion coefficients and eqn (3), the ionic conductivities were evaluated.
The diffusivities along various directions are quite similar due to the presence of empty active space facilitating hopping between two P2X74− (X = {S and Se}) sites. The dominant transport channel is considered to be along the a–b direction, with diffusivities of 0.022 × 10⁻⁸, 2.157 × 10⁻⁸, and 29.541 × 10⁻⁸ (cm2 s−1) for Ag7P3O11, Ag7P3S11, and Ag7P3Se11 at room temperature, respectively, which are notably lower than those along the c direction (0.030 × 10⁻⁸, 2.332 × 10⁻⁸, and 37.995 × 10⁻⁸) (cm2 s−1). Although diffusion along the c direction is less facile than in the a–b directions, it still contributes to the overall diffusivity of the material (see Fig. 8). The extrapolated room-temperature conductivities and activation energies (eqn (4)) are summarized in Table 4. Specifically, the room-temperature conductivities and activation energies for Ag7P3O11, Ag7P3S11, and Ag7P3Se11 are (0.03 (mS cm−1) and 0.38 eV), (1.21 (mS cm−1) and 0.27 eV), and (13.98 (mS cm−1) and 0.19 eV), respectively. The extrapolated room temperature ionic conductivity increases as S is substituted by Se, even though the crystal structure remains unchanged through this replacement. The ionic diffusivity and conductivity of Ag7P3Se11 are slightly larger than those of Na7P3Se11, as reported by Wang et al.27
Two fundamental mechanisms for ion transport in SSEs are single-ion migration and concerted migrations involving multiple ions.76 In single-ion migration, individual ions move between lattice sites through interconnected diffusion channels. Conversely, concerted migrations involve multiple ions simultaneously hopping to their nearest sites. While NEB calculations specifically focus on the single-ion migration, the conductivity results obtained from AIMD simulations are complementary to NEB analysis. By analyzing the dynamics of Ag+ ions from AIMD simulations, it was concluded that the migration of most Ag ions occurs in a highly concerted fashion. This entails multiple ions simultaneously hopping into their nearest sites, suggesting a notable enhancement in the ionic conductivity of Ag7P3Se11. The presence of high-energy sites and relatively flat energy landscapes play a critical role in activating concerted migration processes. The NEB calculations corroborated these observations, indicating that high-energy sites are associated with elongated spatial occupancy density of mobile Ag ions. The study further highlights that rapid diffusion in the examined super-ionic conductors does not primarily occur through isolated ion hopping, as commonly observed in solid materials.76,77
According to the HSAB theory78 and Bader charge analysis, the bonding strength between the hard acid P and hard base O is larger than that with S and Se (P–O > P–S > P–Se). This observation indicates that, apart from anion substitutions, substitutions involving P have an impact on the diffusivity, conductivity, and stability of Ag7P3X11.
4 Conclusions
This study utilized first-principles calculations to gain insights into ion diffusion mechanisms in solid-state electrolytes and to explore strategies for designing solid-state batteries with desirable chemical and physical properties. Bader analysis revealed a notable reduction in electron density around silver ions in Ag7P3Se11, indicating weaker ionic bonds, which leads to increased mobility and elevated conductivity. Nudged elastic band (NEB) calculations investigated various diffusion pathways for Ag7P3X11 (X = {O, S, and Se}) structures, concluding that the migration energy barrier for Ag ions depends on the density of vacancies in the lattice and the distance between the previous equilibrium position and the adjacent vacancy. Therefore, typical concerted migrations observed in AIMD simulations are the dominant diffusion mechanisms in Ag7P3Se11. Among the studied structures, Ag7P3Se11, with a higher number of vacant sites, exhibited the highest ionic conductivity of approximately 13.98 mS cm−1.Various calculations were also conducted to evaluate the stability of the studied materials. Phonon calculations based on density functional perturbation theory (DFPT) showed the absence of imaginary frequencies in the dispersions of Ag7P3S11, confirming local stability. Thermal stability analysis based on AIMD simulations indicated that the materials are stable at room temperature, but as temperature increases, structural distortions occur along with the formation of new vacancies. Furthermore, phase stability analysis revealed that Ag7P3S11 exhibits a greater tendency for decomposition, whereas Ag7P3Se11 is metastable at lower temperatures but transitions to higher stability and enhanced resistance against decomposition beyond a certain temperature threshold. Finally, the RDF analysis showed strong peaks and larger bond radii of Se–Ag in Ag7P3Se11, indicating weaker bonds between Se atoms and Ag ions, resulting in higher ionic conductivity in this material.
Author contributions
Amin Niksirat: conceptualization, methodology, formal analysis, investigation, data curation, writing-original draft, visualization. Maryam Soleimani: methodology, formal analysis, investigation, data curation, writing-original draft. Ali Lashani Zand: methodology, formal analysis, investigation. Mahdi Pourfath: conceptualization, resources, validation, investigation, writing-original draft, writing-review & editing, supervision.Conflicts of interest
There are no conflicts of interest to declare.Acknowledgements
The authors acknowledge TU Wien Bibliothek for financial support through its Open Access Funding Programme.Notes and references
- Z. Xu, R. Chen and H. Zhu, J. Mater. Chem. A, 2019, 7, 12645–12653 RSC.
- G. Segev, J. Kibsgaard, C. Hahn, Z. J. Xu, T. G. Deutsch, C. Xiang, J. Z. Zhang, L. Hammarström, D. G. Nocera and A. Z. Weber, et al. , J. Phys. D: Appl. Phys., 2022, 55, 323003 CrossRef CAS.
- Z. Niazi, A. Hagfeldt and E. K. Goharshadi, J. Mater. Chem. A, 2023, 11, 6659–6687 RSC.
- X. Shen, H. Liu, X.-B. Cheng, C. Yan and J.-Q. Huang, Energy Storage Mater., 2018, 12, 161–175 CrossRef.
- Q. Meng, J. Ma, Y. Zhang, Z. Li, C. Zhi, A. Hu and J. Fan, Nanoscale, 2018, 10, 3385–3392 RSC.
- S. Fleischmann, Y. Sun, N. C. Osti, R. Wang, E. Mamontov, D.-e. Jiang and V. Augustyn, J. Mater. Chem. A, 2020, 8, 412–421 RSC.
- Z. P. Cano, D. Banham, S. Ye, A. Hintennach, J. Lu, M. Fowler and Z. Chen, Nat. Energy, 2018, 3, 279–289 CrossRef.
- M. Forsyth, L. Porcarelli, X. Wang, N. Goujon and D. Mecerreyes, Acc. Chem. Res., 2019, 52, 686–694 CrossRef CAS PubMed.
- Q. Feng, X. Xie, B. Zheng and N. Liao, ACS Appl. Energy Mater., 2023, 6, 2698–2706 CrossRef CAS.
- J. C. Bachman, S. Muy, A. Grimaud, H.-H. Chang, N. Pour, S. F. Lux, O. Paschos, F. Maglia, S. Lupart and P. Lamp, et al. , Chem. Rev., 2016, 116, 140–162 CrossRef CAS PubMed.
- C. Li, Z.-y. Wang, Z.-j. He, Y.-j. Li, J. Mao, K.-h. Dai, C. Yan and J.-c. Zheng, Sustainable Mater. Technol., 2021, 29, e00297 CrossRef CAS.
- A. Manthiram, X. Yu and S. Wang, Nat. Rev. Mater., 2017, 2, 1–16 Search PubMed.
- C. Sun, J. Liu, Y. Gong, D. P. Wilkinson and J. Zhang, Nano Energy, 2017, 33, 363–386 CrossRef CAS.
- Y. Zheng, Y. Yao, J. Ou, M. Li, D. Luo, H. Dou, Z. Li, K. Amine, A. Yu and Z. Chen, Chem. Soc. Rev., 2020, 49, 8790–8839 RSC.
- Y.-Y. Sun, Q. Zhang, L. Yan, T.-B. Wang and P.-Y. Hou, Chem. Eng. J., 2022, 135179 CrossRef CAS.
- E. Ilina, E. Lyalin, M. Vlasov, A. Kabanov, K. Okhotnikov, E. Sherstobitova and M. Zobel, ACS Appl. Energy Mater., 2022, 5, 2959–2967 CrossRef CAS.
- N. Vallana, E. Carena, N. Ceribelli, L. Mezzomo, G. Di Liberto, M. Mauri, C. Ferrara, R. Lorenzi, L. Giordano and R. Ruffo, ACS Appl. Energy Mater., 2024, 7, 1606–1617 CrossRef CAS.
- X. Feng, H. Fang, N. Wu, P. Liu, P. Jena, J. Nanda and D. Mitlin, Joule, 2022, 6, 543–587 CrossRef CAS.
- N. Kamaya, K. Homma, Y. Yamakawa, M. Hirayama, R. Kanno, M. Yonemura, T. Kamiyama, Y. Kato, S. Hama and K. Kawamoto, Nat. Mater., 2011, 10, 682–686 CrossRef CAS PubMed.
- X. Yao, D. Liu, C. Wang, P. Long, G. Peng, Y.-S. Hu, H. Li, L. Chen and X. Xu, Nano Lett., 2016, 16, 7148–7154 CrossRef CAS PubMed.
- R. Murugan, V. Thangadurai and W. Weppner, Angew. Chem., Int. Ed., 2007, 46, 7778–7781 CrossRef CAS PubMed.
- R. Jalem, Y. Yamamoto, H. Shiiba, M. Nakayama, H. Munakata, T. Kasuga and K. Kanamura, Chem. Mater., 2013, 25, 425–430 CrossRef CAS.
- W. D. Richards, Y. Wang, L. J. Miara, J. C. Kim and G. Ceder, Energy Environ. Sci., 2016, 9, 3272–3278 RSC.
- M. V. Reddy, C. M. Julien, A. Mauger and K. Zaghib, Nanomaterials, 2020, 10, 1606 CrossRef CAS PubMed.
- A. Mauger, C. M. Julien, A. Paolella, M. Armand and K. Zaghib, Materials, 2019, 12, 3892 CrossRef CAS PubMed.
- A. Miura, N. C. Rosero-Navarro, A. Sakuda, K. Tadanaga, N. H. Phuc, A. Matsuda, N. Machida, A. Hayashi and M. Tatsumisago, Nat. Rev. Chem, 2019, 3, 189–198 CrossRef CAS.
- Y. Wang, W. D. Richards, S.-H. Bo, L. J. Miara and G. Ceder, Chem. Mater., 2017, 29, 7475–7482 CrossRef CAS.
- S. Banerjee, M. L. H. Chandrappa and S. P. Ong, ACS Appl. Energy Mater., 2022, 5, 35–41 CrossRef CAS.
- M. H. Morcali, ChemistrySelect, 2019, 4, 9011–9017 CrossRef CAS.
- K. Braam and V. Subramanian, Adv. Mater., 2015, 27, 689–694 CrossRef CAS PubMed.
- Q. Yin, L. Chen, Y. Chen and F. Zhan, Compos. Commun., 2021, 26, 100728 CrossRef.
- D. W. Kim, I.-S. Cho, S. Lee, S.-T. Bae, S. S. Shin, G. S. Han, H. S. Jung and K. S. Hong, J. Am. Ceram. Soc., 2010, 93, 3867–3872 CrossRef CAS.
- D. Chang, K. Oh, S. J. Kim and K. Kang, Chem. Mater., 2018, 30, 8764–8770 CrossRef CAS.
- G. Kresse and J. Furthmüller, Phys. Rev. B: Condens. Matter Mater. Phys., 1996, 54, 11169 CrossRef CAS PubMed.
- P. E. Blöchl, Phys. Rev. B: Condens. Matter Mater. Phys., 1994, 50, 17953 CrossRef PubMed.
- J. P. Perdew, K. Burke and M. Ernzerhof, Phys. Rev. Lett., 1996, 77, 3865 CrossRef CAS PubMed.
- J.-H. Li and Y.-X. Yu, Nanoscale, 2021, 13, 20637–20648 RSC.
- H. Yamane, M. Shibata, Y. Shimane, T. Junke, Y. Seino, S. Adams, K. Minami, A. Hayashi and M. Tatsumisago, Solid State Ionics, 2007, 178, 1163–1167 CrossRef CAS.
- T. H. Wan and F. Ciucci, ACS Appl. Energy Mater., 2021, 4, 7930–7941 CrossRef CAS.
- T. Wu, K. Zhu, C. Qin and K. Huang, J. Mater. Chem. A, 2019, 7, 5612–5620 RSC.
- P. Khakbaz, M. Moshayedi, S. Hajian, M. Soleimani, B. B. Narakathu, B. J. Bazuin, M. Pourfath and M. Z. Atashbar, J. Phys. Chem. C, 2019, 123, 29794–29803 CrossRef CAS.
- G. Henkelman and H. Jónsson, J. Chem. Phys., 2000, 113, 9978–9985 CrossRef CAS.
- H. Wang, G. Zhao, S. Wang, D. Liu, Z. Mei, Q. An, J. Jiang and H. Guo, Nanoscale, 2022, 14, 823–832 RSC.
- C. Guan, Y. Yang, R. Ouyang, H. Jing, J. Yan and H. Zhu, J. Mater. Chem. A, 2023, 11, 6157–6167 RSC.
- Z. Yang, Y. Zheng, W. Li and J. Zhang, Nanoscale, 2021, 13, 11534–11543 RSC.
- C. Wang, K. Aoyagi and T. Mueller, J. Mater. Chem. A, 2021, 9, 23206–23213 RSC.
- Y. Wang, M. Wang, Z. Lu, D. Ma and Y. Jia, Nanoscale, 2021, 13, 13390–13400 RSC.
- W. G. Hoover, Phys. Rev. A: At., Mol., Opt. Phys., 1985, 31, 1695 CrossRef PubMed.
- D. Frenkel and B. Smit, Understanding Molecular Simulation: From Algorithms to Applications, Elsevier, 2001, vol. 1 Search PubMed.
- N. Shuichi, Prog. Theor. Phys. Suppl., 1991, 103, 1–46 CrossRef.
- S. Nosé, Mol. Phys., 1984, 52, 255–268 CrossRef.
- H. Chun, K. Nam, S. J. Hong, J. Kang and B. Han, J. Mater. Chem. A, 2021, 9, 15605–15612 RSC.
- A. Marcolongo and N. Marzari, Phys. Rev. Mater., 2017, 1, 025402 CrossRef.
- X. He, Y. Zhu, A. Epstein and Y. Mo, npj Comput. Mater., 2018, 4, 18 CrossRef.
- N. J. de Klerk, E. van der Maas and M. Wagemaker, ACS Appl. Energy Mater., 2018, 1, 3230–3242 CrossRef CAS PubMed.
- L. Shcherbak, O. Kopach, P. Fochuk, A. Bolotnikov and R. James, J. Phase Equilib. Diffus., 2015, 36, 99–109 CrossRef CAS.
- Y. Mo, S. P. Ong and G. Ceder, Chem. Mater., 2012, 24, 15–17 CrossRef CAS.
- Y. Huang, Y. Yu, H. Xu, X. Zhang, Z. Wang and G. Shao, J. Mater. Chem. A, 2021, 9, 14969–14976 RSC.
- H. Huang, H.-H. Wu, C. Chi, J. Zhu, B. Huang and T.-Y. Zhang, Nanoscale, 2019, 11, 18758–18768 RSC.
- N. J. De Klerk and M. Wagemaker, Chem. Mater., 2016, 28, 3122–3130 CrossRef CAS.
- I. C. S. Database, Inorganic Crystal Structure Database, 2010, https://icsd.fiz-karlsruhe.de/icsd/ Search PubMed.
- S. Baroni, S. De Gironcoli, A. Dal Corso and P. Giannozzi, Rev. Mod. Phys., 2001, 73, 515 CrossRef CAS.
- N. Li, Y. Li and J. Fan, Nanoscale, 2021, 13, 7234–7243 RSC.
- I. Ansaripour and M. Pourfath, J. Phys. Chem. C, 2021, 125, 15000–15011 CrossRef CAS.
- S. P. Ong, O. Andreussi, Y. Wu, N. Marzari and G. Ceder, Chem. Mater., 2011, 23, 2979–2986 CrossRef CAS.
- M. Saito, S. Kawaharasaki, K. Ito, S. Yamada, K. Hayamizu and S. Seki, RSC Adv., 2017, 7, 14528–14535 RSC.
- A. Jain, S. P. Ong, G. Hautier, W. Chen, W. D. Richards, S. Dacek, S. Cholia, D. Gunter, D. Skinner, G. Ceder and K. A. Persson, APL Mater., 2013, 1, 011002 CrossRef.
- X. Chen, C. Wang, Z. Li, Z. Hou and W.-J. Yin, Sci. China Mater., 2020, 1024–1035 CrossRef.
- C.-Y. Chou and G. S. Hwang, Chem. Mater., 2013, 25, 3435–3440 CrossRef CAS.
- A. L. Zand, A. Niksirat, Z. Sanaee and M. Pourfath, ACS Omega, 2023, 8, 44698–44707 CrossRef PubMed.
- S. Lee, M. Ko, S. C. Jung and Y.-K. Han, ACS Appl. Mater. Interfaces, 2020, 12, 55746–55755 CrossRef CAS PubMed.
- M. K. Chan, C. Wolverton and J. P. Greeley, J. Am. Chem. Soc., 2012, 134, 14362–14374 CrossRef CAS PubMed.
- B. Zhang, R. Tan, L. Yang, J. Zheng, K. Zhang, S. Mo, Z. Lin and F. Pan, Energy Storage Mater., 2018, 10, 139–159 CrossRef.
- M. Khalifa, S. El-Mashri and M. Avasthi, Phys. B, 2002, 321, 388–392 CrossRef CAS.
- S. t. Geller and M. Lind, J. Chem. Phys., 1970, 52, 5854–5861 CrossRef CAS.
- X. He, Y. Zhu and Y. Mo, Nat. Commun., 2017, 8, 15893 CrossRef CAS PubMed.
- C. Wang, J. Liang, J. T. Kim and X. Sun, Sci. Adv., 2022, 8, eadc9516 CrossRef CAS PubMed.
- S. Balijapelly, Q. Zhang, P. Sandineni, A. Adhikary, S. Mohapatra, S. Sundaramoorthy, N. Gerasimchuck, A. V. Chernatynskiy and A. Choudhury, ACS Appl. Energy Mater., 2021, 4, 7942–7951 CrossRef CAS.
Footnote |
| † Electronic supplementary information (ESI) available: Thermal stability at 300 K has been assessed for Ag7P3X11 structures with (X = {O, S and Se}), along with possible decomposition reactions and their corresponding energies. The radial distribution function (RDF), which measures the density g(r) of finding an atom at a distance from a reference point, was analyzed for Ag7P3X11 under various temperatures (600 K, 750 K, 900 K, and 1200 K). Structural snapshots from ab initio molecular dynamics (AIMD) simulations depict Ag+ ion diffusion at 1200 K. Additionally, the nudged elastic band (NEB) method was used to graph the transport of Ag ions between two P2S7 pyrothiophosphate units across a narrow interstitial gap. See DOI: https://doi.org/10.1039/d4ta01341g |
| This journal is © The Royal Society of Chemistry 2024 |

