The regulation effect of coordination number on the conductance of single-molecule junctions†
Qiang
Wan‡
 a,
Hong-Yang
Guo‡
a,
Yi-Fan
Zhou
a,
Jia-Nan
Jiang
a,
Wenbo
Chen
a,
Hong-Yang
Guo‡
a,
Yi-Fan
Zhou
a,
Jia-Nan
Jiang
a,
Wenbo
Chen
 *b,
Ju-Fang
Zheng
a,
Yong
Shao
 a,
Ya-Hao
Wang
 *a and
Xiao-Shun
Zhou
 *a
*a
aKey Laboratory of the Ministry of Education for Advanced Catalysis Materials, Institute of Physical Chemistry, Zhejiang Normal University, Jinhua 321004, China. E-mail: yahaowang@zjnu.edu.cn; xszhou@zjnu.edu.cn
bShanghai Key Laboratory of Materials Protection and Advanced Materials in Electric Power, Shanghai University of Electric Power, Shanghai, China. E-mail: wenbochen@shiep.edu.cn
First published on 22nd November 2023
Abstract
Combining the STM break junction technique and theoretical simulation, we report that the presence of multiple anchoring sites leads to different configurations of single-molecule junctions by changing the interfacial coordination numbers. These distinct variations in electronic structures cause their conductance to change by about 2500-fold.
Introduction
As the size of traditional silicon-based electronic devices continues to decrease to a few nanometers scale, the presence of the quantum effect significantly alters their properties.1–3 Consequently, the bottom-up approaches to building functional components using chemically identical molecules are considered a promising approach for future nanoelectronics.4–7 This primarily requires constructing robust metal–molecule–metal junctions to explore their electron transport properties at the single-molecule level.8–10 Benefiting from the rapid development of nanotechnology and instrumentation, many experimental techniques have been developed in the past three decades to construct single-molecule junctions and measure their conductance, such as the widely used mechanically controllable break junction (MCBJ) and scanning tunneling microscopy break junction (STM-BJ).11–15 In these measurements, extensive processes have been achieved in the understanding of electron transport in single-molecule junctions.16–18 For example, the nature of metal molecule contact has a great impact on the stability, binding configuration, interface coupling and energy level arrangement of single-molecule junctions.19–26 However, the molecular adsorption and the arrangement of the atoms at the metallic electrode interfaces are a priori unknown. Uncovering such metal–molecule27 contacts in the structure–activity relationships of single-molecule junctions remains a great challenge.28–32To enhance chemical and mechanical stability as well as electronic coupling, molecules with multidentate anchoring groups or multiple anchoring units have recently been designed and synthesized for constructing molecular junctions.33–37 For example, Kiguchi et al. found that single-molecule junctions consisting of a quarter-thiophene-based molecule present three conductance values, and claimed that various conductance values within one molecule can be attributed to the shift of anchors.38 Hong et al. reported the regulation of conductance via alternating anchoring sites through mechanical control.39 Venkatraman et al. reported four conductance values within a single molecular scaffold, which originated from distinct combinations between the electrodes and bis-terpyridine-based molecule.40 Furthermore, these molecular components with multiple contact sites enable mechanically induced changes of coordination numbers at the metal–molecule interface. However, the molecules involved in these investigations are relatively complex, and the complicated mechanism of the impact of molecular coordination number on conductance remains unclear. Therefore, it is necessary to clarify how the number of anchoring sites affects the conductance of single-molecule junctions composed of a simple molecular backbone, which will shed light on conductance regulation and molecular device design.
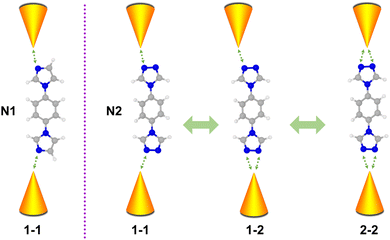
Molecules composed of nitrogen-based heterocycles could strongly interact with the Au electrode, which has been extensively studied in the past,41–43 and is suitable for elucidating the correlation between the anchor site number and conductance of the molecular junction. Herein, in conjunction with STM-BJ measurements and density functional theory (DFT) calculations, we use 1-(4-imidazol-1-ylphenyl)imidazole (denoted as N1) and 4,4′-(1,4-phenylene)bis(4H-1,2,4-triazole) (denoted as N2) as model molecules to investigate their charge transport properties. Molecule N1 possesses one anchoring site bonding to electrodes, while molecule N2 possesses two triazole rings located at both ends with each triazole ring providing two anchoring sites. As schematically shown in Fig. 1, N2 in molecular junctions can be anchored between Au electrodes via one–one (1–1), one–two (1–2) and two–two (2–2) modes. Such a regulating effect of molecule–metal coordination numbers on single molecule conductance was investigated. The results show that the N1 molecule possesses single conductance values, while the N2 molecule possesses three. Moreover, different coordination numbers of N2 lead to different binding strengths and unoccupied states, further regulating its conductance. This work reveals the impact of the coordination number of the molecule backbone on conductance, providing physical insights and potential strategies for engineering the conductance of single-molecule junctions via molecular design.
 | ||
| Fig. 1 Schematic of coordination numbers induced by various conductance states of single-molecule junctions for N1 and N2 molecules. | ||
Results and discussion
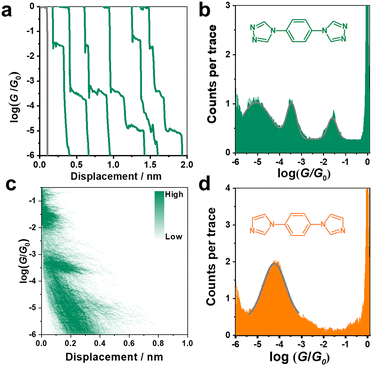
The conductance of the single molecular junction of N2 was first characterized by the STM-BJ technique in dodecane containing 0.1 mM N2 molecule. The Au (111) substrate was polished and annealed before each STM experiment. The typical individual conductance trace for N2 obtained in dodecane at a bias voltage of 100 mV is shown in Fig. 2a. As the nanogap between the two electrodes increases by withdrawing the tip, the conductance decreases and presents three plateaus (located at about 10−1.6, 10−3.5, and 10−5.0G0, where G0 is the quantum conductance equalling ∼77.5 μS), suggesting successful construction of molecular junctions. Besides, the presence of high, medium and low conductance (denoted as HC, MC and LC, respectively) suggests a potential application in molecular devices due to its distinct variation between different states (HC:LC = 103.4). Accordingly, it can be found from the one-dimensional (1D) conductance histogram (Fig. 2b) that three obvious conductance peaks (Gaussian fitting) of the N2 junction are located at 10−1.6, 10−3.5, and 10−5.0G0, which are in agreement with the results from typical conductance traces (Fig. 2a). The most probable absolute displacement for molecular junctions is about 1 nm (Fig. S1, ESI†), which is comparable with the molecular length of N2 (Fig. S2, ESI†). This further confirms the formation of single-molecule junctions. Furthermore, the two-dimensional (2D) conductance histogram in Fig. 2d also shows the corresponding three stretching states of HC, MC and LC in statistical analysis of relevant displacements of each conductance curve from 10−6.0G0 to 10−0.3G0.As aforementioned, the N2 molecule possesses two sites to anchor each electrode, which can lead to three different configurations of 1–1, 1–2, and 2–2 with different coordination numbers at the interfaces. This might present three stable conductance values. To further verify this conjecture, we studied the conductance of single-molecule junctions with less anchoring sites, i.e., the N1 molecule. In comparison to the N2 molecule, the N1 molecule possesses two imidazole rings located at the para-site of benzene instead of a triazole ring, thus only contributing one anchoring site at each end of the N1 molecule (1–1).
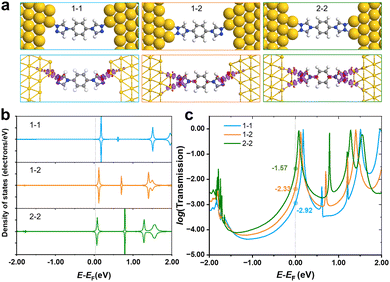
As shown in Fig. 1d, only one stable peak with Gaussian fitting appears at 10−4.5G0, which is in agreement with the location of the plateau in the representative conductance-distance traces (Fig. S2a, ESI†). The formation of single-molecule junctions is also confirmed in the 2D conductance histograms (Fig. S2b and c, ESI†). Thus, the presence of a single conductance peak proves that fewer anchoring sites lead to relatively specific configurations of single-molecular junctions, in comparison to diverse configurations of N2-based single-molecule junctions. To gain further physical insight into the effect of the number of anchoring sites on conductance, we carried out DFT calculations to investigate the interaction between N2/N1 with the Au electrodes by various configurations, as well as the corresponding electronic structures and conductance. Optimized structures for N2 molecule anchoring between two Au electrodes via1–1, 1–2 and 2–2 modes are shown in Fig. 3a (upper panel), respectively.
The average bond length of two Au–N bonds in 1–1 is 2.18 Å, showing the adsorption energy of −2.46 eV. For the anchored N2 molecule in 1–2 mode, the average Au–N bond is 2.23 Å, and the corresponding adsorption energy is −2.66 eV, which is lower than that of the 1–1 mode. As the coordination number of the N2 molecule to gold electrodes continues to increase and reaches a maximum, all two anchoring sites at each end of the molecule bond to the gold electrode. In this case, the average Au–N bond length is 2.23 Å, and the adsorption energy further decreases to −2.88 eV. Besides, the charge density difference plots (lower panel of Fig. 3a) show that a larger coordination number results in stronger electron transfer. Taking the 2–2 and 1–1 modes as examples, there are obvious regions of electron transfer on the benzene rings in the 2–2 case, while in the 1–1 case, the electron gains and losses mainly take place on the triazole ring. The above results indicate that the interaction between the N2 molecule and electrodes was strengthened when the coordination number increased, leading to stronger binding and wider regions of changes in electron density.
PDOS of N2 in various anchoring configurations are investigated to analyse their differences in terms of electronic structure, and the results are shown in Fig. 3b. One can find that the unoccupied states closest to the Fermi level obviously shift towards lower energy, and even straddle across the Fermi level when N2 connects with electrodes in a 2–2 mode, suggesting that the states start to be partially filled as the coordination number increases, which would facilitate the electron transfer and improve the conductance. Therefore, we calculated the transmission spectra for single-molecule junctions with these three modes, and the results are shown in Fig. 3c. The location of the peak closest to the Fermi level shows the same trend as that shown in PDOS, i.e., increasing coordination number leads to the shift of the conductance peak towards lower energy. The order of the conductance values for N2 in various modes is 2–2 > 1–2 > 1–1, corresponding to experimentally observed HC, MC and LC, respectively.
In addition, the conductance of another single-molecule junction configuration for N2 in a 1–1 mode has been examined (Fig. S3, ESI†). The results reveal that their conductance values are comparable regardless of whether the two anchoring sites are on the same side or opposite sides. We also simulated the single-molecule junction configuration of N2 in a different nanogap, which exposes extra sites for connecting electrodes. The results suggest that their conductance values are comparable (Fig. S4, ESI†), excluding the possibility that other anchoring modes may contribute to different conductance values. Besides, experiments and calculations exclude the contributions of the configuration of internal N binding to Au and the configuration of two N in the same ring binding to Au and to the HC of the N2 molecular junction (Fig. S5, ESI†).
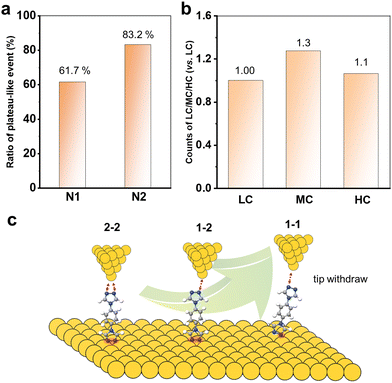
Now, it is clear that the presence of multiple anchoring sites of N2 leads to the formation of diverse single-molecule junctions. Increasing the coordination numbers can improve the single-molecule conductance value by about three orders of magnitude. We also further compare the chemical and mechanical stability by analysing the junction formation statistics. In order to statistically represent this complex data set, the results obtained from these over 1000 traces in each curve were individually analysed. As summarized in the diagrams shown in Fig. 4a, it was found that almost 83.2% of the conductance traces exhibited plateau-like events assigned to the formation of molecular junctions for N2, compared to 61.7% for N1. This indicates that the multiple N anchoring sites can also significantly promote the metal–molecule contacts and interactions.
Furthermore, we count the number of occurrences of HC, MC and LC plateaus in all the plateau-even curves of N2 to analyse the molecular junction formation mechanism. Their relative count ratios are shown in Fig. 4b. It can be found that the 1–2 configuration for MC dominates the withdrawal process of the tip from the substrate. There might be two reasons: (I) the pre-adsorbed N2 molecules on the Au substrate prefer two N to bind simultaneously. This leads to the formation of 1–2 and 2–2 configurations when the tip is withdrawn from the SAMs; (II) the 2–2 configurations can evolve into a 1–2 configuration during the tip withdrawing process. In addition, it is also found that there were almost exclusively LC plateau-like events in all conductance-distance traces. This indicates that the 1–1 configuration is almost evolved from the 1–2 and 2–2 configurations. Thus, the molecular junction formation process and mechanism are schematically summarized in Fig. 4c. The 1D and 2D conductance histograms from the selected conductance-distance traces display the LC, MC, or HC steps, and all show the three conductance peaks (Fig. S6, ESI†), indicating that all or two of the three type steps appear simultaneously in most of the conductance-distance traces. This further supports that a 2–2 or 2–1 configuration of the molecular junction is firstly formed when the tip is driven into the SAM of N2 with both N binding to the Au substrate. The molecules with multiple anchoring sites offer a unique opportunity to tune the conductance of single-molecule junctions for the design of molecular devices.
Conclusions
In summary, we have successfully investigated the effects of the coordination numbers of molecule–metal contacts on charge transport by using the STM-BJ technique and theoretical calculations. The N2 molecule has two anchoring sites at each end, exhibiting three stable conductance values. Combined with the theoretical investigations, we revealed that the three HC, MC and LC values of N2 were attributed to coordination numbers of 2–2, 1–2 and 1–1 between N2 and the two Au electrodes. The coordination number between a molecule and electrodes distinctly affects the binding strengths of molecules and plays a crucial role in tuning their electronic structure which can change the conductance of single-molecule junction more than three order of magnitude. Our work provides a clear and constructive perspective for developing electronic components with multiple anchoring sites.Experimental section
Conductance measurements
Single-molecule conductance measurements by using an STM break-junction (STM-BJ) were carried out using a home-modified Nanoscope IIIa STM (Veeco, US). The naturally formed (111) facet at a Au bead substrate and mechanically-cut Au tip (0.25 mm diameter, 99.999%, Alfa Aesar) were used as two working electrodes. Prior to each experiment, the Au(111) substrate was subjected to electrochemical-polishing and flame-annealing. The single-molecule conductance measurements were performed in a dodecane solution containing 0.1 mM target molecules. 1,4-Bis (1H-pyrazol-4-yl) benzene (95% +), 4,4′-(1,4-phenyl) bis (4H-1,2,4-triazole) (98%), and 1-(4-imidazol-1-ylphenyl)imidazole (98%) were purchased from Jilin Chinese Academy of Sciences-Yanshen Technology Co., Ltd. (Jilin, China).The process of the STM-BJ method is briefly described as follows: first, the STM tip is driven toward the substrate to a preset current value (50 nA) through piezoelectric control. An external pulse voltage is then applied to the z-piezo to bring the STM tip into the substrate surface to softly contact with the substrate. The tip is then pulled away from the substrate at a constant speed of 20 nm s−1. During this process, single molecular junctions can be formed. Simultaneously, the current at the tip was recorded at a sampling rate of 20 kHz. Thousands of tip current–displacement curves were collected to construct conductance histograms without data selection. Conductance measurements were performed at a bias voltage of 100 mV.
Computational details
All structural relaxation of molecules and single-molecule junctions using an FHI pseudopotential and double-zeta polarized (DZP) basis set within the generalized gradient approximation (GGA) with the Perdew–Burke–Ernzerhof (PBE) functional were performed by the QuantumATK (S-2021.06-SP1) package.44–46 For structural relaxation of the central region of the devices, the convergence criterion of force was set to 0.01 eV Å−1, and a 2 × 2 × 1 Monkhorst–Pack grid with a density mesh cut-off of 75 Hartree was adopted for Brillouin zone sampling.47 Grimme's DFT-D3 scheme was used for van der Waals dispersion correction.48 The transmission spectra of the optimized devices were computed by using the non-equilibrium Green function (NEGF) approach as implemented in QuantumATK,49 and a 5 × 5 × 150 k-point mesh was adopted.Conflicts of interest
There are no conflicts to declare.Acknowledgements
We acknowledge financial support from the National Natural Science Foundation of China (no. 22102150, 22172146, 22303085, 21872126 and 21573198), the Zhejiang Provincial Natural Science Foundation of China (no. LQ21B030010), the Leading Talent Program of Science and Technology Innovation in Zhejiang (no. 2020R52022) and the Natural Science Foundation of Shanghai (no. 20ZR1471600).References
- H. Chen and J. Fraser Stoddart, Nat. Rev. Mater., 2021, 6, 804–828 CrossRef CAS.
- T. A. Su, M. Neupane, M. L. Steigerwald, L. Venkataraman and C. Nuckolls, Nat. Rev. Mater., 2016, 1, 16002 CrossRef CAS.
- D. Xiang, X. Wang, C. Jia, T. Lee and X. Guo, Chem. Rev., 2016, 116, 4318–4440 CrossRef CAS PubMed.
- W.-Y. Lo, N. Zhang, Z. Cai, L. Li and L. Yu, Acc. Chem. Res., 2016, 49, 1852–1863 CrossRef CAS PubMed.
- H. Song, M. A. Reed and T. Lee, Adv. Mater., 2011, 23, 1583–1608 CrossRef CAS.
- N. Xin, J. Guan, C. Zhou, X. Chen, C. Gu, Y. Li, M. A. Ratner, A. Nitzan, J. F. Stoddart and X. Guo, Nat. Rev. Phys., 2019, 1, 211–230 CrossRef.
- W. Lu and C. M. Lieber, Nat. Mater., 2007, 6, 841–850 CrossRef CAS.
- J. M. Beebe, B. Kim, J. W. Gadzuk, C. Daniel Frisbie and J. G. Kushmerick, Phys. Rev. Lett., 2006, 97, 026801 CrossRef.
- C. Kergueris, J. P. Bourgoin, S. Palacin, D. Esteve, C. Urbina, M. Magoga and C. Joachim, Phys. Rev. B: Condens. Matter Mater. Phys., 1999, 59, 12505–12513 CrossRef CAS.
- D. J. Wold and C. D. Frisbie, J. Am. Chem. Soc., 2001, 123, 5549–5556 CrossRef CAS.
- B. Xu and N. J. Tao, Science, 2003, 301, 1221–1223 CrossRef CAS PubMed.
- C. J. Muller, J. M. van Ruitenbeek and L. J. de Jongh, Phys. C, 1992, 191, 485–504 CrossRef.
- B. Huang, X. Liu, Y. Yuan, Z.-W. Hong, J.-F. Zheng, L.-Q. Pei, Y. Shao, J.-F. Li, X.-S. Zhou, J.-Z. Chen, S. Jin and B.-W. Mao, J. Am. Chem. Soc., 2018, 140, 17685–17690 CrossRef CAS.
- H. Li, T. A. Su, V. Zhang, M. L. Steigerwald, C. Nuckolls and L. Venkataraman, J. Am. Chem. Soc., 2015, 137, 5028–5033 CrossRef CAS PubMed.
- M. S. Inkpen, Z. F. Liu, H. Li, L. M. Campos, J. B. Neaton and L. Venkataraman, Nat. Chem., 2019, 11, 351–358 CrossRef CAS.
- F. Schwarz, G. Kastlunger, F. Lissel, C. Egler-Lucas, S. N. Semenov, K. Venkatesan, H. Berke, R. Stadler and E. Lörtscher, Nat. Nanotechnol., 2016, 11, 170–176 CrossRef CAS.
- F. M. Raymo, Adv. Mater., 2002, 14, 401–414 CrossRef CAS.
- L. Bogani and W. Wernsdorfer, Nat. Mater., 2008, 7, 179–186 CrossRef CAS.
- Y. Komoto, S. Fujii, M. Iwane and M. Kiguchi, J. Mater. Chem. C, 2016, 4, 8842–8858 RSC.
- Y.-H. Wang, H. Huang, Z. Yu, J.-F. Zheng, Y. Shao, X.-S. Zhou, J.-Z. Chen and J.-F. Li, J. Mater. Chem. C, 2020, 8, 6826–6831 RSC.
- A. K. Ismael, K. Wang, A. Vezzoli, M. K. Al-Khaykanee, H. E. Gallagher, I. M. Grace, C. J. Lambert, B. Xu, R. J. Nichols and S. J. Higgins, Angew. Chem., Int. Ed., 2017, 56, 15378–15382 CrossRef CAS.
- S.-L. Lv, C. Zeng, Z. Yu, J.-F. Zheng, Y.-H. Wang, Y. Shao and X.-S. Zhou, Biosensors, 2022, 12, 565 CrossRef CAS.
- Z. Yu, Y.-X. Xu, J.-Q. Su, P. M. Radjenovic, Y.-H. Wang, J.-F. Zheng, B. Teng, Y. Shao, X.-S. Zhou and J.-F. Li, Angew. Chem., Int. Ed., 2021, 60, 15452–15458 CrossRef CAS PubMed.
- J.-C. Mao, L.-L. Peng, W.-Q. Li, F. Chen, H.-G. Wang, Y. Shao, X.-S. Zhou, X.-Q. Zhao, H.-J. Xie and Z.-J. Niu, J. Phys. Chem. C, 2017, 121, 1472–1476 CrossRef CAS.
- P. Moreno-García, M. Gulcur, D. Z. Manrique, T. Pope, W. Hong, V. Kaliginedi, C. Huang, A. S. Batsanov, M. R. Bryce, C. Lambert and T. Wandlowski, J. Am. Chem. Soc., 2013, 135, 12228–12240 CrossRef PubMed.
- J. Šebera, M. Lindner, J. Gasior, G. Mészáros, O. Fuhr, M. Mayor, M. Valášek, V. Kolivoška and M. Hromadová, Nanoscale, 2019, 11, 12959–12964 RSC.
- X. Zhao, X. Zhang, K. Yin, S. Zhang, Z. Zhao, M. Tan, X. Xu, Z. Zhao, M. Wang, B. Xu, T. Lee, E. Scheer and D. Xiang, Small Methods, 2023, 7, 2201427 CrossRef CAS.
- S. Kaneko, D. Murai, S. Marqués-González, H. Nakamura, Y. Komoto, S. Fujii, T. Nishino, K. Ikeda, K. Tsukagoshi and M. Kiguchi, J. Am. Chem. Soc., 2016, 138, 1294–1300 CrossRef CAS PubMed.
- C. Jia and X. Guo, Chem. Soc. Rev., 2013, 42, 5642–5660 RSC.
- L. Tong, Z. Yu, Y.-J. Gao, X.-C. Li, J.-F. Zheng, Y. Shao, Y.-H. Wang and X.-S. Zhou, Nat. Commun., 2023, 14, 3397 CrossRef CAS PubMed.
- Y.-H. Wang, X.-C. Li, Z. Yu, J.-F. Zheng and X.-S. Zhou, Curr. Opin. Electrochem., 2023, 39, 101279 CrossRef CAS.
- T. Ghomian, O. Kizilkaya, L. K. Domulevicz and J. Hihath, Nanoscale, 2022, 14, 6248–6257 RSC.
- L. Gerhard, K. Edelmann, J. Homberg, M. Valášek, S. G. Bahoosh, M. Lukas, F. Pauly, M. Mayor and W. Wulfhekel, Nat. Commun., 2017, 8, 14672 CrossRef PubMed.
- I. L. Herrer, A. K. Ismael, D. C. Milán, A. Vezzoli, S. Martín, A. González-Orive, I. Grace, C. Lambert, J. L. Serrano, R. J. Nichols and P. Cea, J. Phys. Chem. Lett., 2018, 9, 5364–5372 CrossRef CAS PubMed.
- A. Vezzoli, Nanoscale, 2022, 14, 2874–2884 RSC.
- Y.-H. Kim, H. S. Kim, J. Lee, M. Tsutsui and T. Kawai, J. Am. Chem. Soc., 2017, 139, 8286–8294 CrossRef CAS.
- R. Stadler, K. S. Thygesen and K. W. Jacobsen, Phys. Rev. B: Condens. Matter Mater. Phys., 2005, 72, 241401 CrossRef.
- M. Kiguchi, T. Ohto, S. Fujii, K. Sugiyasu, S. Nakajima, M. Takeuchi and H. Nakamura, J. Am. Chem. Soc., 2014, 136, 7327–7332 CrossRef CAS.
- Z. Zhu, H. Qu, Y. Chen, C. Zhang, R. Li, Y. Zhao, Y. Zhou, Z. Chen, J. Liu, Z. Xiao and W. Hong, J. Mater. Chem. C, 2021, 9, 16192–16198 RSC.
- C. Seth, V. Kaliginedi, S. Suravarapu, D. Reber, W. Hong, T. Wandlowski, F. Lafolet, P. Broekmann, G. Royal and R. Venkatramani, Chem. Sci., 2017, 8, 1576–1591 RSC.
- M. Mennicken, S. K. Peter, C. Kaulen, U. Simon and S. Karthäuser, J. Phys. Chem. C, 2019, 123, 21367–21375 CrossRef CAS.
- L. Palomino-Ruiz, P. Reiné, I. R. Márquez, L. Álvarez de Cienfuegos, N. Agraït, J. M. Cuerva, A. G. Campaña, E. Leary, D. Miguel, A. Millán, L. A. Zotti and M. T. González, J. Mater. Chem. C, 2021, 9, 16282–16289 RSC.
- X. Pan, B. Lawson, A. M. Rustad and M. Kamenetska, Nano Lett., 2020, 20, 4687–4692 CrossRef CAS PubMed.
- M. S. José, A. Emilio, D. G. Julian, G. Alberto, J. Javier, O. Pablo and S.-P. Daniel, J. Phys.: Condens. Matter, 2002, 14, 2745 CrossRef.
- S. Smidstrup, T. Markussen, P. Vancraeyveld, J. Wellendorff, J. Schneider, T. Gunst, B. Verstichel, D. Stradi, P. A. Khomyakov, U. G. Vej-Hansen, M.-E. Lee, S. T. Chill, F. Rasmussen, G. Penazzi, F. Corsetti, A. Ojanperä, K. Jensen, M. L. N. Palsgaard, U. Martinez, A. Blom, M. Brandbyge and K. Stokbro, J. Phys.: Condens. Matter, 2020, 32, 015901 CrossRef CAS PubMed.
- J. P. Perdew, K. Burke and M. Ernzerhof, Phys. Rev. Lett., 1996, 77, 3865–3868 CrossRef CAS PubMed.
- H. J. Monkhorst and J. D. Pack, Phys. Rev. B: Solid State, 1976, 13, 5188–5192 CrossRef.
- S. Grimme, J. Antony, S. Ehrlich and H. Krieg, J. Chem. Phys., 2010, 132, 154104 CrossRef PubMed.
- M. Brandbyge, J.-L. Mozos, P. Ordejón, J. Taylor and K. Stokbro, Phys. Rev. B: Condens. Matter Mater. Phys., 2002, 65, 165401 CrossRef.
Footnotes |
| † Electronic supplementary information (ESI) available. See DOI: https://doi.org/10.1039/d3tc03618a |
| ‡ These authors contributed equally. |
| This journal is © The Royal Society of Chemistry 2024 |


