Tailoring thermal expansion and luminescence thermometric performance of KMgScW3O12-based compounds†
Ming
Li
a,
Qi
Miao
a,
Kaiyue
Zhao
a,
Yangke
Cun
*b,
Yongqiang
Qiao
a,
Juan
Guo
a,
Li
Li
*c and
Qilong
Gao
 *a
*a
aSchool of Physics and Microelectronics, Zhengzhou University, Zhengzhou, 450001, China. E-mail: qilonggao@zzu.edu.cn
bCollege of Materials Science and Engineering, Kunming University of Science and Technology, Kunming 650093, China. E-mail: cunyangke@126.com
cCollege of Science, Chongqing University of Posts and Telecommunications, Chongqing 400065, P. R. China. E-mail: lilic@cqupt.edu.cn
First published on 19th June 2024
Abstract
Negative thermal expansion (NTE) compounds provide an opportunity to understand the nature of thermal expansion and the engineering applications of inorganic solid functional materials. However, very few NTE materials have been found so far, which also restricts the unique applications of anomalous lattice effects in solving luminescence thermal quenching and ratio fluorescence temperature measurement. In this work, we have prepared (KMg)xSc2−xW3O12-based compounds with abnormal thermal expansion and luminescence negative thermal quenching. Their crystal structure, microstructure, thermal expansion properties, and semiconductor performance are studied by variable temperature X-ray diffraction, scanning electron microscopy, low-temperature differential scanning calorimetry, and UV-vis diffuse reflection spectroscopy. The thermal expansion can switch from positive to zero to negative by controlling the content of (KMg)3+ ions. Interestingly, the upconversion luminescence spectra intensity in (KMg)xSc2−xW3O12-based compounds displays unique negative thermal quenching, including weak negative thermal quenching and strong thermal quenching with the x from 0.4 to 0.8. The results of decay curves show that the trend of decay curves with temperature is consistent with the thermal expansion behaviour; the stronger the NTE properties, the stronger the luminescence negative thermal quenching. The maximum absolute sensitivity (Sa) of (KMg)0.4Sc1.42W3O12:0.15Yb/0.03Er is 0.50 × 10⁻² K−1 at 385 K, and the maximum relative sensitivity (Sr) is 0.86% K−1 at 298 K. This work does not only provide a new NTE material but also find that the NTE material as a luminescent host can produce a phenomenon of luminescence thermal enhancement.
1. Introduction
Most materials display thermal expansion under heating, called positive thermal expansion (PTE). However, a few materials exhibit the characteristics of “thermal shrinkage or cold expansion”, which are named negative thermal expansion (NTE) materials. These have attracted increasing attention in some fields of precision control of thermal expansion, such as optical fiber reflective grating devices and circuit boards, which could act as an additive to control the thermal expansion of matrix materials.1 So far, NTE compounds can be roughly divided into two broad categories: one is driven by low-frequency phonons, such as oxides,2,3 fluorides,4,5 cyanides,6,7 and MOFs.8,9 Another is the class of electron-driven NTE compounds, such as BiNiO3,10 BiCu3Fe4O12,11 Mn3AN,12 and alloys.13 It should be noted that most phonon-driven NTE materials have a wider NTE temperature window, even exceeding 1000 K, such as ZrW2O8,14 Y2W3O12,15 ScF3,16 and CaZrF6.17 Among them, the A2M3O12 series NTE materials have been extensively studied due to their large coefficient of thermal expansion (CTE) and flexible chemical structure.18,19 However, A2M3O12 with smaller A3+ cations (e.g. Fe3+, Al3+, and Cr3+) has a higher phase transition temperature, and its NTE behaviour is only displayed after a monoclinic-orthogonal phase transition.20,21 For larger A3+ cations (such as Y3+, Yb3+, Er3+, and Lu3+), the sample easily absorbs water,18,22 and its NTE properties are only displayed after the release of crystal water. NaZr2P3O12 (NZP) has a 3D framework structure with a ZrO6 octahedron corner linked to a PO4 tetrahedron,23 possessing hexagonal symmetry.24 Due to high structural flexibility, it also has excellent ionic conductor properties. Meanwhile, this structure is already known for the possibility of ionic substitution to create new materials with desired properties. Additionally, some NZP members present high mechanical strength, good chemical stability, high melting point, great hardness, and radiation resistance.25 In some cases, it has a detrimental effect on mechanical strength because it causes microstresses and consequently microcracks.26 Therefore, it is much more important to explore strong NTE oxides over a wide temperature range.It is well known that upconversion luminescence (UCL) of RE3+ doped materials can convert near-infrared light to visible light and even ultraviolet (UV) light, and they have a large application market in anti-counterfeiting, photodynamic therapy, and temperature sensing.27 However, the use of luminescent materials is largely limited by thermal quenching (TQ), that is, the luminescence intensity decreases with increasing temperature. Therefore, maintaining or even enhancing the luminescence at high temperatures is of high technological importance. A lot of attempts have been made to improve the luminescence properties of UC materials, such as adding sensitizers, tailoring the local crystal field, controlling the particle size, and tuning the phase of host materials;28–31 these attempts to combat TQ have only met with limited success. Wang et al. used Yb2W3O12 and Sc2Mo3O12 as luminescent host materials to exhibit thermal enhanced UC emission of rare-earth ions (i.e., Er3+, Ho3+) due to contraction and distortion of the host lattice with increasing temperature; the lattice contraction brings a reduction in the distance between sensitizers (Yb3+) and activators (Er3+), which contributes to the energy transfer (ET) from Yb3+ to Er3+ leading to enhancement of the UCL intensity.32 These results provide an idea of utilizing the advantages of NTE compounds to design various luminescent materials with excellent luminescence stability. However, the explanations that NTE materials can solve TQ are different. Liao et al. studied the luminescence properties of Sc2Mo3O12:Yb3+/Er3+ and explained that the thermally enhanced UC emission is mainly controlled by the ET from Yb3+ to Er3+ at 298–473 K and then by the radiation transition of Er3+ above 473 K.33 Huang et al. explained that the formation of a Yb-MoO4 dimer leads to the tunable ET process of Yb2Mo3O12:Yb3+/Er3+.34 Wei et al. reported that the Frenkel defect formed via controlled annealing of Sc2(WO4)3:Ln (Ln = Yb, Er, Eu, Tb, and Sm) can work as an energy reservoir and back-transfer the stored excitation energy to Ln3+ upon heating.35 Nevertheless, the investigation on the thermal enhancement of UC emission as well as its corresponding mechanism in rare-earth ion doped NTE compounds is still not sufficient and the connection between NTE intensity and luminescence intensity is not clearly stated.
In this work, we have prepared a series of new NTE materials (KMg)xSc1.82−xW3O12:0.15Yb/0.03Er (x = 0.4, 0.6, and 0.8), which do not undergo phase transitions throughout the test temperature range. Since Yb3+ can obtain near-infrared excitation at 980 nm and has a large absorption cross-section, and ET for other rare earth ions is high,36–38 Yb3+ is selected as the sensitizer and Er3+ as the activator. The structure and lattice dynamics of (KMg)xSc1.82−xW3O12:0.15Yb/0.03Er (x = 0.4, 0.6, and 0.8) are revealed by variable temperature X-ray diffraction (XRD), Raman testing, field emission scanning electron microscopy (SEM) and differential scanning calorimetry (DSC) to understand the NTE mechanism. UV-vis absorption spectroscopy and density functional theory (DFT) calculations show that the KMgScW3O12 sample has semiconductor properties. An Edinburgh FLS1000 steady-state fluorescence spectrometer connected to a temperature controller (HFS600E-PB2) is used to record the fluorescence spectra and decay curves. The temperature sensing performance of Er3+ is studied in the range of 298–748 K by monitoring the fluorescence intensity ratio (FIR) of 2H11/2 and 4S3/2 thermally coupled energy levels (TCLs). At 385 K, the maximum absolute sensitivity (Sa) is 0.50 × 10⁻² K−1. At 298 K, the maximum relative sensitivity (Sr) is 0.86% K−1. The results show that NTE materials have great application prospects in luminescence. For convenience, the (KMg)xSc1.82−xW3O12:0.15Yb/0.03Er (x = 0.4, 0.6, and 0.8) samples are recorded as KM4, KM6, and KM8 in the following analysis.
2. Results and discussion
2.1 Structure, composition, and morphology analysis
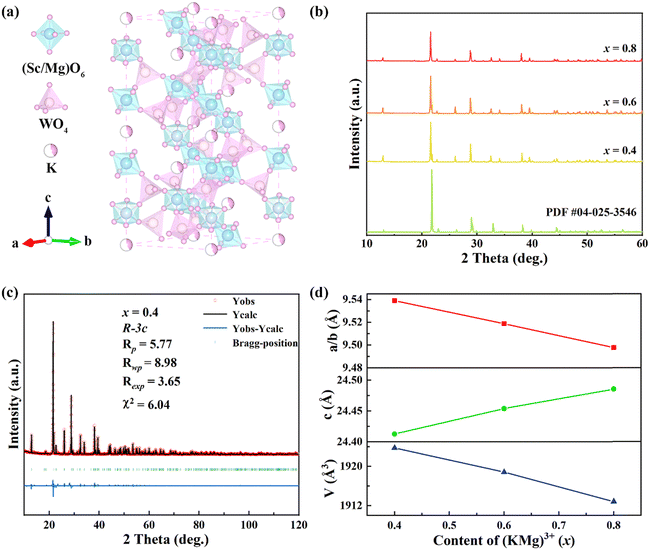
Fig. 1(a) shows the crystal structure of the KM4 sample. The material has a hexagonal structure with the space group R![[3 with combining macron]](https://www.rsc.org/images/entities/char_0033_0304.gif) c (No. 167), which is consistent with those of NZP materials.39 The structure of the KM4 sample consists of a [Sc(Mg)O6] octahedron and a [WO4] tetrahedron, which is connected by a shared O atom, and K+ ions independently embedded in the voids of the crystal structure. As shown in Fig. 1(b), the XRD patterns of KM4, KM6, and KM8 samples are consistent with that of the KMgScMo3O12 standard card (PDF card number 04-025-3546). There are no more or less peaks, indicating that the synthesized sample is pure phase. We perform Rietveld refinement on the crystal structure of the KM4 sample. It has good crystallinity, and the pattern can be well refined by the R
c (No. 167), which is consistent with those of NZP materials.39 The structure of the KM4 sample consists of a [Sc(Mg)O6] octahedron and a [WO4] tetrahedron, which is connected by a shared O atom, and K+ ions independently embedded in the voids of the crystal structure. As shown in Fig. 1(b), the XRD patterns of KM4, KM6, and KM8 samples are consistent with that of the KMgScMo3O12 standard card (PDF card number 04-025-3546). There are no more or less peaks, indicating that the synthesized sample is pure phase. We perform Rietveld refinement on the crystal structure of the KM4 sample. It has good crystallinity, and the pattern can be well refined by the R![[3 with combining macron]](https://www.rsc.org/images/entities/char_0033_0304.gif) c space group. The lattice parameters after refinement are a = b = 9.53897 Å, c = 24.41263 Å, and V = 1923.748 Å3 (Fig. 1c). The room temperature (RT) XRD refinement results of KM6 and KM8 samples are shown in Fig. S1 (ESI†). Fig. 1(d) shows the changes in unit cell parameters and volume of (KMg)xSc1.82−xW3O12:0.15Yb/0.03Er with the content of (KMg)3+ ions. The unit cell parameters and volume of the samples change linearly with the increase of (KMg)3+ ions, and the unit cell volume decreases with the increase of the doping ion content. This is due to the replacement of the larger Sc3+ ion (R = 0.75 Å, CN = 6, R is the ionic radius and CN is the coordination number) by the smaller Mg2+ ion (R = 0.72 Å, CN = 6). These results show that Mg2+ ions are replaced at the Sc3+ site, leading to a slight contraction of the unit cell volume.
c space group. The lattice parameters after refinement are a = b = 9.53897 Å, c = 24.41263 Å, and V = 1923.748 Å3 (Fig. 1c). The room temperature (RT) XRD refinement results of KM6 and KM8 samples are shown in Fig. S1 (ESI†). Fig. 1(d) shows the changes in unit cell parameters and volume of (KMg)xSc1.82−xW3O12:0.15Yb/0.03Er with the content of (KMg)3+ ions. The unit cell parameters and volume of the samples change linearly with the increase of (KMg)3+ ions, and the unit cell volume decreases with the increase of the doping ion content. This is due to the replacement of the larger Sc3+ ion (R = 0.75 Å, CN = 6, R is the ionic radius and CN is the coordination number) by the smaller Mg2+ ion (R = 0.72 Å, CN = 6). These results show that Mg2+ ions are replaced at the Sc3+ site, leading to a slight contraction of the unit cell volume.
The SEM image and the elemental distribution diagram of the KM4 sample are shown in Fig. 2. It displays the irregular blocky structure because of high aggregation under high-temperature calcination. Fig. 2(b)–(h) show the elemental mapping of K, Mg, Sc, W, O, Yb, and Er, and the elements are uniformly distributed in the sample. In addition, XPS analysis is used to determine the valence states of the component elements in the KM4 sample (Fig. S2, ESI†). The valence states of K, Mg, Sc, and Yb are +1, +2, +3, and +3, respectively.
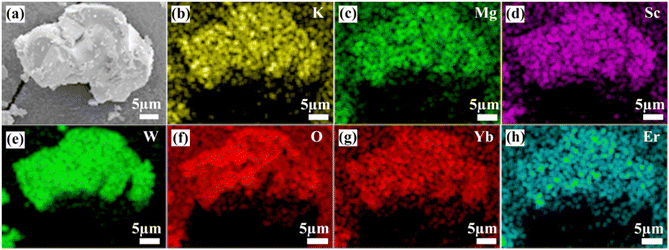 | ||
| Fig. 2 (a) SEM image and (b)–(h) elemental mapping images of K, Mg, Sc, W, O, Yb, and Er elements for the KM4 sample. | ||
2.2 Thermal expansion performance
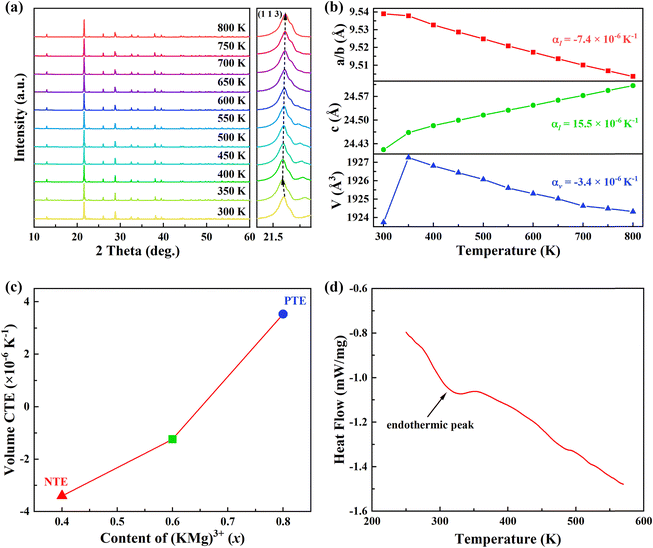
In order to extract the thermal expansion behaviour, the intrinsic thermal expansion of the KM4 sample (300–800 K) was investigated using a variable temperature XRD test (Fig. 3a). The results of variable temperature XRD also suggest that the sample maintains a hexagonal phase structure and has good thermal stability. The illustration shows the diffraction peak (1 1 3) between 21.4° to 21.6° shifts first to the left (300–350 K) and then to the right (350–800 K). We can extract unit cell parameters and volume of the KM4 sample by Rietveld refinement with the Fullprof software, as shown in Fig. 3(b). The detailed unit cell parameters and structural parameters are shown in Tables S1–S3 (ESI†). The thermal expansion of the sample shows anisotropy, contraction of the a/b axis, and expansion of the c-axis. The CTEs of the a, b, and c axes are αa = αb = −7.4 × 10⁻⁶ K−1 and αc = 15.5 × 10⁻⁶ K−1, respectively. The volume CTE is αv = −3.4 × 10⁻⁶ K−1. It should be noted that it shows PTE (300–350 K) and NTE (350–800 K). The initial shift of the diffraction peak to the left may be due to the presence of trace amounts of crystal water in the sample.22 The volume CTEs of KM6 and KM8 are αv = −1.2 × 10⁻⁶ K−1 and αv = 3.5 × 10⁻⁶ K−1, respectively (Fig. S3 and S4, ESI†). Therefore, we can achieve adjustable CTEs by changing the composition ratio of the samples. In addition, compared with samples showing zero thermal expansion (ZTE) such as (Sc0.85Ga0.05Fe0.1)F3 (αl = 0.2 × 10⁻⁶ K−1, 300–900 K),40 NiPt(CN)6 (αl = −1.02(11) × 10−6 K−1, 100–330 K),41 and FeCo(CN)6 (αl = −1.5 × 10⁻⁶ K−1, 4.2–300 K),42 the synthesis method of KM4, KM6 and KM8 samples is simpler and more convenient, and the temperature window is much wider. Fig. 3(c) further shows the change of CTEs of the samples with the content of (KMg)3+ ions. The CTEs of KM4, KM6, and KM8 samples change from negative to zero to positive with the increase of (KMg)3+ ions. The explanation for this phenomenon is that Mg2+ ions occupy the position of Sc3+ ions, and K+ ions are separately embedded in the voids of the structure. As x increases from 0.4 to 0.8, more and more spaces in the crystal structure of the sample are occupied by K+ ions, which weakens the flexibility and reduces the space for the coupling rotation of the material, resulting in the weakening of NTE performance. This thermal expansion behavior also was observed in NaxGaFe(CN)6 and Lix(Sc,Fe)3 systems.16,43 In Fig. 3(d), the endothermic peak at 300–350 K corresponds exactly to the increase in sample volume in Fig. 3(b), so it is speculated that the sample might contain crystal water. After 350 K, the crystal water is completely released and the sample begins to exhibit its own NTE properties. In summary, when x = 0.4, the NTE performance of the sample is the strongest.2.3 NTE mechanism of KM4
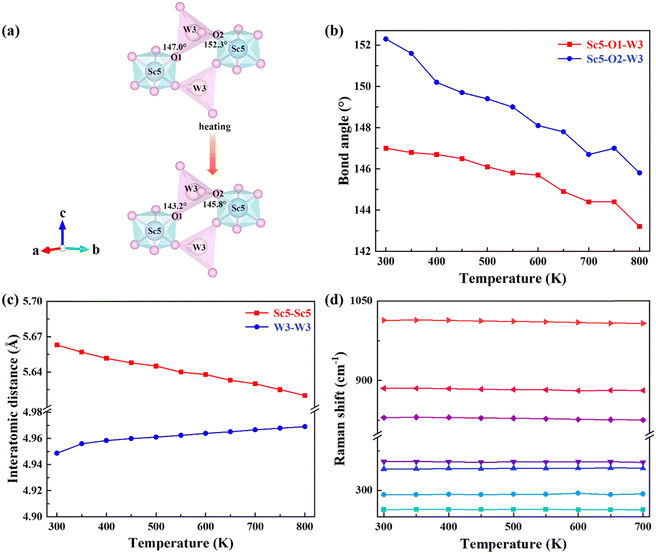
In order to further reveal the mechanism of NTE, bond angles and bond lengths of KM4 are extracted from 300 to 800 K. Fig. 4(a) shows that the KM4 sample has only two kinds of bond angles: Sc5–O1–W3 and Sc5–O2–W3. Sc atoms and W atoms are connected by O1 and O2 to form a Sc–O–W atomic chain and coupled with O atoms for rotation. In order to reveal the NTE of the a/b axis and the PTE of the c-axis, the changes of Sc5–O1–W3 and Sc5–O2–W3 bond angles with temperature are analyzed, as shown in Fig. 4(b). With the increase in temperature, the Sc5–O1–W3 bond angle decreases from 147° to 143.2°, and the Sc5–O2–W3 bond angle decreases from 152.3° to 145.8°, that is, both bond angles decrease. The detailed bond angle information is given in Table S4 (ESI†). The content of (KMg)3+ ions in the KM4 sample is the least among a series of KM4, KM6, and KM8 samples, and there are relatively many gaps in the crystal structure, which makes the material space more flexible and the degree of material coupling rotation the highest. Fig. 4(c) analyzes the variation of the distance between the nearest identical atoms of the KM4 sample with temperature. The distance between Sc5 atoms decreases from 5.6630 Å to 5.6200 Å, and the distance between W3 atoms increases from 4.9487 Å to 4.9692 Å. The detailed bond length information is shown in Table S5 (ESI†). Because both Sc5–O1–W3 and Sc5–O2–W3 bond angles decrease with the increase of temperature, it results in the crystal structure stretching diagonally upward with the increase of temperature according to Fig. 4(a), resulting in contraction of the ab plane and elongation in the c-axis direction.The negative thermal expansion of a framework structure originates from the phonon anharmonic vibrations. Raman spectroscopy has proved to be a powerful tool for studying phonon behaviours, providing information on shifts/broadening of phonon modes with pressure and temperature. Generally, Raman mode frequency undergoes a redshift (softening) with increasing temperature. Anomalous changes in Raman mode indicate negative thermal expansion. Blue shifts (stiffening) are observed at 291 cm−1 and 340 cm−1 (Fig. 4d). As shown in Fig. 4(d), the Raman peaks at 291 cm−1 and 340 cm−1 are assigned to the bending vibrations of MoO4 groups.44 This indicates that these modes have contributed to negative thermal expansion.45,46 It should be noted that other Raman modes also have very little total anharmonicity, indicating that the coefficient of thermal expansion is little. This behaviour was also observed by other zero or low thermal expansion materials.47,48
Fig. S5(b) (ESI†) shows the shift of diffraction peaks corresponding to KM4, KM6, and KM8 samples with (KMg)3+ ions at RT. The vibration modes at 263 cm−1, 292 cm−1, and 354 cm−1 move toward higher wavenumbers with the increase of the (KMg)3+ content. The increase in wavenumber represents the hardening of chemical bonds, which will reduce the structural flexibility of the samples and is not beneficial for NTE.49,50 Therefore, the KM8 sample with the highest content of (KMg)3+ shows PTE. With the decrease of (KMg)3+ ions, the thermal expansion performance of the sample changes from positive to negative.
2.4 Semiconductor properties of the KMgScW3O12 sample
In addition, the band gap of KMgScW3O12 has been investigated by UV-vis absorption spectroscopy. The band gap Eg is obtained by using the Tauc plot method, which is mainly based on the formula proposed by scholars such as Tauc, Davis, and Mott:51 | (1) |
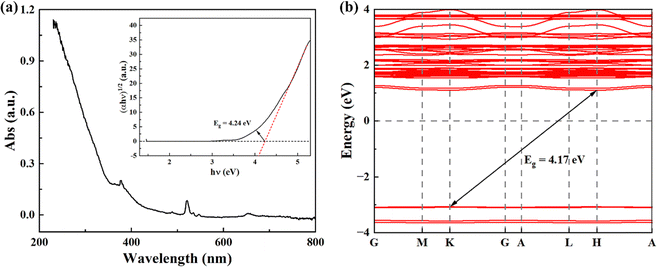 | ||
| Fig. 5 (a) UV-vis absorption spectroscopy of the KMgScW3O12 sample; the inset shows the Tauc plot analyses to determine the optical band gap. (b) Calculated band structure of the KMgScW3O12 sample. | ||
2.5 Luminescence properties and temperature sensing performance of the synthesized particles
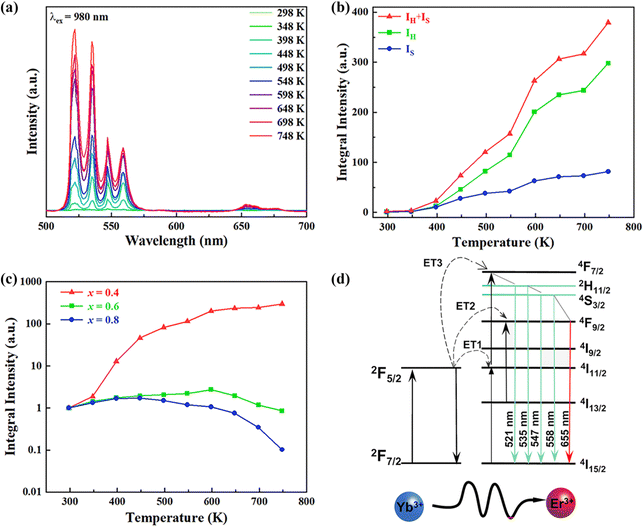
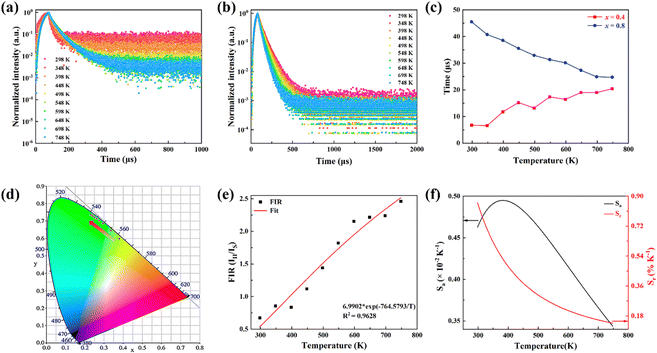
In order to investigate the effect of thermal expansion characteristics on the luminescence performance, the UCL spectra of KM4, KM6, and KM8 samples over the temperature range of 298–748 K are studied under the excitation of a 980 nm laser. Fig. 6(a) shows the UC emission spectra of the KM4 sample with temperature change. The sample has three distinct UC emission bands in the 500–700 nm range, which are derived from the electron emission transition of the activator (Er3+) ion. The green emission bands centered at 521 nm/535 nm and 547 nm/558 nm are generated by the emission transitions of the 2H11/2(2)/2H11/2(1) and 4S3/2(2)/4S3/2(1) energy levels by the Er3+ ion (2H11/2 and 4S3/2) energy level split, respectively.53,54 The 2H11/2 and 4S3/2 energy levels are traditional thermally coupled energy levels, and any pair of energy levels 2H11/2(2)/2H11/2(1) and 4S3/2(2)/4S3/2(1) energy levels are thermally coupled energy levels due to the small energy gap.55 A weak red emission with a central wavelength of 655 nm leads to an electron emission transition from the Er3+ ion (4F9/2 → 4I15/2).56 The spectral position of the KM4 sample is almost not affected by temperature, but the luminescence intensity increases with the increase of temperature, which is different from the TQ phenomenon in many rare earth ion doped luminescent materials.57 In Fig. 6(b), the green UC emission intensity at 521 nm is increased by about 300 times, the green UC emission intensity at 547 nm is increased by about 80 times, and the corresponding total green UC emission intensity (2H11/2 + 4S3/2) is increased by about 380 times (298–748 K). Er3+ ions have excellent green light emission, while the red light emission band is relatively weak from spectra. The change of green emission intensity corresponding to 521 nm in the UCL spectra of samples of different proportions with temperature is analyzed, as shown in Fig. 6(c). The data shown in the figure have been logarithmically processed. The green emission enhancement of the KM4 sample is the strongest, while the green emission of the KM8 sample is first enhanced and then weakened. This phenomenon shows that the stronger the NTE performance, the stronger the luminescence performance of the sample. Fig. 6(d) shows the possible UCL emission mechanism of a sample with the temperature at 298–748 K under 980 nm laser excitation. Yb3+ ions absorb energy from a 980 nm laser excited from the ground state 2F7/2 to the 2F5/2 level, transfer energy to neighboring Er3+ ions and then return to the ground state 2F7/2. ET occurs between Yb3+ and Er3+ ions and energy is transferred to Er3+:4I11/2 (ET1), 4F9/2 (ET2), and 4F7/2 (ET3). Er3+ ions from the ground state 4I15/2 level transition to the 4I11/2 energy level (ET1), and Er3+ ions from the 4I13/2 level transition to the 4F9/2 level (ET2). Er3+ ions transition from the 4I11/2 level to the 4F7/2 level and undergo rapid relaxation from the 4F7/2 level to the 2H11/2(2)/2H11/2(1) and 4S3/2(2)/4S3/2(1) energy levels (ET3). Finally, the green emission bands (521 nm/535 nm and 547 nm/558 nm) can be attributed to the transitions of Er3+: 2H11/2(2)/2H11/2(1) → 4I15/2 and 4S3/2(2)/4S3/2(1) → 4I15/2. The red radiation (655 nm) is produced by the Er3+: 4F9/2 → 4I15/2 transition. The energy transfer depends directly on the sixth power (R−6) of the distance between Yb3+ and Er3+ ions.58,59 The unit cell volume of the KM4 sample decreases with the increase of temperature, and lattice distortion occurs, resulting in a decrease in the distance between the sensitizer (i.e. Yb3+) and the activator (i.e. Er3+), and the ET between the lanthanide dopants is promoted, thus enhancing the UCL intensity of the sample. The KM6 sample displays NTE (350–650 K) and PTE (650–800 K) (Fig. S3, ESI†). The sample shows luminescence thermal enhancement (RT-598 K), the total green UCL intensity is about 3.3 times that of RT, and then the sample shows luminescence TQ (598–748 K) (Fig. S6b, ESI†). Because the KM8 sample displays PTE (350–800 K) (Fig. S4, ESI†), the luminescence intensity of the sample should be quenched with the increase in temperature. The initial luminescence thermal enhancement may be due to the decrease of water molecules on the sample surface with increasing temperature, after which the PTE properties of the substance itself promote the TQ phenomenon of the sample (Fig. S7b, ESI†). Fig. 7(a)–(c) show the decay curves of KM4 and KM8 samples at 521 nm wavelength. Here we use the quadratic exponential function to get A1, A2, T1, and T2: | (2) |
 | (3) |
After fitting, the effective average decay time τ of the KM4 sample in Fig. 7(c) increases from 6.76 μs to 20.44 μs (298–748 K), and that of the KM8 sample decreases from 45.53 μs to 24.75 μs (298–748 K). The calculated trends of decay curves with the temperature of the two samples are consistent with the UCL spectra associated with the samples. The unit cell volume of the KM4 sample decreases with the increase of temperature, which makes the distance between Yb3+ and Er3+ ions decrease, thus improving the ET of Yb3+ ions and Er3+ ions and increasing the effective average decay time τ of the KM4 sample at 521 nm. According to the above analysis, the abnormal luminescence thermal enhancement characteristics of the sample are closely related to the NTE properties of the sample itself. The NTE properties of the sample can induce the phenomenon of luminescence thermal enhancement in the sample. The stronger the NTE of the sample, the better the luminescence performance of the sample. Therefore, the optimal ratio of the KM4 sample is selected for the next stage of the study.
The colour coordinates of the KM4 sample changed from (0.374, 0.565) to (0.238, 0.729) as the temperature increased, and the emitted green light became brighter and brighter (Fig. 7d), further indicating that the stronger the NTE characteristics, the much more the luminescence thermal enhancement behaviour. In general, using the FIR technique between TCLs from rare earth ions, UCL phosphors can be applied to achieve ratio thermometry.62 It is of great significance for sensing applications to select suitable TCLs to study the relationship between luminescence intensity and temperature. The energy gap between 2H11/2 and 4S3/2 levels is 850 cm−1, which is relatively suitable for thermal equilibrium. The ratio of the transition strength of 2H11/2 → 4I15/2 to that of 4S3/2 → 4I15/2 is different with the change of temperature, resulting in the FIR value being temperature dependent. Fig. 7(e) shows the relationship between FIR and temperature. From previous reports,63,64 it can be clearly seen that the FIR value and TCLs have a good exponential relationship with temperature (i.e., T), which is defined as follows:
 | (4) |
 | (5) |
Eqn (4) and (5) describe the thermal equilibrium controlled by the Boltzmann factor, where g is the degeneracy of state, A is the spontaneous emissivity, h is Planck's constant, v is the frequency, E is the energy gap, kB is the Boltzmann constant, and T is the absolute temperature.28 In Fig. 7(e), the FIR (IH/IS) value is proportional to the sample temperature, and the FIR value increases significantly from 0.5411 at 298 K to 2.5170 at 573 K. According to the curve fitting in Fig. 7(e), the absolute sensitivity Sa can be defined using the following equation:60
 | (6) |
The relative sensitivity Sr can be defined using the following formula:30
 | (7) |
S a and Sr are calculated from eqn (6) and (7). At 385 K, Sa has a maximum value of 0.50 × 10⁻² K−1, and at 298 K, Sr has a maximum value of 0.86% K−1 (Fig. 7f). The maximum Sa of the KM6 sample is 0.68 × 10⁻² K−1 at 545 K, and Sr is maximum at 298 K, 1.22% K−1 (Fig. S6d, ESI†). The maximum Sa of the KM8 sample is 0.72 × 10⁻² K−1 at 440 K, and the maximum Sr is 0.98% K−1 at 298 K (Fig. S7d, ESI†). The sensitivity of the rare-earth-doped fluorescent temperature sensor is compared in Table S7 (ESI†). The comparison shows that our material has a good relative sensitivity and a wide temperature range. In addition, it works well at high temperatures. Therefore, our material will be a potential candidate for high-temperature sensors.
3. Conclusions
In summary, the (KMg)xSc2−xW3O12-based compounds with space group R![[3 with combining macron]](https://www.rsc.org/images/entities/char_0033_0304.gif) c are synthesized using a solid-state reaction. They show NTE in the a/b axis and PTE in the c-axis. We can adjust the content of (KMg)3+ to tailor the volumetric thermal expansion from positive to zero and negative. For an NTE material of KM4, the Sc5–O1–W3 bond angle decreases from 147° to 143.2°, and the Sc5–O2–W3 bond angle decreases from 152.3° to 145.8°, and extracting the distance between the nearest identical atoms, the distance between Sc atoms decreases, while the distance between W atoms increases, and NTE occurs in the ab plane. Besides, UV-vis absorption spectroscopy and DFT calculations show that the KMgScW3O12 sample is a wide-band gap semiconductor. KM4 shows the luminescence negative thermal quenching, while the PTE sample of KM8 displays positive thermal quenching behaviour. The lifetimes of KM4 with NTE properties and KM8 with PTE properties are tested, and the trend of sample decay curves with temperature is consistent with the relevant UCL spectra. The NTE properties of the KM4 sample cause the lattice volume shrinkage with the increase in temperature, which improves the ET of Yb3+ to Er3+, and thus the average lifetime τ of the KM4 sample at 521 nm increases. The NTE performance of the KM4 sample is the strongest and the time of luminescence thermal enhancement of this sample is the highest. The temperature sensing performance is studied in the range of 298–748 K. The maximum Sa is 0.50 × 10⁻² K−1 at 385 K, and the maximum Sr is 0.86% K−1 at 298 K. These results show that we have not only discovered a new type of NTE material with adjustable CTE but also provide a new insight for the application of NTE materials in the field of luminescence.
c are synthesized using a solid-state reaction. They show NTE in the a/b axis and PTE in the c-axis. We can adjust the content of (KMg)3+ to tailor the volumetric thermal expansion from positive to zero and negative. For an NTE material of KM4, the Sc5–O1–W3 bond angle decreases from 147° to 143.2°, and the Sc5–O2–W3 bond angle decreases from 152.3° to 145.8°, and extracting the distance between the nearest identical atoms, the distance between Sc atoms decreases, while the distance between W atoms increases, and NTE occurs in the ab plane. Besides, UV-vis absorption spectroscopy and DFT calculations show that the KMgScW3O12 sample is a wide-band gap semiconductor. KM4 shows the luminescence negative thermal quenching, while the PTE sample of KM8 displays positive thermal quenching behaviour. The lifetimes of KM4 with NTE properties and KM8 with PTE properties are tested, and the trend of sample decay curves with temperature is consistent with the relevant UCL spectra. The NTE properties of the KM4 sample cause the lattice volume shrinkage with the increase in temperature, which improves the ET of Yb3+ to Er3+, and thus the average lifetime τ of the KM4 sample at 521 nm increases. The NTE performance of the KM4 sample is the strongest and the time of luminescence thermal enhancement of this sample is the highest. The temperature sensing performance is studied in the range of 298–748 K. The maximum Sa is 0.50 × 10⁻² K−1 at 385 K, and the maximum Sr is 0.86% K−1 at 298 K. These results show that we have not only discovered a new type of NTE material with adjustable CTE but also provide a new insight for the application of NTE materials in the field of luminescence.
Data availability
The data that support the findings of this study are openly available.Conflicts of interest
There are no conflicts to declare.Acknowledgements
This work was supported by the National Natural Science Foundation of China (Grant No. 22071221, 21905252, and 12204208), the Natural Science Foundation of Henan Province (No. 222301420040), and the Yunnan Fundamental Research Project (grant No. 202101BE070001-043). All calculations were supported by the National Supercomputing Center in Zhengzhou. We also thank the Center of Advanced Analysis & Gene Sequencing, Zhengzhou University, for the XRD test.Notes and references
- D. Barrera, J. A. O. Bruno, T. H. K. Barron and N. L. Allan, J. Phys.: Condens. Mater., 2005, 17, R217–R252 CrossRef.
- E. Tallentire, F. Child, I. Fall, L. Vella-Zarb, I. R. Evans, M. G. Tucker, D. A. Keen, C. Wilson and J. S. O. Evans, J. Am. Chem. Soc., 2013, 135, 12849–12856 CrossRef PubMed.
- X. Zhen, A. Sanson, Q. Sun, E. Liang and Q. Gao, Phys. Rev. B, 2023, 108, 144102 CrossRef CAS.
- K. Greve, K. L. Martin, P. L. Lee, P. J. Chupas, K. W. Chapman and A. P. Wilkinson, J. Am. Chem. Soc., 2010, 132, 15496–15498 CrossRef.
- Y. Qiao, S. Zhang, P. Zhang, J. Guo, A. Sanson, X. Zhen, K. Zhao, Q. Gao and J. Chen, Nano Res., 2024, 17, 2195–2203 CrossRef CAS.
- Q. Gao, J. Chen, Q. Sun, D. Chang, Q. Huang, H. Wu, A. Sanson, R. Milazzo, H. Zhu, Q. Li, Z. Liu, J. Deng and X. Xing, Angew. Chem., Int. Ed., 2017, 56, 9023–9028 CrossRef CAS PubMed.
- Q. Gao, Y. Jiao, Q. Sun, J. Sprenger, M. Finze, A. Sanson, E. Liang, X. Xing and J. Chen, Angew. Chem., Int. Ed., 2024, 13, e202401302 Search PubMed.
- H. N. Rimmer, M. T. Dove, A. L. Goodwin and D. C. Palmer, Phys. Chem. Chem. Phys., 2014, 16, 21144–21152 RSC.
- I. Grobler, V. J. Smith, P. M. Bhatt, S. A. Herbert and L. J. Barbour, J. Am. Chem. Soc., 2013, 135, 6411–6414 CrossRef CAS.
- M. Azuma, W.-T. Chen, H. Seki, M. Czapski, S. Olga, K. Oka, M. Mizumaki, T. Watanuki, N. Ishimatsu, N. Kawamura, S. Ishiwata, M. G. Tucker, Y. Shimakawa and J. P. Attfield, Nat. Commun., 2011, 2, 347 CrossRef.
- Y. Long, T. Saito, T. Tohyama, K. Oka, M. Azuma and Y. Shimakawa, Inorg. Chem., 2009, 48, 8489–8492 CrossRef CAS.
- C. Wang, L. Chu, Q. Yao, Y. Sun, M. Wu, L. Ding, J. Yan, Y. Na, W. Tang, G. Li, Q. Huang and J. W. Lynn, Phys. Rev. B: Condens. Matter Mater. Phys., 2012, 85, 220103 CrossRef.
- J. Cliffe, J. A. Hill, C. A. Murray, F.-X. Coudertc and A. L. Goodwin, Phys. Chem. Chem. Phys., 2015, 17, 11586–11592 RSC.
- A. Mary, J. S. O. Evans, T. Vogt and A. W. Sleight, Science, 1996, 272, 90–92 CrossRef.
- M. Förster and A. W. Sleight, Int. J. Inorg. Mater., 1999, 1, 123–127 CrossRef.
- J. Chen, Q. Gao, A. Sanson, X. Jiang, Q. Huang, A. Carnera, C. G. Rodriguez, L. Olivi, L. Wang, L. Hu, K. Lin, Y. Ren, Z. Lin, C. Wang, L. Gu, J. Deng, J. P. Attfield and X. Xing, Nat. Commun., 2017, 8, 14441 CrossRef CAS.
- R. Hester, J. C. Hancock, S. H. Lapidus and A. P. Wilkinson, Chem. Mater., 2017, 29, 823–831 CrossRef.
- A. Marinkovic, P. I. Pontón, C. P. Romao, T. Moreira and M. A. White, Front. Mater., 2021, 8, 741560 CrossRef.
- H. Liu, W. Sun, Z. Zhang, L. N. Lovings and C. Lind, Solids, 2021, 2, 87–107 CrossRef CAS.
- J. Miller, C. P. Romao, M. Bieringer, B. A. Marinkovic, L. Prisco, M. A. White and L. Pinckney, J. Am. Ceram. Soc., 2013, 96, 561–566 CrossRef.
- K. Tyagi, S. N. Achary and M. D. Mathews, J. Alloys Compd., 2002, 339, 207–210 CrossRef.
- X. Liu, Y. Cheng, E. Liang and M. Chao, Phys. Chem. Chem. Phys., 2014, 16, 12848–12857 RSC.
- O. Hagman, P. Kierkegaard, P. Karvonen, A. I. Virtanen and J. Paasivirta, Acta Chem. Scand., 1968, 22, 1822–1832 CrossRef.
- E. Breval, H. A. McKinstry and D. K. Agrawal, J. Mater. Sci., 2000, 35, 3359–3364 CrossRef CAS.
- I. Pet'Kov and A. I. Orlova, Inorg. Mater., 2003, 39, 1013–1023 CrossRef.
- B. Angadi, V. M. Jali, M. T. Lagare, N. S. Kini and A. M. Umarji, Bull. Mater. Sci., 2002, 25, 191–196 CrossRef CAS.
- H. Liu, H. Wang, X. Zheng, P. Wang and Y. Zhang, Dalton Trans., 2022, 51, 13106–13118 RSC.
- X. Qin, J. Xu, Y. Wu and X. Liu, ACS Cent. Sci., 2019, 5, 29–42 CrossRef CAS PubMed.
- C. Homann, L. Krukewitt, F. Frenzel, B. Grauel, C. Würth, U. Resch-Genger and M. Haase, Angew. Chem., Int. Ed., 2018, 57, 8765–8769 CrossRef CAS PubMed.
- V. Morozov, S. Zhang, M. C. Brennan, B. Janko and M. Kuno, ACS Energy Lett., 2017, 2, 2514–2515 CrossRef.
- X. Yan and Y. D. Li, Adv. Funct. Mater., 2005, 15, 763–770 CrossRef.
- J. Zou, B. Chen, Y. Hu, Q. Zhang, X. Wang and F. Wang, J. Phys. Chem. Lett., 2020, 11, 3020–3024 CrossRef.
- J. Liao, M. Wang, F. Lin, Z. Han, B. Fu, D. Tu, X. Chen, B. Qiu and H.-R. Wen, Nat. Commun., 2022, 13, 2090 CrossRef CAS PubMed.
- J. Huang, Z. Han, B. Fu, H. Yan, J. Liao, G. Gong and H.-R. Wen, Mater. Today Commun., 2022, 33, 104548 CrossRef CAS.
- Y. Wei, Y. Pan, E. Zhou, Z. Yuan, H. Song, Y. Wang, J. Zhou, J. Rui, M. Xu, L. Ning, Z. Liu, H. Wang, X. Xie, X. Tang, H. Su, X. Xing and L. Huang, Angew. Chem., Int. Ed., 2023, 135, e202303482 CrossRef.
- M. Seshadri, M. Radha, M. J. V. Bell and V. Anjos, Ceram. Int., 2018, 44, 20790–20797 CrossRef CAS.
- R. Dousti, R. J. Amjad, R. Hosseinian, M. Salehi and M. R. Sahar, J. Lumin., 2015, 159, 100–104 CrossRef.
- R. Balda, V. Seznec, V. Nazabal, J. L. Adam, M. Al-Saleh and J. Fernández, J. Non-Cryst. Solids, 2006, 352, 2444–2447 CrossRef CAS.
- A. Woodcock and P. Lightfoot, J. Mater. Chem., 1999, 9, 2907–2911 RSC.
- L. Hu, J. Chen, L. Fan, Y. Ren, Y. Rong, Z. Pan, J. Deng, R. Yu and X. Xing, J. Am. Chem. Soc., 2014, 136, 13566–13569 CrossRef CAS PubMed.
- W. Chapman, P. J. Chupas and C. J. Kepert, J. Am. Chem. Soc., 2006, 128, 7009–7014 CrossRef PubMed.
- S. Margadonna, K. Prassides and A. N. Fitch, J. Am. Chem. Soc., 2004, 126, 15390–15391 CrossRef CAS PubMed.
- M. Li, Y. Li, C.-Y. Wang and Q. Sun, Chin. Phys. Lett., 2019, 36, 066301 CrossRef CAS.
- M. Kozhevnikova and T. N. Khamaganova, Russ. J. Inorg. Chem., 2008, 53, 800–804 CrossRef.
- P. Salke, M. K. Gupta, R. Rao, R. Mittal, J. Deng and X. Xing, J. Appl. Phys., 2015, 117, 235902 CrossRef.
- A. Sanson, M. Giarola, G. Mariotto, L. Hu, J. Chen and X. Xing, Mater. Chem. Phys., 2016, 180, 213–218 CrossRef CAS.
- Y. Gao, C. Wang, Q. Gao, J. Guo, M. Chao, Y. Jia and E. Liang, Inorg. Chem., 2020, 59, 18427–18431 CrossRef CAS.
- Y. Liu, D. Mei, N. Wang, M. S. Molokeev, X. Jiang and Z. Lin, ACS Appl. Mater. Interfaces, 2020, 12, 38435–38440 CrossRef CAS.
- Q. Gao, Q. Sun, A. Venier, A. Sanson, Q. Huang, Y. Jia, E. Liang and J. Chen, Sci. China Mater., 2022, 65, 553–557 CrossRef.
- Y. Liu, D. Mei, N. Wang, M. S. Molokeev, X. Jiang and Z. Lin, ACS Appl. Mater. Inter., 2020, 12, 38435–38440 CrossRef CAS.
- C. S. Tauc, R. Grigorovici and A. Vancu, Phys. Status Solidi B, 1966, 15, 627–637 CrossRef.
- S. Wang and B. M. Klein, Phys. Rev. B: Condens. Matter Mater. Phys., 1981, 24, 3393–3416 CrossRef.
- N. Niu, P. Yang, F. He, X. Zhang, S. Gai, C. Li and J. Lin, J. Mater. Chem., 2012, 22, 10889–10899 RSC.
- N. Niu, F. He, S. Gai, C. Li, X. Zhang, S. Huang and P. Yang, J. Mater. Chem., 2012, 22, 21613–21623 RSC.
- H. Lu, R. Meng, H. Hao, Y. Bai, Y. Gao, Y. Song, Y. Wang and X. Zhang, RSC Adv., 2016, 6, 57667–57671 RSC.
- F. Wang, Y. Han, C. S. Lim, Y. Lu, J. Wang, J. Xu, H. Chen, C. Zhang, M. Hong and X. Liu, Nature, 2010, 463, 1061–1065 CrossRef CAS.
- J. Qiao, L. Ning, M. S. Molokeev, Y.-C. Chuang, Q. Liu and Z. Xia, J. Am. Chem. Soc., 2018, 140, 9730–9736 CrossRef CAS PubMed.
- W. Lin, X. Bai, B. Zhu, S. Yan, K. Ruan, X. Cai, Z. Ding, B. Zhang, I. Khan, A. A. Haider, J. Qiu, Z. Song, A. Huang, Y. Cun, C. Tatiana and Z. Yang, Ceram. Int., 2023, 49, 38247–38255 CrossRef CAS.
- B. Barthem and R. Buisson, J. Lumin., 1988, 40, 637–638 CrossRef.
- Y. Wu, T. He and L. Lun, J. Photochem. Photobiol., A, 2019, 376, 135–139 CrossRef CAS.
- M. Müller and T. Jüstel, J. Lumin., 2014, 155, 398–404 CrossRef.
- H. Cui, Y. Cao, Y. Zhang, T. Peng, L. Cao, S. Ran, Y. Wang, D. Wu, X. Li, X. Zhang and B. Chen, Ceram. Int., 2021, 47, 21271–21275 CrossRef CAS.
- M. Sójka, J. F. C. B. Ramalho, C. D. S. Brites, K. Fiaczyk, L. D. Carlos and E. Zych, Adv. Opt. Mater., 2019, 7, 1901102 CrossRef.
- M. Runowski, N. Stopikowska, D. Szeremeta, S. Goderski, M. Skwierczyńska and S. Lis, ACS Appl. Mater. Interfaces, 2019, 11, 13389–13396 CrossRef CAS.
Footnote |
| † Electronic supplementary information (ESI) available. See DOI: https://doi.org/10.1039/d4tc00711e |
| This journal is © The Royal Society of Chemistry 2024 |

