Enhanced electromagnetic wave absorption and mechanical performances of graphite nanosheet/PVDF foams via ice dissolution and normal pressure drying†
Xiaogang
Su
 *,
Yu
Zhang
,
Jun
Wang
and
Yaqing
Liu
*
Key Laboratory of Functional Nanocomposites of Shanxi Province, School of Materials Science and Engineering, North University of China, Taiyuan 030051, China. E-mail: sxgwhut@163.com; 20200173@nuc.edu.cn
First published on 10th May 2024
Abstract
Developing lightweight polymer-based composite materials with electromagnetic (EM) wave absorption and mechanical load-bearing properties is urgent for application in complex environments. Herein, low-cost two-dimensional graphite nanosheets (GNS) were utilized as the functional filler phase, and GNS/polyvinylidene fluoride (PVDF) composite foams were fabricated using the ice dissolution and normal pressure drying method. The foam exhibits a directionally aligned structure induced by the temperature field. Ice dissolution of strong polarity DMSO is achieved through solvent exchange between it and water. Furthermore, the EM wave absorption and compression properties can be adjusted by varying the ratio of GNS to PVDF. The maximum reflection loss reaches −57.68 dB at a frequency of 10.64 GHz and a thickness of 2.7 mm, with an impressive effective absorption bandwidth of 6.86 GHz, outperforming most reported absorptive materials. It demonstrates a maximum compression strength of 300.9 kPa at a deformation of 15%. Therefore, the foam not only has excellent EM wave absorption capabilities but also possesses strong compression load-bearing capacity, providing a new perspective for the design of structurally functionalized composite materials.
1 Introduction
Compared to traditional metal materials, polymers offer several advantages, including lightweight properties, resistance to corrosion and fatigue, as well as ease of molding.1,2 Consequently, they are widely employed in various fields such as radar systems, structural components, and packaging. However, standalone polymer materials frequently face challenges in meeting the rigorous performance demands of the technological industry, especially in addressing electromagnetic (EM) interference in electronic devices and fulfilling radar stealth requirements.3–6 These issues can be effectively tackled by integrating functional elements with EM wave absorption capabilities into the polymer matrix.Carbon materials are excellent candidates for EM wave absorption materials (EWAMs) due to their superior environmental adaptability, electrical conductivity, and lightweight properties.7–11 Various forms of carbon materials have been developed, such as zero-dimensional (0D) carbon spheres, one-dimensional (1D) carbon nanotubes (CNTs), carbon nanofibers (CNFs), two-dimensional (2D) reduced graphene oxide (RGO), and graphite nanosheets (GNS). Employing a multi-framework that combines multiple loss mechanisms is seen as an effective strategy for broadening the loss mechanism.12–14 For example, Su et al. proposed a method for creating binary absorption materials with both electrical and magnetic loss by combining GNS with iron–cobalt alloys.15 Additionally, Zhang et al. introduced conductive polymers of polypyrrole and strong magnetic Fe3O4 on carbon nanotubes, adjusting the component ratio to optimize impedance matching and attenuation capabilities, resulting in a maximum reflection loss of −51.8 dB.16 Furthermore, not only does the type and morphology of the EM absorbing filler influence the properties, but its distribution pattern within the matrix holds significant importance as well.17–25 Precisely speaking, randomly filling the absorption functional units of multiple carbon materials into the polymer matrix using mechanical methods often fails to form an effective conductive network, requiring high filler ratios to achieve good absorption effects and potentially sacrificing their lightweight properties.
Establishing a conductive network structure within the polymer can enable the inherent function of absorption functional units at low filler ratios. Current methods include prefabricated structures filled with polymers, supercritical CO2 foaming, and one-step freeze-drying methods.26–29 For instance, Zou et al. fabricated polystyrene (PS)/poly methyl methacrylate (PMMA)/multi-wall carbon nanotube (MWCNT) composite foams with a porous double percolated structure via supercritical CO2 foaming.26 Chen et al. prepared 3D networks of RGO/2-mercaptobenzimidazole (MB) filler and natural rubber (NR) matrix using a one-step ice-templated method to improve thermal performance.30 Wang et al. took inspiration from natural nacre to conduct a strong BNNS/CMC/epoxy resin through bidirectional freeze-casting and vacuum-assisted resin infiltration.31 Su et al. prefabricated a CoS2/N, S co-doped carbon aerogel by freeze drying and subsequently investigated EM wave absorption properties by vacuum-assisted infusion of epoxy resin.32 Among these methods, the one-step freeze-drying process efficiently bridges functional elements through an oriented arrangement. Nonetheless, the negative pressure drying process often encounters time-consuming and challenging environmental issues, limiting its industrial application.
Regarding EWAMs, the matrix (such as polyurethane, polyethylene terephthalate, epoxy resin, etc.) plays a pivotal role as a carrier for the EM absorbing filler.33–36 Seyedian et al. successfully synthesized MgFe2O4 nanoparticles exhibiting diverse phases and morphologies, and subsequently integrated them with a polyethylene terephthalate matrix to significantly bolster the absorbing capabilities.37 Among them, polyvinylidene fluoride (PVDF), as a thermoplastic polymer, is known for its corrosion resistance and high dielectric constant, along with recyclability. Herein, by utilizing low-cost GNS as the absorption functional element, an integrated process including ice dissolution and normal pressure drying is employed to create PVDF/GNS (PG) composite foams with oriented structures. Significantly, leveraging the characteristics of PVDF and the solvent DMSO, replacement between water and DMSO solvent occurs at only 5–10 °C and normal pressure, achieving the goal of ice dissolution while preserving the microstructure. Through adjusting the ratio of GNS and PVDF, the electrical properties, absorption properties, and compression properties of the composite foams are examined.
2 Experiment
2.1 Materials
GNS was obtained from expandable graphite sourced from Qingdao Rising Graphite Limited Company. PVDF (FR906) with a molecular weight of 500![[thin space (1/6-em)]](https://www.rsc.org/images/entities/char_2009.gif) 000 was purchased from Shanghai Sanai Polymer Company. DMSO solvent was provided by Tianjin Damao Reagent Limited Company. Purified water was obtained from a water purifier for the experimental process.
000 was purchased from Shanghai Sanai Polymer Company. DMSO solvent was provided by Tianjin Damao Reagent Limited Company. Purified water was obtained from a water purifier for the experimental process.
2.2 The preparation of PG
GNS were prepared by high-temperature expansion, ultrasonic peeling, and negative pressure drying of expandable graphite. The specific preparation process can be found in the ESI.† PVDF/GNS composite foams were obtained through unidirectional freezing, solvent exchange, and normal drying. Specifically, a certain ratio of PVDF and GNS was added to 15 mL of DMSO solvent, with a total solute content of 10 wt.%, and ultrasonicated for 20 min at 50 °C. The mixture was mechanically stirred for 1 h at 75 °C until the PVDF was completely dissolved in the DMSO. The solution was then poured into a dedicated freezing mold in a liquid nitrogen condition, obtaining a solidified block. Subsequently, it was immersed in 2 L of purified water for solvent replacement, maintaining the replacement temperature at 5–10 °C and replacing the water every 4 h until no obvious DMSO odor was detected. Typically, water replacing frequency is 6 times. Finally, the sample was transferred to a forced draft drying oven and dried at 30 °C for 48 h. The mass ratios of PVDF and GNS were 95![[thin space (1/6-em)]](https://www.rsc.org/images/entities/char_2009.gif) :
:![[thin space (1/6-em)]](https://www.rsc.org/images/entities/char_2009.gif) 5, 90
5, 90![[thin space (1/6-em)]](https://www.rsc.org/images/entities/char_2009.gif) :
:![[thin space (1/6-em)]](https://www.rsc.org/images/entities/char_2009.gif) 10, 85
10, 85![[thin space (1/6-em)]](https://www.rsc.org/images/entities/char_2009.gif) :
:![[thin space (1/6-em)]](https://www.rsc.org/images/entities/char_2009.gif) 15, and 80
15, and 80![[thin space (1/6-em)]](https://www.rsc.org/images/entities/char_2009.gif) :
:![[thin space (1/6-em)]](https://www.rsc.org/images/entities/char_2009.gif) 20, and these were designated as PG-1, PG-2, PG-3, and PG-4, respectively.
20, and these were designated as PG-1, PG-2, PG-3, and PG-4, respectively.
2.3 Characterization
To characterize the phase transformation and crystallinity, various techniques were utilized, including X-ray diffraction (XRD, Haoyuan DX-2700B), Fourier Transform Infrared Spectroscopy (FTIR, Nicolet 6700, Thermo Fisher), and Differential Scanning Calorimetry (DSC, TA-Q20). Field Emission Scanning Electron Microscopy (FESEM, Hitachi SU-8010) was employed to observe the microstructure of PG. Nitrogen isothermal adsorption and desorption was collected by Microporous Physical Adsorbent Analyzer (ASAP2020). Additionally, a resistance tester was utilized to measure the resistance value R of PG, and the volume conductivity ρ was theoretically calculated using the formula ρ = R × A/d, where A is the contact area and d is the thickness. To investigate the EM wave absorption and shielding, a vector network analyzer (VNA, Agilent N5232) was employed to collect EM parameters (complex permittivity, εr = ε′ − jε′′; complex permeability, μr = μ′ − jμ′′). The EM wave absorption performance was then calculated using specific formulas (1)–(3). The parameters Z0 and Zin represent the air impedance and input impedance, respectively. f, d, and c denote the frequency, thickness, and ideal speed of light. Furthermore, based on the standard of GB/T 1041-92, the compression performance of PG was tested using a universal testing machine. | (1) |
 | (2) |
RL = 20![[thin space (1/6-em)]](https://www.rsc.org/images/entities/char_2009.gif) lg|Zin − Z0/Zin + Z0| lg|Zin − Z0/Zin + Z0| | (3) |
3 Results and discussion
The process for preparing PG is depicted in Fig. 1(a). In a high-temperature environment, the nitrogen–sulfur organic matter within the expandable graphite instantaneously transforms into gas, generating strong forces perpendicular to the graphite layers and resulting in worm-like expanded graphite.15 Through ultrasonic cavitation, adjacent graphite layers are peeled off, obtaining multi-layered GNS. Subsequently, the GNS are dispersed in the strongly polar solvent DMSO along with PVDF. Upon induction of a temperature field, the PVDF/GNS solution and the solvent DMSO undergo phase separation, producing a PVDF/GNS/DMSO block with a directional structure. Due to the low melting point of DMSO at 10 °C and its high solubility with water, water slowly erodes the DMSO ice block during the immersion process, achieving the purpose of ice dissolution through solvent displacement. At the same time, the inertia of PVDF in water allows the thawed PVDF to retain its original microstructure. Ultimately, through the process of water evaporation under room temperature and atmospheric pressure, a PG composite foam with a low density of 0.21 g cm−3 is obtained, corresponding digital image shown in Fig. S1 (ESI†).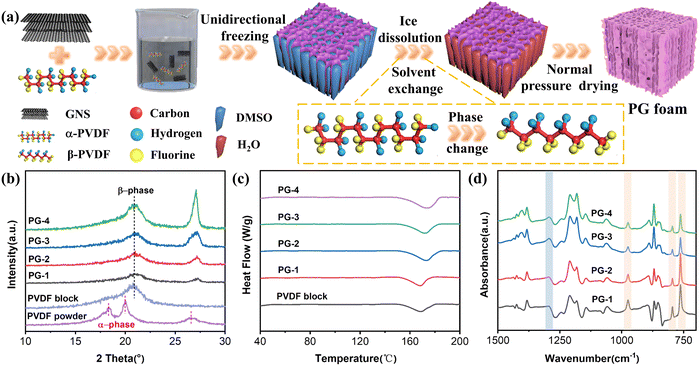 | ||
| Fig. 1 (a) Preparation process of PG foam; (b) XRD patterns of PG, PVDF block, and PVDF powder; (c) DSC curves of PG and PVDF block; (d) FTIR curves of PG. | ||
When the PVDF crystal is immersed in water, the polar –OH group of the water molecule interacts with the dipole of PVDF. Although it is a relatively weak physical force, it is enough to cause a rearrangement of the molecular structure within the PVDF crystal over time, leading to the transformation of PVDF from a non-polar α-phase to an electroactive β-phase crystal structure. This phenomenon can be confirmed by XRD, DSC, and FTIR analysis. As depicted in Fig. 1(b), untreated PVDF powder displays distinct diffraction peaks at 2θ = 18.3°, 20°, and 26.56°, corresponding to the (101), (110), and (112) crystal planes of α phase.28 After immersion in water, the original α-phase characteristic peaks essentially vanish, and a new diffraction peak emerges at 2θ = 21°, indicating a change in the crystal structure phase. More importantly, the peak intensity gradually boosts with the increase of GNS relative ratio, indicating that the presence of GNS is beneficial for PVDF nucleation. This is attributed to the dipole realignment caused by the molecular interactions between the functional groups on the surface of GNS and PVDF. Simultaneously, with the increase of GNS content in the composite foam, the (002) crystal plane diffraction peak at approximately 27.2° also gradually increases. Fig. 1(c) displays the DSC curves of PG and PVDF block. As the proportion of GNS increases, the melting temperature elevates from 168.3 °C to 173.9 °C, accompanied by a broader melting peak. The melting enthalpies are determined to be 24.5 J g−1, 24.9 J g−1, 30.0 J g−1, 30.9 J g−1, and 43.3 J g−1, respectively (Fig. S2, ESI†). Using the melting enthalpy (105 J g−1) of 100% crystalline PVDF and the mass fraction, the corresponding crystallinity which increases from 23.7% initially to 51.5% is calculated. This suggests that introducing two-dimensional GNS enhances the crystallinity of PVDF. The improvement in crystallinity and melting point validates the crystal phase transition. Furthermore, in the FTIR spectrum (Fig. 1(d)), it is observed that the characteristic signals of the α phase at 763 cm−1, 795 cm−1, and 975 cm−1 gradually diminish, while the absorption peak of the β phase at 1290 cm−1 progressively intensifies.38 In theory, the transition from non-polar to polar reinforces the dipole moment effect of the molecular structure, which serves to enhance polarization loss and EM wave attenuation.
Fig. 2(a)–(h) displays the scanning electron microscopy (SEM) images of PG at different magnifications. It is evident that PG exhibits a directional honeycomb structure, which is primarily attributed to the squeezing effect of DMSO ice crystals under the influence of an external gradient temperature field. During phase separation, PVDF/GNS collaboratively constitute the channel walls of the honeycomb structure, while DMSO is removed after solvent displacement, resulting in channels that run from top to bottom. Additionally, energy-dispersive spectroscopy (EDS) was utilized to investigate the distribution of F and C elements, revealing that their distribution is consistent, further confirming the composition of the channel walls (Fig. S3, ESI†). Compared to structures produced via freeze-vacuum drying, foams created by ice dissolution-normal drying still maintain intact skeleton structures. At the microscopic level, due to the thickness of GNS ranging from 10 μm to 50 μm and being composed of multiple layers of graphite, it possesses a certain level of rigidity. GNS are staggered and arranged in a calabashes-like configuration within the matrix. This structure differs from flexible graphene or MXene, which typically spreads out completely within the PVDF matrix. It is worth noting that as the GNS content in the matrix increases, the pore and specific surface areas have some change (Fig. S4, ESI†). The average pore width of PG-1, PG-2, PG-3, and PG-4 are 22.07 nm, 21.00 nm, 15.54 nm, and 13.50 nm. The specific surface areas are 6.16 m2 g−1, 6.34 m2 g−1, 9.16 m2 g−1 and 4.32 m2 g−1. Simultaneously, the surface of the channel walls becomes increasingly rough and discontinuous, and the calabashes-like structure also becomes denser. This unique structure effectively boosts wave propagation resistance and multiple scattering when utilized for EM wave absorption, thereby improving wave absorption performance.
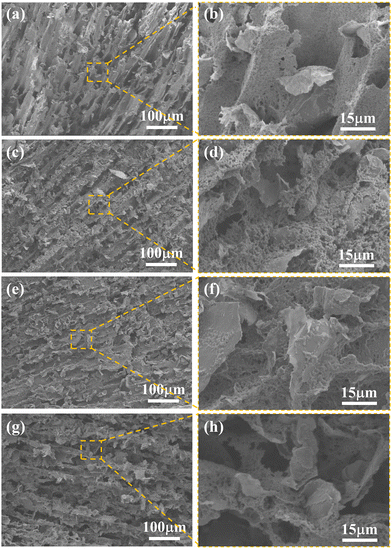 | ||
| Fig. 2 SEM images of (a), (b) PG-1, (c), (d) PG-2, (e), (f) PG-3, and (g), (h) PG-4 at different magnifications. | ||
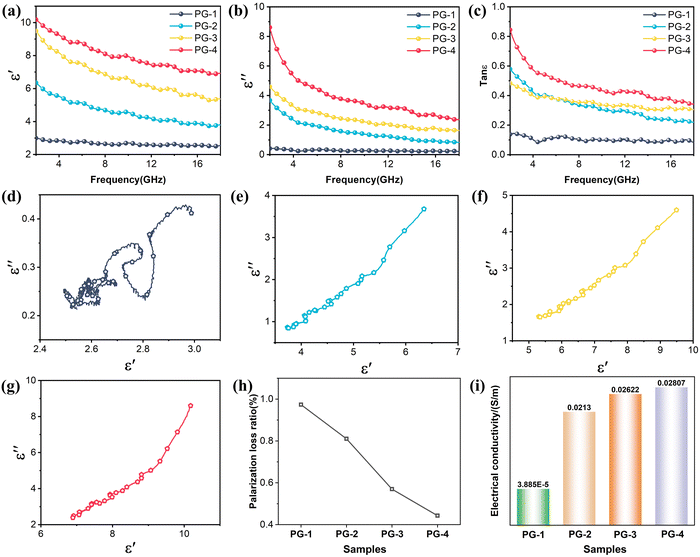
Fig. 3(a) and (b) illustrates the real (ε′) and imaginary (ε′′) parts of the permittivity of PG composite foams within the range of 2–18 GHz. For PG-1, PG-2, PG-3, and PG-4, ε′ values range from 10.2 to 6.9, 9.5 to 5.3, 6.4 to 3.8, and 3 to 2.5, while ε′′ values range from 8.5 to 2.4, 4.6 to 1.6, 3.7 to 0.8, and 0.4 to 0.2, respectively. The specific frequency dispersion characteristics of material lead to a decrease in the permittivity with increasing frequency, particularly notable in the low-frequency range. It is worth noting that as the amount of GNS increases, both the ε′ and ε′′ of the composite foams rise. Particularly, PG-4 demonstrates the highest tan![[thin space (1/6-em)]](https://www.rsc.org/images/entities/char_2009.gif) δε, indicating its strongest capability for attenuating EM wave (Fig. 3(c)). Moreover, the minimal change in permittivity from PG-3 to PG-4 may be attributed to the fact that GNS has already formed a complete conductive network in the matrix, reaching the percolation threshold.
δε, indicating its strongest capability for attenuating EM wave (Fig. 3(c)). Moreover, the minimal change in permittivity from PG-3 to PG-4 may be attributed to the fact that GNS has already formed a complete conductive network in the matrix, reaching the percolation threshold.
To delve deeper into the progression of dielectric behavior, Debye relaxation theory and non-linear fitting techniques were employed.39,40Fig. 3(d)–(g) illustrates the Cole–Cole plots of PG with ε′ and ε′′. The presence of a circular segment within these curves signifies the occurrence of polarization relaxation within the system. Nevertheless, this circle remains incomplete owing to conductive losses. Notably, the circle for PG-1 is more prominent compared to the other three curves, highlighting a more pronounced polarization relaxation phenomenon. As for the remaining circles, they exhibit elongated straight lines with progressively increasing proportions, indicating that augmentation of GNS in the matrix leads to a gradual surge in the proportion of conductive loss amidst dielectric loss. This could be attributed to the fact that in PG-1, the volume fraction of GNS is minuscule and fails to establish a comprehensive interconnected network. It is difficult to develop prominent conductive losses simply by electron hopping between neighboring GNSs. Both the interface polarization between GNS/PVDF and the dipolar polarization inherent to the β-phase PVDF contribute to polarization loss. When the volume fraction is substantial, a complete conductive network of GNS gives rise to heightened conductive loss.41 Additionally, as the complexity of the calabashes-like structure escalates, EM wave propagation path becomes increasingly convoluted, thereby accelerating the attenuation of wave energy. Furthermore, Fig. 3(h) shows the non-linear fitting analysis of the polarization loss proportion by the least squares method. It is found that this trend aligns seamlessly with variations in permittivity and electrical conductivity in Fig. 3(i).
Based on the RL two-dimensional color maps of PG-1, PG-2, PG-3, and PG-4 in Fig. 4(a)–(d), the absorption performance of each sample is clearly demonstrated. The key metrics for assessing absorption performance include maximum reflection loss, effective absorption bandwidth, and matching thickness. Notably, PG-3 stands out with exceptional absorption performance among these samples, boasting a maximum reflection loss of −57.68 dB at a frequency of 10.64 GHz and a thickness of 2.7 mm, along with an impressive effective absorption bandwidth of 6.86 GHz. The color maps feature crescent-shaped regions, delimited by a RL of −10 dB threshold, which are caused by the quarter-wave theory. Fig. 4(e) further illustrates that as the thickness increases, the frequency associated with the most pronounced absorption peak shifts toward lower frequencies. This exceptional performance surpasses that of numerous reported EMAW materials, positioning PG-3 as a promising contender for next-generation high-performance absorption applications.42–57
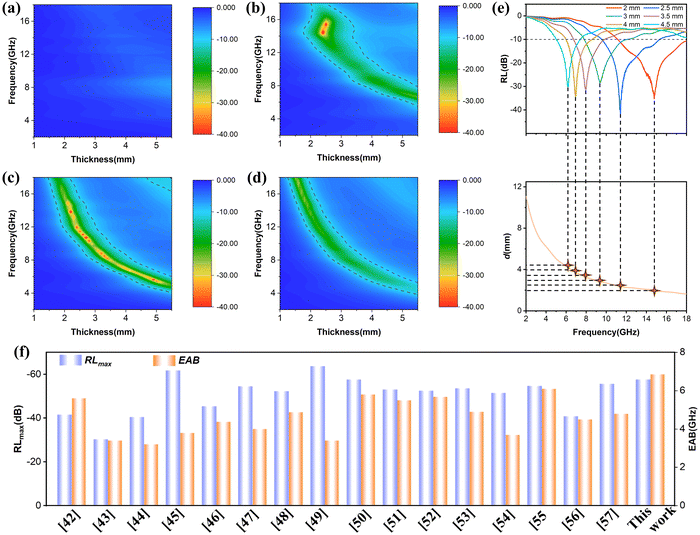 | ||
| Fig. 4 (a)–(d) RL plots of PG with frequency and thickness; (e) frequency versus thickness at the maximum RL; (f) comparison of wave absorption properties with other reported EMAWs. | ||
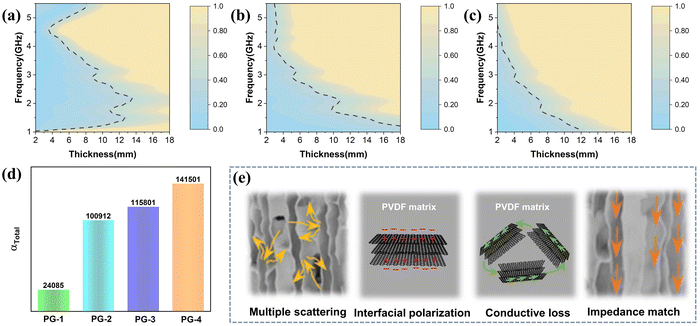
The absorption performance of EMAWs is significantly influenced by two key factors: impedance matching and attenuation ability.58 PG-1, which exhibits no significant absorption performance, is not further discussed. Impedance matching maps of PG-2, PG-3, and PG-4 are displayed in Fig. 5(a)–(c). While the channel structure facilitates the entry of EM wave, the varying GNS ratios still affect impedance matching. Specifically, PG-4 shows the least region with |Δ| less than 0.4, indicating lower impedance matching primarily due to skin depth mismatches caused by conductivity. Among them, PG-3 achieves a balance between impedance matching and attenuation capability, as shown in Fig. 5(d) and Fig. S5 (ESI†), enabling it to fully attenuate incident EM wave. Generally speaking, the excellent absorption performance can be attributed to several factors, as shown in Fig. 5(e). Firstly, its unique calabashes-like structure prolongs the propagation path of EM wave, providing more opportunities for energy dissipation during transmission and jumping processes. Secondly, temperature field-induced channels and an appropriate PVDF/GNS ratio allow more EM wave to enter the material, which is beneficial for impedance matching. Thirdly, the oriented arrangement of rigid GNSs facilitates multiple scattering. Finally, the heterogeneous interfaces between PVDF/GNS and dipolar polarization of β-phase PVDF itself provide interfacial polarization and dipole polarization, collectively enhancing the attenuation capability against EM wave.
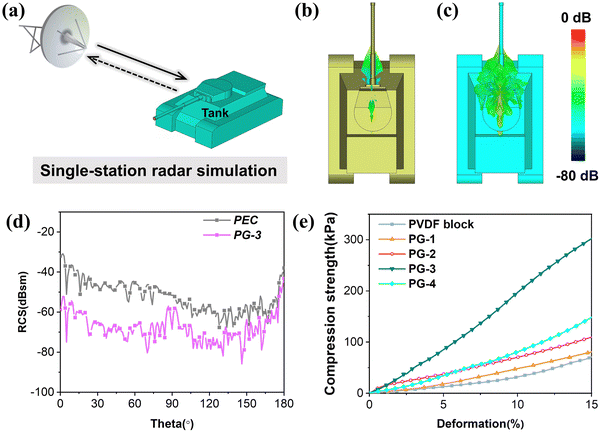
To assess the absorption effect of PG-3 in practical applications, finite element simulations were conducted. As shown in Fig. 6(a), a tank model (1000 mm × 700 mm × 500 mm) served as the target, with a coating thickness of 2.7 mm and a monitoring frequency set at 10.64 GHz. The radar cross-section (RCS) is used as the criterion for evaluation. For instance, in a single-station radar simulation system, a lower RCS of the target implies that the radar receives less echo energy. By calculating the far-field radiation of the target, it is observed that the tank with the PG-3 coating exhibits a significant reduction in far-field radiation intensity, as illustrated in Fig. 6(b) and (c). The two-dimensional curves of RCS and RCS reduction (Fig. 6(d) and Fig. S6, ESI†) provide a more intuitive view, showing that the RCS values of the PG-3 coating are lower than those of the perfect electrical conductor (PEC) backplane in the incident angle of 0–180°. Notably, at an incident angle of 70°, the maximum RCS reduction reaches 34.1 dBsm, with an average RCS reduction of 15.7 dBsm. These findings convincingly demonstrate the excellent attenuation ability of PG-3, highlighting its potential for application in the field of stealth technology.
Furthermore, we employed the waveguide method to collect the S11 and S21 parameters of the samples within the X-band (8.2–12.4 GHz), and subsequently calculated the values of reflecting shielding effectiveness (SER), absorbing shielding effectiveness (SEA), and total shielding effectiveness (SE) as depicted in Fig. S7(a)–(c) (ESI†). Evidently, with the increasing content of GNS in the composite foam, the SE gradually rises, favoring the electromagnetic shielding capabilities of the material. Here, SER represents the shielding effectiveness of reflection characteristics, while SEA signifies the shielding effectiveness of absorption characteristics.59–61 As the filling rate of GNS increases, both SER and SEA exhibit an overall upward trend. It's worth noting that SER is closely related to the skin depth. When the content of GNS in the composite foam enhanced, the conductivity (σ) rises accordingly, leading to a decrease in skin depth (δ) based on formula (4).
 | (4) |
To better satisfy real working conditions, the mechanical properties of this foam have been significantly improved in addition to enhancing its ability to absorb EM wave. Fig. 6(e) depicts the strain-compression performance curve of the foam. At a 15% strain, the maximum compression strengths are 68.3 kPa, 79.6 kPa, 110 kPa, 300.9 kPa, and 149.2 kPa (Fig. S8(a), ESI†). It is evident that the compression stress is not directly correlated with the GNS content. This is primarily attributed to the formation of a sea-island structure by a small amount of GNS in the PVDF matrix, allowing for full utilization of the inherent properties of the filler phase to enhance the stiffness of the channel walls and then improve compression performance.62,63 However, excessive GNS disrupt the continuous phase of PVDF and have limited dispersibility, thereby undermining the sea-island effect and ultimately leading to a reduced compression performance. Furthermore, it is apparent that the foam is unable to completely revert to its original state after significant deformation (Fig. S8(b), ESI†). This is mainly due to the irreversible slippage and relative movement of PVDF molecular chains and the PVDF/GNS interface phase under external force. In conclusion, this foam not only possesses EM wave absorption capabilities but also exhibits load-bearing capabilities, making it suitable for use in various complex working conditions.
4. Conclusion
In this paper, low-cost 2D GNS as the functional filler and thermoplastic polymer PVDF as the matrix are utilized to manufacture GNS/PVDF composite foams through freeze-casting, ice dissolution, and normal pressure drying methods. Benefiting from the feature of the polar solvent DMSO with a melting point of 18.4 °C and miscibility to water, solvent exchange between water and DMSO is carried out at temperatures in the range of 5–10 °C, promoting the dissolution of DMSO ice block. Simultaneously, the inertia of water on PVDF ensures the stability of the directional structure induced by temperature fields. More significantly, the ice dissolution and the introduction of GNS enhance the transformation and nucleation of α-phase to β-phase, which facilitates the formation of dipole moments and promotes polarization loss. Moreover, the EM wave absorption and compression properties of the composite foams are optimized by regulating the ratio of PVDF to GNS. Ultimately, when the ratio is set to 85![[thin space (1/6-em)]](https://www.rsc.org/images/entities/char_2009.gif) :
:![[thin space (1/6-em)]](https://www.rsc.org/images/entities/char_2009.gif) 15, the optimal microwave absorption with a RLmax of −57.68 dB (f = 10.64 GHz, d = 2.7 mm) and an EAB of 6.86 GHz, and compression performance with a maximum compression strength of 300.9 kPa at a compressive strain of 15% are obtained. These findings offer technical guidance for designing other PVDF-based EM absorption foams with mechanical load-bearing properties.
15, the optimal microwave absorption with a RLmax of −57.68 dB (f = 10.64 GHz, d = 2.7 mm) and an EAB of 6.86 GHz, and compression performance with a maximum compression strength of 300.9 kPa at a compressive strain of 15% are obtained. These findings offer technical guidance for designing other PVDF-based EM absorption foams with mechanical load-bearing properties.
Conflicts of interest
There are no conflicts to declare.Acknowledgements
This research received support from the Natural Science Foundation of Shanxi Province (no. 20210302124048), the High-level Talent Research Initiation Project of North University of China, the Shanxi Province 1331 Project Key Innovation Team of Polymeric Functional New Materials, and Special Project for Research and Development of Key Core Technologies and Common Technologies in Shanxi Province: Forward Design, Scale Preparation and Verification of Engineering Application of Anti-strong Electromagnetic Pulse/wide-band Absorption Meta-materials (No. 2020XXX020).References
- Y. Guo, K. Ruan, G. Wang and J. Gu, Sci. Bull., 2023, 68, 1195–1212 CrossRef CAS PubMed.
- X. Su, J. Wang, T. Liu, Y. Zhang, Y. Liu, B. Zhang, Y. Liu, H. Wu and H. X. Xu, Adv. Funct. Mater., 2024, 2403397 CrossRef.
- T. Li, J. Li, Z. Xu, Y. Tian, J. Li, J. Du and F. Meng, Small, 2023, 19(21), 2300233 CrossRef CAS PubMed.
- Y. Wu, L. Chen, Y. Han, P. Liu, H. Xu, G. Yu, Y. Wang, T. Wen, W. Ju and J. Gu, Nano Res., 2023, 16, 7801–7809 CrossRef CAS.
- X. Zhong, M. He, C. Zhang, Y. Guo, J. Hu and J. Gu, Adv. Funct. Mater., 2024, 2313544 CrossRef CAS.
- S. Liu, J. Wang, B. Zhang, X. Su, X. Chen, Y. Chen, H. Yang, Q. Wu and S. Yang, Carbon, 2024, 219, 118802 CrossRef CAS.
- Z. Zhao, Y. Qing, L. Kong, H. Xu, X. Fan, J. Yun, L. Zhang and H. Wu, Adv. Mater., 2023, 36(4), 2304182 CrossRef PubMed.
- H. Sun, R. Che, X. You, Y. Jiang, Z. Yang, J. Deng, L. Qiu and H. Peng, Adv. Mater., 2014, 26, 8120–8125 CrossRef CAS PubMed.
- X. Su, J. Wang, M. Han, Y. Liu, B. Zhang, S. Huo, Q. Wu, Y. Liu and H.-X. Xu, J. Colloid Interface Sci., 2023, 652, 780–788 CrossRef CAS PubMed.
- X. Su, M. Han, Y. Liu, J. Wang, C. Liang and Y. Liu, J. Colloid Interface Sci., 2022, 628, 984–994 CrossRef CAS PubMed.
- X. Zhao, C. Liu, J. He, W. Zhang, X. Duan and C. Liang, Diamond Relat. Mater., 2024, 141, 110594 CrossRef CAS.
- X. Xu, S. Shi, Y. Tang, G. Wang, M. Zhou, G. Zhao, X. Zhou, S. Lin and F. Meng, Adv. Sci., 2021, 8(5), 2002658 CrossRef CAS PubMed.
- X. Zeng, X. Jiang, Y. Ning, F. Hu and B. Fan, J. Adv. Ceram., 2023, 12(8), 1562–1576 CrossRef CAS.
- J. Yan, Y. Huang, X. Zhang, X. Gong, C. Chen, G. Nie, X. Liu and P. Liu, Nano-Micro Lett., 2021, 13(1), 114 CrossRef CAS PubMed.
- X. Su, J. Wang, X. Zhang, S. Huo, W. Dai and B. Zhang, J. Alloys Compd., 2020, 829, 154426 CrossRef CAS.
- M. Zhang, X. Qian, Q. Zeng, Y. Zhang, H. Cao and R. Che, Carbon, 2021, 175, 499–508 CrossRef CAS.
- R. Peymanfar and F. Fazlalizadeh, Chem. Eng. J., 2020, 402, 126089 CrossRef CAS.
- R. Peymanfar, M. Yektaei, S. Javanshir and E. Selseleh-Zakerin, Polymer, 2020, 209, 122981 CrossRef CAS.
- R. Peymanfar, S. Javanshir, M. R. Naimi-Jamal and S. H. Tavassoli, J. Mater. Sci., 2021, 56, 17457–17477 CrossRef CAS.
- L. Rao, Z. Liu, L. Wang, W. You, C. Yang, R. Zhang, X. Xiong, L. Yang, H. Zhang, J. Zhang, H. Lv and R. Che, Adv. Funct. Mater., 2023, 33(47), 2306984 CrossRef CAS.
- X. Guan, Z. Yang, Y. Zhu, L. Yang, M. Zhou, Y. Wu, L. Yang, T. Deng and G. Ji, Carbon, 2022, 188, 1–11 CrossRef CAS.
- L. Liang, W. Gu, Y. Wu, B. Zhang, G. Wang, Y. Yang and G. Ji, Adv. Mater., 2022, 34, 2106195 CrossRef CAS.
- Y. Wu, Y. Zhao, M. Zhou, S. Tan, R. Peymanfar, B. Aslibeiki and G. Ji, Nano-Micro Lett., 2022, 14, 171 CrossRef CAS.
- Z. Wu, H. W. Cheng, C. Jin, B. Yang, C. Xu, K. Pei, H. Zhang, Z. Yang and R. Che, Adv. Mater., 2022, 34, 2107538 CrossRef CAS PubMed.
- H. Zhang, J. Cheng, H. Wang, Z. Huang, Q. Zheng, G. Zheng, D. Zhang, R. Che and M. Cao, Adv. Funct. Mater., 2022, 32, 2108194 CrossRef CAS.
- F. Zou, J. Chen, X. Liao, P. Song and G. Li, Compos. Sci. Technol., 2021, 213, 108895 CrossRef CAS.
- S. Suresh, V. G. Krishnan, D. Dasgupta, K. P. Surendran and E. B. Gowd, ACS Appl. Mater. Interfaces, 2023, 15(42), 49567–49582 CrossRef CAS PubMed.
- K. Jinyoung, J. Moonjeong, J. Geonyoung, Y. Seungyeon, P. Jonghwa, L. Youngoh, C. Soowon, Y. Jeonghee, L. Youngsu, C. Ayoung, K. Young-Ryul, Y. Yeoheung, L. Sun Sook, A. Ki-Seok and K. Hyunhyub, Nano Energy, 2021, 89, 106409 CrossRef.
- L. Deng, R. Shu and J. Zhang, J. Colloid Interface Sci., 2022, 614, 110–119 CrossRef CAS PubMed.
- C. Jiaqi, H. Rizheng, C. Hongfeng, S. Zhijian, Z. Zhiyi, L. Yaqing, A. Dong and W. Chingping, Polym. Compos., 2024 DOI:10.1002/pc.28116.
- W. Huagao, L. Rongjian, L. Lei, L. Cheng, Y. Jia, L. Rui, S. Guoxing, J. Lei and C. Qunfeng, Nano Res., 2023, 17(2), 820–828 Search PubMed.
- J. Wang, M. Han, Y. Liu, Y. Xiang, C. Liang, X. Su and Y. Liu, J. Colloid Interface Sci., 2023, 646, 970–979 CrossRef CAS PubMed.
- R. Peymanfar, J. Karimi and R. Fallahi, J. Appl. Polym. Sci., 2020, 137, 0021–8995 CrossRef.
- H. Dogari, R. Peymanfar and H. Ghafuri, RSC Adv., 2023, 13, 22205–22215 RSC.
- R. Peymanfar, P. Mousivand and A. Mirkhan, Energy Technol., 2024, 2194–4288 Search PubMed.
- S. Sheykhmoradi, A. Ghaffari, A. Mirkhan, G. B. Ji, S. J. Tan and R. Peymanfar, Dalton Trans., 2024, 53, 4222–4236 RSC.
- S. M. Seyedian, A. Ghaffari, A. Mirkhan, G. Ji, S. Tan, S. Ghorbanian-Gezaforodi and R. Peymanfar, Ceram. Int., 2024 Search PubMed.
- H. Cheng, Z. Huan, C. Quan, L. Tao, K. Lingjian, Z. Hui and H. Lirong, Chem. Eng. J., 2022, 450, 138280 CrossRef.
- X. Zeng, C. Zhao, X. Jiang, R. Yu and R. Che, Small, 2023, 19, 2303393 CrossRef CAS PubMed.
- C. Xu, P. Liu, Z. Wu, H. Zhang, R. Zhang, C. Zhang, L. Wang, L. Wang, B. Yang, Z. Yang, W. You and R. Che, Adv. Sci., 2022, 9(17), 2200804 CrossRef CAS PubMed.
- Z. Wu, K. Pei, L. Xing, X. Yu, W. You and R. Che, Adv. Funct. Mater., 2019, 29(28), 1901448 CrossRef.
- H. Ma, P. Gong, G. Li and C. B. Park, Compos. Sci. Technol., 2023, 244, 110274 CrossRef CAS.
- J. Liu, Z. Dong, Z. Zhang, R. Sun, M. Chen, H. Wang, Z. Zhang, M. Zhang, X. Jia and C. Zhi, J. Mater. Res. Technol., 2022, 21, 4674–4687 CrossRef CAS.
- Y. Li, Y. Qing, W. Li, M. Zong and F. Luo, Adv. Compos. Hybrid Mater., 2021, 4, 1027–1038 CrossRef CAS.
- N. Gao, W.-P. Li, W.-S. Wang, D.-P. Liu, Y.-M. Cui, L. Guo and G.-S. Wang, ACS Appl. Mater. Interfaces, 2020, 12, 14416–14424 CrossRef CAS PubMed.
- Y. Zhou, M. Wu, J. Jiang, P. Yang, T. Rao, J. J. Liou and W. Liao, Appl. Surf. Sci., 2022, 574, 151463 CrossRef CAS.
- F. Li, W. Zhan, Y. Su, S. H. Siyal, G. Bai, W. Xiao, A. Zhou, G. Sui and X. Yang, Composites, Part A, 2020, 133, 105866 CrossRef CAS.
- H.-Y. Wang, X.-b Sun and G.-S. Wang, J. Mater. Chem. A, 2021, 9, 24571–24581 RSC.
- L. L. Adebayo, H. Soleimani, N. Yahya, Z. Abbas, M. Sabet, F. A. Wahaab and R. T. Ayinla, J. Mater. Res. Technol., 2020, 9, 2513–2521 CrossRef CAS.
- M. Sun, Z. Xiong, Z. Zhang, C. Chen, L. Qin, D. Wang, F. Wu and P. Liu, Compos. Sci. Technol., 2022, 228, 109663 CrossRef CAS.
- S. Shi, P. Mou, D. Wang, X. Li, S. Teng, M. Zhou, X. Yu, Z. Deng, G. Wan and G. Wang, J. Materiomics, 2024, 10, 124–133 CrossRef.
- X. Zhao, Y. Huang, X. Liu, J. Yan, L. Ding, M. Zong, P. Liu and T. Li, J. Colloid Interface Sci., 2022, 607, 192–202 CrossRef CAS PubMed.
- H. Xu, G. Zhang, Y. Wang, Y. Wang, H. Wang, Y. Huang and P. Liu, Nano Res., 2022, 15, 8705–8713 CrossRef CAS.
- X. Zeng, Y. Ning, H. Guo, N. Xie and R. Yu, Mater. Today Phys., 2023, 34, 101077 CrossRef CAS.
- C. Wei, M. He, M. Li, X. Ma, W. Dang, P. Liu and J. Gu, Mater. Today Phys., 2023, 36, 101142 CrossRef CAS.
- J. Li, Z. Xu, T. Li, D. Zhi, Y. Chen, Q. Lu, J. Wang, Q. Liu and F. Meng, Composites, Part B, 2022, 231, 109565 CrossRef CAS.
- Y. Zhang, L. Li, C. Du, G. Wan, Q. Wei, X. Zhou, Y. Su, Y. Xu and G. Wang, J. Mater. Sci. Technol., 2023, 151, 109–118 CrossRef CAS.
- L. Cai, H. Jiang, F. Pan, H. Liang, Y. Shi, X. Wang, J. Cheng, Y. Yang, X. Zhang, Z. Shi, H. Wu and W. Lu, Small, 2023, 20(9), 2306698 CrossRef PubMed.
- J. Yang, Y. Chen, X. Yan, X. Liao, H. Wang, C. Liu, H. Wu, Y. Zhou, H. Gao and Y. Xia, Compos. Sci. Technol., 2023, 240, 110093 CrossRef CAS.
- J. Yang, H. Wang, Y. Zhang, H. Zhang and J. Gu, Nano-Micro Lett., 2024, 16, 31 CrossRef CAS PubMed.
- C. Liang, W. Zhang, C. Liu, J. He, Y. Xiang, M. Han, Z. Tong and Y. Liu, Chem. Eng. J., 2023, 471, 144500 CrossRef CAS.
- S. Zhang, G. Zhang, J. Qiu, Z. Jiang, H. Xing, M. Li and T. Tang, Compos. Commun., 2018, 7, 30–35 CrossRef.
- H. Xiao, Z. X. Huang, Z. P. Zhang, M. Z. Rong and M. Q. Zhang, Compos. Sci. Technol., 2022, 230, 109087 CrossRef CAS.
Footnote |
| † Electronic supplementary information (ESI) available. See DOI: https://doi.org/10.1039/d4tc00929k |
| This journal is © The Royal Society of Chemistry 2024 |

