 Open Access Article
Creative Commons Attribution 3.0 Unported Licence
Open system massive synthesis of narrow-band blue and green fluorescent graphene quantum dots and their application in water sensing†
Yukino
Ochi
,
Ayano
Otani
,
Rika
Katakami
,
Akihiro
Ogura
 ,
Ken-ichi
Takao
 ,
Yoshiki
Iso
 * and
Tetsuhiko
Isobe
 *
*
Department of Applied Chemistry, Faculty of Science and Technology, Keio University, 3-14-1 Hiyoshi, Kohoku-ku, Yokohama 223-8522, Japan. E-mail: iso@applc.keio.ac.jp; isobe@applc.keio.ac.jp; Fax: +81 45 566 1551; Tel: +81 45 566 1558 Tel: +81 45 566 1554
First published on 5th April 2024
Abstract
Graphene quantum dots (GQDs) are environmentally friendly fluorescent carbon-based nanomaterials. However, there is no report on the massive synthesis of GQDs with narrow-band fluorescence and a high photoluminescence quantum yield (PLQY) using a simple liquid-phase method under atmospheric conditions. In this study, GQDs were successfully synthesized in ∼100% product yield by heating phloroglucinol (PG) with Na3PO4·12H2O in 1,2-pentanediol at 180 °C for 6 h in an open system with air flow, followed by dialysis purification. The high product yield was attributed to the addition of Na3PO4·12H2O as a base catalyst, which promoted the dehydration–condensation reaction between PG molecules. The dispersion of PG derived GQDs (PG-GQDs) in ethanol resulted in blue fluorescence with a full width at half maximum of 32 nm and a PLQY of 54%. Further purification of PG-GQDs by silica gel column chromatography improved the PLQY to 75%. Fourier-transform infrared spectroscopy, 1H nuclear magnetic resonance spectroscopy, and X-ray photoelectron spectroscopy confirmed that dehydration–condensation reactions occurred not only between PGs but also between GQDs and 1,2-pentanediol. The binding of 1,2-pentanediol to the edges of GQDs suppressed the stacking of GQDs and prevented concentration quenching, resulting in a high PLQY. PG-GQDs exhibited negative fluorescence solvatochromism, i.e., the fluorescence wavelength blue-shifted with increasing solvent polarity. Dispersion of PG-GQDs in N-methyl-2-pyrrolidone (MP) resulted in green fluorescence with a PLQY of 96%. Dispersion of PG-GQDs in water resulted in blue fluorescence and a low PLQY of 6% at pH 7, while the PLQY was more than 50% at pH ≥ 11. Using these properties, the sensing of water (pH 13) in MP was investigated. The results showed that as the water content was increased from 0% to 100%, the fluorescence color gradually changed from green to blue and the fluorescence wavelength continuously shifted from 514 nm to 466 nm, indicating their applicability in water sensing.
1. Introduction
Graphene quantum dots (GQDs), also called carbon quantum dots or carbon dots, are carbon-based fluorescent nanomaterials with a π-electron conjugated system.1 GQDs have biocompatibility,2,3 low toxicity,2,4 high thermal stability, and high photostability;2,5 therefore, they are expected to be an alternative material to inorganic semiconductor quantum dots (QDs) containing toxic elements such as cadmium and lead, the use of which is restricted by the RoHS Directive. The applications of GQDs include bioimaging,6–8 their use in light-emitting diodes,9–11 metal ion sensing,12 moisture sensing13 and anti-counterfeiting.14One of the attractive features of GQDs is that their photoluminescence (PL) wavelength can be controlled by tuning their size. For example, the solvothermal reaction of citric acid and urea in different solvents (water, glycerol, and N,N-dimethylformamide) yielded GQDs of different sizes and they exhibited blue, green, and red emission, respectively, due to the quantum size effect.15 Controlled particle size and tunable emission color of citric acid-derived GQDs could be achieved by purification methods such as dialysis and gel permeation chromatography.16 Solvothermally synthesized GQDs from phthalic acid and o-phenylenediamine in ethanol, followed by purification by silica gel column chromatography, exhibited green and yellow emission depending on their size.17
QDs such as CdSe/ZnS and CsPbBr3 generally have the PL peak with a full width at half maximum (fwhm) of less than 30 nm,18,19 whereas the abovementioned GQDs have a broad PL peak with the fwhm exceeding 60 nm. Little work has been reported on narrow-band fluorescent GQDs.20–23 One of the GQDs has been synthesized from aromatic compounds with hydroxy groups, i.e., phloroglucinol (PG) and resorcinol (RS).20,21 Yuan et al. solvothermally synthesized 1.9 nm GQDs from PG in ethanol at 200 °C for 9 h. The GQDs in ethanol exhibited blue emission with a fwhm of 29 nm and a PL quantum yield (PLQY) of 66%.20 The narrow-band fluorescence with the high PLQY is attributed to the dehydration–condensation reaction between adjacent PG molecules to form a rigid triangular structure with uniform OH groups at the edges, as illustrated in Fig. S1 (ESI†). Furthermore, by prolonging the heating time and using acid catalysts, they obtained 2.4 nm, 3.0 nm, and 3.9 nm GQDs that emitted green, yellow, and red fluorescence, respectively, due to the quantum size effect. Yuan et al. also found that solvothermal treatment of RS in ethanol at 200 °C for 4 h and 7 h produced GQDs that emitted green and red fluorescence with fwhms of 31 nm and 33 nm and PLQYs of 75% and 72%, respectively, due to the quantum size effect.21Tables 1 and 2 summarize the reports of GQDs synthesized from PG and RS, respectively. Note that the solid-state thermal reaction of PG without solvent produced GQDs with broad-band fluorescence;24,25 therefore, liquid-phase synthesis is considered more suitable for narrow-band fluorescent GQDs than the solid-phase synthesis.
| Synthetic method | Synthetic condition | Purification | λ em (nm) | fwhm (nm) | PY | PLQY | Year | Ref. |
|---|---|---|---|---|---|---|---|---|
| Solvothermal | 200 °C, 2–24 h, (H2SO4), in ethanol | Silica gel column chromatography | 472–598 | 29, 30 | 8–13% | 54–72% in ethanol | 2018 | 20 |
| Microwave assisted | 500 W, 5 min, in N,N-dimethylformamide | Centrifugation, silica gel column chromatography | 484–550 | 38 | — | 17% in ethanol | 2019 | 28 |
| Thermal heating | 190 °C, 25–90 min, H2SO4, in H2O | Centrifugation, dialysis, and filtration | 438–550 | — | — | 1.03–23% in ethanol | 2020 | 29 |
| Thermal heating | 180 °C, 6 h, in 1,2-pentanediol | Dialysis and centrifugation | 481 | 30 | — | 51% in ethanol | 2021 | 26 Our work |
| Thermal heating | 200 °C, 3 h, boric acid, solvent free | — | 620 | — | 75% | 18.2% in solid state | 2021 | 30 |
| Solvothermal | 200 °C, 10 h, hydrochloric acid, in N,N-dimethylformamide | Filtration | 548 | — | — | 19.9% in ethanol | 2022 | 31 |
| Solvothermal | 200 °C, 24 h, in ethanol | Silica gel column chromatography | 485 | 30 | — | 77% in ethanol | 2022 | 32 |
| Thermal heating | 180 °C, 6 h, in 1,2-pentanediol | Dialysis, centrifugation, and silica gel column chromatography | 481 | 29 | — | 64% in ethanol | 2023 | 27 Our work |
| Thermal heating | 180 °C, 6 h, Na3PO4·12H2O, in 1,2-pentanediol | Dialysis | 484 | 32 | 99.4% | 54% in ethanol | This work | |
| Dialysis and silica gel column chromatography | 483 | 32 | 24.4% | 75% in ethanol |
| Synthetic method | Synthetic condition | Purification | λ em (nm) | fwhm (nm) | PY | PLQY | Year | Ref. |
|---|---|---|---|---|---|---|---|---|
| Thermal heating | 190 °C, 6 h, Na3PO4·12H2O, in 1,2-ethanediol | Centrifugation | 600 | — | 40–60% | 30% in ethanol, 25% in water | 2019 | 5 |
| Solvothermal | 200 °C, 4, 7 h, in ethanol | Silica gel column chromatography | 520, 610 | 31, 33 | — | 72, 75% in ethanol | 2019 | 21 |
| Thermal heating | 180 °C, 6 h, NaOH or H2SO4, in 1,2-ethanediol | Centrifugation | 520 | 36 | 17% | 8–42% in ethanol | 2022 | 33 |
| Thermal heating | 180 °C, 6 h, Na3PO4·12H2O, in 1,2-pentanediol | Dialysis | — | — | 82.7% | — | This work | |
| Dialysis and silica gel column chromatography | 542 | 40 | 19.8% | 13% in ethanol |
We have successfully synthesized GQDs from PG in an open system at a low temperature of 180 °C and in a short period of 6 h by accelerating the dehydration–condensation reaction between PG molecules and removing the formed water from the system.26 Ethanol dispersion of dialysis-purified GQDs resulted in blue fluorescence with a fwhm of 30 nm and a PLQY of 51%. Further purification by silica gel column chromatography improved the PLQY to 64%.27 The GQDs also exhibited negative fluorescence solvatochromism, showing blue fluorescence in highly polar solvents and green fluorescence in less polar solvents.26 Despite the narrow fwhm, high PLQY, and multicolor luminescence achieved, the low product yield (PY) of dialysis-purified GQDs, 3%, remains a problem in the synthesis of GQDs in an open system using PG as a carbon source.
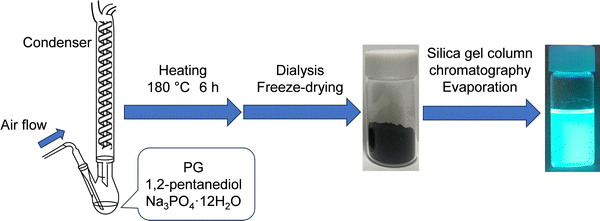
In this study, we investigated the massive synthesis of GQDs with narrow-band fluorescence in an open system. We preliminarily explored increasing the reaction temperature (from 180 °C to 210 °C), the carbon source concentration (up to 6-times higher), the use of HCl catalyst, and the synthesis scale (up to 3-times higher), all of which failed to increase PYs and product amounts. We focused on the report that the PY was 40–60% for GQDs synthesized by heating an ethylene glycol solution of RS with air flow at 190 °C for 6 h using Na3PO4·12H2O as a base catalyst (Table 2 and Fig. S1, ESI†).5 However, in this report, the PL peak was broad and the PLQYs of GQDs in ethanol and water were as low as 30% and 25%, respectively, and the PLQY of GQDs synthesized from PG instead of RS was 1%. As shown in Scheme 1, here we investigated the synthesis condition to obtain GQDs with a high PY by combining three conditions: attachment of a condenser, addition of the base catalyst Na3PO4·12H2O, and air flow while heating the 1,2-pentanediol solution of PG under atmospheric pressure. In addition, to understand the factors determining a high PY and a high PLQY, the base catalyst was changed from Na3PO4·12H2O to NaOH or the flow gas was changed from air to Ar. We also synthesized GQDs from RS and PG and compared their properties. Furthermore, the fluorescence solvatochromism of massively synthesized GQDs in organic solvents and the PL properties of GQDs in water under basic conditions were investigated, and water sensing in organic solvents was demonstrated.
2. Experimental section
2.1. Materials
PG (95.0%) and RS (99.0%) were purchased from FUJIFILM Wako Pure Chemical. 1,2-Pentanediol (98.0%) was purchased from Tokyo Chemical Industry. Trisodium phosphate dodecahydrate (99.0%), dichloromethane (99.5%), methanol (MeOH; 99.8%), ethanol (EtOH; 99.5%), dimethyl sulfoxide (DMSO; 99.0%), N,N-dimethylformamide (DMF; 99.5%), N-methyl-2-pyrrolidone (MP; 99.0%), and silica gel (100–210 μm neutral spherical particles) were purchased from Kanto Chemical. All reagents were used as received without further purification.2.2. Preparation of crude PG-GQDs
PG (1.0 g, 8 mmol) was dissolved in 1,2-pentanediol (20 mL), ultrasonically mixed, and heated at 180 °C for 6 h in an oil bath under ambient conditions. As shown in Table 3, eight synthesis conditions were examined by combining the addition of the base catalyst Na3PO4·12H2O (708 mg, 1.86 mmol), air flow (300 mL min−1), and the attachment of a reflux condenser. After air-cooling to room temperature, the suspension was dialyzed in 1 L of ultrapure water using a dialysis membrane (3500 Da molecular-weight cutoff, 1 nm pore size) for two days while stirring. During the dialysis (see Fig. S2, ESI†), ultrapure water was changed three times, and precursors, unreacted materials, and by-products with diameters less than 1 nm were removed. The obtained residue was transferred to a flask and pre-frozen at −30 °C, and then the flask was placed in a freeze-dryer. The frozen residue was freeze-dried at −80 °C and less than 20 Pa overnight to obtain a crude PG-GQD powder. The product yield (PY) was calculated from the weight ratio of PG-GQDs to PG. It should be noted that the PY values were not accurate because of the binding of 1,2-pentanediol to the edge of PG-GQDs via a dehydration–condensation reaction and the formation of the C![[double bond, length as m-dash]](https://www.rsc.org/images/entities/char_e001.gif) O bond by oxidation in air according to the experimental results described below.
O bond by oxidation in air according to the experimental results described below.
| No. | Condenser | Na3PO4·12H2O | Air flow | PY (%) | Absorption wavelength (nm) | Excitation wavelength (nm) | Emission wavelength (nm) | fwhm (nm) | PLQY (%) |
|---|---|---|---|---|---|---|---|---|---|
| 1 | — | — | — | 2.8 | 461 | 468 | 481 | 31 | 42 |
| 2 | ✓ | — | — | 1.7 | 461 | 462 | 481 | 30 | 44 |
| 3 | — | ✓ | — | 106.0 | 463 | 463 | 484 | 32 | 43 |
| 4 | — | — | ✓ | 1.7 | 461 | 463 | 481 | 30 | 49 |
| 5 | ✓ | ✓ | — | 35.3 | 455 | 462 | 481 | 32 | 8 |
| 6 | — | ✓ | ✓ | 99.4 | 463 | 463 | 484 | 32 | 54 |
| 7 | ✓ | — | ✓ | 4.8 | 462 | 468 | 482 | 31 | 40 |
| 8 | ✓ | ✓ | ✓ | 107.3 | 462 | 463 | 484 | 35 | 18 |
PG-GQDs were also prepared using the base catalyst NaOH instead of Na3PO4·12H2O under the condition of air flow and no condenser. Other PG-GQDs were prepared by changing air flow to Ar gas flow (300 mL min−1) using Na3PO4·12H2O without a condenser.
2.3. Purification of crude PG-GQDs via silica gel column chromatography
The crude PG-GQD powder (30 mg) was dispersed in 2 mL of MeOH under ultrasonication and then purified with silica gel column chromatography using a dichloromethane and MeOH (6![[thin space (1/6-em)]](https://www.rsc.org/images/entities/char_2009.gif) :
:![[thin space (1/6-em)]](https://www.rsc.org/images/entities/char_2009.gif) 1 v/v) eluent (see Fig. S3, ESI†). After the collection of weak-fluorescent fraction 1 and blueish green fluorescent fraction 2, the volume ratio of the eluent was changed to 4
1 v/v) eluent (see Fig. S3, ESI†). After the collection of weak-fluorescent fraction 1 and blueish green fluorescent fraction 2, the volume ratio of the eluent was changed to 4![[thin space (1/6-em)]](https://www.rsc.org/images/entities/char_2009.gif) :
:![[thin space (1/6-em)]](https://www.rsc.org/images/entities/char_2009.gif) 1 v/v. After the collection of light green fluorescent fraction 3, the volume ratio was changed to 2
1 v/v. After the collection of light green fluorescent fraction 3, the volume ratio was changed to 2![[thin space (1/6-em)]](https://www.rsc.org/images/entities/char_2009.gif) :
:![[thin space (1/6-em)]](https://www.rsc.org/images/entities/char_2009.gif) 1 v/v to collect green fluorescent fraction 4. The solvent in fraction 4 was removed using a rotary evaporator and air-dried overnight to yield purified PG-GQD powder. The powder was re-dispersed in EtOH. The net absorbance of the PG-GQD dispersion was adjusted to be 0.05 at the optimum wavelength of PL excitation (PLE).
1 v/v to collect green fluorescent fraction 4. The solvent in fraction 4 was removed using a rotary evaporator and air-dried overnight to yield purified PG-GQD powder. The powder was re-dispersed in EtOH. The net absorbance of the PG-GQD dispersion was adjusted to be 0.05 at the optimum wavelength of PL excitation (PLE).
2.4. Preparation of purified RS-GQDs
RS-GQDs were synthesized in the same way as that for PG-GQDs. RS (873 mg, 8 mmol) and Na3PO4·12H2O (708 mg, 1.86 mmol) were dissolved in 1,2-pentanediol (20 mL) and heated at 180 °C for 6 h under the condition of air flow (300 mL min−1) and no reflux condenser. Other operations, such as dialysis, freeze-drying, silica gel column chromatography, and evaporation, were carried out in the same way as that for PG-GQDs.2.5. Characterization
X-ray diffraction (XRD) profiles were acquired with an X-ray diffractometer (Rigaku, MiniFlex600) with a Cu Kα radiation source. Particle sizes and morphologies were imaged with a field-emission transmission electron microscope (FE-TEM; FEI, Tecnai 12 and Tecnai G2) at 120 kV and 200 kV, respectively. The samples for FE-TEM observation were prepared by overnight drying of a drop of each EtOH dispersion on a copper grid covered with an ultrathin carbon-deposited film (Oken Shoji, HRC-C10). Fourier-transform infrared (FT-IR) spectra of pressed KBr discs containing the powder samples were acquired with an FT-IR spectrometer (JASCO, FT/IR-4200). The chemical bonding states in the powders were examined via X-ray photoelectron spectroscopy (XPS; JEOL, JPS-9010TR), using an Al Kα radiation source. The sample for XPS was partly coated with Au by sputtering, and the peak of Au (4f7/2) at 84.0 eV was used for charge-up correction. 1H nuclear magnetic resonance (NMR) spectra were recorded at 500 MHz (JEOL, JNM-ECA500), and chemical shifts were referenced internally to a residual dimethyl sulfoxide (DMSO)-d6 signal at 2.49 ppm. 1H-NMR shifts were simulated with ChemDraw 21.0.0. Ultraviolet-visible (UV-vis) absorption spectra of dispersions were acquired with an optical absorption spectrometer (JASCO, V-750). The net absorbances of the PG-GQDs and RS-GQDs were obtained by subtracting the solvent absorbance. PL and PLE spectra of dispersions were acquired with a fluorescence spectrometer (JASCO, FP-6500). The relative PLQYs were calculated as follows: | (1) |
Rhodamine 6G in EtOH, which has a 95% PLQY in the excitation range of 248–528 nm, was used as a standard solution.34Φp is the PLQY, K is the absorbance at the excitation wavelength, I is the excitation light intensity, n is the refractive index of the solvent, and A is the total area of the PL spectrum. The m and s subscripts refer to measurement and standard samples, respectively.
2.6. Fluorescence solvatochromism, pH dependence and water sensing
For demonstration of fluorescence solvatochromism, purified PG-GQDs were also dispersed in MeOH, DMSO, DMF, and MP. For each dispersion, the net absorbance of PG-GQDs at the optimal excitation wavelength was adjusted to 0.05. The PL/PLE spectra of the dispersions were recorded and the respective PLQYs were calculated using eqn (1).We also obtained the PL/PLE spectra and PLQYs of purified PG-GQDs in water in the pH range of 7 to 13. In addition, purified PG-GQDs were dispersed in mixed solvents of MP and water (pH 13) with different water contents at a GQD concentration of 25 mg L−1, and then the PL spectra of these dispersions were recorded.
3. Results and discussion
3.1. Optimal conditions for massive synthesis of crude PG-GQDs
Table 3 shows the PY for each synthesis condition of PG-GQDs. The PYs for entries 3 and 6, where Na3PO4·12H2O was added without a condenser, and entry 8, where Na3PO4·12H2O was added with a condenser and air flow simultaneously, were nearly 100%, a significant improvement over the 2.8% PY for entry 1, which was the same condition as in the previous work,26 and a significant increase in apparent volume (see Fig. S4, ESI†). The value exceeding 100% in PY in Table 3 may be attributed to the binding of 1,2-pentanediol to the edge of PG-GQDs via a dehydration–condensation reaction and the formation of the C![[double bond, length as m-dash]](https://www.rsc.org/images/entities/char_e001.gif) O bond by oxidation in air according to the experimental results described below.
O bond by oxidation in air according to the experimental results described below.
The UV-vis and PL/PLE spectra of the crude PG-GQDs in EtOH are shown in Fig. S5 and S6 (ESI†), respectively, and their optical properties are summarized in Table 3. An absorption peak attributed to the transition of π-conjugated electrons between the highest occupied molecular orbital (HOMO) and the lowest unoccupied molecular orbital (LUMO) was observed at around 460 nm for each synthesis condition. An excitation peak at 463 nm and an emission peak at 484 nm were observed, also attributed to the HOMO–LUMO transition of the π-conjugated electrons. For all conditions, the fwhm of the emission peak was ∼32 nm, indicating a narrow fluorescence bandwidth. Among the three conditions entries 3, 6, and 8 with the high PY, the PLQY of entry 6 was the highest at 54%. From these results, we conclude that entry 6 with Na3PO4·12H2O, air flow, and no condenser is the best condition for massive synthesis of crude PG-GQDs in this work.
When only Na3PO4·12H2O was added to 1,2-pentanediol without PG and heated under the conditions mentioned in entry 6, the mixture remained clear and colorless and no GQDs were obtained. This confirmed that Na3PO4·12H2O does not act on 1,2-pentanediol to cause dehydration condensation.
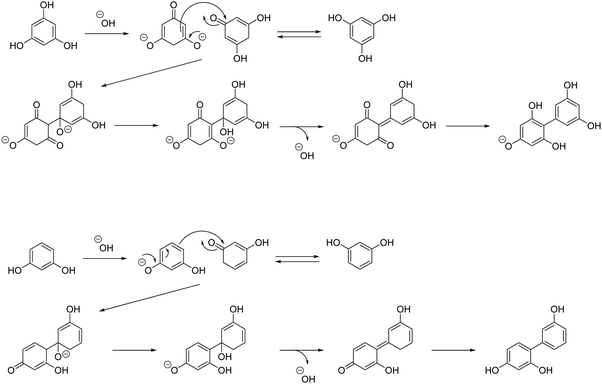
The dissolution of Na3PO4·12H2O in 1,2-pentanediol generates OH−. Based on the tautomerism of PG,35 it is inferred that the proton of the OH group of PG is desorbed and dehydration condensation between two PG molecules occurs through the reaction mechanism, as shown in Scheme 2.
When the amount of Na3PO4·12H2O was varied from 0 to 3.72 mmol, the maximum PY of PG-GQDs synthesized under the conditions mentioned in entry 6, ∼100%, was obtained at 1.86 mmol Na3PO4·12H2O, and a slight decrease in PY was observed when Na3PO4·12H2O was added in excess (Fig. S7 and Table S1, ESI†). Accordingly, the amount of Na3PO4·12H2O was determined to be 1.86 mmol. Addition of an excess of Na3PO4·12H2O resulted in an excess of proton desorption from the OH group of PG, which inhibited the dehydration–condensation reaction and decreased the PY.
3.2. Effects of catalysts and flow gases on PYs and PLQYs
As shown in Table 4, the effects of Na3PO4·12H2O and NaOH catalysts on PYs and PLQYs of PG-GQDs before and after purification by silica gel column chromatography were investigated. Comparing PG-GQDs (Na3PO4·12H2O, air) and PG-GQDs (NaOH, air), the PYs before purification did not change when the catalyst was changed from Na3PO4·12H2O to NaOH. This suggests that both Na3PO4·12H2O and NaOH acted as base catalysts to promote the dehydration–condensation reaction between PG molecules, as already shown in Scheme 2. Next, the gas flows of air and Ar were compared to investigate the influence of oxidative reactions by oxygen in air on PY and the PL properties, because oxidative phenol coupling of PG and RS has been reported.5 When the flow gas was changed from air to Ar, the PYs of PG-GQDs (Na3PO4·12H2O, air) and PG-GQDs (Na3PO4·12H2O, Ar) before purification were 99.4% and 63.1%, respectively, indicating that the difference in flow gas affected the PY. According to the luminescence and PL spectra obtained after purification (Fig. 1), the PL intensity was the highest for PG-GQDs (Na3PO4·12H2O, air), and the PLQY after purification was also the highest for PG-GQDs (Na3PO4·12H2O, air) at 75% (Table 4), which was the average of PLQY values for three different synthesized samples (Table S2, ESI†).| Catalyst | Flow gas | Purification | PY (%) | Absorption wavelength (nm) | Excitation wavelength (nm) | Emission wavelength (nm) | fwhm (nm) | PLQY (%) |
|---|---|---|---|---|---|---|---|---|
| Na3PO4·12H2O | Air | Before | 99.4 | 463 | 463 | 484 | 32 | 54 |
| After | 24.4 | 463 | 463 | 483 | 32 | 75 | ||
| NaOH | Air | Before | 100.9 | 463 | 463 | 484 | 33 | 23 |
| After | 20.8 | 464 | 463 | 484 | 32 | 58 | ||
| Na3PO4·12H2O | Ar | Before | 63.1 | 459 | 463 | 483 | 33 | 10 |
| After | 34.4 | 461 | 463 | 482 | 31 | 24 |
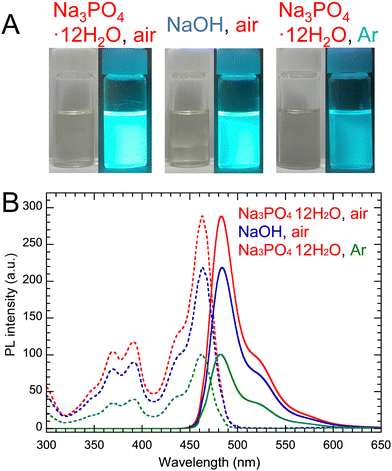 | ||
| Fig. 1 (A) Photographs of purified PG-GQDs in EtOH under white light and 365 nm UV light. (B) Their PL/PLE spectra. | ||
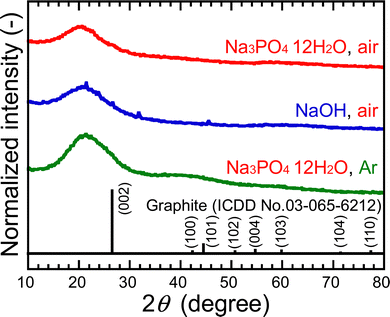
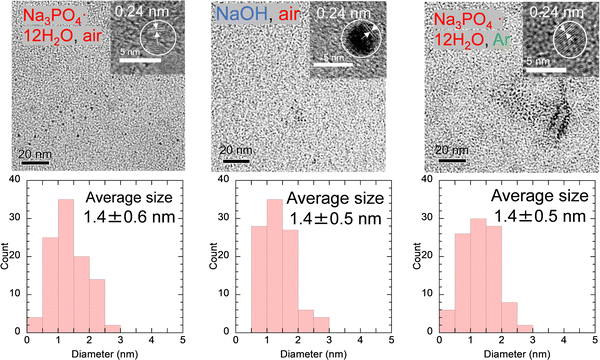
To understand the cause of these results, the samples were analyzed after purification. The XRD peak assigned to the (002) plane of graphene was observed at ∼20°, as shown in Fig. 2. This lattice spacing is calculated to be ∼0.44 nm, which is a wider layer spacing, 0.34 nm, for graphite reported by the International Centre for Diffraction Data (ICDD). This can be attributed to the presence of C![[double bond, length as m-dash]](https://www.rsc.org/images/entities/char_e001.gif) O with a bond distance of ∼0.12 nm in graphene layers and the presence of 1,2-pentanediol bound to the edges of GQDs, which will be described below. The FE-TEM images showed particles with an average size of 1.4 nm in all samples, as shown in Fig. 3. The 0.24 nm lattice fringe spacings correspond to the (100) plane of graphene.
O with a bond distance of ∼0.12 nm in graphene layers and the presence of 1,2-pentanediol bound to the edges of GQDs, which will be described below. The FE-TEM images showed particles with an average size of 1.4 nm in all samples, as shown in Fig. 3. The 0.24 nm lattice fringe spacings correspond to the (100) plane of graphene.
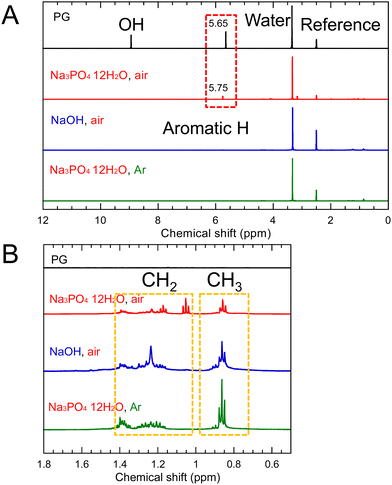
In the 1H-NMR spectrum (Fig. 4), the signals attributed to CH2 at 1.1–1.4 ppm and CH3 at 0.7–1.0 ppm were observed. This suggests that dehydration condensation occurred not only between PG molecules but also between 1,2-pentanediol and the OH group at the edges of the GQDs. Therefore, we simulated 1H-NMR spectra of the three types of molecules, one in which three PGs were dehydration-condensed and the other in which 1,2-pentanediol was dehydration-condensed and bound to the edges of the dehydration-condensed molecule of three PGs, as shown in Fig. S8 and S9 (ESI†). The simulated spectra of the latter show CH2 and CH3 signals similar to the experimental results.
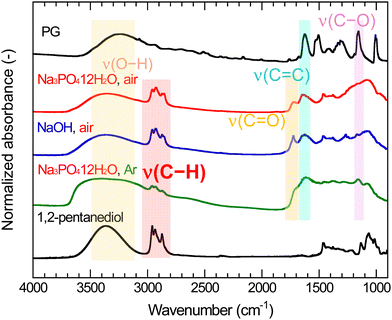
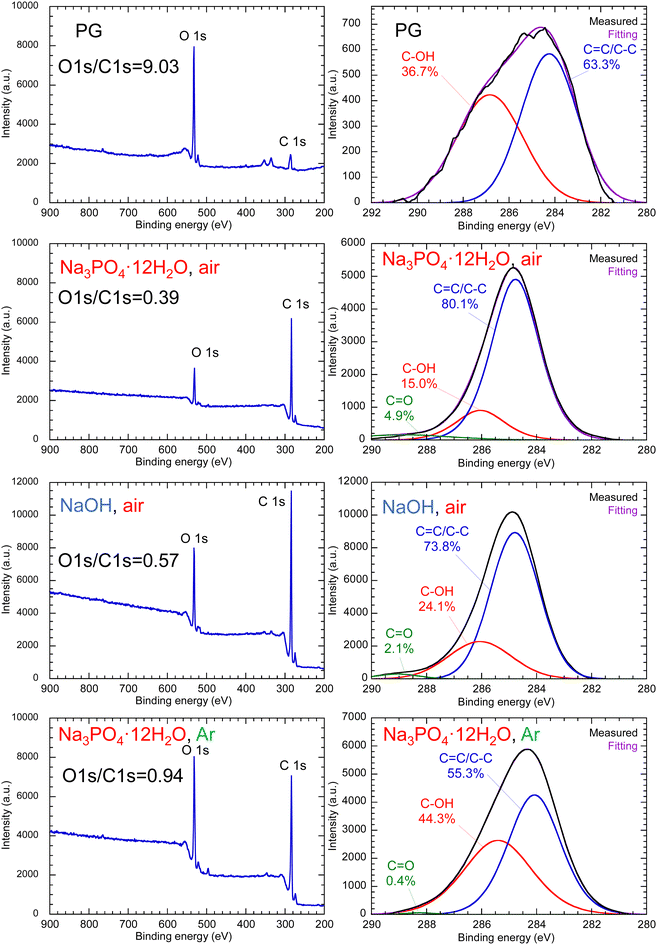
Fig. 5 shows the FT-IR spectra of PG-GQDs, PG, and 1,2-pentanediol. The assignments of the FT-IR peaks are given in Fig. S10 and Table S3 (ESI†). The absorption peaks corresponding to the C–H stretching vibrations were observed for all of the PG-GQDs and 1,2-pentanediol, and the absorbance of PG-GQDs (Na3PO4·12H2O, air) and PG-GQDs (NaOH, air) was larger than that of PG-GQDs (Na3PO4·12H2O, Ar). Furthermore, the wide scan XPS spectra (Fig. 6) showed that the O 1s/C 1s intensity ratio was in the order PG-GQDs (Na3PO4·12H2O, air) < PG-GQDs (NaOH, air) < PG-GQDs (Na3PO4·12H2O, Ar). From the deconvoluted narrow scan C 1s spectra, the C–OH percentage determined from the peak areas was the lowest for PG-GQDs (Na3PO4·12H2O, air). Accordingly, PG-GQDs (Na3PO4·12H2O, air) had the highest amount of 1,2-pentanediol bound to GQDs by dehydration condensation. Steric repulsion by 1,2-pentanediol bound to the edges of GQDs suppresses the stacking of GQDs by π–π interaction and prevents concentration quenching, resulting in a higher PLQY for PG-GQDs (Na3PO4·12H2O, air).
3.3. Comparison of PG-GQDs and RS-GQDs
RS-GQDs were synthesized from RS with two OH groups under the conditions of no condenser, addition of Na3PO4·12H2O, and air flow, which were the same conditions used for the successful massive synthesis of PG-GQDs. As a result, the PY of RS-GQDs before purification was increased from 5.1% to 82.7% by the use of Na3PO4·12H2O and air flow. This confirms that RS-GQDs can also be synthesized in large quantities under the conditions of massive synthesis of PG-GQDs. For RS, Na3PO4·12H2O acts as a base catalyst, and the reaction mechanism may be similar to that of PG, as shown in Scheme 2.The mass-synthesized PG-GQDs and RS-GQDs were purified by silica gel column chromatography and dispersed in EtOH. PG-GQDs in EtOH showed strong blue–green emission under 365 nm UV irradiation, while RS-GQDs in EtOH showed weak green fluorescence (Fig. S11, ESI†). As shown in Fig. S12 and Table S4 (ESI†), the absorption peak was red-shifted for RS-GQDs compared to that for PG-GQDs. The PL/PLE spectra (Fig. S13, ESI†) confirmed that the excitation and emission peaks were red-shifted by changing the carbon source from PG to RS. These redshifts can be attributed to the enhancement of the dehydration–condensation reaction for RS-GQDs to form larger sizes. In fact, the average size of RS-GQDs, 2.2 ± 0.5 nm, was larger than that of PG-GQDs, 1.4 ± 0.6 nm, as confirmed by FE-TEM observations (Fig. 3 and Fig. S14, ESI†). This increased size of the GQDs weakened the quantum size effect for RS-GQDs compared to that for PG-GQDs. The fwhm of the emission peak for RS-GQDs was 40 nm, which confirms that narrow-band fluorescent GQDs can be obtained even when the carbon source is changed to RS. The PLQY of PG-GQDs was 75%, while that of RS-GQDs was significantly lower at 13%.
Comparison of the FT-IR spectra (Fig. S15, ESI†) of PG-GQDs and RS-GQDs reveals that RS-GQDs exhibited relatively stronger absorbance than that of PG-GQDs due to the C![[double bond, length as m-dash]](https://www.rsc.org/images/entities/char_e001.gif) O stretching vibration, although both GQDs had similar functional groups. Fig. S16 (ESI†) shows the wide scan XPS spectra of PG, RS, purified PG-GQDs, and purified RS-GQDs. The O 1s/C 1s intensity ratios of PG and PG-GQDs are 9.03 and 0.39, respectively, while those of RS and RS-GQDs are 2.26 and 0.99, respectively. The decrease in the O 1s/C 1s intensity ratio due to the formation of GQDs from carbon sources is attributed to the decrease in oxygen content due to the dehydration–condensation reactions. This is supported by the decrease in the C–OH percentage determined from the deconvoluted narrow scan C 1s spectra (Fig. S17, ESI†) due to the formation of GQDs from carbon sources. The O 1s/C 1s intensity ratio of 0.99 for RS-GQDs was higher than that of 0.39 for PG-GQDs. This means that the oxygen content of RS-GQDs synthesized from RS is higher than that of PG-GQDs, even though RS has fewer hydroxy groups per molecule than PG and a lower oxygen content. This is attributed to the higher amount of C
O stretching vibration, although both GQDs had similar functional groups. Fig. S16 (ESI†) shows the wide scan XPS spectra of PG, RS, purified PG-GQDs, and purified RS-GQDs. The O 1s/C 1s intensity ratios of PG and PG-GQDs are 9.03 and 0.39, respectively, while those of RS and RS-GQDs are 2.26 and 0.99, respectively. The decrease in the O 1s/C 1s intensity ratio due to the formation of GQDs from carbon sources is attributed to the decrease in oxygen content due to the dehydration–condensation reactions. This is supported by the decrease in the C–OH percentage determined from the deconvoluted narrow scan C 1s spectra (Fig. S17, ESI†) due to the formation of GQDs from carbon sources. The O 1s/C 1s intensity ratio of 0.99 for RS-GQDs was higher than that of 0.39 for PG-GQDs. This means that the oxygen content of RS-GQDs synthesized from RS is higher than that of PG-GQDs, even though RS has fewer hydroxy groups per molecule than PG and a lower oxygen content. This is attributed to the higher amount of C![[double bond, length as m-dash]](https://www.rsc.org/images/entities/char_e001.gif) O formed by oxidation for RS-GQDs, as explained by the FT-IR results. In addition, the C
O formed by oxidation for RS-GQDs, as explained by the FT-IR results. In addition, the C![[double bond, length as m-dash]](https://www.rsc.org/images/entities/char_e001.gif) O percentage determined from the deconvoluted C 1s spectra (Fig. S17, ESI†) was higher for RS-GQDs than for PG-GQDs. This was consistent with the FT-IR results. These results suggest that RS-GQDs had more C
O percentage determined from the deconvoluted C 1s spectra (Fig. S17, ESI†) was higher for RS-GQDs than for PG-GQDs. This was consistent with the FT-IR results. These results suggest that RS-GQDs had more C![[double bond, length as m-dash]](https://www.rsc.org/images/entities/char_e001.gif) O groups, which coupled the π-conjugated electron system and increased the ratio of non-radiative to radiative recombination,36 resulting in the lower PLQY of RS-GQDs than that of PG-GQDs.
O groups, which coupled the π-conjugated electron system and increased the ratio of non-radiative to radiative recombination,36 resulting in the lower PLQY of RS-GQDs than that of PG-GQDs.
3.4. Fluorescence solvatochromism, pH dependence, and water sensing for PG-GQDs
Green fluorescence was observed for the purified PG-GQDs in the lower polar solvents, DMSO, DMF, and MP, while blue fluorescence was observed for the purified PG-GQDs in the higher polar solvents, MeOH and EtOH (Fig. S18A, ESI†). As shown in Fig. S18B and Table S5 (ESI†), the PL peak was observed at a shorter wavelength for PG-GQDs in the solvent with a higher polarity parameter ET (30),37 indicating negative fluorescence solvatochromism which is in contrast to the positive fluorescence solvatochromism of phenylenediamine-derived carbon dots.38–40 The PLQYs of PG-GQDs in different solvents ranged from 79% to 97%, as also shown in Table S5 (ESI†).PG-GQDs in water at pH 7–13 emitted blue fluorescence under 365 nm UV light (Fig. S19A, ESI†). As shown in Fig. S19B (ESI†), the PL intensity was higher for PG-GQDs in basic water. The highest PLQY was 60% at pH 11, as shown in Table S5 (ESI†). Since the first acid dissociation constant, pKa1, of PG is reported to be 8.0 or 9.0,35,41 the protons of OH groups at the edges of GQDs dissociate and become negatively charged at pH > pKa1; therefore, under basic conditions, electrostatic repulsion between GQDs improved the dispersion of PG-GQDs in water, resulting in the suppression of concentration quenching and an increase in PLQY.
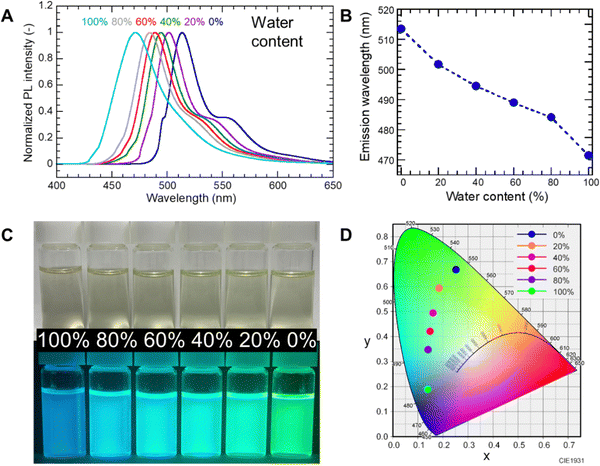
The negative fluorescence solvatochromism of PG-GQDs and their property of increasing PL intensity under basic conditions were exploited for water sensing at pH 13 in MP. As shown in Fig. 7A and B, the wavelength of the PL peak was blue-shifted from 514 nm to 471 nm with increasing water content from 0% to 100% by volume. The appearance of the sample under 365 nm UV light (Fig. 7C) and the chromaticity calculated from the PL peak (Fig. 7D) also showed a change in fluorescence color from green to blue. This demonstrated that PG-GQDs can be used for water sensing in low-polarity organic solvents over the entire water content range of 0–100%.
4. Conclusions
In the synthesis of narrow-band fluorescent PG-GQDs by heating PG in 1,2-pentanediol at 180 °C for 6 h, followed by dialysis purification, the addition of Na3PO4·12H2O and air flow successfully increased the PY of PG-GQDs from 2.8% to 99.4%. This huge increase in PY is attributed to the addition of Na3PO4·12H2O, which acted as a base catalyst and accelerated the dehydration–condensation reaction between PG molecules in a similar way to that of the NaOH base catalyst. Further purification by silica gel column chromatography increased the PLQY of the narrow-band fluorescent PG-GQDs dispersed in ethanol from 54% to 75%. FT-IR, 1H-NMR, and XPS analyses confirmed the presence of 1,2-pentanediol attached to the edges of GQDs; therefore, the steric repulsion by this alkyl chain suppressed the stacking of GQDs and prevented concentration quenching, resulting in a high PLQY. The high PLQY of PG-GQDs in water at a high pH is attributed to the dissociation of OH groups at the edges of PG-GQDs in basic water, which suppressed concentration quenching due to electrostatic repulsion. Furthermore, for PG-GQDs in a mixture of MP and water (pH 13) with the water content ranging from 0% to 100%, the fluorescence wavelength shifted continuously from 514 nm to 466 nm together with a gradual color change from green to blue. This demonstration confirms the potential of PG-GQDs for water sensing in organic solvents.Author contributions
Y. O.: formal analysis, investigation, methodology, and writing – original draft; A. O.: formal analysis, investigation, and methodology; R. K.: investigation and methodology; A. O.: investigation; K. T.: investigation; Y. I.: supervision and writing – review and editing; and T. I.: conceptualization, project administration, supervision, and writing – review and editing. All authors gave final approval for publication and agreed to be held accountable for the work performed therein.Conflicts of interest
There are no conflicts to declare.Acknowledgements
This work was financially supported by the Academic Development Fund (Keio University Academic Development Funds).References
- S. Zhu, Y. Song, X. Zhao, J. Shao, J. Zhang and B. Yang, Nano Res., 2015, 8, 355–381 CrossRef CAS.
- Y. Liu, H. Gou, X. Huang, G. Zhang, K. Xi and X. Jia, Nanoscale, 2020, 3, 1589–16011 RSC.
- C. Dias, N. Vasimalai, M. P. Sarria, I. Pinheiro, V. Vilas-Boas, J. Peixoto and B. Espina, Nanomaterials, 2019, 9, 199 CrossRef CAS PubMed.
- F. Yuan, Y. Wang, G. Sharma, Y. Dong, X. Zheng, P. Li, A. Johnston, G. Bappi, J. Fan, H. Kung, B. Chen, M. Saidaminov, K. Singh, O. Voznyy, O. Bakr, Z. Lu and E. Sargent, Nat. Photonics, 2020, 14, 171–176 CrossRef CAS.
- S. Ghosh, H. Ali and N. R. Jana, ACS Sustainable Chem. Eng., 2019, 7, 12629–12637 CAS.
- L. Cunci, V. González-Colón, B. L. Vargas-Pérez, J. Ortiz-Santiago, M. Pagán, P. Carrion, J. Cruz, A. Molina-Ontoria, N. Martinez, W. Silva, L. Echegoyen and C. R. Cabrerae, ACS Appl. Nano Mater., 2021, 4, 211–219 CrossRef CAS PubMed.
- R. Atchudan, T. H. J. I. Edison, M. Shanmugam, S. Perumal, T. Somanathan and Y. R. Lee, Phys. E, 2021, 126, 114417 CrossRef CAS.
- F. L. Yuan, S. H. Li, Z. T. Fan, X. Y. Meng, L. Z. Fan and S. H. Yang, Nano Today, 2016, 11, 565–586 CrossRef CAS.
- M. Hahn, J. M. Kim, H. Hong, C. Lee, D. Kim, M. Y. Han, H. S. Kim and Y. Z. Piao, ACS Appl. Nano Mater., 2022, 5, 11896–11905 CrossRef CAS.
- X. H. Liu, J. X. Zheng, Y. Z. Yang, Y. K. Chen and X. G. Liu, Opt. Mater., 2018, 86, 530–536 CrossRef CAS.
- N. Urusihara, T. Hirai, A. Dager, Y. Nakamura, Y. Nishi, K. Inoue, R. Suzuki, M. Tanimura, K. Shinozaki and M. Tachibana, ACS Appl. Nano Mater., 2022, 4, 12472–12480 CrossRef.
- C. C. Hu, Z. J. Lin, Y. C. Huang, Y. Y. Chen, K. H. Wang and K. Y. A. Lin, Environ. Res., 2021, 197, 111008 CrossRef CAS PubMed.
- M. Ö. Alaş and R. Genç, ACS Appl. Nano Mater., 2021, 4, 7974–7987 CrossRef.
- Y. Y. Pang, R. J. Zhao, Y. Lu, J. Y. Liu, X. P. Dong and F. N. Xi, New J. Chem., 2018, 42, 17091–17095 RSC.
- Z. Tian, X. T. Zhang, D. Li, D. Zhou, P. T. Jing, D. Z. Shen, S. N. Qu, R. Zboril and A. L. Rogach, Adv. Opt. Mater., 2017, 5, 1700416 CrossRef.
- S. J. Zhou, Y. Sui and H. G. Li, Chem. – Asian J., 2021, 16, 348–354 CrossRef CAS PubMed.
- Y. F. Ding, J. X. Zheng, J. L. Wang, Y. Z. Yang and X. G. Liu, J. Mater. Chem. C, 2019, 7, 1502–1509 RSC.
- Z. C. Li, L. Kong, S. Q. Huang and L. Li, Angew. Chem., Int. Ed., 2017, 56, 8134–8138 CrossRef CAS PubMed.
- C. B. Yang, B. Zhang, J. D. Lin, S. X. Wang, M. L. Liu, N. Z. Jiang and D. Q. Chen, Chem. Eng. J., 2020, 398, 125616 CrossRef CAS.
- F. L. Yuan, T. Yuan, L. Z. Sui, Z. B. Wang, Z. F. Xi, Y. C. Li, X. H. Li, L. Z. Fan, Z. A. Tan and A. M. Chen, Nat. Commun., 2018, 9, 2249 CrossRef PubMed.
- F. L. Yuan, P. He, Z. F. Xi, X. H. Li, Y. C. Li, H. Z. Zhong, L. Z. Fan and S. H. Yang, Nano Res., 2019, 12, 1669–1674 CrossRef CAS.
- Z. Wang, X. Dong, S. Zhou, Z. Xie and Z. Zalevsky, NPG Asia Mater., 2021, 13, 5 CrossRef CAS.
- Z. Han, Y. Ni, J. Ren, W. Zhang, Y. Wang, Z. Xie, S. Zhou and S. F. Yu, Nanoscale, 2019, 11, 11577–11583 RSC.
- X. Q. Niu, T. B. Song and H. M. Xiong, Chin. Chem. Lett., 2021, 32, 1953–1956 CrossRef CAS.
- S. Gohda, H. Ono and Y. Yamada, Carbon Lett., 2022, 33, 467–475 CrossRef.
- T. Yoshinaga, M. Shioda, Y. Iso, T. Isobe, A. Ogura and K. Takao, ACS Omega, 2021, 6, 1741–1750 CrossRef CAS PubMed.
- R. Katakami, K. Sato, A. Ogura, K. Takao, Y. Iso and T. Isobe, J. Mater. Chem. C, 2023, 11, 4143–4152 RSC.
- M. H. Sun, C. Liang, Z. Yian, E. V. Ushakova, D. Li, G. C. Xing, S. N. Qu and A. L. Rogach, J. Phys. Chem. Lett., 2019, 10, 3094–3100 CrossRef CAS PubMed.
- M. Moniruzzaman, B. A. Lakshmi, S. Kim and J. Kim, Nanoscale, 2020, 12, 11947–11959 RSC.
- X. Q. Niu, T. B. Song and H. M. Xiong, Chin. Chem. Lett., 2021, 32, 1953–1956 CrossRef CAS.
- P. A. Chen, J. D. Peng, Z. L. Zhang, X. Wang, X. L. Zhu, K. Fan and P. Luo, Anal. Chim. Acta, 2022, 1228, 340341 CrossRef CAS PubMed.
- Y. F. Liu, S. Tang, X. Y. Wu, N. Boulanger, E. Gracia-Espino, T. Wagberg., L. Edman and J. Wang, Nano Res., 2022, 15, 5610–5618 CrossRef CAS.
- G. Minervini, A. Panniello, A. Madonia, C. M. Carbonaro, F. Mocci, T. Sibillano, C. Giannini, R. Comparelli, C. Ingrosso, N. Depalo, E. Fanizza, M. L. Curri and M. Striccoli, Carbon, 2022, 198, 230–243 CrossRef CAS.
- R. F. Kubin and A. N. Fletcher, J. Lumin., 1982, 27, 455–462 CrossRef.
- D. Wang, K. Hildenbrand, J. Leitich, H. P. Schuchmann and C. V. Sonntag, Z. Naturforsch., B: J. Chem. Sci., 1993, 48, 478–482 CrossRef CAS.
- C. Liu, L. Bao, M. Yang, S. Zhang, M. Zhou, B. Tang, B. Wang, Y. Liu, Z.-L. Zhang, B. Zhang and D.-W. Pang, J. Phys. Chem. Lett., 2019, 10, 3621–3629 CrossRef CAS PubMed.
- C. Reichardt, Chem. Rev., 1994, 94, 2319–2358 CrossRef CAS.
- N. Li, X. Dong, X. Lv, Y. Li, Q. Ma, R. Guan and Z. Xie, Chem. Commun., 2023, 59, 4475–4478 RSC.
- K. Sato, R. Sato, Y. Iso and T. Isobe, Chem. Commun., 2020, 56, 2174–2177 RSC.
- R. Sato, Y. Iso and T. Isobe, Langmuir, 2019, 35, 15257–15266 CrossRef CAS PubMed.
- D. Zhang, C. T. Wang, L. Q. Shen, H. C. Shin, K. B. Lee and B. P. Ji, RSC Adv., 2018, 8, 1963–1972 RSC.
Footnote |
| † Electronic supplementary information (ESI) available. See DOI: https://doi.org/10.1039/d4tc00983e |
| This journal is © The Royal Society of Chemistry 2024 |

