Excellent red upconversion luminescence in GdLaO3:Er3+/Yb3+/Sc3+ under 980 nm laser excitation†
Meiling
Li
a,
Yongze
Cao
 *a,
Lihong
Cheng
a,
Tianshuo
Liu
b,
Yuhan
Fan
a,
Jinsu
Zhang
a and
Baojiu
Chen
*a
aDepartment of Physics, Dalian Maritime University, Dalian, 116026, China. E-mail: cyz@dlmu.edu.cn; bjchen@dlmu.edu.cn
bDepartment of Physics and Astronomy, University College London, Gower St., London, WC1E 6BT, UK
First published on 12th April 2024
Abstract
A series of (Gd0.8−xEr0.1Yb0.1Scx)LaO3 and (Gd0.8Er0.1Yb0.1)(La1−xScx)O3 upconversion luminescence (UCL) phosphors were prepared by solid state sintering technology. The structure, diffuse reflection, and UCL spectra were investigated. (Gd0.8Er0.1Yb0.1)(La0.9Sc0.1)O3 represents excellent red UCL, which is comparable to commercial red β-NaYF4:Er3+/Yb3+. Er3+/Yb3+ are distributed in a continuous double layer structure, blocked by a single layer of Sc3+/La3+. This structure allows cross relaxation (CR) to occur only in the double-layer structure and improves the efficiency of energy transfer with CR in the double-layer, resulting in the emission of outstanding red UCL. Using the luminescence branching intensity ratio (LIR) technique, the maximum value of relative temperature sensitivity is calculated as 0.01295 K−1 at 303 K. GdLaO3:Er3+/Yb3+/Sc3+ has excellent pure red UCL and can be applied in luminescence display and temperature sensing.
1. Introduction
The upconversion luminescence (UCL) process is the process of absorbing multiple low-energy photons to emit a high-energy photon.1 Due to this unique property, it can be widely used in solar cells,2,3 sterilization,4 anti-counterfeiting,5,6 medical treatment,7,8 temperature sensing,9–11 and so on. The UCL phosphor is obtained by doping the luminescence center (Er3+, Tm3+, Ho3+) and sensitization center (Yb3+) into a suitable host. In general, this host structure determines the UCL intensity. Now, β-NaYF4 is currently recognized as the optimal host.12,13 However, the chemical stability of fluoride is poor, and there is certain toxicity, so there are certain limitations on the above applications. Therefore, the use of a non-toxic, chemically stable oxide as a host to replace fluoride is a reasonable choice. However, a large number of experimental studies have shown that the UCL intensity of oxide phosphors is usually much lower than that of fluoride. Therefore, obtaining oxide phosphors with UCL intensity comparable to β-NaYF4 is a challenge.There are four main factors affecting UCL intensity. (1) Low phonon energy can reduce the non-radiative transition and help to obtain high UCL intensity.14,15 (2) The low symmetry of the luminous center helps to break the imprisonment of the 4f–4f transition and improve the UCL intensity.16–18 (3) The appropriate distance of rare earth ions is helpful to transfer energy from the sensitized center to the luminescent center and enhance UCL intensity.19 (4) Distribution of rare earth ions in the host:20 a suitable distribution of rare earth ions in the host helps to reduce and enhance the cross relaxation (CR) between rare earth ions and can regulate the visible green and red emission ratio for Yb3+/Er3+ co-doped samples.21,22 In our previous study,23–25 it was found that the BiTa7O19 host has low phonon energy and low luminescence center symmetry, while Er3+/Yb3+ are distributed in a single layer, obtaining excellent pure green UCL. Based on the inspiration of the previous experiments, the search for a low phonon and low luminescent center symmetry oxide host with Er3+/Yb3+ distributed in a continuous double layer structure and blocked by other atomic layers is expected to obtain excellent pure red-light emission. Based on the above analysis, a low phonon energy (∼419 cm−1) GdLaO3 host with space group C2/m (No. 12) is expected to be a good choice.26,27 Gd3+/La3+ and Gd3+ sites form a continuous double layer structure, which is blocked by a single layer of La3+. Therefore, we regulate doping different elements so that Er3+/Yb3+ replaces Gd3+/La3+ and Gd3+ sites, making Er3+/Yb3+ distribute in a double layer structure, blocked by a La3+ single layer, and it is expected to obtain outstanding red UCL intensity. Stronger absorption of biological tissues for green UCL than red UCL is observed. Therefore, red UCL can have a deeper tissue detection depth, which is more suitable to be utilized in biomedical treatment.28,29
On the basis of Er3+/Yb3+ co-doping, foreign ion doping to break the symmetry of the crystal field in the luminous center will significantly improve the UCL intensity. Some studies have shown that the smallest trivalent rare earth ion (Sc3+) doping will decrease the crystal field symmetry and cause greater local structural distortion, leading to UCL enhancement.30–32 Additionally, due to the small ionic radius and the same valence, Sc3+ ions can easily enter into other rare-earth-based host lattices as dopants for modulation of the crystallographic parameters toward UCL tuning.33 Therefore, the sites occupied by Er3+/Yb3+/Sc3+ can be controlled by changing the molar ratio of the raw materials to obtain excellent red UCL intensity in Er3+/Yb3+/Sc3+ co-doped GdLaO3 phosphors.
In this work, (Gd0.8−xEr0.1Yb0.1Scx)LaO3 (x = 0, 0.05, 0.1, 0.15, 0.2) and (Gd0.8Er0.1Yb0.1)(La1−xScx)O3 (x = 0, 0.05, 0.1, 0.15, 0.2) phosphors were successfully prepared by high temperature solid phase sintering. (Gd0.8Er0.1Yb0.1)(La0.9Sc0.1)O3 has excellent red UCL intensity comparable to β-NaYF4:Er3+/Yb3+ under 980 nm laser excitation. Employing the luminescence branching intensity ratio (LIR) technique, the maximum value of relative temperate sensitivity of 0.01295 K−1 at 303 K was reached. GdLaO3:Er3+/Yb3+/Sc3+ is expected to replace β-NaYF4:Er3+/Yb3+ in the applied field of luminescence display and temperature sensing.
2. Experimental
2.1. Sample synthesis
All samples were prepared using the traditional high temperature solid state reaction method. The materials used in the production process included Gd2O3 (99.9%), La2O3 (99.9%), Er2O3 (99.9%), Yb2O3 (99.9%), and Sc2O3 (99.9%), weighed following the stoichiometric ratio. The weighed samples were mixed in an agate mortar, ground for 30 minutes, and then sintered in a resistance furnace at 1500 °C for 8 h. After the furnace cooling process was completed, the sintered samples were further ground into powders for the test.2.2. Characterizations
Powder X-ray diffraction (XRD) analysis of the samples was conducted using a Rigaku X-ray diffractometer with Cu Kα radiation (λ = 1.5406 Å) in the 10°–90° range. The Rietveld refinement of the XRD data was performed with the general structural analysis system (GASA) software.34 The diffuse reflectance spectra of the samples were analyzed using a UV3600 spectrophotometer (Shimadzu, Japan). The emission spectra of the samples at variable temperatures (303 to 663 K) were measured using a Hitachi F-4600 fluorescence spectrophotometer. Temperature control was achieved with a home-made device (DMU-TC 450), ensuring an accuracy better than ± 0.5 °C.3. Results and discussion
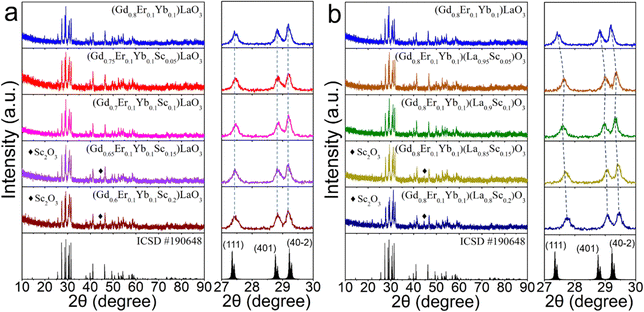
Powder X-ray diffraction (XRD) pattern analysis was conducted to verify the crystal structure and phase purity of the synthesized phosphors. The XRD patterns are illustrated in Fig. 1(a) and (b). The diffraction peaks of the synthesized phosphors closely match the standard card of GdLaO3 (ICSD#190648) with space group C2/m (No. 12), and lattice parameters (a, b, c) = (14.433, 3.689, 8.997 Å) with a B-type monoclinic structure. Notably, when the Sc3+ concentration is below 10 mol%, no peaks related to the raw materials of Gd2O3, La2O3, Sc2O3, or any other impurities were detected, except for the signals originating from the GdLaO3 host. However, when the Sc3+ concentration exceeds 10 mol%, Sc2O3 impurities are observed. The enlarged angular regions from 27° to 30° are shown in the right patterns of Fig. 1(a) and (b), respectively. Evidently, the absence of peak shifting was confirmed when the sample was synthesized using stoichiometric means with Sc3+ ions molar replacing Gd3+ ions molar. However, when the sample was synthesized by stoichiometric means with Sc3+ ions molar replacing La3+ ions molar, the diffraction peaks shifted towards the smaller angle direction. This shows that the sintered sample with Sc3+ ions molar replacing La3+ ions molar has a more obvious structural change as the composition of Sc3+ increases than the sample with Sc3+ ions molar replacing Gd3+ ions molar, and the volume decreases as the doping of Sc3+ with a small radius increases.The diffuse reflection (DR) spectra of (Gd0.8Er0.1Yb0.1)LaO3, (Gd0.8Er0.1Yb0.1Sc0.1)LaO3, and (Gd0.8Er0.1Yb0.1)(La0.9Sc0.1)O3 phosphors are presented in Fig. 2(a). The absorption peaks in the DR spectra, ranging from 200 to 1800 nm, are mainly attributed to the transitions of Er3+ from 4I15/2 to 4G11/2, 4F7/2, 2H11/2, 4F9/2, 4I9/2, 4I11/2, and 4I13/2, respectively. Notably, these peaks at ∼976 nm are from the transitions of Yb3+ from 2F7/2 to 2F5/2 and Er3+ from 4I15/2 to 4I11/2. Fig. 2(b) illustrates the corresponding bandgap values of the three phosphors, which are 4.61, 4.70, and 4.74 eV, respectively. Comparing the bandgap values among the three samples, this investigation reveals that the bandgap of the Er3+/Yb3+ co-doped GdLaO3 phosphor is smaller than that of the Er3+/Yb3+/Sc3+ triple-doped GdLaO3 phosphors. Furthermore, the bandgap value of the phosphor synthesized by stoichiometric means with Sc3+ ions molar replacing Gd3+ ions molar is smaller than that of the phosphor synthesized by stoichiometric means with Sc3+ ions molar replacing La3+ ions molar. Additionally, Fig. S1 (ESI†) displays the DR spectra and corresponding bandgap values for all samples. Fig. S2 (ESI†) presents relationships between bandgap and doped Sc3+ concentration in the (Gd0.8−xEr0.1Yb0.1Scx)LaO3 (x = 0, 0.05, 0.1, 0.15, 0.2) and (Gd0.8Er0.1Yb0.1)(La1−xScx)O3 (x = 0, 0.05, 0.1, 0.15, 0.2) phosphors. The experimental results show that Sc3+ doping can increase the bandgap values. It is noteworthy that when the concentration of Sc3+ exceeds 10 mol%, the samples prepared by replacing La3+ ions molar with Sc3+ consistently exhibit a higher bandgap compared to the samples prepared by replacing Gd3+ ions molar with Sc3+. The dosing according to different chemical formulas will lead to different lattice structures, which will change the bandgap values.
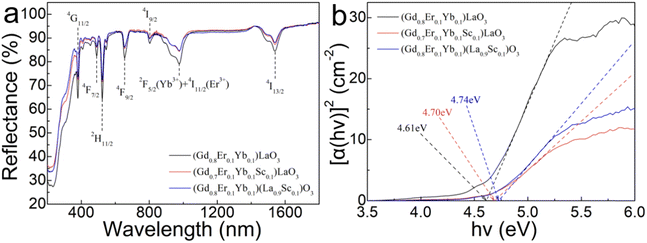 | ||
| Fig. 2 (a) Diffuse reflectance spectra of (Gd0.8Er0.1Yb0.1)LaO3, (Gd0.8Er0.1Yb0.1Sc0.1)LaO3, and (Gd0.8Er0.1Yb0.1)(La0.9Sc0.1)O3 phosphors. (b) Corresponding calculated bandgap values. | ||
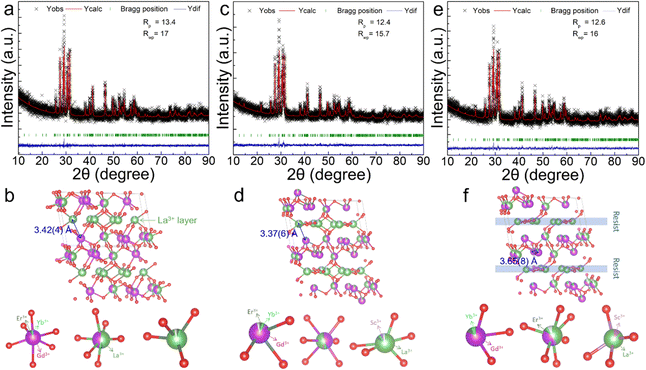
In order to confirm the positions occupied by Er3+/Yb3+/Sc3+, we performed Rietveld refinement of the XRD data. For (Gd0.8Er0.1Yb0.1)(La0.9Sc0.1)O3, we first carried out the replacement of Rietveld refinement according to the molar ratio of raw materials, that is, supposing Er3+/Yb3+ replaces Gd3+ and Sc3+ replaces La3+. The result of this refinement is shown in Fig. S3(a) (ESI†). This refinement result is very unsatisfactory, and some peaks correspond very poorly, so it is unreasonable to refine according to the molar ratio of this chemical formula. Therefore, we assume that Er3+/Yb3+/Sc3+ can randomly replace Gd3+ and La3+ sites for refinement. The refinement result is illustrated in Fig. 3(e). This refined result is more reasonable than Fig. S3(a) (ESI†). Rp is 12.6, and Rwp is 16, and these values are relatively high. Therefore, in order to verify the rationality of the above refinement, we conducted XRD slow scanning of the sample to improve the diffraction intensity of XRD, and then carried out the same refinement operation. Rp and Rwp become 4.32 and 5.55, respectively, as shown in Fig. S3(b) (ESI†). The Rp and Rwp values are very reasonable and once again confirm the accuracy of the structural refinement. With the same operation, the XRD results of (Gd0.8Er0.1Yb0.1)LaO3 and (Gd0.8Er0.1Yb0.1Sc0.1)LaO3 are also refined, as shown in Fig. 3(a) and (c). For (Gd0.8Er0.1Yb0.1)LaO3 and (Gd0.8Er0.1Yb0.1Sc0.1)LaO3,Er3+/Yb3+ replace the Gd3+, Gd3+/La3+, and La3+ sites, and the distribution of Er3+/Yb3+ in the host belongs to three-dimensional (3D). For (Gd0.8Er0.1Yb0.1)(La0.9Sc0.1)O3, Er3+/Yb3+ replace the Gd3+ and Gd3+/La3+ sites, and most Er3+/Yb3+ replace the Gd3+ sites. Sc3+ replaces La3+ sites. Here, Er3+/Yb3+ is distributed in a continuous double layer structure, blocked by a single layer of Sc3+/La3+. The distribution of Er3+/Yb3+ in (Gd0.8Er0.1Yb0.1)(La0.9Sc0.1)O3 is the case between 3D and monolayer (2D). This structure can prevent the energy transfer between different bilayer structures and promote cross relaxation between Er3+ and Er3+, Yb3+ and Er3+ in the double layers, and therefore is expected to obtain outstanding red UCL. In addition, the nearest distances between Yb3+ and Er3+ or Er3+ and Er3+ in the (Gd0.8Er0.1Yb0.1)LaO3, (Gd0.8Er0.1Yb0.1Sc0.1)LaO3, and (Gd0.8Er0.1Yb0.1)(La0.9Sc0.1)O3 phosphors are 3.42(4), 3.37(6), and 3.65(8) Å, respectively, which are labeled in Fig. 3(b), (d), and (f).
Fig. 4(a) and (b) display the UCL spectra of (Gd0.8−xEr0.1Yb0.1Scx)LaO3 (x = 0, 0.1, 0.2) and (Gd0.8Er0.1Yb0.1)(La1−xScx)O3 (x = 0, 0.1, 0.2) under 980 nm laser excitation. The samples with a concentration of 10 mol% Sc3+ exhibit the highest UCL intensity. The UCL spectra of other trivalent cation (Al3+, Y3+, Bi3+, and La3+) doped samples, respectively, replacing Gd3+ and La3+ in molar ratios for weighing, were also tested and shown in Fig. S4(a) and (c) (ESI†). The red UCL intensity integral areas are calculated and displayed in Fig. S4(b) and (d) (ESI†). This result shows that, compared with other trivalent elements, Sc3+ doping can obtain the highest red UCL intensity.
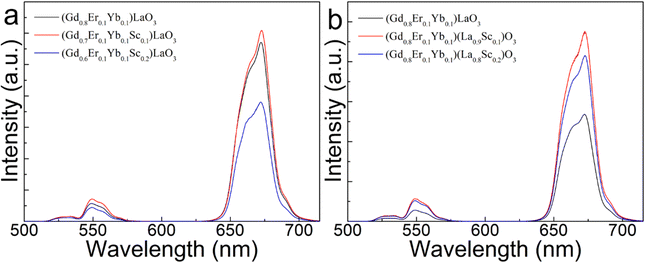 | ||
| Fig. 4 UCL spectra of (Gd0.8−xEr0.1Yb0.1Scx)LaO3 (x = 0, 0.1, 0.2) (a) and (Gd0.8Er0.1Yb0.1)(La1−xScx)O3 (x = 0, 0.1, 0.2) (b) under 980 nm laser excitation. | ||
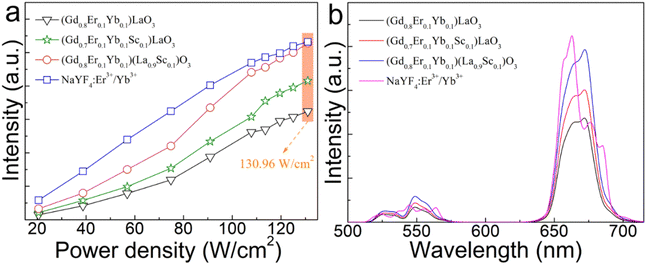
Fig. 5(a) depicts the red UCL integral intensity of the (Gd0.8Er0.1Yb0.1)LaO3, (Gd0.8Er0.1Yb0.1Sc0.1)LaO3, (Gd0.8Er0.1Yb0.1)(La0.9Sc0.1)O3, and β-NaYF4:Er3+/Yb3+ phosphor under 980 nm laser excitation with different excitation power densities. The red UCL intensity of all samples increases with increasing excitation power density. The UCL performance of (Gd0.8Er0.1Yb0.1)(La0.9Sc0.1)O3 is better than that of (Gd0.8Er0.1Yb0.1Sc0.1)LaO3, and much better than that of (Gd0.8Er0.1Yb0.1)LaO3. Under 130.96 W cm−2, the red UCL intensity of the (Gd0.8Er0.1Yb0.1)(La0.9Sc0.1)O3 sample reaches 100% of the strength exhibited by the commercial β-NaYF4:Er3+/Yb3+ phosphor. The corresponding UCL spectra are shown in Fig. 5(b) under 130.96 W cm−2 excitation.
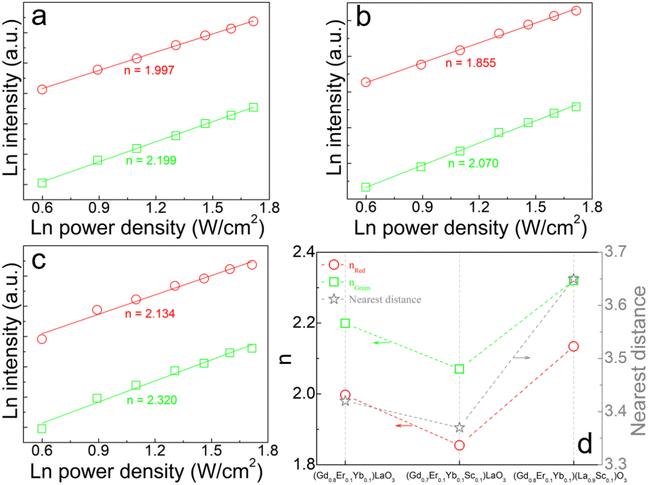
The logarithmic curves of the red and green UCL intensity of (Gd0.8Er0.1Yb0.1)LaO3, (Gd0.8Er0.1Yb0.1Sc0.1)LaO3, and (Gd0.8Er0.1Yb0.1)(La0.9Sc0.1)O3 as a function of the pump power density are shown in Fig. 6(a), (b) and (c), respectively. The relationship between the pump power density (P) and the integrated UCL intensity (I) in a multiphoton process can be expressed as follows:
ln(I) ∝ n![[thin space (1/6-em)]](https://www.rsc.org/images/entities/char_2009.gif) ln(P) ln(P) | (1) |
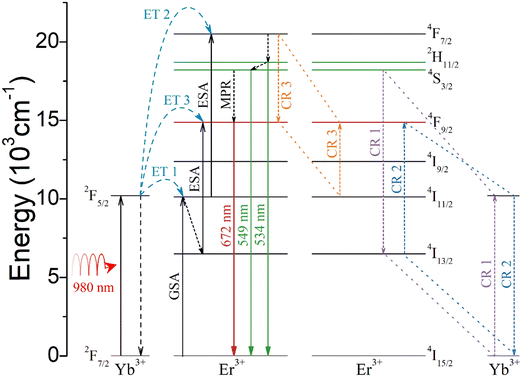
The possible UCL luminescence process under 980 nm pump excitation is illustrated in Fig. 7. UCL processes contain ground state absorption (GSA), excited state absorption (ESA), energy transfer (ET), multiphonon non-radiative transition (MPR), and cross relaxation (CR). The CR process is significantly related to the distance between Yb3+ and Er3+ or Er3+ and Er3+. Yb3+ exhibits a large absorption cross section of 980 nm, and the electron absorbs 980 nm light energy and jumps from 2F7/2 to 2F5/2. Firstly, Er3+ undergoes two energy transfers from Yb3+: 4I15/2 (Er3+) + 2F5/2 (Yb3+) → 4I11/2 (Er3+) + 2F7/2 (Yb3+) (ET 1) and 4I11/2 (Er3+) + 2F5/2 (Yb3+) → 4F7/2 (Er3+) + 2F7/2 (Yb3+) (ET 2), resulting in the population of 4F7/2 of Er3+. The 2H11/2 and 4S3/2 are then populated through MPR, resulting in green light emission through radiative transitions with 2H11/2 → 4I15/2 and 4S3/2 → 4I15/2 in Er3+. 4F9/2 in Er3+ can be populated through MPR with 4S3/2 → 4F9/2. However, due to the low phonon energy of the GdLaO3 host, MPR with 4S3/2 → 4F9/2 is weak. Therefore, it is believed that this transition pathway is not the main reason for the strong red UCL emission. Additionally, the red UCL pathway also involves electrons that are populated at 4I13/2 through MPR with 4I11/2 → 4I13/2 and then jump to 4F9/2 through energy transfer: 4I13/2 (Er3+) + 2F5/2 (Yb3+) → 4F9/2 (Er3+) + 2F7/2 (Yb3+) (ET 3), resulting in red UCL emission. However, this MPR with 4I11/2 → 4I13/2 is also weak, so this transition pathway should not be the main cause of the intense red UCL emission. In addition, red UCL emission can be achieved by CR 1, CR 2, and CR 3. In general, for oxide UCL phosphors with low phonon energy, red UCL should come mainly from CR, which has also been discussed in detail in some other studies.35–38 The three CR 1, CR 2 and CR 3 processes involve the following transitions: 4S3/2 (Er3+) + 2F7/2 (Yb3+) → 4I13/2 (Er3+) + 2F5/2 (Yb3+) (CR 1), 4I13/2 (Er3+) + 2F5/2 (Yb3+) → 4F9/2 (Er3+) + 2F7/2 (Yb3+) (CR 2), and 4F7/2 (Er3+) + 4I11/2 (Er3+) → 4F9/2 (Er3+) + 4F9/2 (Er3+) (CR 3). CR 1 can reduce the populated electron number at 4S3/2, which produces green UCL. CR 2 and CR 3 can enhance the electron population of 4F9/2 in Er3+ with emitting red UCL. In summary, the strong red UCL emission mainly comes from the simultaneous occurrence of CR 1 and CR 2 between Er3+ and Yb3+, and CR 3 between Er3+ and Er3+. For (Gd0.8Er0.1Yb0.1)(La0.9Sc0.1)O3, Er3+ and Yb3+ are distributed in a continuous double layer structure, blocked by a single layer of Sc3+/La3+. Therefore, this structure allows CR 1, CR 2, and CR 3 to occur only in the double-layer structure and improves the efficiency of energy transfer with CR 1, CR 2, and CR 3 in the double-layer. These CR 1 and CR 2 will make the number of photons n emitted by red light become super-quadratic dependence of the red intensity on 980 nm laser power density. CR 3 will cause a sub-quadratic dependence of red intensity on 980 nm laser power density because three 980 nm photons generate two red photons.38 Therefore, for (Gd0.8Er0.1Yb0.1)LaO3 and (Gd0.8Er0.1Yb0.1Sc0.1)LaO3, CR 3 may have a major role. For (Gd0.8Er0.1Yb0.1)(La0.9Sc0.1)O3, CR 1 and CR 2 may play a major role. In these three samples, the difference in photon number n and the difference in electron transition path should be due to the difference in Er3+/Yb3+/Sc3+ substitution positions and the change in distance between Er3+ and Yb3+ or Er3+ and Er3+.
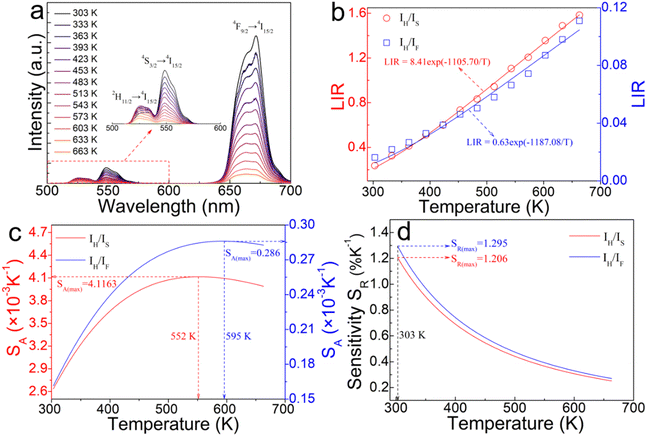
Fig. 8(a) illustrates the temperature-dependent UCL spectra of (Gd0.8Er0.1Yb0.1)(La0.9Sc0.1)O3 within the temperature range of 303–663 K under 980 nm laser excitation. It has been demonstrated that the UCL integral intensity decreases as the temperature increases. To evaluate the temperature sensing property of (Gd0.8Er0.1Yb0.1)(La0.9Sc0.1)O3, the UCL integral intensity of 2H11/2 → 4I15/2 (IH), 4S3/2 → 4I15/2 (IS), and 4F9/2 → 4I15/2 (IF) were calculated under different temperatures. The LIR (IH/IS, IH/IF) values and their relationship with temperature can be calculated and fitted using the following formula:
 | (2) |
 | (3) |
 | (4) |
 | (5) |
The experimental results of absolute sensitivity (SA) and relative sensitivity (SR) are presented in Fig. 8(c) and (d), respectively. The maximum values of absolute sensitivity (SA) are 0.004116 K−1 at 552 K and 0.000286 K−1 at 595 K, respectively. Similarly, the maximum values of the relative sensitivities (SR) are 0.01206 K−1 and 0.01295 K−1 at 303 K, respectively. The maximum absolute and relative sensitivity are compared with other materials, as shown in Table 1. This result indicates that (Gd0.8Er0.1Yb0.1)(La0.9Sc0.1)O3 exhibits excellent temperature sensing performance under 980 nm laser excitation and holds promising potential for temperature sensing applications.
| Materials | S A (K−1) | S R (K−1) | Ref. |
|---|---|---|---|
| SrLu2O4:Er3+/Yb3+ | 0.00126 | 0.00260 | 39 |
| BiLaWO6:Er3+/Tm3+/Yb3+ | 0.00120 | 0.00430 | 40 |
| Ba3Y4O9:Er3+/Yb3+ | 0.00371 | — | 41 |
| Gd2(WO4)3:Er3+/Yb3+ | 0.00130 | — | 42 |
| NaGdF4:Er3+ | 0.001 | — | 43 |
| Gd2O3:Er3+@Gd2O3:Yb3+ | 0.0007 | — | 44 |
| LaGdO3:Er3+/Yb3+ | 0.0034 | 0.0108 | 45 |
| BaY2O4:Er3+/Yb3+ | 0.0019 | — | 46 |
| (Gd0.8Er0.1Yb0.1)(La0.9Sc0.1)O3 | 0.0041163 | 0.01295 | This work |
4. Conclusion
GdLaO3:Er3+/Yb3+/Sc3+ phosphors with space group C2/m (No. 12) are successfully synthesized by high temperature solid state sintering and have excellent red UCL intensity. (Gd0.8Er0.1Yb0.1)(La0.9Sc0.1)O3 represents the highest red UCL intensity in all the samples, which is comparable to commercial red β-NaYF4:Er3+/Yb3+. The Rietveld refinement result of the XRD data reveals that Er3+/Yb3+ are distributed in a continuous double layer structure, blocked by a single layer of Sc3+/La3+. This special structure allows cross relaxation between Er3+ and Er3+, Er3+ and Yb3+ to occur only in the double-layer structure and improves the efficiency of energy transfer with cross relaxation in the double-layer. The maximum value of relative temperature sensitivity reaches 0.01295 K−1 at 303 K. GdLaO3:Er3+/Yb3+/Sc3+ phosphors with excellent pure red UCL emission have good application prospects in luminescence display and temperature sensing.Conflicts of interest
There are no conflicts of interest to declare.Acknowledgements
This study was supported in part by NSFC (National Natural Science Foundation of China, grant no. 11774042, 52071048 and 51772159), Fundamental Research Funds for the Central Universities (grant no. 3132023196 and 3132023519), and China Postdoctoral Science Foundation (grant no. 2016M591420 and 3620080711).References
- F. Auzel, History of upconversion discovery and its evolution, J. Lumin., 2020, 223, 116900 CrossRef CAS.
- K. Li and R. Van Deun, Ca3La2Te2O12:Mn4+, Nd3+, Yb3+: an efficient thermally-stable UV/visible-far red/NIR broadband spectral converter for c-Si solar cells and plant-growth LEDs, Mater. Chem. Front., 2019, 3, 403–413 RSC.
- H. Rodríguez-Rodríguez, M. H. Imanieh, F. Lahoz and I. R. Martín, Analysis of the upconversion process in Tm3+ doped glasses for enhancement of the photocurrent in silicon solar cells, Sol. Energy Mater. Sol. Cells, 2016, 144, 29–32 CrossRef.
- X. Zhao, F. Liu, T. Shi, H. Wu, L. Zhang, J. Zhang, X. Wang and Y. Liu, Conceptual ultraviolet-C light source based on up-conversion luminescence, Adv. Photonics Res., 2022, 3, 2200106 CrossRef CAS.
- L. Lei, D. Chen, C. Li, F. Huang, J. Zhang and S. Xu, Inverse thermal quenching effect in lanthanide-doped upconversion nanocrystals for anti-counterfeiting, J. Mater. Chem. C, 2018, 6, 5427 RSC.
- J. Ruan, Z. Yang, Y. Wen, M. Li, Y. Ren, J. Qiu, Z. Song and Y. Wang, Laser induced thermochromism and reversible upconversion emission modulation of a novel WO3:Yb3+, Er3+ ceramic: dual-modal fingerprint acquisition application, Chem. Eng. J., 2020, 383, 123180 CrossRef CAS.
- B. Chen and F. Wang, Recent advances in the synthesis and application of Yb-based fluoride upconversion nanoparticles, Inorg. Chem. Front., 2020, 7, 1067 RSC.
- M. Bettinelli, L. Carlos and X. Liu, Lanthanide-doped upconversion nanoparticles, Phys. Today, 2015, 68, 38–44 CrossRef CAS.
- C. D. S. Brites, R. Marin, M. Suta, A. N. Carneiro Neto, E. Ximendes, D. Jaque and L. D. Carlos, Spotlight on luminescence thermometry: basics, challenges, and cutting-edge applications, Adv. Mater., 2023, 35, 2302749 CrossRef CAS PubMed.
- K. Maciejewska, A. Bednarkiewicz, A. Meijerink and L. Marciniak, Correlation between the covalency and the thermometric properties of Yb3+/Er3+ codoped nanocrystalline orthophosphates, J. Phys. Chem. C, 2021, 125, 2659–2665 CrossRef CAS PubMed.
- K. Zheng, W. Song, G. He, Z. Yuan and W. Qin, Five-photon UV upconversion emissions of Er3+ for temperature sensing, Opt. Express, 2015, 23, 7653–7658 CrossRef CAS PubMed.
- R. Shi, C. D. S. Brites and L. D. Carlos, Hexagonal-phase NaREF4 upconversion nanocrystals: the matter of crystal structure, Nanoscale, 2021, 13, 19771–19782 RSC.
- C. Renero-Lecuna, R. Martín-Rodríguez, R. Valiente, J. González, F. Rodríguez, K. W. Krämer and H. U. Güdel, Origin of the high upconversion green luminescence efficiency in β-NaYF4:2%Er3+, 20%Yb3+, Chem. Mater., 2011, 23, 3442–3448 CrossRef CAS.
- H. Dong, L. D. Sun and C. H. Yan, Basic understanding of the lanthanide related upconversion emissions, Nanoscale, 2013, 5, 5703–5714 RSC.
- H. Wu, Z. Hao, L. Zhang, X. Zhang, Y. Xiao, G. H. Pan, H. Wu, Y. Luo, H. Zhao and J. Zhang, Phonon energy dependent energy transfer upconversion for the red emission in the Er3+/Yb3+ system, J. Phys. Chem. C, 2018, 122, 9611–9618 CrossRef CAS.
- W. You, D. Tu, W. Zheng, P. Huang and X. Chen, Lanthanide-doped disordered crystals: Site symmetry and optical properties, J. Lumin., 2018, 201, 255–264 CrossRef CAS.
- H. Suo, X. Zhao, Z. Zhang, R. Shi, Y. Wu, J. Xiang and C. Guo, Local symmetric distortion boosted photon up-conversion and thermometric sensitivity in lanthanum oxide nanospheres, Nanoscale, 2018, 10, 9245–9251 RSC.
- H. Dong, L. D. Sun and C. H. Yan, Local structure engineering in lanthanide-doped nanocrystals for tunable upconversion emissions, J. Am. Chem. Soc., 2021, 143, 20546–20561 CrossRef CAS PubMed.
- F. T. Rabouw, P. T. Prins, P. Villanueva-Delgado, M. Castelijns, R. G. Geitenbeek and A. Meijerink, Quenching pathways in NaYF4:Er3+, Yb3+ upconversion nanocrystals, ACS Nano, 2018, 12, 10576–10577 CrossRef CAS PubMed.
- H. Bae, D. Park, K. Shin, H. Lee, K. M. Ok and K. T. Lee, Upconversion properties in lanthanide doped layered-perovskite, CsBiNb2O7, J. Chem. Phys., 2021, 154, 054701 CrossRef CAS PubMed.
- N. Zhang, M. S. Molokeev, Q. Liu and Z. Xia, Pure red upconversion luminescence and optical thermometry of Er3+ doped sensitizer-rich SrYbInO4 phosphors, J. Mater. Chem. C, 2018, 6, 7361–7366 RSC.
- L. Feng, Z. Hao, Y. Luo, X. Zhang, L. Zhang, G. Pan, H. Wu and J. Zhang, Observation and photoluminescence properties of two Er3+ centers in CaSc2O4:Er3+, Yb3+ upconverting phosphor, J. Alloys Compd., 2017, 708, 827–833 CrossRef CAS.
- H. Cui, Y. Cao, Y. Zhang, L. Cao, S. Ran, X. Wang, D. Wu, X. Li, X. Zhang and B. Chen, Extremely intense green up-conversion luminescent and ultra-high temperature sensitivity in Er3+/Yb3+co-doped BiTa7O19 phosphors, J. Lumin., 2022, 241, 118484 CrossRef CAS.
- L. Li, Y. Cao, Y. Zhang, H. Cui, G. Li, J. Zhang, X. Zhang and B. Chen, Excellent upconversion luminescence intensity in Er3+/Yb3+/Mo4+ triple-doped BiTa7O19 phosphors, J. Alloys Compd., 2023, 938, 168725 CrossRef CAS.
- X. Yan, Y. Cao, T. Liu, X. Wang, L. Li, J. Zhang and B. Chen, Order-disorder phase transitions significantly improving the upconversion luminescence intensity of BiTa7O19:Er3+/Yb3+, Ceram. Int., 2024, 50, 9433–9440 CrossRef CAS.
- S. P. Pavunny, A. Kumar, P. Misra, J. F. Scott and R. S. Katiyar, Properties of the new electronic device material LaGdO3, Phys. Status Solidi B, 2014, 251, 131–139 CrossRef CAS.
- G. A. Tompsett, R. J. Phillips, N. M. Sammes and A. M. Cartner, Characterisation of LaGdO3 by X-ray powder diffraction and Raman spectroscopy, Solid State Commun., 1998, 108, 655–660 CrossRef CAS.
- G. T. Xiang, M. Xiong, Z. Y. Yang, Y. J. Wang, L. Yao, S. Jiang, X. J. Zhou, L. Li, X. J. Wang and J. H. Zhang, Multipath optical thermometry realized by electronic levels and stark sublevels of Er3+, Ceram. Int., 2024, 50, 5261–5266 CrossRef CAS.
- G. T. Xiang, Y. Y. Yi, Z. Y. Yang, Y. J. Wang, L. Yao, S. Jiang, X. J. Zhou, L. Li, X. J. Wang and J. H. Zhang, Achieving ultrasensitive temperature sensing through non-thermally coupled energy levels to overcome energy gap constraints, Inorg. Chem. Front., 2024, 11, 1522–1530 RSC.
- P. Li, L. Guo, C. Liang, T. Li and P. Chen, Enhanced dual-wavelength sensitive upconversion luminescence of BiPO4:Yb3+/Er3+ phosphors by Sc3+ doping, Mater. Sci. Eng. B, 2018, 229, 20–26 CrossRef CAS.
- C. Zhang, Q. Jiang, M. Liu, H. Ma and Y. Kuai, Enhanced up-conversion luminescent properties of KYb2F7:Er3+ by Sc3+ doping, Opt. Mater., 2019, 88, 615–620 CrossRef CAS.
- Y. Wang, C. Zuo, C. Ma, W. Ye, C. Zhao, Z. Feng, Y. Li, Z. Wen, C. Wang, X. Shen, X. Yuan and Y. Cao, Effects of Sc3+ ions on local crystal structure and up-conversion luminescence of layered perovskite NaYTiO4:Yb3+/Er3+, J. Alloys Compd., 2021, 876, 160166 CrossRef CAS.
- M. M. Liu, G. C. Zheng, Y. Wei, D. Tian, Q. B. Zheng, L. Huang and J. Xie, Doping induced morphology, crystal structure, and upconversion luminescence evolution: from Na3ScF6:Yb/Er/Y to NaYF4:Yb/Er/Sc nanocrystals, Rare Met., 2023, 42, 1018–1027 CrossRef CAS.
- B. H. Toby, EXPGUI, a graphical user interface for GSAS, J. Appl. Cryst., 2001, 34, 210–213 CrossRef CAS.
- G. Xiang, Q. Xia, S. Xu, X. Liu, S. Jiang, Y. Wang, X. Zhou, L. Li, L. Ma, X. Wang and J. Zhang, Multipath optical thermometry realized in CaSc2O4:Yb3+/Er3+ with high sensitivity and superior resolution, J. Am. Ceram. Soc., 2021, 104, 2711–2720 CrossRef CAS.
- J. Zhang, Z. Hao, J. Li, X. Zhang, Y. Luo and G. Pan, Observation of efficient population of the red-emitting state from the green state by non-multiphonon relaxation in the Er3+-Yb3+ system, Light: Sci. Appl., 2015, 4, e239 CrossRef CAS.
- C. Mi, J. Wu, Y. Yang, B. Han and J. Wei, Efficient upconversion luminescence from Ba5Gd8Zn4O21:Yb3+, Er3+ based on a demonstrated cross-relaxation process, Sci. Rep., 2016, 6, 22545 CrossRef CAS PubMed.
- J. L. Sommerdijk and A. Bril, Visible luminescence of Yb3+, Er3+ under IR excitation, Luminescence of Crystals, Molecules, and Solutions: Proceedings of the International Conference on Luminescence held in Leningrad, USSR, August 1972. Boston, MA: Springer US, 1972, pp. 86–91.
- Y. Jina, X. Luoa, Z. Zhoua, R. Rana, S. Tana, H. Linb, F. Mengb, G. Xiangc, L. Mad and X. Wang, The excellent dual optical thermometry of the Yb3+, Er3+ doped SrLu2O4, J. Lumin., 2022, 251, 119260 CrossRef.
- K. Pavani, A. J. Neves, R. J. B. Pinto, C. S. R. Freire, M. J. Soares, M. P. F. Graça, K. U. Kumar and S. K. Jakka, BiLaWO6:Er3+/Tm3+/Yb3+phosphor: Study of multiple fluorescence intensity ratiometric thermometry at cryogenic temperatures, Ceram. Int., 2022, 48, 31344–31353 CrossRef CAS.
- H. Wu, Z. Hao, L. Zhang, X. Zhang, Y. Xiao, G. H. Pan, H. Wu, Y. Luo, L. Zhang and J. Zhang, Er3+/Yb3+ codoped phosphor Ba3Y4O9 with intense red upconversion emission and optical temperature sensing behavior, J. Mater. Chem. C, 2018, 6, 3459–3467 RSC.
- H. Lu, R. Meng, H. Hao, Y. Bai, Y. Gao, Y. Song, Y. Wang and X. Zhang, Stark sublevels of Er3+-Yb3+ codoped Gd2(WO4)3 phosphor for enhancing the sensitivity of a luminescent thermometer, RSC Adv., 2016, 6, 57667–57671 RSC.
- Y. Bu, L. Meng and X. Yan, Tm3+ modified optical temperature behavior of transparent Er3+-doped hexagonal NaGdF4 glass ceramics, Nanoscale Res. Lett., 2017, 12, 402 CrossRef PubMed.
- Z. Liu, R. X. Wang, K. W. Sun, X. C. Ling, J. W. Sun and D. H. Chen, Upconversion red light emission and luminescence thermometry of Gd2O3:Er3+@Gd2O3:Yb3+ core-shell nanofibers synthesized via electrospinning, Chalcogenide Lett., 2023, 20, 439–447 CrossRef CAS.
- A. Siaï, P. Haro-González, K. H. Naifer and M. Férid, Optical temperature sensing of Er3+/Yb3+ doped LaGdO3 based on fluorescence intensity ratio and lifetime thermometry, Opt. Mater., 2018, 76, 34–41 CrossRef.
- G. Xiang, X. Liu, Q. Xia, S. Jiang, X. Zhou, L. Li, Y. Jin, L. Ma, X. Wang and J. Zhang, Deep-tissue temperature sensing realized in BaY2O4:Yb3+/Er3+ with ultrahigh sensitivity and extremely intense red upconversion luminescence, Inorg. Chem., 2020, 59, 11054–11060 CrossRef CAS PubMed.
Footnote |
| † Electronic supplementary information (ESI) available. See DOI: https://doi.org/10.1039/d4tc01015a |
| This journal is © The Royal Society of Chemistry 2024 |

