 Open Access Article
Creative Commons Attribution 3.0 Unported Licence
The electric vehicle transition
Boucar
Diouf

Department of Information Display, Kyung Hee University, 26 Kyungheedaero, Dongdaemun-gu, Seoul, 02447, Republic of Korea. E-mail: diouf@khu.ac.kr
First published on 4th January 2024
Abstract
Automobiles are the main sources of pollution; decarbonization of road transport is a major objective around the world. The electric vehicle (EV) technology is mature and somehow competitive with the development of lithium-ion (Li-ion) batteries. Affordability, performance, and the range are the first criteria that attract drivers to invest in EVs. Countries with the same objective of EVs to represent 100% of new registrations witness different progress, depending on the context and policy, and Norway and Iceland are currently leading. Countries with the highest EV penetration are almost systematically those with the highest cost of ownership of internal combustion engine (ICE) vehicles and those with most important subsidies. In this paper, the interplay between context, policy, and technology to drive EV transition is presented. Acquisition and operation cost, a combination of technology and policy, represent the factors that will guarantee the sustainability of EVs as the next generation of vehicles. For EVs to be more affordable it will largely depend on battery cost. Batteries are key in the performance, reliability, competitiveness, acquisition, and operation cost of EVs. Despite the undeniable progress, for EVs to match the performance of ICE vehicles in the range and lifespan, current battery technology needs to be improved. As novelties introduced in this field, along with a non-subsidy approach to the development of EVs, in this paper an upgraded diffusion model of EV technology based on the traditional S-curve is presented. An analysis of a potential secondhand market that is necessary to guarantee a full and sustainable EV transition is also presented.
Environmental significanceElectric vehicles present better environmental benefits than their internal combustion engine counterparts. These vehicles are known for their zero tailpipe emissions, so no direct emissions of greenhouse gases and less air pollution even if their carbon footprint needs to be considerably improved. Other major advantages include positive impact on climate change and reduced waste through recycling and repurposing materials, particularly batteries. The universal adoption of electric vehicles still requires important technical progress and policy reforms around the world. |
1 Introduction
Over 100 years ago, road transport was revolutionized by the replacement of horses with automobiles resulting in the rise of oil. The next revolution is currently taking place with oil being progressively replaced with electricity. In fact, electric cars were very popular in the early 1900 [Fig. 1], and it was around 1910 that the electric car was gradually replaced due to main developments in ICE vehicles. As an illustration, by 1912 a Ford Model T [Fig. 2] was sold for barely 40% of the price of an electric car. The progress in ICE vehicles was combined with the development of road networks beyond urban areas, the ease to install gasoline stations and the discovery of new oil sources made fuel relatively affordable. This caused electric automobiles to be archaic around 1935.Presently, about 1.5 billion ICE cars operate around the world1 corresponding to almost 45% of the global fuel consumption2 as represented in Fig. 3. Diesel and gasoline engines have dominated the road transport market since the first automobile revolution without any credible alternative. Crude oil is affordable and engines more and more performant. Road transport makes an important contribution to air pollution, greenhouse gas emissions and consequently global warming.
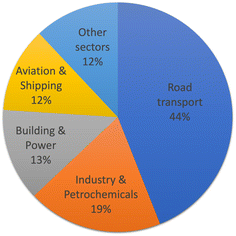 | ||
| Fig. 3 Breakdown of oil usage in different sectors.2 | ||
There is a need for alternatives for economic and environmental considerations, and there are different offers with different levels of integration in industrial production.3,4 In the early 2010s, EVs witnessed an important second revolution with the development of Li-ion batteries with improved power and energy densities allowing better performance and range.5–7 Since 2010, there is a steady progression of electric car sales around the world reaching over 10% of new car registrations globally in 2022 (ref. 8) out of a total of 66.2 million new vehicles on the market.8 On the other hand, since the 1970s, the price of crude oil has experienced immense periodic variations directly affecting the price of fuel. The variation of the crude oil price was primarily the decision of oil producing countries (OPEC) that control the production, as in the oil shock of 1973 [Fig. 4].9
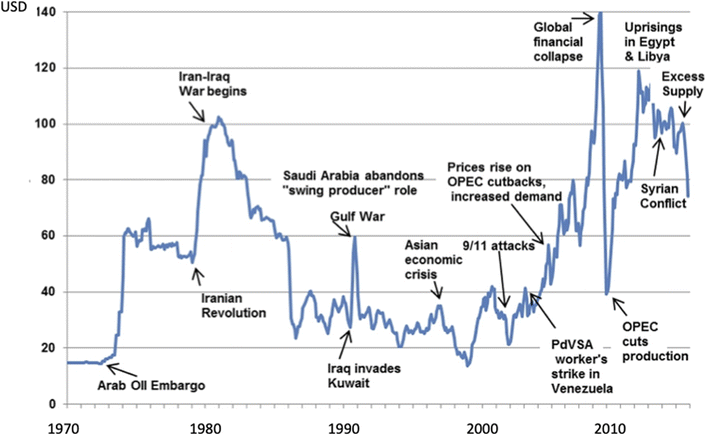 | ||
| Fig. 4 Crude oil prices react to many types of geopolitical events, from weather disasters to wars, revolutions and economic growth or recessions.9 | ||
EVs are supposed to take the lead in the global vehicle market by 2040 [Fig. 5].10 For various motivations, such as environmental, economic, political, etc., governments establish different electric mobility policies.
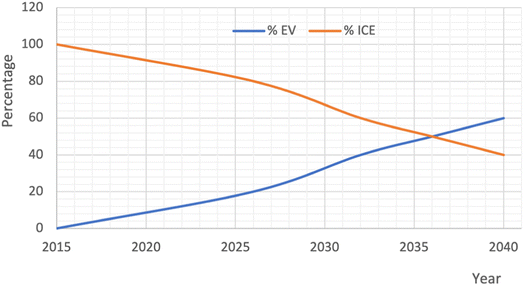 | ||
| Fig. 5 Global share of total annual passenger vehicle sales by drivetrain.10 | ||
In this paper, we present our research related mainly to the non-subsidy drivers of the EV market. We compare ICE vehicles to EVs with the performance of the latter essentially driven by the present battery technology and its future requirements, challenges, and the necessity of more research with a top-down approach. In the second place, we will present EV market penetration criteria with leading countries and the different variables that show how ready or prepared they may be to guarantee 100% EV transition: cost of ICE vehicle ownership, cost of electricity, density of population, Gross Domestic Product (GDP) per capita, rate of urbanization or percentage of renewable energy in their energy sources. An upgraded diffusion model of EV technology based on the traditional S-curve equation, the challenges of a potential secondhand EV market and the future of oil and lithium resources are presented.
2 EV vs. ICE vehicles, lithium the driver of EV technology
The first non-institutional driver of the EV market, along with price, is the combination of performance and safety that should match the standards of ICE vehicles.5–7 In that regard, the battery plays a major role. Presently, around the globe, for equivalent models on the catalog, EVs cost more than their ICE counterparts, and in some cases the difference can be substantial. Depending on countries, subsidies play an important role in setting off the total cost of ownership or acquisition.11Table 1 below compares an EV and ICE Kia Ray.12| Kia Ray | EV | ICE |
|---|---|---|
| a At the current exchange rate $1 = 1300KRW. b These are average prices for entry-level models. Vehicle prices change with options. | ||
| Weight | 1185 kg | 998 kg |
| Capacity | 14.6 kW h/330 V | 38 liters |
| Range | 138 km | 400 km < r < 500 km |
| Max speed | 130 km h−1 | 200 km h−1 |
| Consumption | 1.06 km kW−1 h−1–10.5 kW h/100 km | 7.6 liters/100 km – 9.4 liters/100 km |
| Charging time | 6 h/220 V – 25 min fast charge | |
| Costa | US $21000b | US $11000b |
A conventional ICE vehicle can generally last between 200![[thin space (1/6-em)]](https://www.rsc.org/images/entities/char_2009.gif) 000 and 300
000 and 300![[thin space (1/6-em)]](https://www.rsc.org/images/entities/char_2009.gif) 000 miles. It corresponds to a total of 10 to 15 years. On the other hand, EV batteries last 10 to 20 years in theory.
000 miles. It corresponds to a total of 10 to 15 years. On the other hand, EV batteries last 10 to 20 years in theory.
The average cost of an EV battery is between 30% and 60% of the vehicle's total value. Replacing the battery will be from free of charge to $20000 on average, depending on the warranty.
The demand for Li-ion batteries driven by the electric automobile industry will continue to grow to reach 4.7 TW h by 2030.13 The continuous drop of the battery price [Fig. 6] will pull the EV total acquisition cost down, making it more affordable. There is a decrease from $300 in 2015 to approximately $100 per kWh currently and the cost of the kWh may be as low as $50 by 2040 as presented Fig. 6 below.14–17
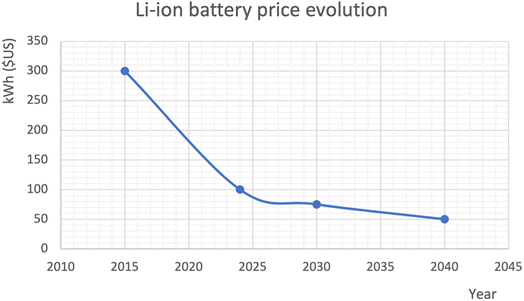 | ||
| Fig. 6 Li-ion battery price evolution.14 | ||
The EV Li-ion battery demand jumped from 330 GW h in 2021 to 550 GW h in 2022, 65% increment, corresponding to 55% increase in new car registrations made of EVs from 2021 to 2022.18
Obviously, the battery demand drives the basic material needs to critical limits. In 2022, the lithium demand surpassed the supply.19 As a reference year so far, in 2022, 60% of the available lithium on the market was for the EV industry, 30% of cobalt and 10% of nickel. In a near future, lithium mining may not keep up with the market demand to guarantee the progress in EV transition.19
Presently, the main cathode materials for the EV battery industry are lithium nickel manganese cobalt oxide (NMC), 60% of the market, followed by lithium iron phosphate (LFP), about 30%, and nickel cobalt aluminum oxide (NCA) with approximately 8% market share. Commercial LFP batteries have a density of energy below 200 W h kg−1, while for ternary batteries (NMC), the energy density is between 200 and 300 W h kg−1.20
Sodium-ion (Na-ion) batteries are a credible alternative to Li-ion technology. Among others, they present the advantage of using lower cost materials, and even if their energy density (75–160 W h kg−1) is lower than that of Li ions (150–170 W h kg−1),20 they may make a good match with urban transit, that requires a shorter range therefore smaller energy storage.
If we compare EVs and ICE vehicles, filling a gas tank takes 10 minutes at the most for an average vehicle, compared to about 6 hours at least of home charging for an EV or about 25 minutes while using fast-public charging.21,22 One of the main drivers of Li-ion technology in electric transport is the range, corresponding to the comparison between the gas tank and the battery capacity. The development of Li-ion technology23,24 for the future will include greater autonomy. Currently, fuel powered cars can have an autonomy up to 731 miles on a single tank [Jaguar X20d 731 miles] for 56 liters, corresponding to 14.62 miles per liter; meanwhile the best electric car range is about 500 miles on a single charge [lucid air 531 miles] for a charging time of 13 hours under 240 V for 118 kW h capacity, 4.5 miles per kW h. To bridge such a gap, it will be needed to have a breakthrough in the battery technology. Table 1 gives an illustration with the comparation between an EV and ICE Kia Ray.
NMC as well as LFP batteries are used to power EVs because of their safety and good energy density.20 To match the world record of 731 miles range for a passenger car, it will be necessary to have batteries with an energy density of about 400 W h kg−1, with obviously comparable safety guarantees, lifespan, power density, etc. Such a density of energy is yet to be achieved for batteries that can satisfy safety and lifespan requirements in EV applications. This shows the necessity of more investment and research in battery technology to make them more affordable and with higher performance. The electrolyte is a good direction for more research.
In fact, the electrolyte plays an important role in the battery capacity, power density, life cycle and safety. Modern Li-ion batteries use liquid electrolytes. Liquid electrolytes present issues such as low boiling points and flashing points. These batteries are prompt to catch fire or explode in case the liquid leaks or heats up above a certain level. Also, liquid electrolytes do not allow the use of high-voltage cathode materials and consequently limit the battery energy density.
Solid-state lithium batteries are said to be next generation batteries with a higher energy density and improved safety. They use solid electrolytes and no separator [Fig. 7].25,26
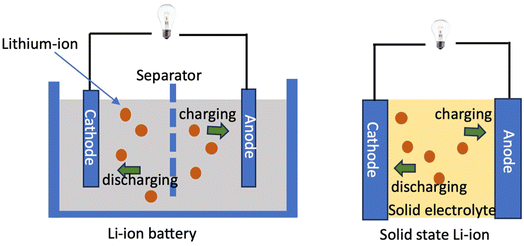 | ||
| Fig. 7 Liquid vs. solid electrolytes.26 | ||
It is very likely that lithium will continue to play a central role in the EV industry. Car manufacturers have been working on a rapidly emerging new battery technology such as solid-state batteries. Solid-state lithium batteries use a solid material rather than a potentially combustible gel. These materials are neither volatile nor combustible. The higher energy density would increase the range of EVs by between one-third and 50%. Toyota has a solid state battery powered car prototype with production expected in 2024.27
Energy storage for electric transport still needs a longer lifespan, lower rate of degradation, higher energy density, less sensitivity to high temperatures and temperature variations, and less sensitivity to humidity as well. There is a significant amount of research being conducted to improve battery quality and performance based on experiment, theory, or simulation.28–33 The main orientations to reach such a goal are design and heat management, material composition and the structure.28–33
3 Electric car market drivers
3.1. Electric car market drivers
It is a complex task to discuss the difference in incentives between countries unless it is direct cash received by EV buyers. Incentives can apply differently depending on countries; as an illustration, in the UK buyers receive direct flat subsidies, in the US they are based on the battery capacity, in France they evaluate carbon dioxide emission, and in China subsidies are range-based. In Norway, the objective of the government is to arrange subsidies so that the acquisition of an EV will cost at the most the same as its ICE vehicle counterpart. Norway has higher tax incentives for EVs with all taxes waived, even if such an approach is being scaled down.What is the secret to leading the world to EV transition? The leaders, Norway and Iceland [Table 2], have approached EV incentives differently to many other countries and such an approach started decades ago. Rather than important direct subsidies to individuals, they created a context favorable to the adoption of EVs including considerable tax breaks and infrastructures as charging stations.34,35 Norway has a high taxation on ICE cars, which makes it easier to incentivize EVs through taxation benefits. All this combined with high fossil-fuel prices compared to electricity and high urbanization makes it an ideal market for EVs. Furthermore, Iceland and Norway have the capacity to provide virtually 100% of their electricity from renewable sources.
| Country | 38 | 39 | 40 | 41 | Energy sources42–44 | Density45 | 46 | Cars/1000 people47 | |||
|---|---|---|---|---|---|---|---|---|---|---|---|
| % of e-cars | 1 l Gasoline ($US) | 1 kW h ($US) | 1 l/1 kW h | GDP per capita | Renewable | Fossil | Nuclear | Pop/km2 | %Urban | ||
| Norway | 86% | 2.091 | 0.129 | 16.209 | 89![[thin space (1/6-em)]](https://www.rsc.org/images/entities/char_2009.gif) 154.30 154.30 |
96.7 | 3.3 | 0 | 43 | 84 | 634.33 |
| Iceland | 72% | 2.242 | 0.146 | 15.356 | 68![[thin space (1/6-em)]](https://www.rsc.org/images/entities/char_2009.gif) 727.60 727.60 |
100 | 0 | 0 | 4 | 94 | 695.18 |
| Sweden | 43% | 1.853 | 0.361 | 5.132 | 61![[thin space (1/6-em)]](https://www.rsc.org/images/entities/char_2009.gif) 028.70 028.70 |
55.9 | 2.4 | 40.2 | 60 | 88 | 544.53 |
| Denmark | 35% | 2.066 | 0.576 | 3.586 | 68![[thin space (1/6-em)]](https://www.rsc.org/images/entities/char_2009.gif) 007.80 007.80 |
40.2 | 57.5 | 0 | 352 | 88 | 546.03 |
| Finland | 31% | 2.209 | 0.454 | 4.865 | 53![[thin space (1/6-em)]](https://www.rsc.org/images/entities/char_2009.gif) 654.80 654.80 |
32.8 | 27.5 | 31.6 | 43 | 86 | 577.57 |
| Netherlands | 30% | 1.945 | 0.489 | 3.977 | 57![[thin space (1/6-em)]](https://www.rsc.org/images/entities/char_2009.gif) 767.90 767.90 |
11 | 83.3 | 3.7 | 520 | 93 | 589.33 |
| Germany | 26% | 1.94 | 0.554 | 3.501 | 51![[thin space (1/6-em)]](https://www.rsc.org/images/entities/char_2009.gif) 203.60 203.60 |
20.5 | 60.1 | 17.9 | 605 | 78 | 633.46 |
| Switzerland | 22% | 2.014 | 0.234 | 8.606 | 91![[thin space (1/6-em)]](https://www.rsc.org/images/entities/char_2009.gif) 991.60 991.60 |
66 | 1 | 34 | 545 | 74 | 603.77 |
| Portugal | 20% | 1.778 | 0.293 | 6.068 | 24![[thin space (1/6-em)]](https://www.rsc.org/images/entities/char_2009.gif) 567.50 567.50 |
57 | 44 | 0 | 289 | 67 | 648.40 |
| United Kingdom | 19% | 1.806 | 0.412 | 4.383 | 46![[thin space (1/6-em)]](https://www.rsc.org/images/entities/char_2009.gif) 510.30 510.30 |
41.9 | 39 | 19.1 | 715 | 84 | 639.14 |
| France | 19% | 1.979 | 0.217 | 9.119 | 43![[thin space (1/6-em)]](https://www.rsc.org/images/entities/char_2009.gif) 659.00 659.00 |
11.6 | 8.5 | 79.4 | 303 | 82 | 673.75 |
| Belgium | 18% | 1.793 | 0.521 | 3.441 | 51![[thin space (1/6-em)]](https://www.rsc.org/images/entities/char_2009.gif) 247.00 247.00 |
20.5 | 60.1 | 17.9 | 985 | 98 | 591.19 |
| China | 16% | 1.196 | 0.08 | 14.95 | 12![[thin space (1/6-em)]](https://www.rsc.org/images/entities/char_2009.gif) 556.30 556.30 |
17 | 81.2 | 1.8 | 385 | 64 | 225.22 |
| Italy | 9% | 1.959 | 0.576 | 3.401 | 35![[thin space (1/6-em)]](https://www.rsc.org/images/entities/char_2009.gif) 657.50 657.50 |
27.6 | 71.4 | 0 | 509 | 72 | 765.75 |
| Spain | 8% | 1.702 | 0.369 | 4.612 | 30![[thin space (1/6-em)]](https://www.rsc.org/images/entities/char_2009.gif) 103.50 103.50 |
29.8 | 50.2 | 20 | 243 | 81 | 629.01 |
| Greece | 7% | 1.984 | 0.272 | 7.294 | 20![[thin space (1/6-em)]](https://www.rsc.org/images/entities/char_2009.gif) 192.60 192.60 |
29 | 71 | 0 | 205 | 80 | 631.57 |
| Canada | 7% | 1.3 | 0.119 | 10.924 | 51![[thin space (1/6-em)]](https://www.rsc.org/images/entities/char_2009.gif) 987.90 987.90 |
62.3 | 22.8 | 14.7 | 11 | 82 | 704.82 |
| South Korea | 6% | 1.233 | 0.101 | 12.207 | 34![[thin space (1/6-em)]](https://www.rsc.org/images/entities/char_2009.gif) 997.80 997.80 |
1.5 | 68.7 | 29.8 | 518 | 81 | 457.80 |
| United States | 5% | 1.011 | 0.18 | 5.616 | 70![[thin space (1/6-em)]](https://www.rsc.org/images/entities/char_2009.gif) 248.60 248.60 |
12.2 | 68.6 | 19.2 | 91 | 83 | 872.55 |
| New Zealand | 4% | 1.622 | 0.193 | 8.404 | 48![[thin space (1/6-em)]](https://www.rsc.org/images/entities/char_2009.gif) 781.00 781.00 |
76 | 24 | 0 | 49 | 87 | 864.92 |
Table 2 shows the rate of penetration of EVs in different markets along with Norway and Iceland. In 2022, they come far ahead of any other nation, as shown in Table 2 with respectively 86% of new car registrations in Norway and 72% in Iceland. The 3rd country in the top 20, Sweden, comes far behind with “only” 43%. Out of the 20 countries that make the list, the 11 countries that present the lowest rates are all under 20%, and 7 of those are under 10% [Table 2].
The electric car sales are up to 14% of global sales in 2022 and some studies project electric car sales to reach 54% of new cars on the market by 2040 (ref. 8 and 36) [Fig. 8] with projections to reach about 70 million EVs to be sold in 2040.
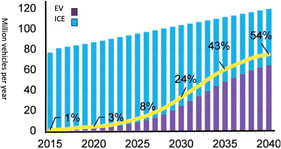 | ||
| Fig. 8 Annual global light-duty vehicle sales.36 | ||
A survey37 [Fig. 9] shows that ahead of any other criteria, affordability is the first motivation for car buyers to acquire an EV followed by the range and availability of public charging stations. Most of the other criteria can be translated in terms of affordability [Fig. 9]. The EV market is certainly impacted by governments' policies visible in acquisition and operation cost, particularly compared to ICE vehicles. Acquisition subsidies can certainly guarantee affordability to get the industry pick up but they are not sustainable in the longer run. The GDP per capita, as a translation of average income, would rather be more determinant.
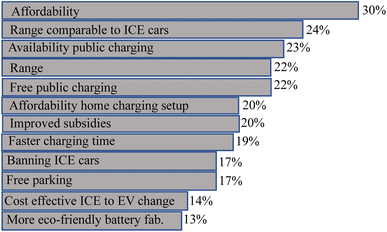 | ||
| Fig. 9 Motivations for EV adaption37 | ||
Among the countries with the highest percentage of EV sales, Norway and Iceland, respectively first and second markets in percentage in the list of the top 20 countries with the highest proportion of electric cars sold in 2022, rank respectively 2nd and 4th highest GDP per capita in the list presented Table 2. Government policies can be seen as well with the percentage of renewable energy in their energy sources, with Norway and Iceland coming respectively in the second and first positions with 96.7% of renewable sources for Norway and almost 100% for Iceland. This shows that these governments' policies as well as the potential they have in renewable energy make a good match with the transition to 100% EVs.
These countries present as well other remarkable specificities: the highest cost of gasoline and one of the highest ratios of cost of gasoline to electricity. Norway is the country that presents the highest ratio, followed by Iceland. This shows that without subsidies, the operation cost of an EV would be much more beneficial in these countries compared to all the other countries in the list.
Iceland presents the lowest density of population and Norway comes in the 3rd position; they both have a high rate of urbanization. This gives a good indication about populations having more chance to live in individual houses compared to densely populated countries where people are more likely to live in apartment complexes and count only on public charging stations. Living in individual flats or villas makes much more convenient recharging an electric car at home or even having a personal solar charging station. It is worth mentioning that a high urbanization rate is favorable for the adoption of an EV, particularly for short commutes, provide obviously that charging infrastructures follow. Iceland presents 94% of urbanization and 84% for Norway (Table 2).
One liter of gasoline corresponds to an electric energy of 8.9 kW h. On average an ICE vehicle covers 12 km per liter in urban areas, while a modern EV can run about 5 km on 1 kW h. Therefore, if the ratio of the cost of one liter of gasoline to one kWh of electricity is over the breaking point of 2.4, it is technically more advantageous to operate an EV than a gasoline car. In Saudi Arabia for example, currently one liter of gasoline costs $0.621 while one kWh of electricity is sold for $0.18 for households, the ratio is only 3.45 versus 16.21 in Norway and 15.36 in Iceland. A Saudi driver needs a different motivation to buy an EV compared to someone who lives in Norway or Iceland.
Non-subsidy variables are determinant in the adoption of an EV than direct subsidies. This is almost perfectly illustrated by the difference between Norway and Iceland compared to any other country, particularly the top 20 countries which look to propose very strong incentives. These indirect subsidies are what will guarantee the sustainability of EVs. The question of public charging stations can be technically solved by either using on-grid or off-grid solutions. A better integration of renewable energies looks to be an obvious option.
It is necessary to have a closer look at the automobile reality in the different markets to understand the weight of cost of car ownership [Table 3] in market drivers.
| Ranking | Country | Annual depreciation | Annual insurance | annual inspection | Annual tax & registration | Annual maintenance cost | Annual fuel | Annual parking | Annual toll fees | Annual washing | Fuel (liter) | Licensing |
|---|---|---|---|---|---|---|---|---|---|---|---|---|
| 1 | Denmark | $1809 | $651 | $125 | $355 | $794 | $2892 | $120 | $62 | $82 | $2.07 | $36 |
| 2 | Germany | $1662 | $717 | $236 | $217 | $2045 | $1717 | $136 | $41 | $96 | $1.89 | $43 |
| 3 | Finland | $1481 | $720 | $75 | $351 | $2143 | $1711 | $149 | $21 | $109 | $2.06 | $27 |
| 4 | UK | $1336 | $692 | $110 | $174 | $2068 | $1670 | $167 | $38 | $67 | $1.89 | $39 |
| 5 | Netherlands | $966 | $660 | $177 | $521 | $1765 | $1366 | $107 | $52 | $55 | $2.03 | $41 |
| 6 | Sweden | $1517 | $615 | $33 | $259 | $2232 | $1816 | $221 | $77 | $116 | $1.95 | $25 |
| 7 | Ireland | $1261 | $970 | $81 | $335 | $632 | $2042 | $155 | $186 | $82 | $1.82 | $54 |
| 8 | Norway | $1699 | $848 | $249 | $226 | $608 | $1519 | $203 | $417 | $110 | $2.16 | $19 |
| 9 | Canada | $1455 | $1316 | $92 | $88 | $711 | $1835 | $223 | $71 | $85 | $1.37 | $66 |
| 10 | USA | $1613 | $1018 | $85 | $151 | $1931 | $1525 | $171 | $139 | $104 | $1.06 | $47 |
| 11 | Australia | $1250 | $704 | $147 | $235 | $2048 | $1616 | $132 | $137 | $87 | $1.09 | $40 |
| 12 | Spain | $1541 | $519 | $47 | $123 | $1835 | $1505 | $215 | 105 | $57 | $1.75 | $24 |
| 13 | Greece | $934 | $366 | $56 | $249 | $1821 | $1527 | $81 | $149 | $73 | $2.02 | $18 |
| 14 | Guatemala | $853 | $502 | $160 | $88 | $1713 | $1316 | $237 | $117 | $109 | $1.21 | $65 |
| 15 | Portugal | $1280 | $346 | $33 | $111 | $1493 | $1237 | $107 | $217 | $44 | $1.83 | $29 |
| 16 | Ecuador | $932 | $581 | $157 | $278 | $1476 | $1202 | $151 | $189 | $86 | $0.63 | $142 |
| 17 | France | $1416 | $672 | $66 | $78 | $1461 | $1173 | $144 | $157 | $57 | $1.63 | $29 |
| 18 | Czech Republic | $1218 | $425 | $78 | $42 | $2379 | $1908 | $84 | $77 | $67 | $1.75 | $2 |
| 19 | Uruguay | $419 | $543 | $71 | $371 | $2076 | $1701 | $170 | $150 | $94 | $1.82 | $7 |
| 20 | Poland | $782 | $366 | $74 | $25 | $1591 | $1392 | $73 | $64 | $68 | $1.45 | $36 |
Out of the 20 countries with the highest EV penetration 13 are on the list of the 20 markets with the highest cost of ICE vehicle ownership. Such markets have much more room to offer tax rebates for EV buyers. Out of the other 7 remaining countries, Iceland, Switzerland, Belgium, Italy, China, South Korea, and New Zealand, 5 are part of the list of top countries with the highest direct incentives for the acquisition of an EV.48
The cases Switzerland and Iceland that are the only two countries in none of the lists deserve attention. Switzerland has applied, at least initially, exclusively a sanction policy based on cars greenhouse gases emission level before including subsidies and a heavy investment in public charging infrastructures.49
Iceland presents other specificities, such as a high urbanization rate, 94%, small population and small country, high density of charging stations and low cost of electricity.50,51
The bottom line is that markets with the highest EV penetration are those where the ownership of ICE vehicles is more expensive and countries where subsidies are higher.
Most of the other variables are directly related to batteries such as the cost of the vehicle, the performance of EVs, safety, or lifespan. Based on market requirements, more research is still needed even if EV technology has reached a competitive maturity. In a longer run, more research is needed to develop higher performance batteries to be more competitive in cost, energy density, lifespan, and complexity of materials for easier recycling.
The full adoption of EVs will need to overcome a certain number of challenges such as public charging stations and in the immediate practical aspect, access to public charging stations particularly for densely populated countries as South Korea or Japan. Grid infrastructures are not designed to support such an overload in production, transmission or distribution. It is almost obvious that off-grid renewable energy solutions will be needed. This may include more consideration of photovoltaic chargers in EVs, in the form of foldable high efficiency solar panels or even highly efficient photovoltaic paint that would cover vehicles. Gas stations may be associated for an easier integration of EV charging stations, as Shell company is already doing [Fig. 10]. Such an initiative will help in the transition from ICE cars to EVs in terms of infrastructures or employment.
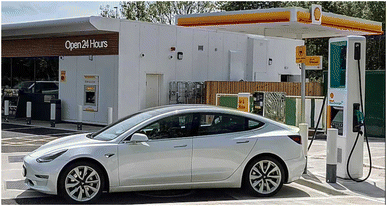 | ||
| Fig. 10 Shell offering EV charging stations next to standard gasoline stations.52 | ||
3.2. EV diffusion model
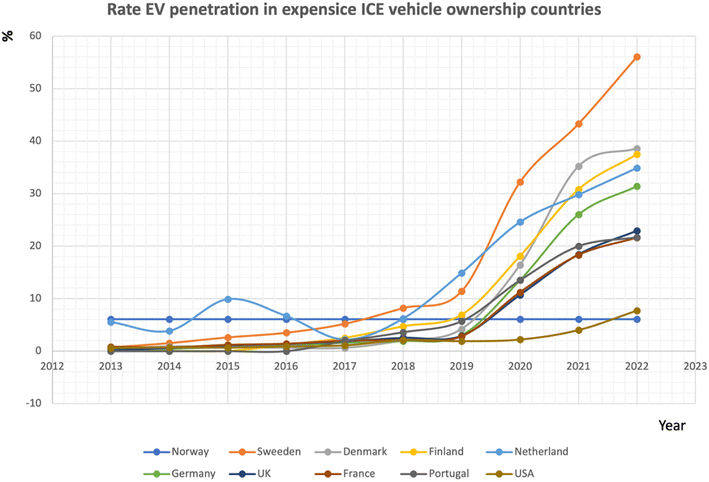
The success of EV transition can somehow be measured by the will of governments to fight pollution or limit dependence on oil imports, particularly in the geopolitical context of the last 50 years. Table 4 shows the evolution of EV transition in the 20 most dynamic markets between 2013 and 2022.| Country | Year | |||||||||
|---|---|---|---|---|---|---|---|---|---|---|
| 2013 | 2014 | 2015 | 2016 | 2017 | 2018 | 2019 | 2020 | 2021 | 2022 | |
| Norway | 6.1 | 13.8 | 22.4 | 29.1 | 39.2 | 49.1 | 55.9 | 74.7 | 86.2 | 87.8 |
| Iceland | 1.3 | 2.1 | 3.6 | 5.6 | 11.7 | 17.2 | 22.6 | 45.0 | 54.7 | 56.1 |
| Sweden | 0.71 | 1.53 | 2.62 | 3.5 | 5.2 | 8.2 | 11.4 | 32.2 | 43.3 | 56.1 |
| Denmark | 0.29 | 0.88 | 2.29 | 0.6 | 0.6 | 2 | 4.2 | 16.4 | 35.2 | 38.6 |
| Finland | — | — | — | 1.2 | 2.5 | 4.7 | 6.9 | 18.1 | 30.8 | 37.5 |
| Netherlands | 5.55 | 3.87 | 9.9 | 6.7 | 2.2 | 6.2 | 14.9 | 24.6 | 29.8 | 34.9 |
| Germany | 0.2 | 0.43 | 0.73 | 1.1 | 1.58 | 1.9 | 3.0 | 13.5 | 26.0 | 31.4 |
| Switzerland | 0.44 | 0.75 | 1.98 | 1.8 | 2.55 | 3.2 | 5.5 | 14.3 | 22.5 | 25.9 |
| Portugal | — | — | — | — | 1.9 | 3.6 | 5.7 | 13.5 | 20.0 | 21.7 |
| United Kingdom | 0.16 | 0.59 | 1.07 | 1.37 | 1.86 | 2.53 | 2.9 | 10.7 | 18.6 | 22.9 |
| France | 0.83 | 0.70 | 1.19 | 1.4 | 1.98 | 2.11 | 2.8 | 11.2 | 18.3 | 21.6 |
| Belgium | — | — | — | 1.8 | 2.7 | 2.5 | 3.2 | 10.7 | 18.4 | 26.5 |
| China | 0.08 | 0.23 | 0.84 | 1.31 | 2.1 | 4.2 | 4.9 | 5.4 | 15 | 30 |
| Italy | 0.07 | 0.08 | 0.09 | 0.08 | 0.1 | 0.26 | 0.6 | 4.3 | 9.3 | 8.8 |
| Spain | 0.07 | 0.08 | 0.09 | 0.08 | 0.1 | 0.26 | 0.6 | 4.3 | 9.3 | 8.8 |
| Greece | — | — | — | 0.2 | 0.8 | 6.2 | 7 | |||
| Canada | 0.18 | 0.28 | 0.35 | 0.58 | 0.92 | 2.2 | 3.0 | 3.5 | 6.6 | 9.4 |
| South Korea | — | 0.01 | — | — | 1 | 2.5 | 2.8 | 3.4 | — | 6 |
| United States | 0.60 | 0.72 | 0.66 | 0.90 | 1.1 | 2.1 | 1.9 | 2.2 | 4.0 | 7.7 |
| New Zealand | — | 0.1 | 0.2 | 0.6 | 1.2 | 1.9 | 2.8 | 2.8 | 3.6 | 13.0 |
| Global | 0.27 | 0.43 | 0.7 | 0.89 | 1.4 | 2.3 | 2.6 | 4.2 | 8.7 | 14 |
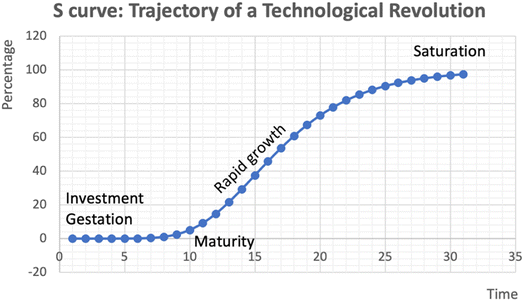
EVs represent a new technology and they are still more expensive than their ICE counterparts. Under the light of statistics, the innovation EV market growth follows an S-curve54 [Fig. 11].
The slope of the curve, representing how fast the technology is adopted, will depend on the context of each market before 100% transition is eventually achieved. The pickup is slow before an exponential growth and a slow down before saturation is eventually reached for a full transition, as in any S-curve54 characterized market penetration.
The major increase in new registrations for all countries occurs at an inflection point as if there was a form of confidence from buyers after pioneers open the game. There is then an exponential growth till a certain level before a slow down to convince the most reticent buyers. Once efficiency is proven and a solid base of trust is built, the majority of buyers will invest in what is supposed to be a new product. The last category of buyers step in at a slow pace to complete the full EV transition.
Fig. 12 shows the market evolution of some countries with a meaningful EV penetration. These markets are those with the highest cost of ICE vehicle ownership.
Fig. 12 shows the curve of growth for some markets with a meaningful EV penetration from 2013 to 2022.
The way an innovation is adopted follows a non-linear path; the first stage is slow and the second is fast before the last stage that corresponds to saturation. These curves are known as S-curves44 due to their shape.
The shape of the S-curve can be attributed to system feedback: economies of scale, social diffusion, and technological reinforcement.
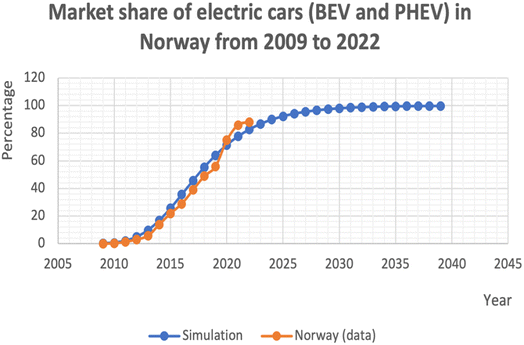
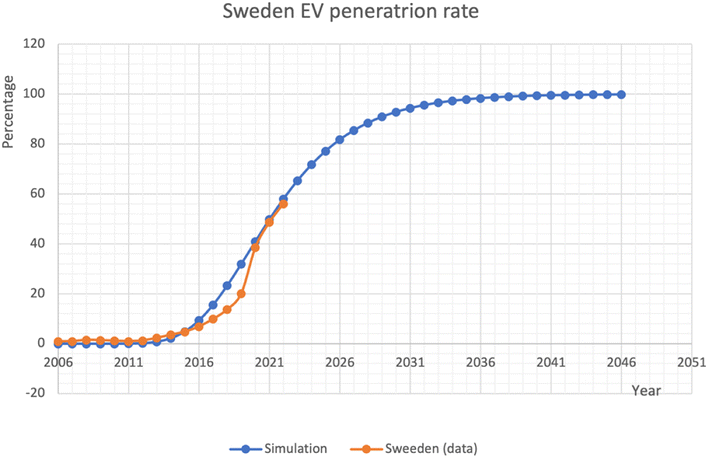
The S-curve model44 can provide a description of these markets. The curve gives the rate R(t) of market penetration of the EV against time as eqn (1) below where each market can be well represented by two output values α and k to be found by adjusting the curve R(t) with the actual data. So α and k are the outputs to be found by scanning through a range of values until the graph R(t) matches the graph obtained from actual data.
 | (1) |
Norway [Fig. 13] α = 0.29 and k = 11.
Sweden [Fig. 14] α = 0.25 and k = 30.
Global [Fig. 15] α = 0.12 and k = 11.
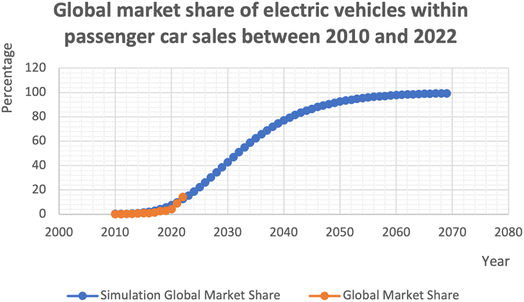 | ||
| Fig. 15 Global EV transition statistics and simulation.55 | ||
Based on these curves, it could be expected to have Norway witness a full EV transition for new registrations around 2025 [Fig. 13] and 2030 for Sweden [Fig. 14], while globally [Fig. 15] a full transition will not occur before 2050 when considering the most common types of electric vehicles: battery electric vehicles (BEVs), hybrid electric vehicles (HEVs) and plug-in hybrid electric vehicle (PHEVs).
Each market is described by a couple (α, k) that determines the time for the technology to takeoff and the slope of the S-curve that corresponds to the rapidity of growth.
3.3. Would the future of oil affect global EV market penetration?
Crude oil is beyond a mere source of energy, and it became a real strategic tool in the hands of oil producing countries (OPEC) to play major political roles on the international scene.From ICE to EVs, the dependence is switching from oil to lithium. Countries around the world develop different strategies to prepare for the EV transition. Presently, lithium earth reserves are evaluated at 88 million tons,56 and with 8 kg of lithium on average per car, there is potentially enough material to guarantee 100% EV global transition even if the demand is growing at a very high rate [Fig. 16].
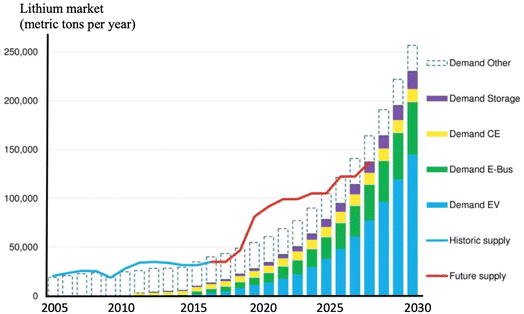 | ||
| Fig. 16 Demand for lithium57 | ||
The main questions that arise with the higher penetration of EVs and their future market domination, despite the potential of reserves, are the availability of enough lithium to build batteries on the one hand, as stated above, and on the other hand, what would be the impact of a high percentage of EVs on the oil demand and price, knowing that the global transport sector accounts for almost 50% of the current oil demand?
It is predicted that by 2025, 75% of all mined lithium will go into EVs as presented Fig. 16. Lithium reserves may not present any potential shortage but there are difficulties related to the extraction of raw materials. Lithium supply shortage may be one of the challenges that the manufacturing of EVs may face in the near term as shown Fig. 17 unless there is a technological breakthrough.
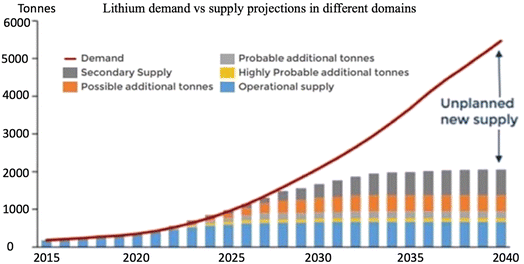 | ||
| Fig. 17 Lithium demand vs. supply forecast.58 | ||
The development of EVs will undoubtedly lead to a lower fuel demand, and oil supply will be higher than demand. In such a case, with the steady increase of EV sales, predicted to reach 54% of new registrations by 2040,58 it could be expected to have a future oil price drop due to lower demand.
Surprisingly, analysts that predict prices increase for oil, due primarily to more difficulties of oil extraction, less accessible sources that would require more important investments, and the growing demand from India and China. The direct consequence is a price increase for fuels.
It can easily be predicted then that there will be an increasing demand for EVs due to the higher price of oil.
3.4. Secondhand EV market
According to research released by AA cars, in total, almost 75% of drivers in the US, as a reference market, purchased a used car as their most recent vehicle. In most developing countries this rate goes up to almost 100%. Sales of used passenger vehicles in the US were around 38.6 million units in 2022. In 2027 the used automobile market is projected to reach over 1.5 trillion US dollars; it is a considerable increase from 1.2 trillion in 2020, and it corresponds to a growth of 3.2% across 7 years. These statistics show that a successful EV transition should necessarily include a dynamic secondhand market. Nevertheless, presently, the secondhand EV market faces two main problems: the rapid depreciation of EVs and battery capacity loss that results in a shorter range. Obviously, these two problems are related. Incentives that bring EV prices down are part of the reasons why used EV prices decline. As new EVs are affordable due to subsidies, demand for used EVs decreases as well as prices. In addition, there may be an important disparity in interest rates that can be higher for used cars than for new vehicles. The height of the coronavirus 19 disease (COVID-19) was an unusual period; due to factories lower activity there was a shortage of new cars, and demand on the used market drove prices up.Based on a Cox Automotive study, EV owners perceive that EV batteries last about seven years on average, after that period there is a sensitive range drop. The odometer only is not enough to understand the state of health (SOH)59 of the battery, and a certain number of other parameters come into play in the battery life of an EV: manufacturing variances, operation conditions such as the cooling system, and charging conditions such as fast or slow charging. The challenge is working out how much charge is still available after a certain period of operation. The best guarantee of good knowledge of the battery health is by getting a diagnostic from the onboard diagnostics port of the EV. While 90–95% of the original capacity is acceptable, below 80% should raise some worries. Tesla claims about 90% of capacity left after 200![[thin space (1/6-em)]](https://www.rsc.org/images/entities/char_2009.gif) 000 miles of use on models S and X, which may not be accurate based on drivers' opinion. No other manufacturer has made a report of such good battery and management qualities. Such a claim is beyond expectations. The reality for most manufacturers is 2 to 3% of capacity loss per year and even worst when fast charging is used, one of the worst stresses on a battery.
000 miles of use on models S and X, which may not be accurate based on drivers' opinion. No other manufacturer has made a report of such good battery and management qualities. Such a claim is beyond expectations. The reality for most manufacturers is 2 to 3% of capacity loss per year and even worst when fast charging is used, one of the worst stresses on a battery.
The secondhand market is presently indeed a major issue in EV technology in contrary to ICE vehicles. Almost all EV drivers buy their vehicles new and generally incentives apply exclusively to new EVs, as a replacement of an ICE vehicle or as their first vehicle. Despite the remarkable performance of EVs and their competitiveness, they show some limits compared to ICE vehicles as presented above. It is reported that the depreciation of EVs is over 50% of their original value within the first three years of ownership compared to less than 40% for ICE vehicles. Due to the high price of premium EVs such a depreciation corresponds to a loss of thousands of dollars for the original owner. EV prices fall further down compared to their ICE counterparts; meanwhile the EV premium can be over $10000 higher, and this gives more importance to their value loss. The depreciation of EVs is also about a question of demand and supply. It was common to be on a waiting list to purchase an EV, while presently EV makers can keep up with the demand. A third point is related to the battery lifespan as stated above. In fact, due to the battery technology limitations, buyers wonder if it is worth buying a secondhand EV as the range on a single charge may be much shorter than for a new car.60
In the current state of technology, the battery does not outlast the vehicle. Satisfying such criteria would have been a turning point in the development of the second-hand EV market.
Fig. 18 below shows the average capacity loss of an EV battery with the time of use with the average range dropped to about 80% after about 6 years of operation while considering 3% capacity loss per year and after about 10 years when 2% capacity loss per year is considered61 for the most common chemistries used in EVs: NMC or LFP.
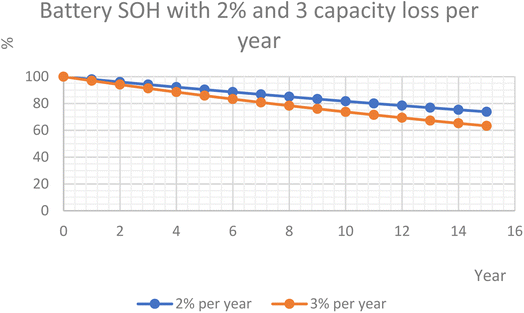 | ||
| Fig. 18 Average EV battery degradation with time.61 | ||
An ecological EV transition will necessarily go with a sustainable secondhand vehicle market, and the conditions for such a market have so far been missing. It should as well be noted that EV transition in developing countries will most likely strongly depend on a secondhand vehicles market as it is already the case with ICE vehicles.
It is very likely that the concept of secondhand cars as known with ICE vehicles will be replaced with that of refurbished vehicles with a serviced battery and updated software.
The secondhand EV market is a good argument to illustrate the need to build batteries with better performance, longer lifespan, slower degradation rate and less susceptibility to fast charging.
5 Conclusion
The development of Li-ion batteries has been the main tool to achieve the successful penetration of EVs in our societies, but they as well remain the main threat to possibly limit the expansion of EVs. Li-ion batteries will need to have higher energy density to match the current standard ICE cars, and they should allow faster charging without compromising their lifespan, and they should have lower cost to make EVs more affordable and competitive compared to their ICE counterparts. More research and development will be needed to produce the battery for a global and sustainable EV transition, for acquisition, operation and recycling of batteries.In the present situation, some countries seem to be in more favorable situation for a successful EV transition. It is the case of Norway and Iceland, due to their geography, energy policies and obviously their economies that besides subsidies can guarantee affordability to their populations. In some other countries opting for EVs is still a luxury and the transition looks to be not realistic in a near future.
The approach of subsidies has certainly been proven efficient to get the market started but in the longer run, local policies should be able to prepare a more favorable context without subsidies.
The main driver of the EV market is primarily cost before environmental convictions. Strong willed governments consequently have policies designed to deliver technically performant EVs to buyers at a lower cost or a cost comparable to ICE vehicles and make available a dense network of public charging infrastructures. Such a situation is favorable when the cost of ICE vehicle ownership is high and when subsidies are consistent, and in both cases the transition to EVs corresponds to saving money. The cost of EVs and range are the other main drivers attracting car owners to EVs when charging infrastructures are available. The cost of EVs and range mainly depend on the cost and performance of the battery. It can then be expected that when Li-ion battery prices considerably drop the adoption of EVs will be wider. Governments' policies may include an important battery development approach to reduce its cost. The development of sodium-ion batteries (Na-ion) is promising to substantially drop battery cost without losing performance, so it is for the development of solid-state batteries.
The diffusion of EVs obeys the S-curve that allowed the extraction of parameters α and k specific to each country and prediction of the period to reach 100% EV transition.
Oil dependence is changing to lithium dependence with the demand surpassing already the supply due to the EV industry.
The present state of EV battery technology and subsidies are the main barriers hampering the development of a meaningful secondhand EV market.
Conflicts of interest
There are no conflicts of interest to declare.References
- The car drive, https://www.thedrive.com/guides-and-gear/how-many-cars-are-there-in-the-world.
- International Institute for Sustainable Development https://www.iisd.org/articles/deep-dive/canada-can-expect-declining-oil-demand.
- J. Verma and S. Goel, State-of-the-art in bioresources for sustainable transportation, Int. J. Hydrogen Energy, 2023, 48, 3768e3790, DOI:10.1016/j.ijhydene.2022.10.206.
- J. Verma and D. Kumar, Metal-ion batteries for electric vehicles: current state of the technology, issues and future perspectives, Nanoscale Adv., 2021, 3, 3384, 10.1039/d1na00214g.
- H. Cooper, S. Brauer, and D. A. Kalowb, Battery Energy Storage in Stationary Applications, Special Edition-Battery Energy Storage, 2020, Retrieved March 31, 2022, from, https://www.aiche.org/ Search PubMed.
- K. Cheng, Y. Zou, X. Xin and S. Gong, Optimal Lane expansion model for a battery electric vehicle transportation network considering range anxiety and demand uncertainty, J. Cleaner Prod., 2020, 276, 124198, DOI:10.1016/j.jclepro.2020.124198.
- B. Diouf and R. Pode, The Potential of Lithium-ion batteries in renewable energy, Renewable Energy, 2015, 76, 375–380, DOI:10.1016/j.renene.2014.11.058.
- International Energy Agency, https://www.iea.org/news/demand-for-electric-cars-is-booming-with-sales-expected-to-leap-35-this-year-after-a-record-breaking-2022#.
- US Department of Energy, https://theconversation.com/oil-price-shocks-have-a-long-history-but-todays-situation-may-be-the-most-complex-ever-178861.
- https://about.bnef.com/blog/electric-vehicle-sales-to-fall-18-in-2020-but-long-term-prospects-remain-undimmed/ .
- Data Force, https://www.dataforce.de/en/news/incentives-electric-cars-2023/.
- Kia Seoul, South Korea.
- Mc Kinsey, https://www.mckinsey.com/industries/automotive-and-assembly/our-insights/battery-2030-resilient-sustainable-and-circular.
- D. Rizopoulos and D. Esztergár-Kiss, A Method for the Optimization of Daily Activity Chains Including Electric Vehicles, Energies, 2020, 13, 906, DOI:10.3390/en13040906.
- D. Greenwood, AUTOMOTIVE BATTERIES 101| Advanced Propulsion Systems, 2018, Retrieved April 13, 2021, from, https://warwick.ac.uk/fac/sci/wmg/ Search PubMed.
- L. Scot, Behind the Scenes Take on Lithium-ion Battery Prices| Bloomberg NEF, 2019, Retrieved March 31, 2022, from, https://about.bnef.com Search PubMed.
- H. Bajolle, M. Lagadic and N. Louvet, et al., The future of lithium-ion batteries: Exploring expert conceptions, market trends, and price scenarios, Energy Res. Soc. Sci., 2022, 93, 102850, DOI:10.1016/j.erss.2022.102850.
- https://www.iea.org/reports/global-ev-outlook-2023/trends-in-batteries .
- https://www.afr.com/wealth/investing/lithium-prices-to-keep-rising-as-demand-outpaces-supply-20230508-p5d6m3 .
- R. Lindsay, Why Lithium-Ion Batteries are the Future of UPS Energy Storage for Data Centers and Colocation Facilities, | Data Center Frontier Special Report Series (n.d.), 2018, Retrieved November 1, 2021, from https://datacenterfrontier.com/white-paper Search PubMed.
- V. Gupta, R. Kumar and B. K. Panigrahi, User-Willingness-Based Decentralized EV Charging Management in Multiaggregator Scheduling, IEEE Trans. Ind. Appl., 2020, 56, 5704–5715, DOI:10.1109/TIA.2020.2993988.
- H. M. Abdullah, A. Gastli and L. Ben-Brahim, Reinforcement Learning Based EV Charging Management Systems—A Review, IEEE Access, 2021, 9, 41506–41531, DOI:10.1109/ACCESS.2021.3064354.
- S. Manzetti and F. Mariasiu, Electric vehicle battery technologies: From present state to future systems, Renewable Sustainable Energy Rev., 2015, 51, 1004–1012, DOI:10.1016/j.rser.2015.07.010.
- A. Fotouhi, D. J. Auger, K. Propp, S. Longo and M. Wild, A review on electric vehicle battery modelling: From Lithium-ion toward Lithium–Sulphur, Renewable Sustainable Energy Rev., 2016, 56, 1008–1021, DOI:10.1016/j.rser.2015.12.009.
- https://www.tycorun.com/blogs/news/solid-state-lithium-battery .
- A. Manthiram, X. Yu and S. Wang, Lithium battery chemistries enabled by solid-state electrolytes, Nat. Rev. Mater., 2017, 2, 16103, DOI:10.1038/natrevmats.2016.103.
- The Nikkei in December 2020.
- P. K. Koorata and S. Panchal, Thermal management of large-sized LiFePO4 pouch cell using simplified mini-channel cold plates, Appl. Therm. Eng., 2023, 234, 121286, DOI:10.1016/j.applthermaleng.2023.121286.
- G. A. Farulla, V. Palomba, D. Aloisio, G. Brunaccini, M. Ferraro, A. Andrea Frazzica and F. Sergi, Optimal design of lithium-ion battery thermal management systems based on phase change material at high current and high environmental temperature, Therm. Sci. Eng. Prog., 2023, 42, 101862, DOI:10.1016/j.tsep.2023.101862.
- H. Wu, M. Niu, Y. Shao, M. Wang, M. Li, X. Liu and Z. Li, Investigations of Li-Ion Battery Thermal Management Systems Based on Heat Pipes: A Review, ACS Omega, 2024, 9, 97–116, DOI:10.1021/acsomega.3c08056.
- M. Kiani, S. Omiddezyani, E. Houshfar, S. R. Miremadi, M. Mehdi Ashjaee and A. M. Nejad, Lithium-ion battery thermal management system with Al2O3/AgO/CuO nanofluids and phase change material, Appl. Therm. Eng., 2020, 180, 115840, DOI:10.1016/j.applthermaleng.2020.115840.
- V. Talele, U. Moralı, M.-S. Patil, S. Panchal, R. Fraser, M. Fowler, P. Thorat and Y.-P. Gokhale, Computational modelling and statistical evaluation of thermal runaway safety regime response on lithium-ion battery with different cathodic chemistry and varying ambient condition, Int. Commun. Heat Mass Transfer, 2023, 146, 106907, DOI:10.1016/j.icheatmasstransfer.2023.106907.
- A. V. Myatezh, M. A. Smirnov, B. V. Malozyomov and A. A. Shtang, Performance Increase of Lithium-Ion Batteries, Adv. Eng. Res., 2017, 133, 519–524, DOI:10.2991/aime-17.2017.84.
- Z. Sun, W. Gao, B. Li and L. Wang, Locating charging stations for electric vehicles, Transport Pol., 2020, 98, 48–54, DOI:10.1016/j.tranpol.2018.07.009.
- Q. Kong, M. Fowler, E. Entchev, H. Ribberink and R. McCallum, The Role of Charging Infrastructure in Electric Vehicle Implementation within Smart Grids, Energies, 2018, 11, 3362, DOI:10.3390/en11123362.
- https://about.bnef.com/blog/electric-vehicles-accelerate-54-new-car-sales-2040/ .
- https://www.insiderintelligence.com/chart/235386/factorsfeatures-uk-drivers-would-consider-towards-purchasing-electric-vehicle-jan-2020-of-respondents .
- IEA, Global EV Outlook, 2022 Search PubMed.
- Global Petrol Prices, https://www.globalpetrolprices.com/gasoline_prices/.
- Global Petrol Prices, https://www.globalpetrolprices.com/electricity_prices/.
- World Bank, https://data.worldbank.org/indicator/NY.GDP.PCAP.CD.
- https://wisevoter.com/country-rankings/renewable-energy-by-country/ .
- https://en.wikipedia.org/wiki/List_of_countries_by_renewable_electricity_production .
- https://yearbook.enerdata.net/renewables/renewable-in-electricity-production-share.html .
- World Bank, https://data.worldbank.org/indicator/EN.POP.DNST?locations=OE.
- World Bank, https://data.worldbank.org/indicator/SP.URB.TOTL.IN.ZS.
- https://countryeconomy.com/business/motor-vehicle-in-use .
- https://www.comparethemarket.com.au/car-insurance/features/the-most-expensive-countries-for-car-ownership/ .
- https://www.hivepower.tech/blog/electric-vehicles-evs-in-switzerland-what-you-should-know .
- https://www.reykjavikcars.com/blog/driving-iceland/electric-car-iceland .
- https://en.wikipedia.org/wiki/Iceland .
- https://www.goodnewsnetwork.org/giant-oil-companies-install-ev-chargers-at-gas-stations/ .
- https://en.wikipedia.org/wiki/Electric_car_use_by_country .
- M. Sawaguchi, Innovation activities based on s-curve analysis and patterns of technical evolution “From the standpoint of engineers, what is innovation?”, Procedia Eng., 2011, 9, 596–610, DOI:10.1016/j.proeng.2011.03.145.
- https://www.statista.com/statistics/1371599/global-ev-market-share/ .
- Washington Post, https://www.washingtonpost.com/climate-environment/2023/02/02/critical-minerals-run-out-shortage/.
- https://about.bnef.com/blog/end-sight-near-term-lithium-supply-shortages/ .
- Institutional Investor, https://www.institutionalinvestor.com/article/2bswqvt5gr58738z0fwu8/innovation/can-lithium-supply-keep-up-with-strong-ev-demand.
- J. Chen, M. Manivanan, J. Duque, P. Kollmeyer, S. Panchal, O. Gross, and A. Emadi, A Convolutional Neural Network for Estimation of Lithium-Ion Battery State-of-Health during Constant Current Operation, Conference: 2023 IEEE Transportation Electrification Conference & Expo (ITEC), Publisher IEEE, 2023, pp. 1–6 Search PubMed.
- https://www.standard.co.uk/tech/why-electric-car-prices-dropping-b1085646.html .
- https://batteryuniversity.com/article/bu-1003a-battery-aging-in-an-electric-vehicle-ev .
| This journal is © The Royal Society of Chemistry 2024 |


