 Open Access Article
Creative Commons Attribution 3.0 Unported Licence
Electroleaching and electrodeposition of silver in ethaline 1![[thin space (1/6-em)]](https://www.rsc.org/images/entities/h2_char_2009.gif) :
:![[thin space (1/6-em)]](https://www.rsc.org/images/entities/h2_char_2009.gif) 2 and propeline 1
2 and propeline 1![[thin space (1/6-em)]](https://www.rsc.org/images/entities/h2_char_2009.gif) :
:![[thin space (1/6-em)]](https://www.rsc.org/images/entities/h2_char_2009.gif) 3: transport properties and electrode phenomena†
3: transport properties and electrode phenomena†
Calogera
Bertoloni
 a,
Sophie
Legeai
 *a,
Stéphanie
Michel
 a,
Eric
Meux
 a and
François
Lapicque
 b
b
aUniversity of Lorraine, CNRS, IJL, F-57000, Metz, France. E-mail: sophie.legeai@univ-lorraine.fr
bUniversity of Lorraine, CNRS, LRGP, 54000 Nancy, France
First published on 8th May 2024
Abstract
In view of selectively recovering precious contents in electronic waste by combined electrochemical leaching and deposition step in the same cell, this study presents electrochemical investigations of the two reactions conducted in green deep eutectic solvents (DESs) for the case of silver. In addition to ethaline 1![[thin space (1/6-em)]](https://www.rsc.org/images/entities/char_2009.gif) :
:![[thin space (1/6-em)]](https://www.rsc.org/images/entities/char_2009.gif) 2 formed from choline chloride and ethylene glycol, propeline 1
2 formed from choline chloride and ethylene glycol, propeline 1![[thin space (1/6-em)]](https://www.rsc.org/images/entities/char_2009.gif) :
:![[thin space (1/6-em)]](https://www.rsc.org/images/entities/char_2009.gif) 3 with less nocive propylene glycol was tested. Determination of the density, viscosity and conductivity of the two DES depending on temperature and their water content could lead to ionicity values from 0.70 to 0.90, with a negative effect of these operating parameters. Pure silver can be leached at 1 mA cm−2 with faradaic yield near 100% from the two DES, provided sufficient temperature and water content below 5 wt%. Electrodeposition was thoroughly examined by cyclic voltammetry and amperometry at transient or steady state at a rotating electrode, leading to Ag(I) diffusivity values in the two DES. Kinetic parameters of the electrodeposition reaction, modelled as irreversible, were also estimated from cyclic voltammograms. Thick silver deposits were produced in 24 h-long tests at 60 °C and 0.25 mA cm−2 in a dry atmosphere with nearly 100% current efficiency. The deposits were formed by little coalesced regular grains of size 15–20 μm and exhibiting fair adherence.
3 with less nocive propylene glycol was tested. Determination of the density, viscosity and conductivity of the two DES depending on temperature and their water content could lead to ionicity values from 0.70 to 0.90, with a negative effect of these operating parameters. Pure silver can be leached at 1 mA cm−2 with faradaic yield near 100% from the two DES, provided sufficient temperature and water content below 5 wt%. Electrodeposition was thoroughly examined by cyclic voltammetry and amperometry at transient or steady state at a rotating electrode, leading to Ag(I) diffusivity values in the two DES. Kinetic parameters of the electrodeposition reaction, modelled as irreversible, were also estimated from cyclic voltammograms. Thick silver deposits were produced in 24 h-long tests at 60 °C and 0.25 mA cm−2 in a dry atmosphere with nearly 100% current efficiency. The deposits were formed by little coalesced regular grains of size 15–20 μm and exhibiting fair adherence.
Environmental significanceDue to the rapid development of technological objects, electronic waste (e-waste) represent an increasingly abundant and rich source of critical and precious metals. Electrometallurgy in “deep eutectic solvents” (DESs) can be considered as green alternative to conventional hazardous treatments for the recovery of precious metals. In this work, we consider the potentiality of propeline, a DES with a lower toxic nature than frequently used ethaline, for the electrometallurgy of silver. This study could serve as a reference for the electrometallurgy of other precious metals in propeline, such as gold and palladium. This work aligns with goal 9 “industry, innovation and infrastructure”, goal 12 “responsible consumption and production” and goal 13 “climate action” of UN SDGs. |
Introduction
The excessive development of new technological tools has led to the overconsumption of resources. This trend not only corresponds to the use of critical, rare, and precious metals but is also the cause of a massive amount of waste. In this area, due to their appreciable contents in precious metals, wastes from electrical and electronic equipment (WEEE) represent an important secondary resource of these metals.1,2 However, the recovery of these noble metals in conventional processes involves numerous steps with the use of powerful agents, e.g., cyanides or aqua regia, that are harmful to human health and environment. In this area, within a project funded by the French National Agency of Research (ANR), the authoring teams are working with other partners in the development of a greener process for the recovery of silver, palladium, and gold from the printed-circuit boards of cell phones. The recovery is to be conducted after the necessary stages for the removal of non-metallic materials and the beneficiation of less precious metals, e.g., copper, carried out by Terra Nova Development (TND), industrial partner of the project. This process consists of coupling in a single cell, electro-leaching (EL) of the metal concentrate produced by TND and electro-deposition (ED).3Besides, for the sake of its green character, the process has to rely on green solvents. “Deep eutectic solvents” (DESs) formed by a hydrogen bond acceptor (HBA), e.g., quaternary salts or hydrated metal chlorides and a hydrogen bond donor (HBD), exhibit attractive properties for the recycling of precious metals, having a low reactivity and volatility, making them far less noxious to the environment than corrosive liquors employed in conventional processes. Their identified stoichiometry (HBA-HBD) corresponds to a well-defined minimum in their melting point. In “Type III” DES,4 the HBD is an organic molecule. As an HBA, choline chloride (ChCl, or Ch+ Cl−) is often employed with amines as in reline, a ChCl–urea mixture, or alcohols such as ethaline (ChCl–ethylene glycol mixture). The so-called ET1:2 and ET1:3 with 2 and 3 molecules of ethylene glycol (EG) per choline chloride are the most well-known ethalines. As a matter of fact, as explained by Agieienko and Buchner,5 ET1:2 cannot be exactly considered as a DES since its stoichiometry does not correspond to a eutectic, as shown in its solid–liquid phase diagram. However, in this work, “DES” is used to name the ChCl-based phase investigated. Because of their acceptable viscosity in the range 10–100 mPa s depending on temperature, ethalines have been selected for metal deposition for higher mass transfer rates allowed. Besides, in the present project, the presence of substantial Cl− concentration in the ChCl-based DES allows the nearly complete complexation of Ag, Au and Pd dissolved species by Cl−, which facilitates their anodic leaching and prevents the undesired formation of insoluble AgCl, as in aqueous solutions. EG is nevertheless known to be harmful to humans and animals in case of repeated exposure or inhalation periods. In spite of the high boiling point of EG (197 °C), less toxic alcohols can be preferred as HBD, e.g., propylene glycol, which is used in particular in pharmaceutical and cosmetic industry. The corresponding stoichiometric blends with ChCl are called propelines, e.g., PROP1:2 and PROP1:3, with two and three propylene glycols per ChCl, respectively. Propelines with costs comparable to those of ethalines have been very recently used in electrochemistry for Ni–Mo coating6 and the anodic polishing of Ni and Co surfaces.7
This paper is related to the recovery of silver from the above metal concentrate by (anodic) electroleaching, followed by Ag electrodeposition on the cell cathode, using ethaline or propeline as the electrolyte. For this purpose, first, the physical properties of the DES were thoroughly determined, and the silver electroleaching and electrodeposition steps of the process under development were then investigated. In view of designing a pilot plant electroleaching–electrodeposition cell, accurate values for transport properties and diffusion coefficient of Ag(I) species involved in the limiting current density are required. Moreover, the main features of the two electrode reactions, e.g., current efficiency, kinetic parameters, and morphology of thick deposits, as in a plant for silver beneficiation, have to be accurately determined.
The electrodeposition of silver in ethaline has been the topic of numerous investigations, from the pioneering works of Abbott et al.8,9 In contrast, silver leaching has been seldom investigated, except by Abbott et al.10 who studied the anodic leaching of nine metals in an IL and Et1:2 and evidenced significant passivation for some of them. Dissolved monovalent silver is often considered to be in the form of AgCl2−,11 as reported in the literature. For electrodeposition in ethaline, the diffusion coefficient D of Ag(I) species has been determined by cyclic voltammetry (CV) using Randles–Sevcik equation11–15 or by chronoamperometry (CA) at a potential corresponding to mass transfer control and use of Cottrell's law.11,13–15 Besides, the examination of the current variation in CA experiments in the first seconds for the study of the nucleation-growth mechanism using Scharifker's model16 could also lead to D estimates.11,13,14 With the temperature varying from 20 to 70 °C in the various above quoted papers, Ag(I) diffusivity varied from 2.75 × 10⁻⁷ to 1.4 × 10⁻⁶ cm2 s−1 in ET1:2 for the various methods mentioned above. The fairly broad range might be due to the different electrode surface states and the interpretation method, which is not detailed in some papers. Besides, most silver deposits have been produced in tests shorter than one hour,9,11,13,15 for which their thickness was lower than one micrometer.
The present paper thus first presents the variations of transport (bulk) properties with temperature in ET1:2 and PROP1:3. This composition of propeline has been selected because it is a homogeneous liquid at ambient temperature contrary to PROP1:2, which remains partly solid at this temperature. Vast data are already available for ET1:2 in the literature, which is not the case for PROP 1![[thin space (1/6-em)]](https://www.rsc.org/images/entities/char_2009.gif) :
:![[thin space (1/6-em)]](https://www.rsc.org/images/entities/char_2009.gif) 3 as it has been scarcely studied to date. The bulk physical properties of the solvent phase considered are electrical conductivity and viscosity, depending on temperature and the water content. As a matter of fact, the DES selected exhibit an appreciable affinity to water so that they can absorb more than 10% water within one or two weeks in contact with ambient air;17,18 the consequences of this absorption will be discussed in the manuscript. Secondly, the electrochemical leaching of silver is discussed in terms of current efficiency and electrode potentials in preparative dissolution runs at a fixed current density. Then, the investigation of the electrochemical deposition of silver is presented; studies have consisted of either steady state techniques under forced convection or transient methods such as CV or CA for the determination of Ag(I) diffusivity and estimation of its kinetic parameters. Finally, long-term deposition runs at fixed current were carried out for the observation of the deposit morphology and adherence on the substrate.
3 as it has been scarcely studied to date. The bulk physical properties of the solvent phase considered are electrical conductivity and viscosity, depending on temperature and the water content. As a matter of fact, the DES selected exhibit an appreciable affinity to water so that they can absorb more than 10% water within one or two weeks in contact with ambient air;17,18 the consequences of this absorption will be discussed in the manuscript. Secondly, the electrochemical leaching of silver is discussed in terms of current efficiency and electrode potentials in preparative dissolution runs at a fixed current density. Then, the investigation of the electrochemical deposition of silver is presented; studies have consisted of either steady state techniques under forced convection or transient methods such as CV or CA for the determination of Ag(I) diffusivity and estimation of its kinetic parameters. Finally, long-term deposition runs at fixed current were carried out for the observation of the deposit morphology and adherence on the substrate.
Experimental section and methodology
Preparation and characterization of DES
DES was prepared by mixing choline chloride (C5H14ClNO, 98%, Fischer Scientific) and propylene glycol (C3H8O2, 99.5%, VWR) or ethylene glycol (C2H6O2, 98%, VWR) in a ratio of 1![[thin space (1/6-em)]](https://www.rsc.org/images/entities/char_2009.gif) :
:![[thin space (1/6-em)]](https://www.rsc.org/images/entities/char_2009.gif) 2 (ChCl
2 (ChCl![[thin space (1/6-em)]](https://www.rsc.org/images/entities/char_2009.gif) :
:![[thin space (1/6-em)]](https://www.rsc.org/images/entities/char_2009.gif) EG) and 1
EG) and 1![[thin space (1/6-em)]](https://www.rsc.org/images/entities/char_2009.gif) :
:![[thin space (1/6-em)]](https://www.rsc.org/images/entities/char_2009.gif) 3 (ChCl
3 (ChCl![[thin space (1/6-em)]](https://www.rsc.org/images/entities/char_2009.gif) :
:![[thin space (1/6-em)]](https://www.rsc.org/images/entities/char_2009.gif) PG). The mixture was heated up to 60 °C in a closed flask until a homogeneous liquid phase was obtained. No atmosphere control system was used for the preparation of the DES.
PG). The mixture was heated up to 60 °C in a closed flask until a homogeneous liquid phase was obtained. No atmosphere control system was used for the preparation of the DES.
The water content of the DES was regularly measured by Karl-Fischer coulometric titration (KF831 coulometer Metrohm). The conductivity of the various solutions was determined by electrochemical impedance spectroscopy (EIS) by analysing the response to the sinusoidal perturbation of the potential (PEIS) in the 1 MHz–10 Hz range around the rest potential. The cell employed (Radiometer) consisted of two platinum electrodes, whose cell constant was found at 1.00 cm−1 by calibration with KCl solution in the range of 1.4–13.1 mS cm−1. The accuracy of the determination was estimated to be near 2%. The viscosity measurements were carried out using a falling ball viscometer (Anton Paar AMVn). Finally, the density of the solutions was determined using the oscillating U-tube technique (Rudolph DDM 2911).
Electrochemical experiments
All electrochemical experiments (conductivity, electroleaching and electrochemical investigations) were carried out using a Biologic VSP300 potentiostat controlled by EC Lab software.In all experiments except for long term deposition tests, a three-electrode electrochemical cell connected to a thermostated bath was used in ambient air. The reference electrode (RE) was a freshly polished silver wire (ϕ ≈ 1 mm, 11.5 cm long, 99.9% Ag Thermoscientific) insulated in a salt bridge (AL120, Radiometer Analytical) filled with a 10 mM AgCl DES solution (99.997% VWR). Ag(I) solutions were prepared either by weighing a given amount of AgCl (±0.1 mg) or by the electrochemical leaching of an immersed Ag wire, followed by ICP-OES (AVIO200, PerkinElmer) analysis. RE was calibrated every day against the ferrocenium/ferrocene system (Fc+/Fc) in 1-butyl-3-methylimidazolium bis(trifluoromethyl sulfonyl)imide ionic liquid (BMIM NTf2, Iolitec) containing 10 mmol L−1 Fc.
In electroleaching tests, the working electrode (WE) and the anode was a 1 mm silver wire with an active area in the range of 1–2 cm2 immersed in a volume of DES up to 20 cm3. The counter electrode (CE, here the cathode) was a glassy carbon rod (diameter at 3 mm, Thermoscientific) separated from the anode chamber with an AL 120 salt bridge containing 5 cm3 of the DES considered; the undesired electrodeposition of the silver leached at the anode could thus be avoided. The Ag(I) content in DES solutions was determined by ICP-OES analysis after two dilution stages with first 2 mol L−1 HCl, then 1 mol L−1 HCl solutions.
For the electrochemical deposition of silver, the RE was similar to the above-described reference electrode, whereas the counter electrode was a glassy carbon half disk (10.61 cm2) and the working electrode was a 2 mm Pt disk imbedded in a 11 mm PTFE shaft: the WE was kept either motionless or rotated depending on the technique used. The silver DES solutions were prepared beforehand by Ag electroleaching to observe the electrochemical behaviour at the cathode of the anode-produced species, in view of emulating the operation of the combined electrochemical–electrodeposition steps. In all the cases, voltammetric curves were corrected for the residual current with Ag-free electrolytic solutions as well as for the ohmic drop in the solution, using the resistance value estimated by impedance spectroscopy at the open circuit potential.
Long term deposition runs were carried out in a small rectangular cell machined out of polyamide by 3-D printing. The cathode and anode were two flat parallel silver plates (30 × 30 mm2) fixed at two facing inner sides with a 30 mm gap. Insulating tape (Kapton©) limited the active area to 30 × 10 mm2. A thin silver slab pinched on the cell wall acted as the pseudo-reference electrode. All electrodes were carefully degreased and polished up 600 mesh emery paper before deposition runs. This cell was inserted in a 400 mL double walled pyrex reactor provided with a tight lid to allow runs at temperature over the ambient level. A nitrogen stream (20 sccm) was continuously injected to avoid water uptake by the DES phase from ambient air. Both the anode and cathode were weighed before the run. An electrolytic bath was prepared beforehand by dissolving silver chloride in the DES at 60 °C and had a Ag(I) content near 58 mmol L−1. The volume of the bath solution introduced of the order of 20 cm3 was determined by weighing and its Ag content was determined by ICP-OES before and after the deposition run. For the sake of more regular deposits, the temperature was fixed at 60 ± 1 °C; the extent of evaporation of the glycol in the run was checked to be below 0.2 cm3 and was thereafter neglected.
After the run was conducted at 0.25 mA cm−2 for 24 ± 1 hour, the electrodes were carefully rinsed with absolute ethanol, softly dried by sweeping paper and then dried at 40 °C before weighing. The water content in the DES solutions was found to be below 1 wt% in all the cases. The morphology of the silver deposit was characterised by SEM (VEGA3 SB, Tescan).
Methodology
 | (1) |
The molar conductivity Λmix (in S cm2 mol−1) can be calculated from the ionic conductivity κmix (in S cm−1) and the density ρmix by the following relation.
 | (2) |
The molar conductivity and the solvent viscosity are related physical parameters according to Walden's law
| Λmixηmix = constant | (3) |
 | (4) |
Two transient techniques have been employed in motionless conditions.
With cyclic voltammetry (CV), diffusivity and kinetic parameters were estimated by fitting experimental voltammograms to theoretical variations calculated using an in-house Matlab model. This model consists of solving transient (second) Fick's law for the concentration of Ag(I) depending on time t and coordinate x from the electrode surface, considering the linear variation of potential E with time and the kinetic equation considered (reversible or irreversible kinetic model) with first estimates for the model parameters.21,22 The solution methods consisted first of the part integration of the equation yielded from the three starting relations (as suggested by Oldham)23 and then numerical integration. For an irreversible process, the yielded parameters were, in addition to D, the charge transfer rate constant k0 and the charge coefficient α for Ag deposition with E scanning toward negative potentials.
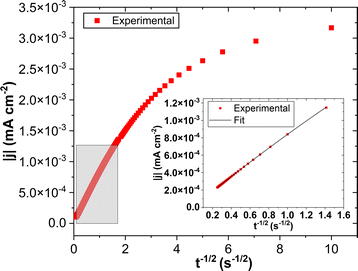
Cottrell's law (5) was used to interpret the transient current I (equal to S × i, where S is the geometrical area of the electrode) over time in chronopotentiometric runs conducted at a potential corresponding to mass control conditions, namely, 200 mV more negative from the deposition peak. Cb is the bulk concentration of Ag(I) and ne is the number of electrons involved (ne = 1). The plot of the current density versus t−1/2 led to a linear variation in the range time 0.5–15 s, after the transient in nucleation and growth of silver for t < 2 s, and before het occurrence of side-convection phenomena caused by undesired vibrations in the room environment.
 | (5) |
Besides, at steady state, Levich's law was used when the work disk electrode rotated at an angular velocity ω and at a potential corresponding to mass transport control
| jlim = 0.621·neFCbω1/2D2/3ν−1/6 | (6) |
Results and discussion
Physical (bulk) properties of the DES
Density, viscosity and ionic conductivity of the two DES were measured depending on temperature and water content. The lowest water content of the DES phases used was 0.51 wt% for ET1:2 and 0.06 wt% for PROP1:3.The density of ET1:2 decreases regularly with temperature, corresponding to a thermal expansion coefficient near 6 × 10⁻⁴ per °C, whereas the rate of decrease was slightly smaller for PROP1:3 (Fig. 1(a)). Moreover, density is slightly decreased in the presence of water owing to its lower density: this reduction is of the order of 0.005 g cm−3 for ET1:2 at 6 wt% but only near 0.003 g cm−3 for PROP1:3 with comparable water contents (Fig. 1(a)). The density values of the driest DES used were compared to reported the data for these DES with a water content below 0.1 wt%. The density of ET1:2 was measured at 1.116 and 1.108 g cm−3 at 25 and 40 °C, respectively, in excellent agreement within 0.2% with the data reported by Ferreira et al. and Gajardo-Parra et al.24,25 Comparable agreement was also observed for “dry” PROP1:3 densities found at 1.062 and 1.051 g cm−3 at 40 and 60 °C respectively.
The viscosity of the driest ET1:2 was measured at 26.6 and 14.2 mPa s at 40 and 60 °C, respectively, in good agreement with the corresponding data reported in Gajardo Parra et al.25 near 27 and 15.5 mPa s. The viscosity of PROP1:3 is larger than that of ET1:2, but this relative difference decreases from 36% at 40 °C to 20% at 60 °C (Fig. 1(b)), in accordance with Gajardo-Parra's measurements. Both DES were found to exhibit comparable decrease with the water content, being on average near 30 wt% and 5 wt% water (Fig. 1(b)).
Finally, the conductivity of the two DES regularly increases with temperature and the water content but with a significant difference between their respective variations; the conductivity of ET1:2 at 25 and 40 °C exhibits very similar variations with the water content than those of PROP1:3 at 40 and 60 °C, respectively (Fig. 1(c)).
The validity of Walden's law was investigated by plotting the variation of log(Λmix) versus log(1/ηmix), both being in CGS unit system, and comparing it to the diagonal (log(Λmix) = log(1/ηmix)). For this comparison, the viscosity has to be expressed in Poise, with the following conversion: 1 mPa s = 0.01 Poise. Some viscosity data plotted in Fig. 1 have been used in the preparation of this figure. In spite of the qualitative agreement observed for the two DES (Fig. 2), the negative deviations indicate only the partial ionicity of the solvent phases, in particular for ET1:2.
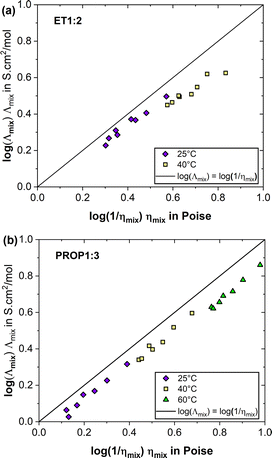 | ||
| Fig. 2 Walden's plot of the two DES for various temperatures and water contents: comparison of experimental data to the diagonal (log(Λmix) = log(1/ηmix)); (a) ET1:2, (b) PROP1:3. | ||
Moreover, the ionicity slightly decreased with temperature, passing from 0.87 to 0.70 for ET1:2 at 25 and 40 °C, respectively, and found at 0.84, 0.80 and 0.73 for PROP1:3 at 20, 40 and 60 °C, respectively. Such an influence from temperature was also reported by Pandey and Pandey for ethaline.26 This reduction could be attributed to the fragilization of hydrogen bond network in the solvent phase at higher temperature, reducing the significance of Grotthuss-type charge transfer and thus the overall conductivity. Moreover, for ET1:2, the ionicity of the medium is visibly reduced by higher water contents, which is due to the H bonds between the DES alcohol and water, as explained in.26
To conclude on this aspect, ET1:2 and PROP1:3 fairly obey phenomenologic Walden's law, with likely incomplete dissociation of the choline ions. However, care has to be taken as the above analysis is conducted only on the basis of macroscopic measurements, in particular because of the complex nature of the solvent phases.27
Electrochemical stability of the two DES
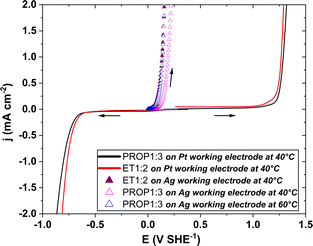
Firstly, the electrochemical stability of the two DES was studied with a close water content (near 1.5 wt%) by linear voltammetry (10 mV s−1).Fig. 3 shows the voltammogram from the rest potential first to the cathodic potentials and then back to the anodic potentials. The electrochemical window of ET1:2 and PROP1:3 was to be found very comparable, being approx. 2 V broad, in good agreement with the data published by Costa et al.28 in the case of ET1:2 and PROP1:2. The oxidation of chloride ions was observed to start from 1.27 V SHE−1,29 whereas the reduction of choline occurs from 0.80 V SHE−1.30
Electrochemical leaching of silver
The leaching of silver was first studied regardless of Ag electrodeposition in the two DES.For this purpose, the electrochemical window of pure ET1:2 and PROP1:3 has been first explored through an LSV study on a motionless Pt disk at 10 mV s−1 at 40 °C (Fig. 3, solid lines); in both DES, no visible current was observed in the range of −0.7/+1.25 V SHE−1. Then, the anodic oxidation of a silver disk has been evidenced in both DES by the same electrochemical technique; this oxidation occurs near +0.1 V, very far from the domain for side-chloride oxidation (Fig. 3, triangles). Moreover, the voltammetric curves j–E in ET1:2 at 40 °C and in PROP1:3 at 60 °C are very close to each other whereas that for PROP1:3 at 40 °C is shifted to more anodic potentials. At 1 mA cm−2, the potential in PROP1:3 at 40 °C is nearly 50 mV larger than that in this DES at 60 °C; the anodic leaching of silver appears to be facilitated by higher temperatures.
Leaching was carried out applying a current or an electrode potential so as to obtain a current density of the order of 1 mA cm−2. Leaching tests were conducted in hour-long tests to prepare Ag(I) solutions with a concentration up to 25 mmol L−1. To avoid the undesired passivation of the anode by AgCl formation, observed in preliminary tests by water excess; its content was below 3 wt% in the runs presented here. The area/volume ratio was in the range 0.1–0.25 cm2 cm−3. With ET1:2, the temperature was fixed at 40 °C, whereas tests were first carried out at 60 °C with PROP1:3 because of its high viscosity at 40 °C. The potential of the working electrode was generally observed to vary by less than 10 mV during the electro-leaching of the silver wire (Fig. SI-1†). The slight potential drift observed is likely caused by the absence of stirring in the lab cell. Chronopotentiometric tests could thus be considered nearly chronoamperometric and vice versa.
As shown by the current yields presented in Table 1, the leaching step under these operating conditions can be carried out with optimum efficiency, with the quantitative oxidation of silver and visibly in the absence of a secondary reaction, whatever the surface/volume ratio.
| Electrolyte | Method | Charge (A s) | T (°C) | E average (V SHE−1) | j average (mA cm−2) | Φ (%) gravimetry | Φ (%) ICP-OES |
|---|---|---|---|---|---|---|---|
| ET1:2 | CP | 43.37 | 40 | 0.191 | 1 | 100.26 ± 0.04 | 102 ± 4 |
| ET1:2 | CA | 43.29 | 40 | 0.188 | 1.01 | 100.46 ± 0.02 | 97 ± 8 |
| ET1:2 | CA | 12.06 | 40 | 0.215 | 0.975 | 102.21 ± 0.02 | 104 ± 4 |
| ET1:2 | CA | 26.07 | 40 | 0.194 | 1.00 | 99.89 ± 0.04 | 104 ± 1 |
| ET1:2 | CA | 52.82 | 40 | 0.187 | 1.02 | 96.64 ± 0.02 | 103 ± 1 |
| PROP1:3 | CA | 45.3 | 60 | 0.226 | 1.01 | 100.53 ± 0.03 | 101 ± 7 |
| PROP1:3 | CP | 45.76 | 60 | 0.235 | 1 | 90.1 ± 0.01 | 91.52 ± 0.02 |
| PROP1:3 | CA | 11.29 | 40 | 0.558 | 0.925 | 36.24 ± 0.08 | 59 ± 1 |
Another leaching test was carried out in PROP1:3 at 40 °C and at controlled potential; the current density was found to decrease rapidly so that the potential had to be increased by steps until 0.56 V SHE−1 or so, allowing the current density to remain fairly stable at 0.925 mA cm−2 (Table 1). The current efficiency (Φ) determined by ICP-OES was then equal to 59% (Table 1); both facts indicate the occurrence of a side reaction. The above hypothesis of the temperature effect with PROP1:3 was confirmed by observations of the anode surface after leaching by SEM. At 60 °C, the surface of the wire was rough and uneven with the formation of cavities induced by the leaching (Fig. SI-2b†). The comparable aspect of the anode surface was observed after leaching tests with ET1:2 at 40 °C (data not shown). On the contrary, with PROP1:3 at 40 °C, the formation of a solid deposit can be observed (Fig. SI-2a†). In addition, the qualitative results obtained by EDX show the significant presence of silver chloride on the surface of the Ag wire at 40 °C (Fig. SI-2c†), in contrast with the observations after the leaching test at 60 °C (Fig. SI-2d†). The formation of this AgCl passivating film explains the low leaching yield and the difference between ICP and gravimetric yield values.
Electrochemical deposition of silver: kinetics and diffusion coefficient
The electrochemical behaviour of Ag in PROP1:3 and ET1:2 leachates, with emphasis on the diffusion coefficient of the silver complex, was investigated at 40 °C by three techniques, namely, cyclic voltammetry, chronoamperometry at a fixed potential corresponding to diffusion-controlled Ag deposition, and the Levich's method using a rotating disk electrode. The water content in the DES was not larger than 4.0 wt% to avoid a very large change in the viscosity, as discussed above.Cyclic voltammetry
Potential cycling was conducted in all tests by sweeping first toward cathodic potentials. To compare the two solvents, the solutions had the same Ag(I) concentration at 25 mmol L−1 and the same water content (3.5 wt%). Tests were carried out at 20 mV s−1 and 40 °C.First CV tests revealed that successive cycles were not reproducible, with an increasing trend in the oxidation and reduction peak amplitudes, as exemplified for ET1:2 at 40 °C in Fig. 4(a). Sebastián et al.12 reported similar observations with reline 1![[thin space (1/6-em)]](https://www.rsc.org/images/entities/char_2009.gif) :
:![[thin space (1/6-em)]](https://www.rsc.org/images/entities/char_2009.gif) 2.
2.
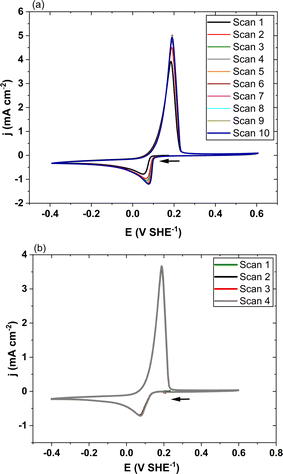 | ||
| Fig. 4 Cyclic voltammetry of the Ag/Ag(I) system in ET1:2 at 40 °C without (a) and with (b) the developed method consisting of (CV-20 min OCV) cycles. | ||
A preparation method of the electrode surface relying on successive CV scan and 20 min OCV periods was developed for the sake of repeatable and reproducible voltammograms to be obtained; as a matter of fact, the OCV phases allowed in the protocol permit replenishment in Ag(I) species in the electrode vicinity before the next CV.
The electrochemical behaviour of the Ag species present was found to be very similar for the two solvents (Fig. 5). The reduction of Ag(I) appears as a peak (Ic) at 0.12 and 0.093 V SHE−1 with ET1:2 and PROP1:3; on the reverse scan, the Ia peak at 0.188 and 0.22 V SHE−1 correspond to the oxidation of silver in ET1:2 and PROP1:3, respectively. In spite of the same Ag(I) content, the peak heights were not identical; this may be due to the higher viscosity of PROP1:3, hindering mass transfer phenomena.
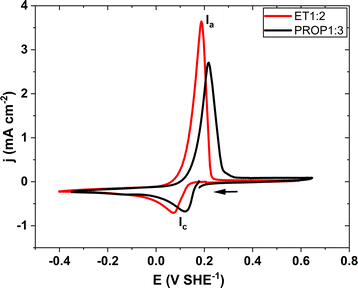 | ||
| Fig. 5 Cyclic voltammetry at 20 mV s−1 of the electro leachate of silver (25 mM) in PROP1:3 (in black) and in ET1:2 (in red) with 3.5 wt% of water content. | ||
For the further interpretation of the CV curves, the model of electrode kinetics—reversible or irreversible—had to be selected. For this purpose, CV tests have been carried out at various scan rates for 5 to 100 mV s−1 with the two DES. As shown in Fig. SI-3a,† the height of the reduction peak increases regularly with the square root of the scan rate, indicating diffusional mass transfer control of the deposition, whereas the anodic peak varied very little with this rate, corresponding more to the kinetic control of dissolution.
The potential of the reduction peak varies with the scan rate (Fig. SI-3b†); thus, the Ag–Ag(I) system cannot be considered as (Nernstian) reversible, rendering Randles–Sevcik's relation not applicable here.
An irreversible formalism for the electrodeposition kinetics was then considered
 | (7) |
The cathodic charge transfer coefficient α was also determined for comparison purpose using the relationship between variation the peak potential and the natural logarithm of the scan rate, E = f(ln![[thin space (1/6-em)]](https://www.rsc.org/images/entities/char_2009.gif) v) (Fig. SI-3b†), according to eqn (8).21
v) (Fig. SI-3b†), according to eqn (8).21
 | (8) |
Because D and k0 are lumped parameters in eqn (8), this relation has only been used for the estimation of charge transfer α from the slope of the best fitting line. α was found to be near 1.5 for the two solvents investigated.
Moreover, the treatment of the cathodic part of cyclic voltammograms by the Matlab programme led to more precise estimates for D, k0 and α.
The values for the above parameters obtained are reported in Table SI-1† for all the CV tests carried out.
In all the CV data, the very steep profile of the reduction peak directly led to such high α values. The values for this coefficient larger than 0.5 for Ag deposition were formerly reported in the literature, as by Abbott et al.11 in DES, but also other authors from aqueous complexing solutions.31,32 As in the above quoted papers, high α values might be attributable to the existence of both decomplexation of dissolved Ag(I) species to “bare” Ag+, followed by the charge transfer, leading to metal silver. In case the decomplexation is rate-controlling in the overall reduction, high α values could be expected, as for the case of hydrogen oxidation on platinum, whose rate is governed by the adsorption of the molecule prior to very fast charge transfer.33 Besides, the presence of a very high electrical field in the double layer area may cause the deformation of the electronic cloud in the complex Ag species: the (de)complexation free enthalpy would then consist of the free enthalpy difference together with an electrical term.34 In such cases, the actual charge transfer coefficient would contain an electrical contribution in addition to the regular charge transfer coefficient. The two DES employed here, with ionic strength of the order of 5 mol kg−1, are to allow very thin double layer thickness and thus high electrical fields, in which the electrical contribution be visible.
In the present study, in spite of the preliminary α estimates over unity, it has been preferred to fix α to unity in the Matlab program, although the diffusion coefficient and the charge transfer coefficient were revealed dependent on each other. More precisely, D varies with the reciprocal of alpha. This is in accordance with the expression of the peak current density in irreversible reactions.21
 | (9) |
The treatment of the set of voltammograms showed that the diffusivity of the Ag(I) complex was larger in less viscous ET1:2 than in PROP1:3, D being on average near 6.0 × 10⁻⁷ and 4.0 × 10⁻⁷ cm2 s−1, respectively. The charge transfer rate constant k0 was found to be larger for PROP1:3 than with ET1:2, at 2.2 ± 0.3 × 10⁻⁵ and 1.3 ± 0.2 × 10⁻⁵ cm s−1, respectively. The corresponding exchange current density was near 0.05 and 0.03 mA cm−2 for PROP1:3 and ET1:2, respectively, which, in addition to the α values close to unity, indicate that the reduction of the Ag(I) complex to metal Ag is a fast electrochemical process, considering the moderate concentration (25 mmol L−1) of the electroactive species.
Chronoamperometry under mass transfer control
The potential selected, as explained previously, was at −0.098 V SHE−1 for ET1:2 and −0.133 V SHE−1 for PROP1:3. The electrode surface was allowed to stabilise for 20 min at OCV before the transient measurement in order to obtain reproducible results. For the calculation of the diffusion coefficient from the current transient after Cottrell's law, the time considered was restricted to 0.5–16 s, as shown by the grey-colored area in Fig. 6.The diffusion coefficient measured in the three replicate experiments for each DES with water contents near 3.0 wt% was found to be 4.0 × 10⁻⁷ cm2 s−1 in ET1:2 and 2.8 × 10⁻⁷ cm2 s−1 in PROP1:3 owing to the higher viscosity of PROP1:3 (Table SI-1†). Sousa et al. reported the diffusion coefficient estimated by this method of about 3.8 × 10⁻⁷ cm2 s−1 in ET1:2 at 45 °C.14
Measurement of the limiting current at a rotating disk electrode
The third method was carried out at steady state using a rotating platinum disk electrode at a potential corresponding to mass transfer control, this potential selected from LSV curves at 2 mV s−1 was equal to −0.07 V SHE−1 for PROP1:3 and −0.10 V SHE−1 for ET1:2. The current was monitored at various rotation rates for 5–10 min, but only the 2 last minutes period was considered in the estimation of D using Levich's law.In this time, the current measured was shown to be a linear function of the square root of the angular velocity, as exemplified in Fig. 7. The slope of the variation led to the estimation for the diffusion coefficient of Ag(I) complex, found to be near 4.2 × 10⁻⁷ cm2 s−1 in ET1:2 and 2.9 × 10⁻⁷ cm2 s−1 in PROP1:3 (Table SI-1†).
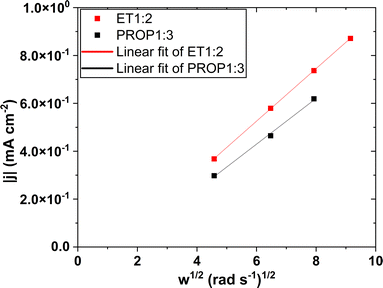 | ||
| Fig. 7 Variations of the current density of the rotating disk electrode under mass transfer control with the square root of the angular velocity ω. The solid line corresponds to Levich's law (6). | ||
Discussion on the values for Ag(I) diffusion coefficient in the two DES
Because of the significant variation of the viscosity of the two DES with the water content, for possible comparison and discussion, it has been preferred to consider the (Dη/T) group suggested by Nernst–Einstein's relationship. For each DES investigated, the data obtained using the same technique were averaged. The results shown in Fig. 8 indicate a fair accordance between the two solvents, indicating that the electroactive species diffusing to the cathode has the same nature, presumably being the complex AgCl2−.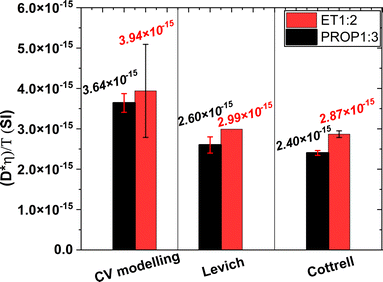 | ||
| Fig. 8 Values for (Dη/T) group in SI units obtained in the two DES at 40 °C depending on the electrochemical technique (data averaged per electrochemical technique). | ||
To conclude on this sub-section, the nature of the technique investigated was found to affect to some extent the diffusivity value, but this fact, as formerly reported by Cussler,35 is often caused by the assumptions considered in the models developed for the estimation of this property.
In particular, steady state and transient electrochemical techniques may lead to somewhat different estimations. The values for Ag(I) diffusivity in ET1:2 at 40 °C ranging from 2.8 to 6 × 10⁻⁷ cm2 s−1 are consistent to formerly published data at comparable temperature levels.11,13,14
Coupling electrochemical leaching and electrodeposition of silver
Galvanostatic deposition runs were conducted at 60 °C under stirring in the polyamide cell described above, with two facing silver plates as the working and counter electrode; silver dissolution at the anode compensated its deposition at the cathode to maintain a constant Ag(I) concentration in the bath during the 24 hours-run.In the tests presented here, the current density was at 0.25 mA cm−2, corresponding to an overall current at 0.75 mA. Taking into account the current applied and the operation time, the theoretical thickness of the Ag deposit was estimated at 22 μm, assuming 100% compactness. During the runs, the cathode potential was of the order of −20 mV vs. Ag reference, whereas that of the anode remained between 15 and 25 mV. The surface of the anode, although displaying no visible change, was carefully polished with 1000 mesh emery paper between each run.
No solid particles were observed in the cell bottom after the run, indicating sufficient adherence of the Ag deposit. The loss in the anode weight during the run was first shown to be equivalent to the weight increase of the cathode. Moreover, it corresponded within 3% to the theoretical weight amount after Faraday's law. Besides, the mole number of dissolved silver species in the cell, analysed by ICP-OES, was shown to vary by less than 2%, which further demonstrated that both Ag electroleaching and electrodeposition were carried out with a current efficiency ranging from 96 to 100%.
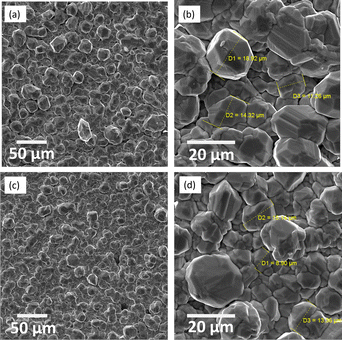
The cathode aspect, although not shiny, was very bright. As shown in Fig. 9, the metal deposited from ET1:2 and PROP1:3 consists of a compact sublayer composed of facetted metal grains, with approx. 15–20 μm and larger particles laying on the top. With the two DES tested, the silver grains were of a regular shape and homogeneous size (Fig. 9(b) and (d)). The morphology of the deposits is consistent with those presented in former works: the smaller grains size of the order of 5 μm in these works may be because of the very moderate deposition thickness.9,11,13,15 The XRD spectra of the cathode reported in the ESI (Fig. SI-4)† indicate that the solid consists of pure silver.
Conclusion
The electrochemistry of silver electroleaching and electrodeposition has been investigated in conventional ET1:2 and in greener PROP1:3. On the basis of the physicochemical properties of the two DES considered, depending on temperature and water uptake, both electrochemical steps have been studied. Silver electroleaching, a little diffusion-controlled process, can be carried out with current yields very close to 100%, provided a water content restricted to a few percent and a sufficient temperature with more viscous PROP1:3. Moreover, the use of various electrochemical techniques allowed the diffusion coefficient of the complex silver chloride to be determined, together with estimates for the kinetic parameters of the fast but irreversible electrodeposition. The preliminary deposition tests carried out at 60 °C and 0.25 mA cm−2 with the control of the atmosphere humidity showed the possible formation of 20 μm-thick deposits exhibiting a regular morphology. To conclude, the set of results reported here clearly shows that the greener PROP1:3 could successfully replace ET1:2, at least for the case of silver electrochemical reactions.More effort is being currently put on the production of thicker deposits with the optimisation of the operating conditions for the sake of regular and compact deposits to be produced with higher rates. Besides, the case of Ag electrowinning from precious metal blends (Ag, Au, Pd), as in the targeted project, will soon be investigated in the two DES in dedicated electrochemical cells for the selective recovery of the various metals contained.
Author contributions
C. Bertoloni: investigation; interpretation; writing; S. Legeai: funding acquisition; project administration; writing – review & editing; S. Michel: investigation; analysis and characterization; E. Meux: supervision – review & editing; F. Lapicque: interpretation; writing – review & editing.Conflicts of interest
All authors declare that there are no conflicts of interest in his work.Acknowledgements
The work was funded by French National Research Agency within the EE4Precious project (ANR-20 – CE08-0035-01).Notes and references
- M. Kaya, Electronic Waste and Printed Circuit Board Recycling Technologies, Springer International Publishing, Cham, 1st edn, 2019 Search PubMed.
- F. O. Ongondo, I. D. Williams and T. J. Cherrett, Waste Manage., 2011, 31, 714–730 CrossRef CAS PubMed.
- N. Leclerc, S. Legeai, M. Balva, C. Hazotte, J. Comel, F. Lapicque, E. Billy and E. Meux, Metals, 2018, 8, 556 CrossRef.
- T. Zhekenov, N. Toksanbayev, Z. Kazakbayeva, D. Shah and F. S. Mjalli, Fluid Phase Equilib., 2017, 441, 43–48 CrossRef CAS.
- V. Agieienko and R. Buchner, Phys. Chem. Chem. Phys., 2022, 24, 5265–5268 RSC.
- A. Niciejewska, A. Ajmal, M. Pawlyta, M. Marczewski and J. Winiarski, Sci. Rep., 2022, 12, 18531 CrossRef CAS PubMed.
- W. O. Karim, Electrochemistry, 2022, 90, 057005 CrossRef CAS.
- A. P. Abbott, S. Nandhra, S. Postlethwaite, E. L. Smith and K. S. Ryder, Phys. Chem. Chem. Phys., 2007, 9, 3735–3743 RSC.
- A. P. Abbott, M. Azam, K. S. Ryder and S. Saleem, Trans. IMF, 2018, 96, 297–303 CrossRef CAS.
- A. P. Abbott, G. Frisch, J. Hartley, W. O. Karim and K. S. Ryder, Prog. Nat. Sci.: Mater. Int., 2015, 25, 595–602 CrossRef CAS.
- A. P. Abbott, M. Azam, G. Frisch, J. Hartley, K. S. Ryder and S. Saleem, Phys. Chem. Chem. Phys., 2013, 15, 17314–17323 RSC.
- P. Sebastián, L. E. Botello, E. Vallés, E. Gómez, M. Palomar-Pardavé, B. R. Scharifker and J. Mostany, J. Electroanal. Chem., 2017, 793, 119–125 CrossRef.
- M. U. Ceblin, S. Zeller, B. Schick, L. A. Kibler and T. Jacob, ChemElectroChem, 2019, 6, 141–146 CrossRef CAS.
- N. G. Sousa, C. P. Sousa, O. S. Campos, P. de Lima-Neto and A. N. Correia, J. Mol. Liq., 2019, 288, 111091 CrossRef CAS.
- D. M. L. Pinheiro, L. L. Bezerra, A. A. C. Alcanfor, F. X. Feitosa, N. K. V. Monteiro, A. N. Correia, P. de Lima Neto and H. B. de Sant'Ana, J. Mol. Liq., 2023, 371, 121053 CrossRef CAS.
- B. R. Scharifker and J. Mostany, J. Electroanal. Chem. Interfacial Electrochem., 1984, 177, 13–23 CrossRef CAS.
- A. A. Kityk, Y. D. Rublova, A. Kelm, V. V. Malyshev, N. G. Bannyk and I. Flis-Kabulska, J. Electroanal. Chem., 2018, 823, 234–244 CrossRef CAS.
- Y. Chen, D. Yu, W. Chen, L. Fu and T. Mu, Phys. Chem. Chem. Phys., 2019, 21, 2601–2610 RSC.
- J.-D. Wu, Y. Ding, F. Zhu, Y. Gu, W.-W. Wang, L. Sun, B.-W. Mao and J.-W. Yan, Molecules, 2023, 28, 2300 CrossRef CAS PubMed.
- Y. Wang, W. Chen, Q. Zhao, G. Jin, Z. Xue, Y. Wang and T. Mu, Phys. Chem. Chem. Phys., 2020, 22, 25760–25768 RSC.
- A. J. Bard, L. R. Faulkner and H. S. White, Electrochemical Methods: Fundamentals and Applications, John Wiley & Sons, New York, 2nd edn, 2001 Search PubMed.
- H. H. Girault, Analytical and Physical Electrochemistry, EPFL Press, Lausanne, 2004 Search PubMed.
- K. B. Oldham, Anal. Chem., 1986, 58, 2296–2300 CrossRef CAS.
- E. S. C. Ferreira, I. V. Voroshylova, N. M. Figueiredo, C. M. Pereira and M. N. D. S. Cordeiro, J. Mol. Liq., 2020, 298, 111978 CrossRef CAS.
- N. F. Gajardo-Parra, V. P. Cotroneo-Figueroa, P. Aravena, V. Vesovic and R. I. Canales, J. Chem. Eng. Data, 2020, 65, 5581–5592 CrossRef CAS.
- A. Pandey and S. Pandey, J. Phys. Chem. B, 2014, 118, 14652–14661 CrossRef CAS PubMed.
- T. Ogawa, K. Kamiguchi, T. Tamaki, H. Imai and T. Yamaguchi, Anal. Chem., 2014, 86, 9362–9366 CrossRef CAS PubMed.
- R. Costa, M. Figueiredo, C. M. Pereira and F. Silva, Electrochim. Acta, 2010, 55, 8916–8920 CrossRef CAS.
- H. Sun, L. Yu, X. Jin, X. Hu, D. Wang and G. Z. Chen, Electrochem. Commun., 2005, 7, 685–691 CrossRef CAS.
- K. Haerens, E. Matthijs, K. Binnemans and B. V. der Bruggen, Green Chem., 2009, 11, 1357–1365 RSC.
- A. Hubin and J. Vereecken, J. Appl. Electrochem., 1994, 24, 396–403 CAS.
- I. Krastev, A. Zielonka, S. Nakabayashi and K. Inokuma, J. Appl. Electrochem., 2001, 31, 1041–1047 CrossRef CAS.
- R. F. Mann and C. P. Thurgood, J. Power Sources, 2011, 196, 4705–4713 CrossRef CAS.
- J. Besson, Précis de thermodynamique et cinétique électrochimiques, ELLIPSES, Paris, 1984, [in French] Search PubMed.
- E. L. Cussler, Diffusion: Mass Transfer in Fluid Systems, Cambridge University Press, 3rd edn, 2009 Search PubMed.
Footnote |
| † Electronic supplementary information (ESI) available. See DOI: https://doi.org/10.1039/d4va00042k |
| This journal is © The Royal Society of Chemistry 2024 |


