 Open Access Article
Creative Commons Attribution 3.0 Unported Licence
Size-segregated characteristics of bioaerosols during foggy and non-foggy days of winter, meteorological implications, and health risk assessment
Yogesh Kumar
Vishwakarma
a,
Kirpa
Ram
 b,
Mukunda Madhab
Gogoi
c,
Tirthankar
Banerjee
 b and
Ram Sharan
Singh
 *a
*a
aDepartment of Chemical Engineering & Technology, IIT (BHU), Varanasi 221005, Uttar Pradesh, India. E-mail: rssingh.che@itbhu.ac.in; Yogeshkr.vishwakarma.rs.che18@itbhu.ac.in
bInstitute of Environment and Sustainable Development (IESD), Banaras Hindu University, Varanasi, India
cSpace Physics Laboratory, Vikram Sarabhai Space Centre, Indian Space Research Organization, Trivandrum 695 022, India. E-mail: dr_mukunda@vssc.gov.in
First published on 15th July 2024
Abstract
Fog is a common atmospheric event in northern India. Frequently, dense and prolonged fog envelops the entire Indo-Gangetic Plain (IGP), especially in the winter season. During winter, conducive atmospheric conditions also facilitate the accumulation of airborne particulates near the earth surface, significantly reducing atmospheric visibility in the presence of water vapour and gases. Besides, fog formation can also change the characteristics of the biological component of the air (bioaerosols). The Anderson six-stage bioaerosol cascade impactor was therefore used to collect bioaerosols during winter-specific foggy and non-foggy days to assess how fog formation affects the loading and characteristic of bioaerosols. It has been found that the concentration of bioaerosols increases during foggy days (2223 ± 553 CFU m−3) compared to non-foggy days (days including both before and after fog; 1478 ± 490 CFU m−3). Nearly, a 50% rise in the total culturable microbe concentration was noted during foggy days as compared to non-foggy days in an urban habitat over the central IGP. Approximately 46% and 55% increase in bacterial and fungal bioaerosol concentration, respectively, was found to be associated with foggy days. The size of bioaerosols also varied with the change in atmospheric conditions. During foggy days, bacterial and fungal concentration increased in the coarse size fraction (4.7–7.0 μm) compared to fine (0.65–7.0 μm) particles. The presence of bacteria such as Bacillus; Enterobacter; Cocci and fungi such as Aspergillus, Cladosporium and Penicillium were found during foggy days. The measured concentration of bioaerosols did not exhibit strong association with meteorological variables and other atmospheric co-pollutants. Health risk assessment of the exposure to bioaerosols revealed strong possibility to cause adverse human health effects in the exposed population.
Environmental significanceThe findings of this study are novel in that the concentration range of bioaerosols in winter has been studied, which was found to increase significantly during foggy days as compared to that during non-foggy days, suggesting that bioaerosols are dominant in the atmosphere during fog. The health risk was calculated, and it shows that most of the allergic fungi and bacteria were detected and they are more likely to affect the human respiratory system and cause eye infection. The relationship of the bioaerosol concentration with meteorological parameters is also discussed. |
Introduction
Bioaerosols are aerosol particles of biological origins, consisting of bacteria, fungi, spores, and viruses. The significant portion of the bioaerosols in our environment comes from soil, surface water, plants and animals (dead or alive).1–6 Bioaerosols can be suspended in the atmosphere for a longer time and transported from one place to another.7 Their biological nature affects the air quality, human health, climate and several atmospheric processes.7–12 Since the major fraction of bioaerosols falls under the respirable range,1,2 it can add to most of the infection-related diseases in humans, especially respiratory infection-related.13,14 Therefore, researchers are paying more attention towards the study of the effect of bioaerosols on human health and atmospheric variability.Studies found that the concentration of bioaerosols varies with various meteorological factors (temperature, relative humidity, solar radiation and wind speed) in the environment. These factors can affect the residence time of the particles in the air.3,15,16 For example, temperature positively correlates with bacterial and fungal bioaerosol concentration,17,18 whereas negative correlation was seen between relative humidity and fungal bioaerosols.17 However, in a few cases, no significant correlation of RH with bioaerosol concentration was observed.19 In the aerosolization process of microbes, wind waves and rain play an important role in sending bioaerosols into the atmosphere.20–22 During fog events, human activity in the outdoor environment is adversely affected due to the loss of visibility.23,24
During the atmospheric processes, the concentration of the bioaerosols is affected due to chemical transformation (from UV radiation, gases, organics and free radicals).1,3,25 Many studies have been conducted to determine the concentration of bioaerosols during variable atmospheric conditions.26–28 Also, the correlation between airborne microbes and meteorological factors was examined; however, studies on the atmospheric environmental indices were limited. Gas, particles and other chemical components are present and are transformed in atmospheric air with airborne microbes. Since the Indo-Gangetic Plain is the hotspot of the aerosols and variable atmospheric conditions are very prominent in this region, including fog, the study of the bioaerosols during fog is very important.
Foggy days are the common weather phenomenon in the IGP during the winter, contributing to approximately 60% of the winter days from the month of December to January each year and are still increasing in the last few years.29–32 Over the last few decades, the data on ground-based surface visibility measurements, it has been concluded that the number of foggy days increases, which causes a significant loss of visibility.33,34 There is an increase in organic carbon, inorganic carbon and water solubility, which was 30% higher in foggy days, while inorganic constituents were 2–3 times higher during the foggy days compared to the non-foggy days during winter.35 Many studies in IGP show that the increasing load of pollutants, sufficient moisture, and decreasing temperature can enhance the formation of the fog,31,36 but how microbes interact during the fog is not well-known during winter.
The main aim of this study is to (1) investigate the variation in the concentration and size segregation of the bacterial and fungal bioaerosols during the foggy and non-foggy days during the winter time, (2) explore the association of the meteorological variables and pollutants to the different bioaerosols concentration during the foggy and non-foggy days, (3) finding the correlation of the bioaerosols with particulate matter, and (4) health risk assessment of the detected bioaerosols in these regions during the foggy days. This study will help to understand the bioaerosols characteristics during the various changing environmental conditions and their health effect.
Materials and methods
Sampling site
The bioaerosol samples were collected from the terrace of the Department of Chemical Engineering and Technology, IIT-BHU, Varanasi (25.15°N, 82.59°E) premises in the Indo-Gangetic Plain (IGP). The sampler was installed 10 m above the ground in the open space at the terrace to avoid the shade of buildings and trees. The surrounding of the city is dominated by vegetation, and the urban land dominates the central part of the city. No industrial activity was going on near the campus, nearly 3 km from the national highway. The winter of Varanasi city occurs from December to February, when the wind speed is found to be calm (1–2 m s−1).Sampling of bioaerosols
Air samples were collected during the foggy and non-foggy days (before and after the fog) in the winter from 2021 to 2024. Foggy and non-foggy days were distinguished on the basis of visibility where visibility <1 km is considered as fog and above 1 km is considered as non-fog or clear weather condition. The forecasts of India Meteorological Department (IMD) were used for distinguishing the foggy and non-foggy days. For the collection of the culturable bioaerosols, Anderson six-stage (Tisch Environmental, USA) viable bioaerosols sampler was used during this period. Anderson samplers consist of six different size diameters between 0.67 and 7 μm. The Petri plate consisting of different media like potato dextrose agar (Merck) for fungi and nutrient agar (Merck) for bacterial bioaerosols were prepared by the standard method and installed in each cascade. All the standard procedures were done in the biosafety chamber, and the instruments including the cascade were sterilized before use.Air sampling was conducted in foggy conditions with the impactor at the flow rate of 28.3 lpm and a duration of 20 min in each sampling. After the sample collection, the cascade was opened in the biosafety chamber, and each plate was sealed and put in the incubator for the given temperature (for fungi 35 °C for 72 h and for bacteria 25 °C for 48 h) for the optimum growth of the microbes.
Isolations and characterization
After incubation of the different plates consisting of nutrient agar and potato dextrose agar, the colonies of microbes appeared. The colonies were counted with the help of a colony counter, and the concentration of bioaerosols were measured using the formula:Total bioaerosols concentration = total no. of colonies (C′)/(flow rate × sampling duration in minutes) × 1000
This way, the concentration of the bioaerosols was measured. In each case of sampling, blanks were stored in the laminar, in which no growth (negligible) was observed. The pure culture of the microbes was isolated from the mixed culture plate. After the purification, the pure culture was obtained from the samples and were identified. Initially, samples were preidentified on the basis of their colony, colour and shapes using a light microscope and compared with the standard online description available.
For the confirmation of the samples, DNA sequencing method was performed using the following steps: (1) isolation of the genomic DNA, (2) fragment of DNA was amplified using polymerase (forward and reverse). Here, for bacteria, 5′-GGATGAGCCCGCGGCCTA-3′ (16s forward) and 5′-CGGTGTGTACAAGGCCCGG-3′ (16s reverse) were used and for fungi, 5′-TCCGTAGGTGAACCTGCGG-3′ (ITS-1 forward) and 5′-TCCTCCGCTTATTGATATGC-3′ (ITS-4 reverse) primers were used, (3) PCR product was sequenced bidirectionally and in the last step, the sequenced data were analyzed and identified to their nearest neighbour.
DNA extraction and sequencing
The sample was mixed with 1 mL of extracted buffer solution and placed on a mortar. After homogenization, the mixture was transferred to a 2 mL micro-centrifuge tube and an equal amount of phenol, chloroform and iso-amyl alcohol were added in the ratio of 25![[thin space (1/6-em)]](https://www.rsc.org/images/entities/char_2009.gif) :
:![[thin space (1/6-em)]](https://www.rsc.org/images/entities/char_2009.gif) 24
24![[thin space (1/6-em)]](https://www.rsc.org/images/entities/char_2009.gif) :
:![[thin space (1/6-em)]](https://www.rsc.org/images/entities/char_2009.gif) 1 and mixed well by shaking. The mixture was centrifuged at 14
1 and mixed well by shaking. The mixture was centrifuged at 14![[thin space (1/6-em)]](https://www.rsc.org/images/entities/char_2009.gif) 000 rpm for 15 min at room temperature. When centrifugation was completed, the upper aqueous phase was collected in a new microcentrifuge tube. This collected sample again mixed with an equal amount of chloroform and iso-amyl alcohol (in 24
000 rpm for 15 min at room temperature. When centrifugation was completed, the upper aqueous phase was collected in a new microcentrifuge tube. This collected sample again mixed with an equal amount of chloroform and iso-amyl alcohol (in 24![[thin space (1/6-em)]](https://www.rsc.org/images/entities/char_2009.gif) :
:![[thin space (1/6-em)]](https://www.rsc.org/images/entities/char_2009.gif) 1 ratio) and centrifuged at 14000 rpm for 10 min at room temperature. After centrifugation, the upper aqueous phase was collected and by adding 0.1 volume of 3 M sodium acetate (at pH 7.0) and 0.7 volume of isopropanol, the DNA of the sample was precipitated in the solution. After incubation and centrifugation at 14
1 ratio) and centrifuged at 14000 rpm for 10 min at room temperature. After centrifugation, the upper aqueous phase was collected and by adding 0.1 volume of 3 M sodium acetate (at pH 7.0) and 0.7 volume of isopropanol, the DNA of the sample was precipitated in the solution. After incubation and centrifugation at 14![[thin space (1/6-em)]](https://www.rsc.org/images/entities/char_2009.gif) 000 rpm for 15 min at 4 °C, the DNA pellets precipitated and then were washed with 70% and 100% of ethanol and dried in the air.
000 rpm for 15 min at 4 °C, the DNA pellets precipitated and then were washed with 70% and 100% of ethanol and dried in the air.
Dried DNA was dissolved in TE solution (Tris–Cl 10 mM pH 8.0, EDTA 1 mM). For purification of the DNA (to remove RNA), 5 μL of DNAse free RNAse (10 mg mL−1) was mixed. Now, extracted DNA (133 ng) and 10 pM of each primer were used for amplification purposes. The composition of TAQ Master MIX contains high-fidelity DNA polymerase, 0.5 mM dNTPs, 3.2 mM MgCl2 and PCR enzyme buffer. The sequencing mix composition and PCR conditions include 10 μL sequencing reaction, 4 μL big dye terminator ready reaction mix, 1 μL template (100 ng μL−1), 2 μL primer (10 pmol per λ) and 3 μL Milli-Q water.
During the 25 cycles of the PCR, the following process were carried out: (1) initial denaturation (at 96 °C for 5 min), (2) subsequent denaturation (at 96 °C for 30 s), (3) hybridization (at 50 °C for 30 s) and (4) elongation (at 60 °C for 1.30 min). Genetic Analyzer (ABI 3130) were used for sequencing the given strain, and the product was analyzed by System Software aligner using Phylogenetic Tree Builder for making a phylogenetic tree.37
Risk assessment
The health risk assessment of the bioaerosols was estimated by calculating the annual daily dose (ADD) by inhalation and skin contact, according to38 USEPA (1) methodology39,40 as mentioned bywhere, C is the concentration in CFU m−3, IR is the inhalation rate of air (taken as 20 for adult and 7.6 m3 per day for children), EF is the exposure frequency (taken as 60 days), ED is the lifetime exposure duration (taken as 24 h). BW is body weight (taken as 70 for adults and 20 kg for children), and AT is the average lifetime (taken 75 × 365 for adult and 12 × 365 for children). SA is the area of contact skin surface (m2) (taken as 0.2 for adult and 0.01 for children); ABS is the dermal absorption factor (m h−1) (taken as 0.001); AF is the skin adherence factor (taken as 0.07 for adult and 0.2 for children).41,42
For the subsequent risk assessment, the Hazard Quotient (HQ) and Hazard Ratio (HR) were calculated using the following equation.39,41
| and HR = ∑HQ(bacteria) + HQ(fungi) |
HQ is the exposure ratio of a substance to its reference concentration (RfC) at which no unfavourable effects are anticipated, whereas HR is the summation of HQ affecting the same target organ system. An HR value greater than one suggests increased health risk from exposed substances and vice versa. The RfC for both bacteria and fungi was taken as 500 CFU m−3.44–46
Meteorological data collection
Meteorological data were collected from the automatic weather station installed a few meters away from the sampling sites, where the data of temperature, RH, wind speed, and wind direction were collected. This weather station collects the real-time data of the atmosphere of the surrounding area. For the particulate measurements (PM10 and PM2.5) and gases concentration, data from the CPCB station in the campus were taken.Data analysis
Data analyses were done using the MS excel and Origin pro 2024 software, where the variation in the concentration was calculated during the foggy and non-foggy days of winter. The average value of the particulate matter was used in the analysis while the real time average of the other meteorological variables during the sampling was taken.Results and discussion
Variation in the concentration of the bioaerosols during foggy and non-foggy days
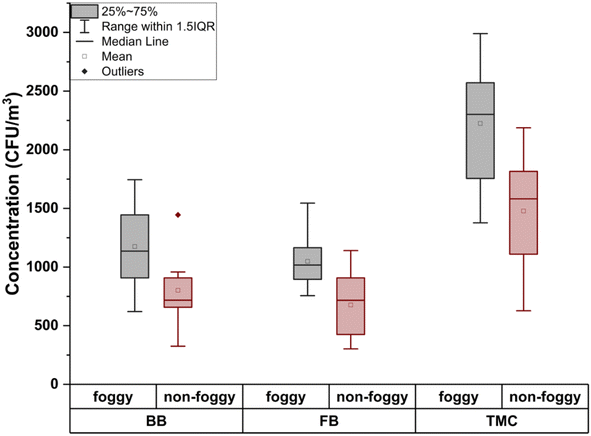
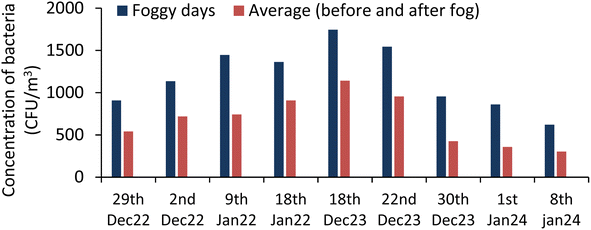
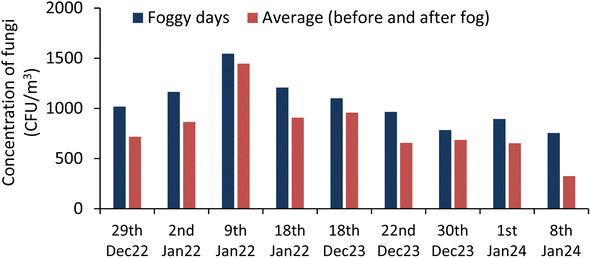
The total microbe concentration (TMC) (culturable) in the air increases during the foggy days of winter in comparison to the non-foggy days. For foggy days, the concentration of total bioaerosols (bacterial and fungal) was 2223 ± 553 CFU m−3, whereas during non-foggy days, it was 1478 ± 490 CFU m−3. This increase in the microbe concentration fraction is close to the value reported by49 Dong et al. in 2016. This finding also supports the study done by47 Saikh et al. (2023) where an increase of 36% to 48% in the bioaerosols concentration was observed during the foggy days as compared to the non-foggy days. The total bioaerosols concentration variation of different bioaerosols were plotted during the foggy and non-foggy days of winter in Fig. 1. During the 9 days' experiment on the foggy days, the following results were obtained, as plotted in Fig. 2 and 3. The concentration of the bacterial bioaerosols (BB) during foggy and non-foggy days were 1175 ± 370 CFU m−3 and 801 ± 287 CFU m−3, respectively, whereas fungal bioaerosols (FB) concentration were found to be 1048 ± 243 CFU m−3 for foggy days and 676 ± 274 CFU m−3 for non-foggy days.The mean concentration of the bacterial and fungal bioaerosols on foggy days was 1.4 times and 1.5 times more than that on non-foggy days, respectively.
Fuzzi et al.48 (1997) found that the concentration of bioaerosols significantly increases in the foggy days of winter. Since fog in the winter prevents sunlight from reaching the airborne microbes, this can prevent them from getting sterilized and increase the survival of the microbes in the air in the form of bioaerosols. Also, a higher occurrence of bioaerosols in fog is due to some favourable environmental conditions like low temperature and nutrient in the floating water droplets.25,45,48
The highest concentration of the bacterial bioaerosols during the foggy days were 1745 CFU m−3, and the lowest concentration was reported as 621 CFU m−3, whereas fungal bioaerosols concentration varied between 1545 CFU m−3 and 756 CFU m−3.
Size segregation of the various bioaerosols on foggy and non-foggy days of winter
During the foggy days, the size distribution of the bioaerosols changed in comparison to the non-foggy days, as shown in Fig. 4(a) and 5(a). During the foggy days, the concentration of the bacterial and fungal bioaerosols increases more in the coarse particle size range compared to non-foggy days. Bacterial bioaerosols concentration in the coarse size range (>7.0 to 3.3 μm) was increased about 66%, whereas 76% increased concentration was observed for fungal bioaerosols. In the finer size range (between 0.65 and 3.3 μm) of the bioaerosols, the bacterial concentration was increased by 36% and for fungi, there was a 76% increase (Fig. 4(b) and 5(b)). These findings are similar as reported in the study of49 Dong et al., where during foggy days, the major concentration of bioaerosols were found in the coarse (>3.3 μm) size range.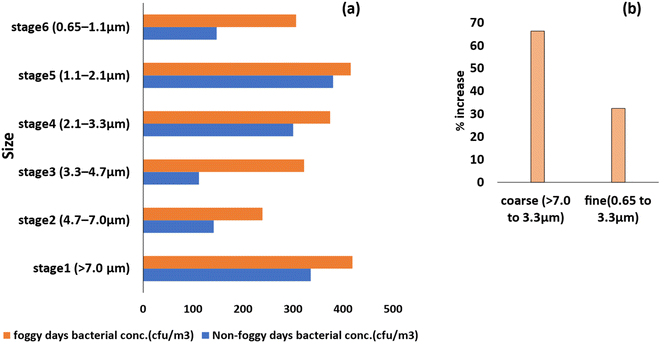 | ||
| Fig. 4 Size distribution of bacterial bioaerosols on foggy and non-foggy days (a), and percentage increase in the concentration of coarse and fine bacterial bioaerosols (b). | ||
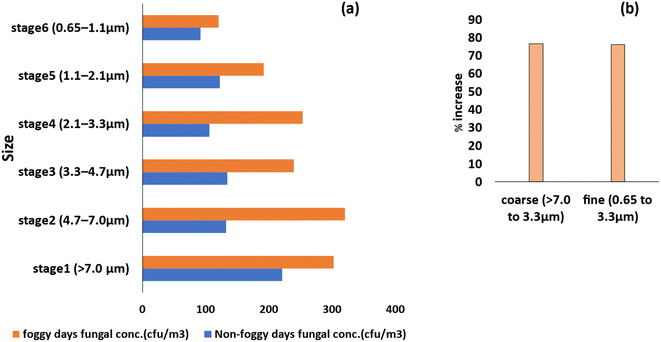 | ||
| Fig. 5 Size distribution of fungal bioaerosols on foggy and non-foggy days (a), and percentage increase in the concentration of coarse and fine fungal bioaerosols (b). | ||
However, the finer size range of bioaerosols (<3.3 μm) (both bacterial and fungal) concentration found in a significant amount cause more harm to the human health mainly in the human respiratory tract.50
From the given data, it has been observed that during winter, bacterial bioaerosols increase more in the coarse size range in comparison to fine particle size range. But the fungal size distribution was not varied much during foggy events. Relative humidity increases during the fog, and it greatly affects the survival of the bioaerosols in the atmosphere.51 Also, fog is responsible for increasing the coarse droplet in the air and these droplets tend to adhere to the microbes, therefore increasing the size of the bioaerosols. During foggy days, due to stable atmospheric stratification, the diffusion of the particulate matter is very difficult, hence increasing the load of particulate matter during foggy days.
Association of the bioaerosols with meteorological parameter during foggy days
To examine the correlation between environmental factors and culturable bioaerosols concentration, Spearman correlation analysis was determined. Fig. 6(a) and (b) shows the correlation matrix for the variables during foggy and non-foggy days, respectively. The concentration of different bioaerosols is affected with meteorological factors, including temperature, relative humidity, wind speed and concentration of the particulate matter present in the atmosphere of the region.49 Different pollutant concentrations in the environment like NO, NO2, NOx, NH3 SO2, CO and O3 also affect the bioaerosols concentration. Fig. 5 and 6 show the correlation of the meteorological parameter and particulate load with bioaerosols in the correlation matrix (p < 0.05).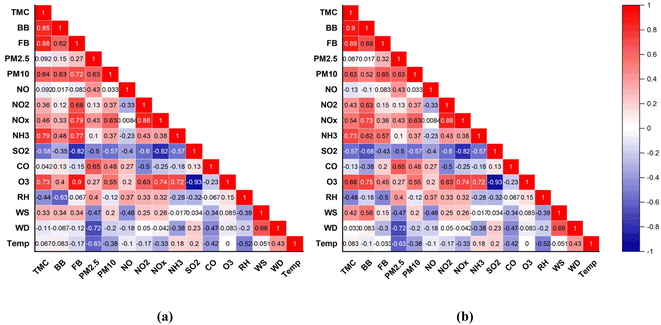 | ||
| Fig. 6 Correlation matrix for bioaerosols with different meteorological parameters and atmospheric pollutants during foggy days (a) and non-foggy days (b). | ||
In this study, during the fog, the particulate matter and meteorological parameters do not show significant correlations with bioaerosols. For example, temperature, RH, wind speed and wind direction did not show significant correlation during both foggy and non-foggy days. As the surface temperature drops, the atmospheric layer becomes more stable, and hence, the mixing of pollutants does not occur. If there was no precipitation or high velocity of wind, then this period may continue, and pollutants in the air would be hard to disperse. Hence, the concentration of particulate and associated bioaerosols would increase. According to52 Gao et al., the temperature was negatively correlated with the culturable microbes on the fine particulate but positively correlated with the coarse particulate for airborne microbes. These two results might be because of the variation in the type of culturable microbes present.
In the present study, meteorological parameters, including temperature, RH, wind speed and wind direction, show a significant correlation with bacterial and fungal bioaerosols. This least difference was most likely because of the lower variation in the related environmental parameter during foggy and non-foggy days (Fig. 7).
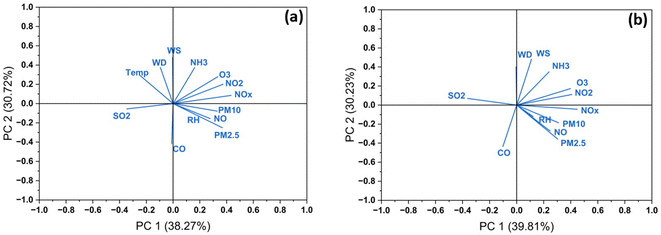 | ||
| Fig. 7 Principal component analysis (PCA) of pollutants and meteorological conditions on the concentration of bioaerosols during (a) foggy and (b) non-foggy days. | ||
Principal component analysis (PCA) was performed to determine the effect of pollutants and meteorological variables on the concentration of the bioaerosols during foggy and non-foggy days. In the PCA of pollutants and meteorological data during the foggy days, the first four components have eigenvalues greater than 1. The eigenvalues index in the data determines how effectively it summarizes the data. PM10 contributes the most in the first principal component (i.e., 0.329), followed by PM2.5 (0.368), NO (0.276) and NO2 (0.372). Since the values of the four components are positively correlated with all these variables, increasing these values increases the first component value. Additionally, these four components explain a 92.65% variation in the data; thus, these factors can decide the microbial concentration in the data. Likewise, in the non-foggy days, the first four principal components have eigenvalues greater than 1. These four components explain 93.9% variation in the data. The variables that can correlate the most with the first principal component are PM2.5 (0.303), PM10 (0.309), NO (0.247) and NO2 (0.408). The first principal component is positively correlated with these four variables, and the first four principal components explain 93.9% of the variation in the data.
Association of the bioaerosols with particulate matter during foggy days
The total microbes in the collected samples were significantly positively correlated with the particulate matter (PM2.5 and PM10) during the foggy days of the winter. In the particulate, PM10 shows a strong correlation with both bacterial and fungal bioaerosol concentrations. Similar findings were also reported by53 Pitten et al. and54 Haas et al. During the foggy days, the atmospheric conditions were quite stable; thus, vertical mixing did not occur, and the pollutants in the region could not disperse in the surroundings, resulting in the increase in the bioaerosols in the air. Moreover, some microbes were very complex, and some of them became new dominant species while changing the atmospheric conditions.55,56 Thus, the change in the community structure and accumulation of the higher concentrations of the particles may be the result of higher concentrations of the bioaerosols in the foggy days of winter.Association of gaseous pollutants with the concentration of the bioaerosols during foggy days
The total microbial count in the all six collected size ranges of the samples were significantly correlated with the SOx, NOx, CO, NH3 and O3.17 Ho et al. reported that the concentration of the fungal bioaerosols is positively correlated with SO2 and NOx. Since sulphate and nitrate in the aerosol particles were positively correlated with the microbes of the fine particle range (1.1–2.1 μm), this might be because of nitrogen and sulphur as nutrients.55 In our study, NH3 shows a positive correlation with total microbe count, which may result in NH3 acting as the nutrient for microbial growth. O3 is toxic to the microbes, and studies found that the concentration of microbes decreases with the increase in O3 concentration.4,17,57 But in our case, the significant positive correlation with the O3 to microbes in the air can be seen, which may be due to the interaction of O3 and other gases to the microbes in air. There are many discrepancies shown in the results; thus, further studies must be done to explore the mechanism of the interaction between various pollutants and microbes in the air.Characterization and possible health effects of the bioaerosols on the human health
The bioaerosol samples of the pure culture were isolated from the mixed culture plates for characterization purposes. Some of the bacterial and fungal colonies were identified from morphological analysis and visual identification. The colonies of the bioaerosols were mainly white, yellow and orange in colour. In gram staining analysis, 60–70% of the bacteria were found to be Gram-negative in nature, whereas 30–40% of the bacterial colonies were Gram-positive. Coccus and Bacillus are very dominant in the samples.Similarly, for fungi, white, black, brown and grey colour colonies were seen and identified from the literature. Some of the bioaerosols were easily identified, but for confirmation, few were identified by DNA sequencing methods. In the present work, Aspergillus, Fusarium, Periconia, Penicillium and Cladosporium were identified as the dominant fungi, whereas for bacterial bioaerosols, Bacillus, Stenotrophomonas, Acinetobacter, Enterobacter and several Cocci have shown their dominance. Some of the detected bioaerosols cause health risks to humans. For example, Periconia causes eye infection in humans, whereas Cladosporium is an allergen that mainly causes respiratory health-related problems.58–60 These bioaerosols are not only able to cause infection in humans but can also cause problems in the plant Fusarium, which is non-pathogenic for humans but can affect the growth of plants by reducing the water capacity.
Health risk assessment by exposure
The health risk assessment of the bioaerosols was done during the foggy days of winter for adults and children. The values of HQinhalation and HQskin were 6.6 × 10⁻²–4.66 × 10⁻⁸ and 5.55 × 10⁻¹–1.46 × 10⁻⁷ for adults and children, respectively. During the foggy days, the exposure risk of bioaerosols was found to be higher in children than adults. In the estimation of the health risk of bioaerosols, the higher concentration of the bioaerosols contributes to higher exposure dose, hence leading to higher health risk. This may be linked to the spatial and temporal variability of bioaerosols.61 The results of exposure risk of inhalation and skin in children are much higher than in adults; thus, this indicates that inhalation is the main cause of health risk from bioaerosol exposure and depends on the contact path. Since during the fog, many pathogenic bacterial and fungal bioaerosols were detected, and their concentration is significantly higher during winter, thus, the health risk is also higher. Apart from this, the concentration of the finer bioaerosols is higher than that of the coarse bioaerosols. Thus, it can be inhaled deep into the respiratory system of the human body and cause different types of respiratory problems.Conclusion
This study reports that the culturable bioaerosols (fungal and bacterial) concentration exceeded during the foggy days of winter compared to non-foggy days. Bacterial bioaerosol concentration was higher than the fungal bioaerosol concentration during both foggy and non-foggy days of winter. Bacterial and fungal bioaerosols were found in a ratio of 1.12 overall to the samples during the foggy days. The major portion of the bacterial bioaerosols was found in the coarse size range in comparison to the finer range. For fungi bioaerosols, no robust variation in the concentration was noted with respect to the coarse and fine range of the particles. As the PM concentration increases, an increase in the microbial concentration were observed, which may be linked to an increase in the atmospheric loading of particulates. Meteorological variables also play an important role in the transportation and survival of the concentration of bioaerosols. Our study shows a positive correlation between the NOx, NH3, and bioaerosol concentrations. Thus, the pollutant also plays an important role in the variation of the concentration of the bioaerosols, which need additional research. The concentration and the biological nature of the bioaerosols may affect the human health. From the hazard ratio, it has been estimated that during both foggy days, the exposure risk of inhalation and skin in children is much higher than adults, which indicates that inhalation is the main cause of health risk from bioaerosols exposure and children are at a greater risk. Further, bacteria show more potential adverse effects compared to fungi, as estimated by the higher hazard quotient value. In this region, bacteria such as Bacillus, Enterobacter, and Coccus were found during the foggy days of winter. In comparison, fungi, mainly Aspergillus, Cladosporium and Penicillium, were prominent during the foggy days of winter. In our study, some of the detected microbes are harmful to human health. The symptoms of respiratory issues, eye irritation and skin irritation are very common issues caused by these microbes. Therefore, additional research is required to explore the relationship between foggy weather and bioaerosols and their possible health implications.Ethical statement
All the authors declare that this study does not contain any studies with human participants or animals performed.Consent for publication
All authors have approved the manuscript and agree with submission to Environmental Science: Advances.Author contributions
Conceptualization: Yogesh Kumar Vishwakarma; methodology: Yogesh Kumar Vishwakarma; formal analysis and investigation: Yogesh Kumar Vishwakarma; writing – original draft preparation: Yogesh Kumar Vishwakarma; writing – review and editing: Yogesh Kumar Vishwakarma, Mukunda Madhab Gogoi, Kirpa Ram, Tirthanker Banerjee; funding acquisition: Ram Sharan Singh; resources: Ram Sharan Singh, Kirpa Ram; supervision: Ram Sharan Singh.Conflicts of interest
The authors declare no competing interests.Acknowledgements
The authors received financial support from the ARFI (code P-32-13) project of the ISRO-Geosphere Biosphere Programme supported by the Indian Space Research Organization, Thiruvananthapuram for their financial support. The authors acknowledge the Department of Chemical Engineering, Indian Institute of Technology (Banaras Hindu University) Varanasi, India, for providing laboratory facilities to conduct this study. And Indian Space Research Organisation (ISRO) for financial support and Central Pollution Control Board (CPCB) for data support. TB acknowledge the fund received from Banaras Hindu University under the Institute of Eminence grant (6031). KR thanks SERB for Early Career Research Award (#ECR-00490) for financial support.References
- J. Fröhlich-Nowoisky, C. J. Kampf, B. Weber, J. A. Huffman, C. Pöhlker, M. O. Andreae, N. Lang-Yona, S. M. Burrows, S. S. Gunthe, W. Elbert, H. Su, P. Hoor, E. Thines, T. Hoffmann, V. R. Després and U. Pöschl, Atmos. Res., 2016, 182, 346–376 CrossRef.
- A. D. Gupta, V. Srivastava and T. Gupta, Aerobiologia, 2021, 37, 663–680 CrossRef.
- A. M. Jones and R. M. Harrison, Sci. Total Environ., 2004, 326, 151–180 CrossRef CAS.
- W. H. Lin and C. S. Li, Aerosol Sci. Technol., 2000, 32, 359–368 CAS.
- A. J. Mohr, Fate and Transport of Microorganisms in Air, in Manual of Environmental Microbiology, American Society of Microbiology, 3rd edn, 2007, pp. 961–971, DOI:10.1128/9781555815882.ch76.
- P. C. Mouli, S. V. Mohan and S. J. Reddy, Appl. Ecol. Environ. Res., 2005, 3, 139–149 CrossRef.
- V. R. Després, J. A. Huffman, S. M. Burrows, C. Hoose, A. S. Safatov, G. Buryak, J. Fröhlich-Nowoisky, W. Elbert, M. O. Andreae, U. Pöschl and R. Jaenicke, Tellus B, 2012, 64, 15598 Search PubMed.
- W. Griffin Dale, Clin. Microbiol. Rev., 2007, 20, 459–477 CrossRef CAS.
- M. Bowers Robert, L. Lauber Christian, C. Wiedinmyer, M. Hamady, G. Hallar Anna, R. Fall, R. Knight and N. Fierer, Appl. Environ. Microbiol., 2009, 75, 5121–5130 CAS.
- U. Pöschl, S. T. Martin, B. Sinha, Q. Chen, S. S. Gunthe, J. A. Huffman, S. Borrmann, D. K. Farmer, R. M. Garland, G. Helas, J. L. Jimenez, S. M. King, A. Manzi, E. Mikhailov, T. Pauliquevis, M. D. Petters, A. J. Prenni, P. Roldin, D. Rose, J. Schneider, H. Su, S. R. Zorn, P. Artaxo and M. O. Andreae, Science, 2010, 329, 1513–1516 CrossRef PubMed.
- S. Madhwal, V. Prabhu, S. Sundriyal and V. Shridhar, India, Environ. Monit. Assess., 2020, 192, 196 CrossRef CAS PubMed.
- S. Yadav, N. Gettu, B. Swain, K. Kumari, N. Ojha and S. S. Gunthe, Environ. Sci. Pollut. Res., 2020, 27, 12802–12829 CrossRef.
- WHO guidelines for indoor air quality: dampness and mould, ed. Heseltine E. and Rosen J., 2009 Search PubMed.
- N. Hosseini, Y. Hajizadeh, M. Nikaeen and M. Hatamzadeh, Aerobiologia, 2021, 37, 105–117 CrossRef.
- M. Kowalski and J. Pastuszka, Ann. Agric. Environ. Med., 2018, 25, 259–261 CrossRef CAS PubMed.
- B. U. Lee, G. Lee and K. Joon Heo, J. Aerosol Sci., 2016, 94, 1–8 CrossRef.
- H. M. Ho, C. Y. Rao, H. H. Hsu, Y. H. Chiu, C. M Liu and H. J. Chao, Atmos. Environ., 2005, 39, 5839–5850 CAS.
- H. Salonen, C. Duchaine, M. Mazaheri, S. Clifford and L. Morawska, Atmos. Environ., 2015, 106, 412–418 CrossRef CAS.
- S. H. Hwang and J. B. Park, Atmos. Environ., 2014, 84, 289–293 CrossRef CAS.
- S. M. Burrows, W. Elbert, M. G. Lawrence and U. Pöschl, Atmos. Chem. Phys., 2009, 9, 9263–9280 CrossRef CAS.
- E. Mayol, J. M. Arrieta, M. A. Jimenez, A. Martinez-Asensio, N. Garcias-Bonet, J. Dachs, B. Gonzalez-Gaya, S. J. Royer, V. M. Benitez-Barrios, E. Fraile-Nuez and C. M. Duarte, Nat. Commun., 2017, 8, 201 CrossRef PubMed.
- M. Michalska, K. Zorena, R. Marks and P. Wąż, Sci. Rep., 2021, 11, 20959 CrossRef CAS.
- L. Hurtado, G. Rodríguez, J. Lopez, J. E. Castillo, L. Molina, M. Zavala and P. J. E. Quintana, Atmos. Environ., 2014, 1–7 Search PubMed.
- C. W. Liang, C. C. Chang and J. J. Liang, Heliyon, 2023, 9, 4 Search PubMed.
- Y. L. Pan, A. Kalume, C. Wang and J. Santarpia, J. Aerosol Sci., 2021, 155, 105767 CrossRef CAS.
- L. Dong, J. Qi, C. Shao, X. Zhong, D. Gao, W. Cao, J. Gao, R. Bai, G. Long and C. Chu, Sci. Total Environ., 2016, 541, 1011–1018 CrossRef CAS PubMed.
- Z. Xie, C. Fan, R. Lu, P. Liu, B. Wang, S. Du and Y. Li, Environ. Pollut., 2018, 243, 1930–1942 CrossRef CAS.
- L. Yang, Z. Shen, J. Wei, X. Wang, H. Xu, J. Sun and J. Cao, Sci. Total Environ., 2022, 838, 155969 CrossRef CAS PubMed.
- S. Hameed, Geophys. Res. Lett., 2000, 27, 1891–1894 CrossRef CAS.
- V. Ramanathan and M. V. Ramana, Pure Appl. Geophys., 2005, 162, 1609–1626 CrossRef.
- S. D. Ghude, Curr. Sci., 2017, 112, 767–784 CrossRef.
- R. K. Jenamani, Curr. Sci., 2007, 93, 314–322 CAS.
- A. K. Jaswal, N. Kumar, A. K. Prasad and M. Kafatos, Nat. Hazards, 2013, 68, 929–954 CrossRef.
- A. Thomas, C. Sarangi and V. P. Kanawade, Sci. Rep., 2019, 9, 1–10 Search PubMed.
- K. Ram, M. M. Sarin, A. K. Sudheer and R. Rengarajan, Aerosol Air Qual. Res., 2012, 12, 355–366 Search PubMed.
- F. S. Syed, H. Körnich and M. Tjernström, Clim. Dynam., 2012, 39, 2993–3005 Search PubMed.
- W. J. Bruno, N. D. Socci and A. L. Halpern, Mol. Biol. Evol., 2000, 17, 189–197 CrossRef CAS.
- USEPA, Human Health and Ecological Risk Assessment Support to the Development of Technical Standards for Emissions from Combustion Units Burning Hazardous Wastes, Background Document, Washington, DC, 1999 Search PubMed.
- S. Izhar, A. Goel, A. Chakraborty and T. Gupta, Chemosphere, 2016, 146, 582–590 CrossRef CAS PubMed.
- Y. Wang, B. Lai, Y. Han, L. Yang, S. Zhang, K. Yang and F. Yu, J. Clean. Prod., 2023, 419, 138301 CrossRef CAS.
- Y. Wang, S. Zhang, Q. Hong, H. Song, L. Yang, K. Yang, H. Xu and F. Yu, Ecotoxicol. Environ. Saf., 2022, 246, 114131 CrossRef CAS.
- Y. Li, Z. Hu, X. Liu, Y. Dong, Y. Wang, S. Zhang and Q. Yang, Sci. Total Environ., 2024, 934, 173096 CrossRef CAS.
- M. T. Samadi, A. H. Mahvi, M. Leili, A. Bahrami, J. Poorolajal, D. Zafari and A. Mazaheri Tehrani, J. Environ. Health Sci. Eng., 2021, 19, 1057–1067 CrossRef CAS PubMed.
- Bioaerosols: assessment and contro, ed. Macher J., American Conference of Governmental Industrial Hygienists (ACGIH), Cincinnati, Ohio, 1999 Search PubMed.
- Y. Li, W. Wang, X. Guo, T. Fu, T. Wang, H. Fu, Y. Zhao and W. Wang, Environ. Eng. Sci., 2015, 32, 273–283 CrossRef CAS.
- Y. Zhang, D. Wu, Q. Kong, A. Li, Y. Li, S. Geng, X. Dong, Y. Liu and P. Chen, Tunn. Undergr. Space Technol., 2020, 96, 103215 CrossRef.
- S. R. Saikh and S. K. Das, Appl. Environ. Microbiol., 2023, 89, e0136722, DOI:10.1128/aem.01367-22.
- S. Fuzzi, P. Mandrioli and A. Perfetto, Atmos. Environ., 1997, 31, 287–290 CrossRef CAS.
- L. Dong, J. Qi, C. Shao, X. Zhong, D. Gao, W. Cao, J. Gao, R. Bai, G. Long and C. Chu, Sci. Total Environ., 2016, 541, 1011–1018 CrossRef CAS PubMed.
- W. Wei, J. Qi, Y. Yin, J. Gong and X. Yao, Environ. Pollut., 2022, 307, 119593 CrossRef CAS PubMed.
- A. M. Jones and R. M. Harrison, Sci. Total Environ., 2004, 326, 151–180 CrossRef CAS PubMed.
- M. Gao, T. L. Qiu, R. Z. Jia, M. L. Han, Y. Song and X. M. Wang, Environ. Sci., 2014, 35, 4416–4421 Search PubMed.
- F. A. Pitten, R. Wackerow and A. Kramer, Gefahrstoffe - Reinhalt. Luft, 1999, 58, 229–231 Search PubMed.
- D. Haas, H. Galler, J. Luxner, G. Zarfel, W. Buzina, H. Friedl, E. Marth, J. Habib and F. F. Reinthaler, Atmos. Environ., 2013, 65, 215–222 CrossRef CAS.
- L. J. Wu, Microbial Community Diversity of Bioaerosols in Qingao and the Yellow Sea, Ocean University of China, 2010 Search PubMed.
- Z. Liu, J. H. Qi, L. Wang, X. J. Chen, J. H. Shi and H. W. Gao, China Environ. Sci., 2012, 32, 1422–1432 CAS.
- R. J. Delfino, R. S. Zeiger, J. M. Seltzer, D. H. Street, R. M. Matteucci, P. R. Anderson and P. Kourtrakis, Environ. Health Perspect., 1997, 105, 622–635 CrossRef CAS PubMed.
- C. H. Nakatsu, M. V. Yates, R. V. Miller and S. D. Pillai, Manual of Environmental Microbiology, Wiley, 2020 Search PubMed.
- L. D. Stetzenbach, Encycl. Microbiol., 2009, 175–182 Search PubMed.
- Environmental mycology in public health: fungi and mycotoxins risk assessment and management, ed. Viegas, C., Pinheiro, A.C., Sabino, R., Viegas, S., Brandão, J. and Veríssimo, C., Academic Press, 2015 Search PubMed.
- K. W. Shi, C. W. Wang and S. C. Jiang, Sci. Total Environ., 2018, 635, 1507–1519 CrossRef CAS.
| This journal is © The Royal Society of Chemistry 2024 |


