 Open Access Article
Dioxins in the Arctic: local sources vs. long-range transport†
Ling
Gou
a,
Shijie
Song
a,
Tao
Huang
 *a,
Zaili
Ling
b,
Kaijie
Chen
c,
Jiayi
Xin
a,
Enze
Geng
a,
Jiaxin
Wang
a,
Yuan
Zhao
a,
Hong
Gao
a and
Jianmin
Ma
c
aKey Laboratory for Environmental Pollution Simulation and Control, College of Earth and Environmental Sciences, Lanzhou University, Lanzhou 730000, Gansu Province, P. R. China. E-mail: huangt@lzu.edu.cn
bCollege of Agricultural and Forestry Economics & Management, Lanzhou University of Finance and Economics, Lanzhou 730101, P. R. China
cLaboratory for Earth Surface Processes, College of Urban and Environmental Sciences, Peking University, Beijing, 100871, P. R. China
First published on 22nd August 2024
Abstract
With a unique geographical location and a fragile ecological environment, the Arctic has been a major concern of contamination by persistent organic pollutants (POPs), such as dioxins, also termed polychlorinated dibenzo-p-dioxins and dibenzofurans (PCDD/Fs) due to their high toxicity. Under the influence of global warming, increasing wildfires have occurred in northern territories of the Northern Hemisphere (NH) in the recent decade. Given the proximity of these natural sources, the Arctic is likely subject to growing risks of local and nearby wildfire emissions of POPs. By implementing an updated global PCDD/Fs atmospheric emission inventory from 2011 to 2020 into an atmospheric transport model, we quantitatively assessed the PCDD/Fs pollution in the Arctic atmosphere. We explored the impact of wildfire combustion on PCDD/Fs pollution in the Arctic atmosphere and evaluated the relative significance of local and remote emissions from wildfire and anthropogenic sources. The results revealed that PCDD/Fs emissions from wildfire sources played an increasingly important role in PCDD/Fs pollution in the Arctic, contributing to about 70% of PCDD/Fs concentrations in Arctic air in 2020. Within the Arctic circle, wildfire emissions have also exceeded anthropogenic emissions since the late 2010s. This study provides data support for further assessment of wildfires' impact on the Arctic region's ecological environment and valuable information for assessing the effectiveness of PCDD/Fs (and other POPs) emission control.
Environmental significanceUnprecedented forest fires in the northern territory occurring in recent years under global warming pose new challenges to effectively eliminate POP pollution in the Arctic. For those toxic chemicals emitted from anthropogenic and natural sources, how and to what extent their cycling in the Arctic could be disturbed by local and distant wildfire and anthropogenic sources under climate warming is poorly understood. This study quantifies contributions of wildfires and anthropogenic emissions within and away from the Arctic circle to dioxin pollution in the polar region. The results demonstrate that dioxins released from wildfires in the Arctic have overwhelmed distant and anthropogenic sources since 2018. This finding provides insights in support of POP elimination strategies. |
1. Introduction
The Arctic has been considered a final sink of persistent organic pollutants (POPs).1,2 Under rapid Arctic amplification and global climate change,3–6 POP cycling in the polar region and transport pathways from low latitudes to the Arctic have been subject to remarkable changes,7–15 posing new risks to the ecological environment and biological health of the Arctic region.16,17 Anthropogenic emissions from mid-latitudes are usually considered a significant source of Arctic pollution.18,19 In recent years, increasing forest biomass combustion has raised more concerns due to the connections between wildfires and carbon and air pollutant emissions. Indeed, unprecedented forest fires in the northern boreal forests since 2018 have been reported to release vast amounts of carbon and toxic chemicals.19–22 The growing risks of toxic chemicals in the Arctic from wildfire emissions have led to the Arctic Monitoring and Assessment Programme (AMAP) assessment of long-range transport vs. local sources for persistent toxic chemicals (https://pops.amap.no). This study is a case study contributing to this assessment.Among those chemicals released from vegetation combustion, PCDD/Fs or dioxins are a class of tricyclic compounds with a total of 210 species, including 75 chlorinated diphenyl dioxins and 135 chlorinated dibenzofurans.23,24 Depending on the sources, PCDD/Fs in the environment can be divided into two categories, the unintentional byproducts of human industrial processes,25–29 and the products of natural events (such as forest fires and volcanic eruptions).30,31 Owing to their properties of persistence, long-range transport potential, bioaccumulation, and toxicity,31,32 PCDD/Fs became one of the first POPs to be banned, restricted, and controlled in the Stockholm convention.33,34 Like other POPs, once produced and released into the air, dioxins will not only jeopardize the environment and organisms near the source areas but also affect other areas far from the source areas, even the pristine polar region.7,35,36 Previous studies have explored PCDD/Fs contamination in sediments and animals.10,37,38 However, the pollution levels, primary sources, and transport pathways of PCDD/Fs in the Arctic atmospheric still need to be clarified under a global warming scenario. In particular, if and to what extent increasing wildfires in northern territories in recent years could drive changes in the contamination and source–receptor relationships in the Arctic is poorly understood.
With improved industrial techniques and the implementation of control measures, global anthropogenic emissions of PCDD/Fs dropped from 48.8 kg TEQ in 2002 to 36.2 kg TEQ in 2018.39 However, such a declining trend was partly offset by growing PCDD/Fs emissions from natural sources, of which wildfire biomass burning was reported to be the most important natural source, accounting for about 70% of the total global biomass combustion.40,41 Recent studies have revealed that emissions caused by wildfire biomass burning, which cannot be effectively controlled, have been playing a more critical role in the emissions of carbon and air pollutants under global warming.42–44 It is expected that, along with the continuous decline of anthropogenic emissions, the contribution of wildfire biomass burning to global PCDD/Fs pollution will become more and more significant, notably in high-latitude regions where the frequencies and strength of wildfires have been rising compared to low latitudes, such as Africa where the wildfire frequencies have been declining in the past decade.22,43
This study aims to provide modeling evidence and thorough assessments of the contribution of local and distant sources to toxic chemicals released from both natural and anthropogenic sources in the Arctic, thereby responding to the increasing concerns about their emissions from biomass burning, taking dioxins as an example. We first updated the PCDD/Fs emission inventory by recalculating the PCDD/Fs emissions from wildfire biomass burning using a bottom-up approach.21,22 We then implemented this inventory into a global atmospheric transport model, the Canadian Model for Environmental Transport of Organochlorine Pesticides (CanMETOP),45 to simulate PCDD/Fs air concentration distribution in the Arctic from 2011 to 2020. Multiple emission scenario model simulations were performed to identify the impacts of local and distant emissions from wildfires and anthropogenic sources on Arctic PCDD/Fs pollution. The main objectives of this study are to clarify the PCDD/Fs concentration distributions in the Arctic air, identify the primary sources of PCDD/Fs contamination over the Arctic, assess atmospheric transport routes from source areas to the Arctic and the seasonal and annual characteristics in the source–receptor relationships, and quantify the contributions of wildfire-induced PCDD/Fs. The results may help fill knowledge gaps in understanding the sources and transport pathways of PCDD/Fs pollution in the Arctic and motivate the development of effective mitigation strategies.
2. Materials and methods
2.1 Emission inventory
Two updated gridded global emission inventories have been released recently, one extending from 2002 to 2018 (ref. 39) and the other spanning from 1970 to 2018 (Emissions Database for Global Atmospheric Research, EDGAR v6.0, https://edgar.jrc.ec.europa.eu/dataset_pop60). Both inventories consider dioxin emissions from multiple sectors, but EDGAR v6.0 does not include emissions from wildfire burning. Based on Song et al.,39 the study further updated the gridded global PCDD/Fs emission inventory from anthropogenic sources. In addition, following Song et al.,22 we also developed a gridded global PCDD/Fs emission inventory from wildfire biomass burning, including grassland and forest fires. The construction of PCDDF/s emissions is briefly described in ESI (ESI, text S1†). The PCDD/Fs emissions from wildfire biomass burning in the NH are illustrated in Fig. S1.† While wildfire emissions from grasslands and forests have almost identical spatial distribution patterns, annual and seasonal forest fire-induced emissions are orders of magnitude higher than grassland fire-induced emissions and almost entirely dominate wildfire emissions in the Arctic (Fig. S2 and S3†). An interesting change in wildfire emissions (natural sources) and the emissions from other sectors (primarily anthropogenic sources) is the switching of significant sources from anthropogenic emissions to wildfire emissions in 2018 (Fig. S4†). Although vegetation cover across the Arctic has only a small portion of arctic land, wildfire emissions have overwhelmed emissions from anthropogenic sources (Fig. S5†). It is worth noting that Fig. S3a† shows higher PCDD/Fs emissions in winter months in the NH. Although summer wildfires in the northern territory have been increasing, wildfires in the entire NH declined in the past two decades.22,43 According to the MCD64CMQ data (https://lpdaac.usgs.gov/products/mcd64a1v006/), most active fires in the NH occur in tropical Africa and South and Southeastern Asia, accounting for 78% of the total area burned during 2001–2020. Given that winter is the dry season, wildfires in tropical Africa and Southern and Southeastern Asia occur mostly during the wintertime. In the summer monsoon and rainy season, wildfires seldom occur in these tropical regions, resulting in low PCDD/Fs emissions across the NH.2.2 CanMETOP
The CanMETOP model simulated PCDD/Fs concentration levels in the Arctic atmosphere and the globe. The CanMETOP model is a three-dimensional atmospheric transport model of persistent organic pollutants, coupled with water–air exchange and soil–gas exchange modules,45 which has been widely used in assessing POPs' environmental behaviors, source and sink relationship, and climate change impact.46–48 The model adopts different numerical algorithms to solve the atmospheric diffusion equation and other processes in multiple environmental media, including air, water, sediments, and soil. The CanMETOP can be resolved on regional and global scales depending on the size of the study area. In this study, we used a global scale version of the CanMETOP at a horizontal resolution of 1° × 1° (latitude/longitude) and 14 vertical levels of 0, 1.5, 3.9, 10, 100, 350, 700, 1200, 2000, 3000, 5000, 7000, 9000, and 11![[thin space (1/6-em)]](https://www.rsc.org/images/entities/char_2009.gif) 000 m. The meteorological data and topographic data for the model run were collected from the National Center for Environmental Prediction of the Final Run Global Analysis Data Set (https://rda.ucar.edu/datasets/ds083.2) and the Canadian Meteorological Centre, respectively, and their spatial resolution was adjusted to 1° × 1° (latitude/longitude). The physicochemical property parameters of the pollutants were also input into the model as the initial operating conditions. The physicochemical properties of 17 dioxin homologs used in this simulation were obtained from Song et al.39 More details of the CanMETOP can be found in Ma et al.45 and Huang et al.49
000 m. The meteorological data and topographic data for the model run were collected from the National Center for Environmental Prediction of the Final Run Global Analysis Data Set (https://rda.ucar.edu/datasets/ds083.2) and the Canadian Meteorological Centre, respectively, and their spatial resolution was adjusted to 1° × 1° (latitude/longitude). The physicochemical property parameters of the pollutants were also input into the model as the initial operating conditions. The physicochemical properties of 17 dioxin homologs used in this simulation were obtained from Song et al.39 More details of the CanMETOP can be found in Ma et al.45 and Huang et al.49
2.3 Model scenarios
We set five simulation scenarios to assess the relative contribution of local sources and long-range transportation to PCDD/Fs contamination in the Arctic. The first scenario, the BASE scenario (S1), included global emissions encompassing anthropogenic emissions and wildfire biomass burning. The result was used to validate the performance of the model. The second scenario only considered emissions within the Arctic circle (north of 66.5° N), referred to as the local source (S2); the third scenario included all emissions across the NH except for the Arctic region (S3). The S2 and S3 scenarios were designed to discern the contribution of local and remote sources to PCDD/Fs contamination in the Arctic. Considering the increasing frequencies of wildfires, particularly across the northern boreal forests in recent years under global warming,50,51 we also estimated the impact of wildfire biomass burning inside and outside the Arctic circle on PCDD/Fs air contamination across the Arctic. Two additional model scenarios were set up by accounting for PCDD/Fs wildfire emissions in the Arctic only (scenario S4) and the emissions in the NH except for the Arctic region (scenario S5), respectively.2.4 Model validation
The PCDD/Fs modeling results from all global sources were validated against the available measurements for 2011–2020. Measurement data were collected primarily from the European Monitoring and Evaluation Programme (EMEP, https://ebas.nilu.no) and the literature (ESI Data 1†). It is worth noting that the measured data are mostly annual, monthly, and daily mean or accumulated air concentrations, whereas the simulated PCDD/Fs levels are toxic equivalent concentrations. Therefore, the measured concentrations were converted into toxic equivalent concentrations according to the toxic equivalent factors of PCDD/Fs before the comparisons.52 Fig. S6† presents the simulated and observed PCDD/Fs atmospheric concentrations with the TEQ unit. The correlation coefficient between modeled and measured air concentrations was 0.3 (p < 0.001). The simulated atmospheric concentrations of PCDD/Fs were within the same magnitude range as the observed values, and the normalized mean bias (NMB) between the modeled and measured data was – 9%, indicating the agreement between modeled and measured PCDD/Fs air concentrations. We also compared the site-specific changes in the simulated and measured PCDD/Fs air concentrations at the four monitoring sites, Birkenes, Aspvreten, Rao, and Norunda Stenen (Fig. S7†). The model overestimated the PCDD/Fs concentrations compared to the measured concentrations. However, the monthly trend of the simulated concentrations matched the observed values well, again indicating the good performance of the CanMETOP model in the PCDD/Fs environmental cycling.2.5 Uncertainty analysis
The PCDD/Fs concentrations predicted by the CanMETOP model are subject to disturbance by uncertainties from input variables, including PCDD/Fs emissions, physicochemical properties, meteorological conditions, and model representations of physical and chemical processes such as deposition and vertical transport. We employed a first-order error propagation approach to examine the model uncertainty.49,53 This approach estimates the sensitivity of output (predicted) variables to input variables. Only those input variables that may significantly perturbate modeling results were examined, and the results were represented by a confidence factor (CF) spanning the 95% confidence interval. The CF for PCDD/Fs emissions from anthropogenic sources was 1.8–1.9.39 Based on Song et al.,22 the CF for PCDD/Fs emissions from wildfire biomass burning estimated in this study was 1.6–1.8. Moreover, the CF for the physicochemical properties of PCDD/Fs was from the literature.39,54 Finally, we estimated that the overall uncertainty in model-simulated PCDD/Fs air concentrations from 2011 to 2020 was 1.9–3.3.3. Results and discussion
3.1 Modeled PCDD/Fs atmospheric concentrations in the Arctic
Fig. 1 shows the spatial distribution of the modeled annually averaged PCDD/Fs air concentrations at the 1.5 m height above the ground surface, averaged over the Arctic from 2011 to 2020. The annually averaged PCDD/Fs concentration over the Arctic ranged from 8 × 10⁻⁸ fg TEQ m−3 to 7.6 fg TEQ m−3, with a mean concentration of 0.052 fg TEQ m−3. The model results show similar spatial patterns with PCDD/Fs emissions and present a pronounced concentration gradient from the Arctic circle to the North pole. The similarity in the spatial distributions of PCDD/Fs concentrations and the PCDD/Fs emission inventory is expected. The areas with high concentrations can be identified as areas extending from Alaska to the Arctic Archipelago and Siberia. To facilitate discussions, we defined the three sub-Arctic regions as the Asian Arctic (50° E to 180° E), the European Arctic (30° W to 50° E), and the North American Arctic (180° W to 30° W).55 Our study indicates that the Asian Arctic experienced the highest levels of PCDD/Fs contamination, with an average concentration of 0.1 fg TEQ m−3, followed by the European Arctic (0.04 fg TEQ m−3) and North American Arctic (0.02 fg TEQ m−3), respectively.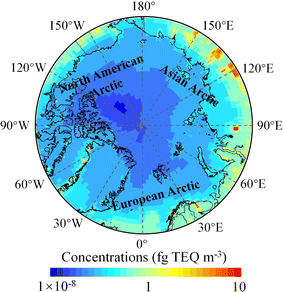 | ||
| Fig. 1 Spatial distribution of modeled annually averaged PCDD/Fs air concentration across the Arctic (north of 66.5 °N), averaged from 2011 to 2020, subject to all PCDD/Fs emission sources. | ||
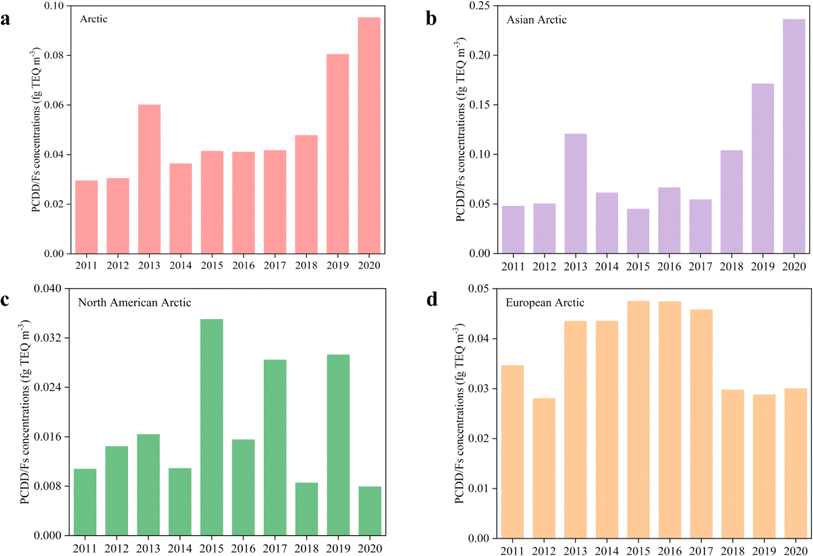
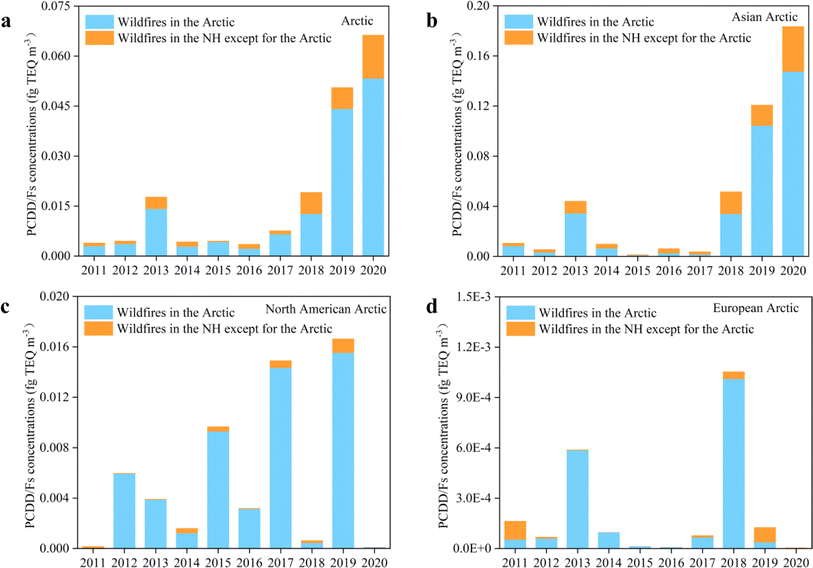
Fig. 2 depicts the temporal trend of annual mean total PCDD/Fs air concentrations in the Arctic from 2011 to 2020. Our results reveal that the PCDD/Fs concentrations in the Arctic exhibited an increasing trend from 0.03 fg TEQ m−3 in 2011 to 0.09 fg TEQ m−3 in 2020 (Fig. 2a). The Arctic has been considered a pristine region away from anthropogenic emissions. Air pollutants in the Arctic have been attributed to long-range atmospheric and oceanic transport from their sources in the low- and mid-latitudes.56 A concern has been raised under growing wildfires due to global warming, particularly across the northern boreal forests (NBF), given the proximity to the Arctic of the NBF. Recent studies have proved that forest fires contributed considerably to increasing POPs' environmental contamination in the Arctic and high-latitude northern territories.2,21,57 Song et al.39 demonstrated that the declining trend of PCDD/Fs globally over the past decades ceased in the early 2010s due partly to the increasing wildfire emissions. Significantly high concentrations over the entire Arctic occurred in 2019 and 2020 (Fig. 2a), agreeing, to a large extent, with concentration fluctuations in the Asian Arctic (Fig. 2b). Likewise, remarkably rising PAHs in the Arctic in 2019 and 2020 were reported. Luo et al.21 have attributed surge enhancement of PAH levels to unprecedented forest fires in 2019 and 2020 in the NBF, most notably in the Russian NBF, which explained, to a large extent, the similarities of annual PCDD/Fs concentration fluctuations between the entire Arctic and Asian Arctic. As shown in Fig. 2, the annual PCDD/Fs concentrations in 2019 and 2020 in the Asian Arctic were one order of magnitude higher than those in the North American Arctic (Fig. 2c) and the European Arctic (Fig. 2d), indicating the dominance of the Asian Arctic PCDD/Fs over the entire Arctic.
The seasonal variations in PCDD/Fs concentrations in the Arctic averaged from 2011 to 2020 are presented in Fig. 3. Although modeled PCDD/Fs concentrations occurred throughout all seasons, the highest levels were seen in the summer (June, July, and August), during which the Asian Arctic was a significant source. This again implies that summer wildfires across the Russian NBF have predominantly determined the PCDD/Fs pollution in the Arctic over the past decade. The summer PCDD/Fs concentrations also overwhelmed its spring and autumn levels, but in the winter, the seasonal PCDD/Fs concentration ranked first (0.06 fg TEQ m−3). Given that the variation of anthropogenic emissions was modest, seasonal differences in modeled mean atmospheric concentrations of PCDD/Fs were mainly determined by emissions from wildfire sources. In summer, higher temperatures and increased frequency of lightning strikes lead to increased frequency and intensity of extreme wildfires,50 which explains the highest mean atmospheric concentration of PCDD/Fs in the Arctic in the summer.
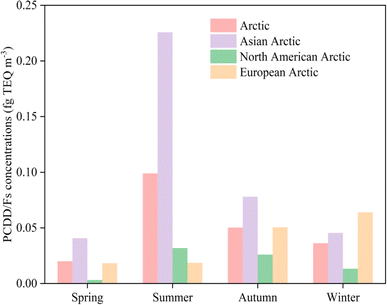 | ||
| Fig. 3 Seasonal mean PCDD/Fs air concentrations from 2011 to 2020 subject to all PCDD/Fs emission sources in the Arctic. | ||
3.2 Local source vs. long-range transport
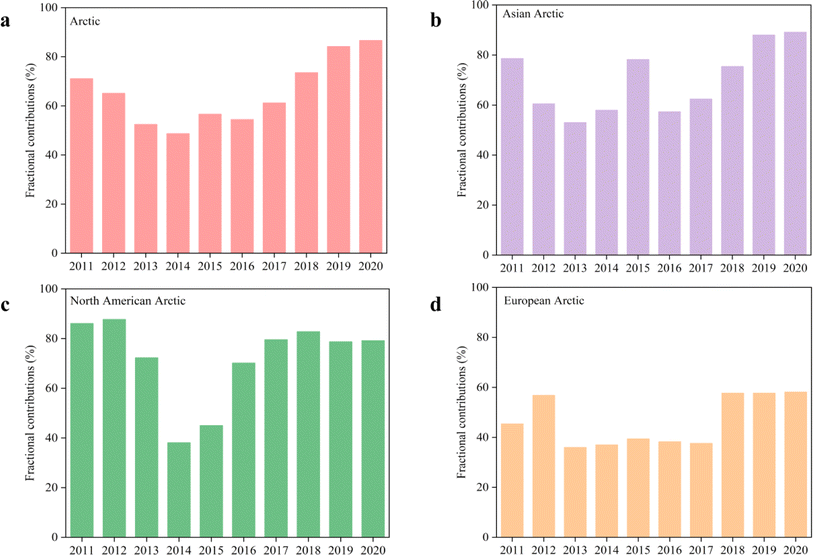
Source proximity is a significant factor contributing to pollution in a sink region. However, due to sparse anthropogenic sources in the Arctic, distant sources often raise more concerns; for a persistent organic pollutant like PCDD/Fs, Arctic amplification, global warming-induced forest fires, and re-volatilization from secondary terrestrial sources may play increasing roles in its evolution in the Arctic. Although some of these issues have been raised before,46,56 the contribution of local and distant sources to the Arctic POP contamination is worth further exploring, subject to rapid warming and growing wildfires. We utilized a source tagging technology to estimate the contributions of local (the north of 66.5° N) and distant sources (outside the Arctic circle) on PCDD/Fs atmospheric concentrations in the Arctic. Fig. 4 depicts the fractional contributions of local source emissions between 2011 and 2020 to the annual mean atmospheric concentrations of PCDD/Fs in the Arctic and three sub-Arctic regions. The results indicate that local-source emissions contributed up to 65.4% to the annual mean atmospheric PCDD/Fs concentrations over the Arctic. The highest annual average contribution from local sources in the three sub-Arctic regions can be discerned in the North American Arctic at approximately 72.0%, followed by 70.1% in the Asian Arctic and 46.4% in the European Arctic respectively. The results suggest that more local emissions impact PCDD/Fs pollution in the Arctic than remote emissions. The contributions of the local emissions to PCDD/Fs pollution over the entire Arctic did not follow monotonically the increasing Arctic warming trend for the past decade but instead decreased from 2011 to 2014 and increased after that. The result implies that the secondary emissions from historically accumulated dioxins in the terrestrial environment and cryosphere were not significant sources.56On the other hand, increasing PCDD/Fs levels after 2017 indicate that local sources contributed to increasing PCDD/Fs pollution in the Arctic. These local sources included an extended fraction of the NBF (Fig. S1b†) and anthropogenic emissions from shipping, transportation, and other human activities in the Arctic. We also noticed that the fractional contributions of local sources to the annual variation of PCDD/Fs in the Asian Arctic agreed reasonably well with the case in the entire Arctic. However, the fractional contributions of local sources in the European and North American Arctic to PCDD/Fs pollution from all (local and distant) sources do not follow annual fluctuations in PCDD/Fs fractional contributions in the Arctic. The results further demonstrate that local emissions in the Asian Arctic play a vital role in dioxin contamination over the Arctic.
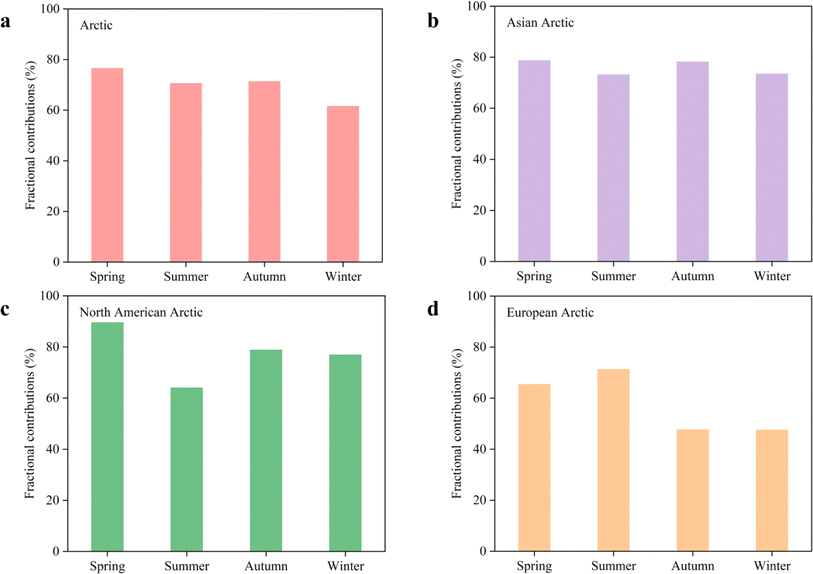
The seasonal variation of the contribution from local emissions to Arctic PCDD/Fs atmospheric concentration is presented in Fig. 5. In the entire Arctic region, the most significant contribution of local emissions occurred in spring (76.5%), followed by autumn (71.3%), summer (70.7%), and winter (61.5%). The seasonal changes in the contribution of local emissions to the three sub-Arctic regions were not identical. The highest contribution of PCDD/Fs local-source emissions to the atmospheric concentrations in the Asian and North American Arctic was identified in spring, accounting for 78.7% and 89.5%, respectively. However, the contribution of PCDD/Fs local emissions to the atmospheric concentrations in the European Arctic was the highest in summer (71.3%). Surprisingly, we did not observe a more substantial contribution from local emissions in the summer season across the Arctic regions, except for the European Arctic, during which the re-volatilization and human activities should have been the strongest. It is thus deduced that secondary and anthropogenic emissions are likely not significant sources. This may pose a question: What is the largest local source of PCDD/Fs in the Arctic during the past decade?
3.3 Contribution of wildfire emission to PCDD/Fs air concentrations in the Arctic
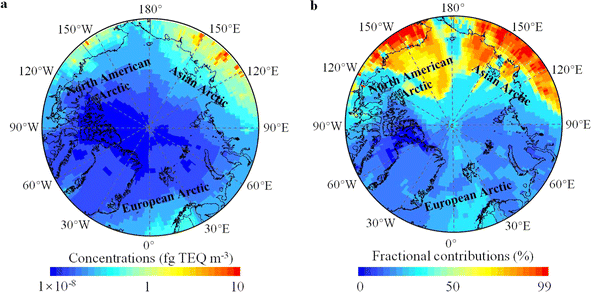
To answer the above question, we further assess the contribution of wildfire biomass burning to Arctic PCDD/Fs pollution by running the CanMETOP under model scenarios 4 and 5. Fig. 6a shows the PCDD/Fs atmospheric concentrations averaged from 2011 to 2020 at the 1.5 m height above the surface subject to wildfire biomass burning emissions in the NH (scenario 4 + scenario 5). The annual averaged daily PCDD/Fs air concentrations in the Arctic from wildfire emissions ranged from 3.7 × 10⁻⁹ fg TEQ m−3 to 6.85 fg TEQ m−3, with the mean concentration of 0.016 fg TEQ m−3, which approximately accounts for 31.7% of the predicted average concentration resulting from all sources in the Arctic. Comparing Fig. 6a to Fig. 1, the spatial distributions of PCDD/Fs atmospheric concentrations from all sources and wildfire biomass burning exhibited some similarities, confirming the dominance of wildfire emissions in Arctic dioxin pollution. Our results show that wildfires resulted in the most severe dioxin pollution in the Asian Arctic, followed by the North American Arctic, corresponding to the most frequent wildfires in the NBF across Siberia and North American high latitudes. Modeled mean atmospheric concentrations of PCDD/Fs from wildfires were 0.036 fg TEQ m−3 in the Asian Arctic, 0.007 fg TEQ m−3 in the North American Arctic, and 0.0005 fg TEQ m−3 in the European Arctic, respectively. The contribution of emissions from wildfire sources to the annual PCDD/Fs air concentrations from all sources in the Arctic from 2011 to 2020 is depicted in Fig. 6b. Overall, wildfire emissions contributed about 37.2% to the PCDD/Fs concentrations from all sources over the Asian Arctic, 36.3% to the American Arctic, and 1.4% to the European Arctic, respectively. The result agrees with the NBF distribution and occurrence of forest fires in the Asian and North American Arctic (Siberian and Alaska) in the past decade.58The annual mean PCDD/Fs concentrations in the Arctic subject to wildfire emissions from 2011 to 2020 are shown in Fig. 7. In the Arctic region, the annual PCDD/Fs concentrations caused by wildfire emissions were relatively low from 2011 to 2017 in the Arctic and Asian Arctic, though an abruptly rising concentration in 2013 (Fig. 7a and b). Wildfire emission-induced concentrations increased rapidly from 2018, reaching a peak in 2020 over the entire Arctic and Asian Arctic. However, such annual changes did not occur in the North American and European Arctic (Fig. 7c and d), where the highest concentrations sourced from wildfire emissions occurred in 2019 and 2018, respectively. As also noticed from Fig. 7, local emissions from wildfires dominated PCDD/Fs contamination across all Arctic regions. A comparison of the magnitudes of modeled concentrations in the three sub-Arctic regions indicates that the local emissions from forest fires in the Asian Arctic made the most significant contribution to Arctic dioxin pollution, where the modeled annual concentrations were one and two orders of magnitude higher than those in the North American and European Arctic. Within these two sub-Arctic regions, wildfires from boreal forests were very low in 2020 (MCD64CMQ, https://lpdaac.usgs.gov/products/mcd64a1v006/), resulting in significantly lower annual PCDD/Fs concentrations from Arctic local wildfire emissions compared to the Asian Arctic (Fig. 7b).
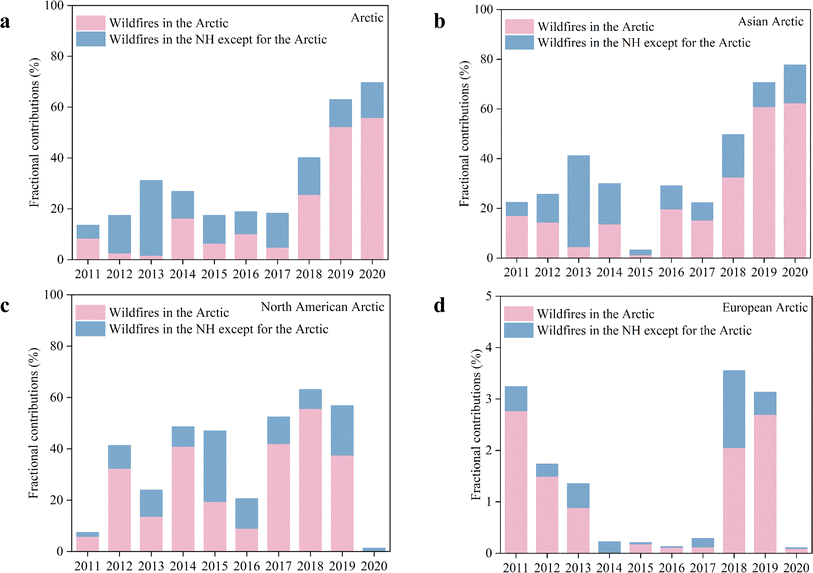
The annual contributions of NH wildfire emissions to PCDD/Fs pollution across the Arctic are illustrated in Fig. 8. Again, we can observe similarities in the annual fluctuations of wildfire-driven PCDD/Fs between the entire and Asian Arctic (Fig. 8a and b), implying the dominant role of Asian Arctic dioxin pollution in the entire Arctic. Significant changes have occurred since 2018. The contribution of wildfire emissions to annual PCDD/Fs concentrations surged from 13.6% in 2011 to 62.9% in 2019 and 69.6% in 2020, wherein, local wildfire emissions contributed 55.8% to annual PCDD/Fs concentrations in 2020. Likewise, the annual contribution of PCDD/Fs emissions induced by wildfire to its levels in the North American Arctic region reached 63.1% in 2018 but dropped to almost zero in 2020 (Fig. 8c).
In contrast, the annual contributions of PCDD/Fs emission from wildfires in the European Arctic were less than 5% overall, suggesting that wildfires were not significant sources in this part of the Arctic (Fig. 8d). Extensive investigations of wildfires and associated emissions of greenhouse gases and air pollutants have been conducted in recent several years as responses of the scientific communities to the rapidly increasing fire area, frequency, and severity, which have been considered the highest in the past 10![[thin space (1/6-em)]](https://www.rsc.org/images/entities/char_2009.gif) 000 years subject to climate warming,59,60 particularly in the Arctic and northern territories where temperatures increased much faster than the rest of the NH. In our case, the most significant contribution of wildfire emissions to PCDD/Fs levels in 2020 across the Arctic coincided with the recorded high temperatures in the polar region.
000 years subject to climate warming,59,60 particularly in the Arctic and northern territories where temperatures increased much faster than the rest of the NH. In our case, the most significant contribution of wildfire emissions to PCDD/Fs levels in 2020 across the Arctic coincided with the recorded high temperatures in the polar region.
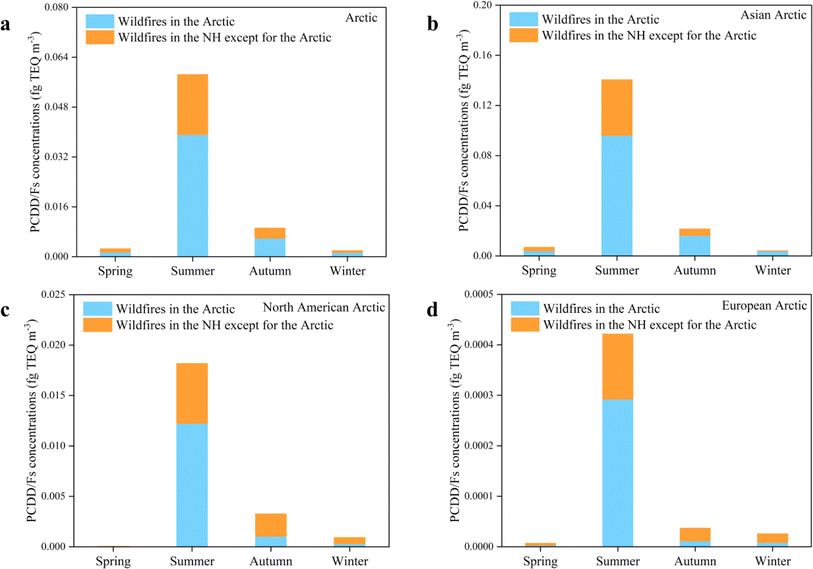
Fig. 9 illustrates the seasonal PCDD/Fs concentrations sourced from wildfire emissions averaged from 2011 and 2020 over the Arctic. The highest concentrations were modeled in the summertime in all sub-Arctic regions, aligning with wildfire occurrences and frequencies. Similar to annual concentrations from 2011 to 2020 in Fig. 7, the summer PCDD/Fs concentrations in the Asian Arctic were one and two orders of magnitude greater than those in the North American and European Arctic. Remote wildfire emissions also dominate summer pollution across the Arctic. Fig. S8† shows that, from 2011 to 2020, the highest mean contribution from wildfire sources to PCDD/Fs pollution in the Arctic occurred in summer (77.1%), followed by autumn (21.4%) and spring (14.0%). In summer, wildfire biomass burning contributed 84.2% and 81.9% to the total atmospheric PCDD/Fs concentrations in the Asian and North American Arctic, respectively. Wildfire emissions also contributed a small portion of PCDD/Fs pollution, likely due to some distant wildfire emissions in the mid-low latitudes. Fig. S8c and d† show that remote wildfire emissions also contributed significantly to dioxin contamination in the North American and European Arctic in the autumn and winter seasons. Previous modeling evidence has revealed that Central and South American and African wildfire biomass burning provided some inputs of POPs into the Arctic,43,61 mainly via an anticyclonic atmospheric circulation along the Bermuda-Azores High and the storm tracks along the European coast.
4. Conclusions
Using the new global PCDD/Fs emission inventory with updated wildfire emissions from 2011 to 2020, based on MODIS combustion area and carbon storage data, this study performed multiple emission scenario modeling to simulate PCDD/Fs atmospheric concentrations over the Arctic. Fig. 10 summarizes the contributions of local and distant sources from anthropogenic activities and wildfires to PCDD/Fs contamination in the Arctic in 2011 and 2020, respectively. As shown, in 2011, the local anthropogenic emission within the Arctic circle made the most significant contribution at 62.7% to PCDD/Fs pollution, followed by its distant emissions away from the Arctic across the NH. Local wildfire emissions only contributed 8.4%. Ten years later, in 2020, however, the local wildfire sources in the polar region dominated PCDD/Fs pollution, and the contribution from local anthropogenic emissions reduced to 28.9%. Likewise, the contributions from distant emissions from anthropogenic sources also dropped, accompanied by growing contributions from wildfire sources away from the Arctic. The findings revealed that PCDD/Fs emissions from wildfires (natural sources), either in the Arctic circle or away from the Arctic, had exceeded anthropogenic emissions after 2018, indicating increasingly essential roles of wildfires in Arctic PCDD/Fs contamination. We found that wildfire emissions associated with global warming have led to exacerbated PCDD/Fs emissions and increased PCDD/Fs levels in the Arctic, particularly since 2018. We also identified that the modeled mean atmospheric PCDD/Fs concentration induced by wildfire sources was highest in the Asian Arctic, followed by the North American and European Arctic. While boreal forest wildfires in northern Russia significantly contributed to PCDD/Fs fluctuations in the Asian Arctic, the changes in PCDD/Fs concentrations due to biomass combustion in the North American Arctic were mainly attributed to boreal forest wildfires in northern Canada. Our results imply that along with rapid warming in the Arctic and frequent occurrence and intensity of wildfires across northern territories, natural (mostly wildfire) sources likely offset the efforts to mitigate anthropogenic air pollution in the Arctic, such as PCDD/Fs investigated in this study. Hence, wildfire biomass burning and other natural emissions associated with climate warming should be considered when assessing the effectiveness of POP elimination from the environment.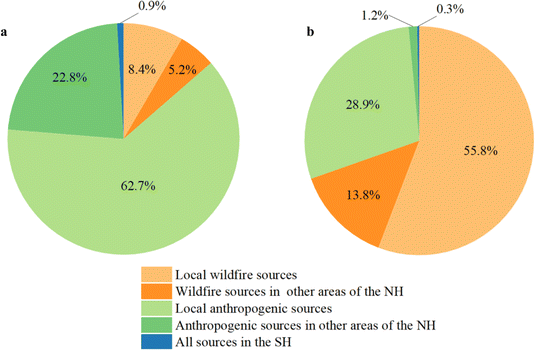 | ||
| Fig. 10 Fractional contributions of different sources to annual mean dioxin atmospheric concentrations in the Arctic in 2011 (a) and 2020 (b). | ||
Data availability
The data supporting this article have been included as part of the ESI.†Conflicts of interest
The authors declare that they have no known competing financial interests or personal relationships that could have appeared to influence the work reported in this paper.Acknowledgements
This research was supported by the ArcSolution project (101135051) under the Horizon Europe program and the National Natural Science Foundation of China through grants (41877507 and 42177351).References
- C. A. de Wit, K. Vorkamp and D. Muir, Envirosn. Sci.: Processes Impacts, 2022, 24, 1530 CAS.
- H. Hung, C. Halsall, H. Ball, T. Bidleman, J. Dachs, A. De Silva, M. Hermanson, R. Kallenborn, D. Muir, R. Sühring, X. Wang and S. Wilson, Environ. Sci.: Processes Impacts, 2022, 24, 1577–1615 RSC.
- M. Rantanen, A. Y. Karpechko, A. Lipponen, K. Nordling, O. Hyvärinen, K. Ruosteenoja, T. Vihma and A. Laaksonen, Commun. Earth Environ, 2022, 3, 168 CrossRef.
- J. Cohen, K. Pfeiffer and J. A. Francis, Nat. Commun., 2018, 9, 869 CrossRef PubMed.
- J. Schmale, P. Zieger and A. M. L. Ekman, Nat. Clim. Change, 2021, 11, 95–105 CrossRef.
- S. Lin, Y. Liu and X. Huang, Sci. Total Environ., 2021, 796, 148924 CrossRef CAS.
- J. E. Balmer, H. Hung, Y. Yu, R. J. Letcher and D. C. G. Muir, Emerging Contam., 2019, 5, 128–142 CrossRef.
- M. Liu, M. Cai, M. Duan, M. Chen, R. Lohmann, Y. Lin, J. Liang, H. Ke and K. Zhang, J. Geophys. Res.: Oceans, 2022, 127, e2021JC018389 CrossRef.
- S. Becker, C. J. Halsall, W. Tych, H. Hung, S. Attewell, P. Blanchard, H. Li, P. Fellin, G. Stern, B. Billeck and S. Friesen, Environ. Sci. Technol., 2006, 40, 3217–3222 CrossRef CAS PubMed.
- V. M. Kannan, V. G. Gopikrishna, V. K. Saritha, K. P. Krishnan and M. Mohan, Mar. Pollut. Bull., 2022, 174, 113277 CrossRef CAS PubMed.
- C. L. Friedman and N. E. Selin, Atmos. Chem. Phys., 2016, 16, 3433–3448 CrossRef CAS.
- S. Ubl, S. Martin, S. Andreas, F. John and H. Konrad, Atmos. Environ., 2012, 62, 391–399 CrossRef CAS.
- H. Hung, P. Blanchard, G. Poole, B. Thibert and C. Chiu, Atmos. Environ., 2002, 36, 1041–1050 CrossRef CAS.
- A. Dastoor, S. J. Wilson, O. Travnikov, A. Ryjkov, H. Angot, J. H. Christensen, F. Steenhuisen and M. Muntean, Sci. Total Environ., 2022, 839, 156213 CrossRef CAS PubMed.
- A. Kumar and S. Wu, Environ. Sci. Technol., 2019, 53, 11269–11275 CrossRef CAS.
- Arctic Monitoring and Assessment Programme (AMAP), AMAP Assessment 2002: Persistent Organic Pollutants in the Arctic, 2004 Search PubMed.
- W. Macdonald, L. A. Barrie, T. F. Bidleman, M. L. Diamond, D. J. Gregor, R. G. Semkin, W. M. J. Strachan, Y. Li, F. Wania, M. Alaee, L. B. Alexeeva, S. M. Backus, R. Bailey, J. M. Bewers, C. Gobeil, C. J. Halsall, T. Harner, J. T. Hoff, L. M. M. Jantunen, W. L. Lockhart, D. Mackay, D. C. G. Muir, J. Pudykiewicz, K. J. Reimer, J. N. Smith, G. A. Stern, W. H. Schroeder, R. Wagemann and M. B. Yunker, Sci. Total Environ., 2000, 254, 93–234 CrossRef PubMed.
- L. Barrie, Atmos. Environ., 1986, 20, 643–663 CrossRef CAS.
- A. Stohl, J. Geophys., 2006, 111, D11306 Search PubMed.
- K. Ikeda, H. Tanimoto, T. Sugita, H. Akiyoshi, Y. Kanaya, C. M. Zhu and F. Taketani, Atmos. Chem. Phys., 2017, 17, 10515–10533 CrossRef CAS.
- J. Luo, Y. Han, Y. Zhao, Y. Huang, X. Liu, S. Tao, J. Liu, T. Huang, L. Wang, K. Chen and J. Ma, Environ. Pollut., 2020, 261, 114186 CrossRef CAS PubMed.
- S. Song, B. Chen, T. Huang, S. Ma, L. Liu, J. Luo, H. Shen, J. Wang, L. Guo, M. Wu, X. Mao, Y. Zhao, H. Gao and J. Ma, Environ. Sci. Ecotechnology, 2023, 14, 100232 CrossRef CAS PubMed.
- M. Van den Berg, L. Birnbaum, A. T. C. Bosveld, B. Brunstrom, P. Cook, M. Feeley, J. P. Giesy, A. Hanberg, R. Hasegawa, S. W. Kennedy, T. Kubiak, J. C. Larsen, F. X. R. van Leeuwen, A. K. D. Liem, C. Nolt, R. E. Peterson, L. Poellinger, S. Safe, D. Schrenk, D. Tillitt, M. Tysklind, M. Younes, F. Waern and T. Zacharewski, Environ. Health Perspect., 1998, 106, 775–779 CrossRef CAS PubMed.
- World Health Organization (WHO), Exposure to Dioxins and Dioxin-like Substances: A Major Public Health Concern, 2010 Search PubMed.
- W. S. Lee, G. P. Chang-Chien, L. Wang, W. J. Lee, P. J. Tsai, K. Wu and C. Lin, Environ. Sci. Technol., 2004, 38(19), 4937–4944 CrossRef CAS PubMed.
- M. Koch, W. Knoth and W. Rotard, Chemosphere, 2001, 43, 737–741 CrossRef CAS.
- S. J. Lee, H. Park, S. D. Choi, J. M. Lee and Y. S. Chang, Atmos. Environ., 2007, 41(28), 5876–5886 CrossRef CAS.
- T. Huang, C. Tian, K. Zhang, H. Gao, Y. Li and J. Ma, Atmos. Environ., 2015, 108, 41–48 CrossRef CAS.
- L. Chen, T. Huang, K. Chen, S. Song, H. Gao and J. Ma, Environ. Sci., 2020, 41, 510–519 Search PubMed.
- P. S. Kulkarni, J. G. Crespo and C. A. M. Afonso, Environ. Int., 2008, 34, 139–153 CrossRef CAS PubMed.
- Y. Huang, Y. Chen, Y. Li, L. Zhou, S. Zhang, J. Wang, W. Du, J. Yang, L. Chen, W. Meng, S. Tao and M. Liu, J. Hazard. Mater., 2021, 424, 127320 CrossRef.
- X. Hu, Z. Xu, X. Peng, M. Ren, S. Zhang, X. Liu and J. Wang, Environ. Geochem. Health, 2013, 35, 593–604 CrossRef CAS PubMed.
- K. Salian, V. Strezov, T. J. Evans, M. Taylor and P. F. Nelson, PLoS One, 2019, 14, e0224328 CrossRef CAS.
- United Nations Environment Programme (UNEP), The Stockholm Convention on Persistent Organic Pollutants, United Nations Environmental Programme, Geneva, Switzerland, 2001 Search PubMed.
- A. Cabrerizo, D. C. G. Muir, G. Köck, D. Iqaluk and X. Wang, Environ. Sci. Technol., 2018, 52, 10380–10390 CrossRef CAS PubMed.
- X. Wang, C. Wang, T. Zhu, P. Gong, J. Fu and Z. Cong, Environ. Pollut., 2019, 248, 191–208 CrossRef CAS.
- S. Corsolini, K. Kannan, T. Imagawa, S. Focardi and J. P. Environ, Sci. Technol., 2002, 36, 3490–3496 CrossRef CAS.
- S. Jia, Q. Wang, L. Li, X. Fang, Y. Shi, W. Xu and J. Hu, Sci. Total Environ., 2014, 497, 353–359 CrossRef.
- S. Song, K. Chen, T. Huang, J. Ma, J. Wang, X. Mao, H. Gao, Y. Zhao and Z. Zhou, J. Hazard. Mater., 2023, 443, 130357 CrossRef CAS.
- G. R. van der Werf, W. Peters, T. T. van-Leeuwen and L. Giglio, Clim. Past, 2013, 9, 289–306 CrossRef.
- W. Knorr, L. Jiang and A. Arneth, Biogeosciences, 2016, 13, 267–282 CrossRef.
- S. Wagner, J. Brandes, R. G. M. Spencer, K. Ma, S. Z. Rosengard, J. M. S. Moura and A. Stubbins, Nat. Commun., 2019, 10, 5064 CrossRef PubMed.
- M. Wu, J. Luo, T. Huang, L. Lian, T. Chen, S. Song, Z. Wang, S. Ma, C. Xie, Y. Zhao, X. Mao, H. Gao and J. Ma, Environ. Int., 2022, 162, 107162 CrossRef CAS.
- B. Zhang, H. Shen, X. Yun, Q. Zhong, B. H. Henderson, X. Wang, L. Shi, S. S. Gunthe, L. G. Huey, S. Tao, A. G. Russell and P. Liu, Environ. Sci. Technol., 2022, 56, 3894–3904 CrossRef CAS PubMed.
- J. Ma, S. Daggupaty, T. Harner and Y. Li, Environ. Sci. Technol., 2003, 37, 3774–3781 CrossRef CAS PubMed.
- J. Ma, H. Hung, C. Tian and R. Kallenborn, Nat. Clim. Change, 2011, 1, 255–260 CrossRef CAS.
- W. Jiang, H. Chen, T. Huang, L. Lian, J. Li, C. Jia, H. Gao, X. Mao and J. Ma, Chemosphere, 2019, 229, 358–365 CrossRef CAS PubMed.
- H. Ma, J. He, H. Fan, N. Zhang, Q. Wu, S. Zhang, C. Zhang, T. Huang, H. Gao, J. Ma and Z. Xie, J. Hazard. Mater., 2024, 465, 133404 CrossRef CAS PubMed.
- T. Huang, Z. Ling, J. Ma, R. B. Macdonald, H. Gao, S. Tao, C. Tian, S. Song, W. Jiang, L. Chen, K. Chen, Z. Xie, Y. Zhao, L. Zhao, C. Gu and X. Mao, Nat. Food, 2020, 1, 292–300 CrossRef CAS.
- V. I. Kharuk, M. L. Dvinskaya, S. T. Im, A. S. Golyukov and K. Smith, Fire, 2022, 5, 106 CrossRef.
- B. Zheng, P. Ciais, F. Chevallier, H. Yang, J. G. Canadell, Y. Chen, I. R. van der Velde, I. Aben, E. Chuvieco, S. J. Davis, M. Deeter, C. Hong, Y. Kong, H. Li, H. Li, X. Lin, K. He and Q. Zhang, Science, 2023, 379, 912–917 CrossRef CAS PubMed.
- M. Van den Berg, L. S. Birnbaum, M. Denison, M. De Vito, W. Farland, M. Feeley, H. Fiedler, H. Hakansson, A. Hanberg, L. Haws, M. Rose, S. Safe, D. Schrenk, C. Tohyama, A. Tritscher, J. Tuomisto, M. Tysklind, N. Walker and R. E. Peterson, Toxicol. Sci., 2006, 93, 223–241 CrossRef CAS PubMed.
- M. MacLeod, A. J. Fraser and D. Mackay, Environ. Toxicol. Chem., 2002, 21(4), 700–709 CrossRef CAS PubMed.
- K. Chen, T. Huang, X. Zhang, X. Liu, Y. Huang, L. Wang, Y. Zhao, H. Gao, S. Tao, J. Liu, X. Jian, A. Gusev and J. Ma, iScience, 2021, 24, 103255 CrossRef CAS.
- L. Lian, T. Huang, X. Ke, Z. Ling, W. Jiang, Z. Wang, S. Song, J. Li, Y. Zhao, H. Gao, S. Tao, J. Liu and J. Ma, Environ. Sci. Technol., 2022, 56(1), 145–154 CrossRef CAS PubMed.
- J. Ma, H. Hung and R. W. Macdonald, Glob. Planet. Change, 2016, 146, 89–108 CrossRef.
- Y. Yu, A. Katsoyiannis, P. Bohlin-Nizzetto, E. Brorström-Lundén, J. Ma, Y. Zhao, Z. Wu, W. Tych, D. Mindham, E. Sverko, E. Barresi, H. Dryfhout-Clark, P. Fellin and H. Hung, Environ. Sci. Technol., 2019, 53(5), 2375–2382 CrossRef CAS PubMed.
- Z. Zhang, L. Wang, N. Xue and Z. Du, Fire, 2021, 4(3), 57 CrossRef.
- Intergovernmental Panel on Climate Change (IPCC), Summary for Policymakers, in IPCC Special Report on the Ocean and Cryosphere in a Changing Climate, 2019 Search PubMed.
- A. Ciavarella, D. Cotterill, P. Stott, S. Kew, S. Philip, G. J. van Oldenborgh, A. Skålevåg, P. Lorenz, Y. Robin, F. Otto, M. Hauser, S. I. Seneviratne, F. Lehner and O. Zolina, Clim. Change, 2021, 166, 9 CrossRef PubMed.
- Y. Zhang and S. Tao, Atmos. Environ., 2009, 43, 812–819 CrossRef CAS.
Footnote |
| † Electronic supplementary information (ESI) available. See DOI: https://doi.org/10.1039/d4va00202d |
| This journal is © The Royal Society of Chemistry 2024 |

