 Open Access Article
Efficient and sustainable hydrogen evolution reaction: enhanced photoelectrochemical performance of ReO3-incorporated Cu2Te catalysts†
Aruna
Vijayan
and
N.
Sandhyarani
 *
*
Nanoscience Research Laboratory, Department of Materials Science and Engineering, National Institute of Technology Calicut, Calicut, Kerala, India. E-mail: sandhya@nitc.ac.in
First published on 5th April 2024
Abstract
In the pursuit of clean hydrogen production, the photoelectrochemical hydrogen evolution reaction (HER) plays a pivotal role. The development of highly efficient, durable catalysts is vital for the industrialization of water-splitting technology. One promising strategy is the fabrication of self-supported catalysts, which are known for their exceptional activity and durability. In this study, we report the synthesis of copper telluride (Cu2Te) incorporated with rhenium oxide (ReO3) via a CVD-assisted route. The electrochemical and photoelectrochemical HER performance analyses reveal that the ReO3–Cu2Te composite exhibits excellent HER performance with a very low overpotential of −0.026 V at −10 mA cm−2 in the presence of light. This exceptional performance positions the ReO3–Cu2Te composite as a promising candidate to replace the expensive state-of-the-art platinum catalyst.
1. Introduction
The world's energy demands contribute to the transition to an era beyond fossil fuels. Green hydrogen production by water splitting is a promising and sustainable energy production method. To deploy water splitting as a commercial method for the production of hydrogen, the catalyst should possess certain merits such as earth abundance, compatibility, scalability, and low fabrication cost.1 To date, platinum has been considered the most efficient catalyst for the hydrogen evolution reaction.2 Low earth abundance and high cost prevent platinum from being used for large-scale industrial applications. Dedicated research is being carried out to develop an efficient, inexpensive, and stable alternative to platinum.Transition metal chalcogenides (TMCs),3 nitrides,4 oxides,5 and phosphides6 are some of the active catalytic materials recently reported for the hydrogen evolution reaction (HER). The low cost of the constituent elements, good electrocatalytic activity, the existence of various polymorphs, tunable band gaps, and metallic properties upon thinning are some of the peculiar properties of TMCs.7 Among TMCs, copper chalcogenides find applications in thermoelectric generators, photodetectors, light emitting diodes, solar cells, and photocatalysis, owing to their various structural forms and fascinating physical properties.8,9 The literature points out the advantage of Cu, owing to its high d electron occupancy.10 Compared to Fe, Co, and Ni, Cu is suitable for energy storage and conversion applications due to its excellent electrical conductivity, favorable stability, and cost-effectiveness.11 However, copper chalcogenides are rarely reported compared to molybdenum,12 nickel,13 cobalt,14 and tungsten chalcogenides14 for the HER. Among different copper chalcogenides, copper telluride has attracted recent research interest due to its ultralow thermal conductivity and superionic conductivity.9 Tellurium is less electronegative and heavier than other chalcogenides. Reports show that the catalytic performance of metal-based catalysts can be enhanced by increasing the covalent character of the metal–anion bond. Among the chalcogenides, tellurium has less electronegativity compared to sulfur and selenium, resulting in stronger metal–telluride (M–Te) bonds with increased covalent character. This increased covalency of M–Te bonds lowers the reduction potential of metals facilitating the generation of catalytically active sites.15 Also among different transition metal chalcogenides, transition metal tellurides have quasi-metallic properties and hence exhibit superior conductivity and mass transport rate. Compared to sulfide and selenide derivatives, copper telluride is less explored.
Transition metal oxides (TMOs) are another class of widely studied photo-, electro-, and photo-electrocatalysts towards the hydrogen evolution reaction. The TMOs generally suffer from fast charge carrier recombination, affecting their photo/photoelectrocatalytic activity. Several methods are reported to alleviate the fast recombination. TMOs with oxygen vacancies are considered prospective materials to increase the catalytic activity of a catalyst,16 and help to tune the bandgap and provide more active sites and have favorable Gibbs hydrogen adsorption free energies.17 Formation of heterostructures is another means to decrease the charge recombination and increase the photocatalytic efficiency.16 Formation of a heterostructure of TMO and TMC with appropriate band gap alignment is a potential method to improve the HER, which is addressed in this work.
Among different elements, rhenium is at the forefront as an HER catalyst, exhibiting optimal binding energy for adsorption and desorption of protons and an excellent exchange current density comparable to platinum. Re has great potential to replace Pt, but more studies are needed in this regard.18,19 Owing to its different valence states, rhenium oxide finds great potential in technological and industrial applications such as fuel cells, heterogeneous catalysis, etc20,21 Reports suggest that ReO3 exhibits localized surface plasmon resonance (LSPR) in the visible region similar to gold nanoparticles or metallic copper due to the available free electrons in the conduction band and the partially filled conduction band.22 So far, very limited studies have been conducted on the HER properties of ReO3.
Although a variety of TMC and TMO-based catalysts have been synthesized, most of them are in powder form. A powder catalyst often requires a binder to be cast on a substrate for electrochemical testing. This increases the interfacial resistance between the catalyst and electrolyte, blocks the active site of the catalyst, and results in reduced HER activity.23 Deposition of a catalyst on a conductive substrate is a promising strategy, which often provides nano- or microstructures with a large number of active edge sites and lower diffusion lengths for charge and mass transport.24 Cu foam (CuF) can be used for materials growth, and its low cost and high electrical conductivity make it suitable as an electrode substrate.25 Typically, self-supported catalysts can be synthesized by different synthesis approaches such as electrodeposition, hydro/solvothermal synthesis, freeze drying, vacuum filtration, physical/chemical vapor deposition, etc. Among these different methods, chemical vapor deposition (CVD) yields 2D materials of high quality and high yield.26 The literature reports the enhanced activity of chemical vapor deposited TMDs owing to their more exposed active edge sites.27
The present work establishes a strategy for designing a self-supported catalyst by chemical vapor deposition using Cu foam as the substrate and the precursor for the formation of copper telluride. This ensures the strong interaction between the active materials and the substrate, enhancing its activity toward the HER. By incorporating ReO3 into Cu2Te, the HER activity of copper telluride is enhanced significantly. The synthesized ReO3–Cu2Te catalyst exhibited a lower overpotential of −0.026 V at −10 mA cm−2 in the presence of light. Such a lower overpotential underlines its competence with Pt catalysts.
2. Experimental methods
2.1. Materials
Ammonium perrhenate (≥99%) and tellurium powder (99.8%, 200 mesh) were procured from Sigma Aldrich.2.2. Synthesis of copper telluride incorporated with rhenium oxide
Chemical vapor-deposition-assisted synthesis was carried out to prepare a copper telluride–rhenium oxide composite. For the synthesis, tellurium powder and ammonium perrhenate were used as precursors. The schematic representation of the synthesis is given in Scheme 1. 250 mg of tellurium powder was taken in an alumina boat and placed in zone 2 of the quartz tube furnace, where the temperature was ramped up to 650 °C. 50 mg of ammonium perrhenate taken in an alumina boat was placed in zone 1, where the temperature was ramped up to 500 °C. Cu foam of 1 cm2 × 2 cm2 dimensions was also placed on top of the same alumina boat. Prior to ramping up the temperature, argon gas was purged through the furnace at a flow rate of 150 sccm for 15 min. The two different zones of the furnace were then ramped up to 500 °C and 650 °C in 30 minutes and then kept at 500 °C and 650 °C for 30 min with a constant flow rate of argon gas at 150 sccm under atmospheric pressure. The furnace was then turned off and allowed to cool to 35 °C. To investigate the electrochemical and photoelectrochemical HER properties of other copper chalcogenides upon ReO3 incorporation, the same synthesis process was repeated with S and Se powders instead of tellurium powder. | ||
| Scheme 1 Schematic representation of chemical vapor deposition of copper chalcogenides incorporated with rhenium oxide. | ||
3. Results and discussion
3.1. Morphological characterization
Morphological analysis of ReO3–Cu2Te was carried out using FE-SEM, which revealed the growth of the catalyst on the surface of the copper foam. The SEM images of the ReO3–Cu2Te composite at different magnifications are given in Fig. 1(a) and (b), which show thick flake-like deposits. The morphological distinction between ReO3 and Cu2Te is not possible from these SEM images. To investigate the presence of the elements, energy dispersive spectroscopy (EDS) analysis was carried out. The presence of copper, tellurium, rhenium, and oxygen was proven using the EDS spectrum (Fig. 1(c)) and the EDS mapping (Fig. 1(e)–(i)).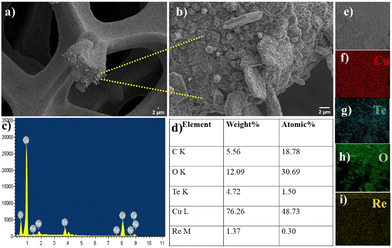 | ||
| Fig. 1 (a) and (b) SEM image and magnified SEM image of ReO3–Cu2Te. (c) EDS spectrum of ReO3–Cu2Te. (d) Elemental composition of ReO3–Cu2Te. (e)–(i) Elemental mapping of Cu, Te, O, and Re. | ||
3.2. Chemical characterization
The crystallinity of copper telluride incorporated with rhenium oxide was analysed using XRD, which is shown in Fig. 2(a). The composite exhibits strong peaks at 43.5°, 50.4°, and 73.9° corresponding to (111), (200), and (220) planes of the cubic crystal system of copper (00-003-1005), which arise from the Cu foam. The diffractions at 12.1°, 24.3°, 27.1°, 42.2°, and 44.6° correspond to the planes (001), (002), (101), (110), (103) of Cu2Te (03-065-3460) with hexagonal structure. As evident from the EDS analysis, the concentration of rhenium oxide is very low in the composites. To identify in which form rhenium was incorporated in the materials, ammonium perrhenate alone was treated under the same synthesis conditions in the absence of Cu. The XRD analysis of the material suggests the formation of rhombohedral ReO3 (00-045-1039) along with traces of monoclinic ReO2 (00-017-0600), which is shown in Fig. S2 (ESI†). In the ReO3–Cu2Te (Fig. 2(a)) composite, the peaks observed at 24.3°, 42.2°, and 61.5° correspond to the planes (200), (222), and (422) of ReO3 (03-065-4073) belonging to the cubic crystal structure. Upon composite formation, ReO3 exhibited a phase transition. Rhenium trioxide has a perovskite-type (ABO3) structure composed of a regular octahedron joined by vertices with an unoccupied perovskite A site.28 When these metal centers are linked by a ligand, coordination polymers form. It has been reported that such copolymers exhibit structural phase transition induced by the order–disorder motion of the ligand.29 Cu foam is prone to oxidation upon exposure to air. The peaks at 36°, 41.7°, 61.2°, and 73.9° correspond to (111), (200), (220) and (311) planes of Cu2O (01-078-2076). It is not considered as a distinct component in this manuscript, since its presence is inevitable even in bare copper foam. The reported electrochemical HER value of bare copper foam (CuF) includes the performance of Cu2O.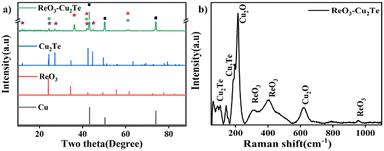 | ||
Fig. 2 (a) XRD pattern of ReO3–Cu2Te, in the XRD pattern,  , ,  , ,  , and , and  represent Cu, Cu2Te, ReO3, and Cu2O, respectively. (b) Raman spectrum of ReO3–Cu2Te. represent Cu, Cu2Te, ReO3, and Cu2O, respectively. (b) Raman spectrum of ReO3–Cu2Te. | ||
Raman spectrum of ReO3–Cu2Te is shown in Fig. 2(b). The material exhibits strong peaks at around 217 cm−1 and 620 cm−1 arising from the second overtone mode and Raman forbidden first order mode of Cu2O, which are due to the oxidation of the base material Cu foam.30 The peak at 140 cm−1 corresponds to the A1g vibrational mode of Cu–Te.31 The peak at 105 cm−1 also supports the existence of Cu2Te.32 The peaks around 325 cm−1 and 950 cm−1 correspond to the Re–O stretching vibration of ReO3.33 A broad peak at 400–500 cm−1 arises due to the presence of ReO3.34,35
XPS analysis was carried out to identify the chemical state associated with each element. All the values reported here are carbon corrected to the C 1s peak at 284.7 eV. The survey spectrum of ReO3–Cu2Te given in Fig. 3(a) reveals the presence of Cu, Te, Re, and O in the material. The peaks at 933.04 eV and 952.92 eV are assigned to the Cu 2p3/2 and Cu 2p1/2 peaks of the Cu1+ state.36 The core level spectrum of tellurium (Fig. 3(c)) exhibits a peak at binding energies 573.6 eV and 583.72 eV corresponding to the Te 3d5/2 and Te 3d3/2 of the Te2− state.37 Along with the peaks corresponding to Te, the Cu LLM peak at 570.17 eV and 575.1 eV, which arises from the Cu foam, was observed.38 The peak of Re at 46.25 eV and 48.59 eV represents the oxidized rhenium with a +6 oxidation state along with traces of a +4 oxidation state.39 The high-resolution oxygen spectrum shows two peaks at binding energies 530.95 eV and 532.11 eV. This indicates that there are two types of oxygen present in the material. One from the oxides of rhenium and another from the oxygen vacancies of the material.40
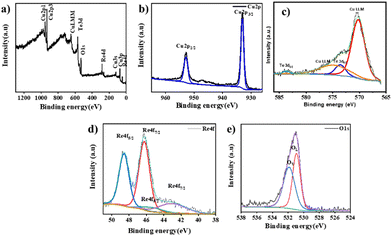 | ||
| Fig. 3 Survey spectrum of (a) ReO3–Cu2Te. Elemental spectra of (b) Cu 2p, (c) Te 3d, (d) Re 4f, and (e) O 1s of ReO3–Cu2Te. | ||
Usually, the O 1s spectrum can be resolved into three peaks. The peak at 529.5 ± 0.4 eV corresponds to lattice oxygen, the peak at 531.2 ± 0.6 eV corresponds to oxygen-deficient regions, and the peak at 532.5 ± 0.5 due to loosely bound oxygen on the surface such as in H2O and OH groups.41 The high energy peak is absent for ReO3–Cu2Te, since the XPS spectrum is taken after etching. Thermal treatment during CVD synthesis of ReO3–Cu2Te helps to create oxygen vacancies. Electrochemical and photoelectrochemical HER results indicate that these oxygen vacancies help enhance the catalytic activity of the catalyst. As mentioned above, Cu2O is present even with bare copper foam. Oxygen vacancies can also arise from Cu2O. However, the electrochemical HER performance (Section 3.3) of the copper chalcogenide and ReO3 incorporated copper chalcogenides demonstrates the beneficial effect of the incorporation of ReO3. Copper chalcogenide alone, wherein Cu2O is present, does not show a similar activity enhancement. This led to the conclusion that oxygen vacancies are created during ReO3 incorporation.
In order to investigate the presence of oxygen vacancies EPR spectroscopy42 was carried out for ReO3–Cu2Te and the spectrum is given in Fig. S3 (ESI†). The EPR spectrum of ReO3–Cu2Te shows an intense EPR signal at a g value of 2.15, indicating the presence of oxygen vacancies in the material.43
3.3. Electrochemical hydrogen evolution reaction
To assess the electrochemical HER performance of the catalyst, the linear sweep voltammetry technique was used. The polarization curves of CuF, Cu2Te, and ReO3–Cu2Te are shown in Fig. 4(a). The potential values obtained with Ag/AgCl were calibrated to the reversible hydrogen electrode (RHE). The details of the calibration experiment are given in the ESI† (Fig. S1). Cu2Te exhibits an overpotential of −0.34 V, at −10 mA cm−2. When rhenium oxide was introduced, the overpotential of ReO3–Cu2Te was decreased to −0.07 V, at −10 mA cm−2. The very low overpotential of ReO3–Cu2Te proves that the rhenium oxide–copper chalcogenide catalyst can be a promising substitute for Pt catalysts. Other chalcogenides, such as Cu2S and Cu2Se, incorporated with ReO3 were synthesized using a similar synthesis method. Their electrochemical HER analyses are given in Fig. S4 (ESI†). It is found that among different ReO3-incorporated copper chalcogenides, ReO3–Cu2Te exhibits lower overpotential and higher current density.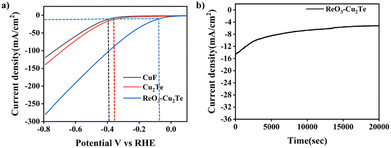 | ||
| Fig. 4 (a) Polarisation curve of CuF, Cu2Te, and ReO3–Cu2Te. (b) i–t amperometry curve of ReO3–Cu2Te. | ||
3.4. Stability
The chemical robustness of a catalyst is of critical importance when it comes to industrial applications. The accelerated durability test (ADT) of ReO3–Cu2Te was performed in 0.5 M H2SO4 using chronoamperometry for 20![[thin space (1/6-em)]](https://www.rsc.org/images/entities/char_2009.gif) 000 seconds. Fig. 4(b) shows the current density as a function of time. The i–t amperometry study was performed at a constant potential of −0.3 V with a sample interval of 0.1 s. The initial surge in current can be due to charging current. A similar trend in the current for long term operation confirms that the ReO3–Cu2Te catalyst exhibits good stability. ReO3–Cu2Te exhibits a current density change of only ∼9 mA cm−2 during the i–t amperometric durability analysis.
000 seconds. Fig. 4(b) shows the current density as a function of time. The i–t amperometry study was performed at a constant potential of −0.3 V with a sample interval of 0.1 s. The initial surge in current can be due to charging current. A similar trend in the current for long term operation confirms that the ReO3–Cu2Te catalyst exhibits good stability. ReO3–Cu2Te exhibits a current density change of only ∼9 mA cm−2 during the i–t amperometric durability analysis.
FE-SEM and XRD analyses were performed to identify the morphological and chemical changes that occurred during the durability test (Fig. 5). Cu2Te–ReO3 appears as small flakes after the stability test. All the flakes appeared as small polyhedron like deposits. The presence of all the elements after ADT was confirmed by EDS analysis. This confirms that no leaching occurs during the test. After ADT, the catalysts were analyzed using XRD to identify structural characteristics (Fig. 5(c)). ReO3–Cu2Te after the stability test exhibits peaks at 24.5°, 42.2°, and 61.5°, which correspond to (200), (222), and (422) planes of ReO3 in the cubic phase. The peaks at 12.2°, 24.6°, 27.7°, 36.5°, 42.3°, and 44.9° represent (001), (002), (101), (003), (110), and (103) planes of hexagonal Cu2Te. Apart from the diffractions of the composite, peaks at 43.2°, 50.5°, and 73.9° corresponding to the planes (111), (200), and (220) of cubic Cu are observed. Along with these peaks, as mentioned in Section 3.2, copper oxide (Cu2O) peaks are also present.
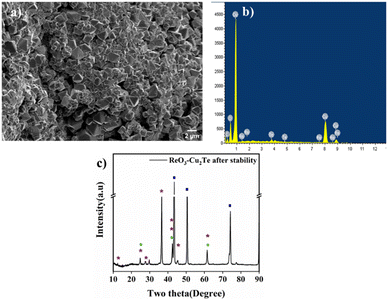 | ||
Fig. 5 (a) SEM image, (b) EDS spectrum, and (c) XRD pattern of ReO3–Cu2Te after the stability test. In the XRD pattern,  , ,  , ,  , and , and  represent Cu, Cu2Te, ReO3, and Cu2O respectively. represent Cu, Cu2Te, ReO3, and Cu2O respectively. | ||
3.5. Photoelectrochemical hydrogen evolution reaction
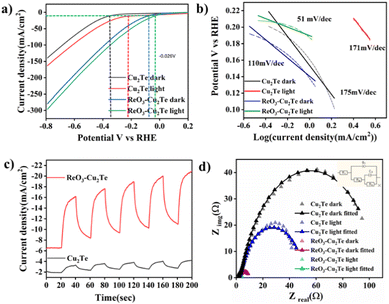
CVD synthesized photocathodes were utilized to study the photoelectrochemical HER activity. For this study, a 250 W halogen light source with visible-range absorption was used. The electrolyte used was 0.5 M H2SO4. Fig. 6(a) presents the photoelectrochemical polarisation curves of different copper chalcogenides incorporated with rhenium oxide. The results suggest that Cu2Te exhibits higher HER activity in the presence of light than under dark conditions. Upon incorporation of ReO3, the heterostructure followed this trend. ReO3–Cu2Te under dark conditions exhibits an overpotential of −0.074 V, and under light irradiation, it exhibits a lower overpotential of −0.026 V. ReO3–Cu2Te exhibits a change in current density of ∼18 mA cm−2 upon light irradiation. The presence of oxygen vacancies in ReO3 enhances the photoactivity of the catalyst.44 Photoelectrochemical HER analysis carried out for copper sulfide and copper selenide incorporated with ReO3 is given in Fig. S5 (ESI†). Among different ReO3-incorporated copper chalcogenides ReO3–Cu2Te exhibits the lowest overpotential under light irradiation.The Tafel slope values were calculated to understand the mechanism of the reaction (Fig. 6(b)). Tafel plots were generated from LSV, and from the linear region of Tafel plots, Tafel slopes were calculated. ReO3–Cu2Te exhibited a Tafel slope of 51 mV dec−1, upon light irradiation. Tafel slope analysis suggests that the catalytic process involves a Volmer–Tafel mechanism in which the recombination of adsorbed hydrogen atoms is the rate-determining step. The smaller Tafel slope value of this composite compared to Cu2Te indicates enhanced HER activity of the composite.
The photocurrent of the catalyst is studied by chronoamperometry, which is shown in Fig. 6(c). Intermittent light illumination at an interval of 20 s was carried out at a constant potential of −0.3 V with a sample interval of 0.1 s. As depicted in Fig. 6(c), rhenium oxide incorporation increases the photocurrent density of copper telluride. The enhanced photocurrent density is direct evidence of the enhanced electron availability upon light irradiation.
A detailed analysis of the charge transfer mechanism was studied using electrochemical impedance spectroscopy (EIS). By keeping the potential constant at −0.3 V vs. Ag/AgCl, EIS studies were performed in 0.5 M H2SO4 from a high frequency of 105 Hz to a low frequency of 0.08 Hz. The Nyquist plot obtained after fitting along with the equivalent circuit is given in Fig. 6(d). The equivalent circuit consists of solution resistance R1, charge transfer resistance R3, constant phase element Q1, and capacitance C3. The additional resistance component R2 in the equivalent circuit indicates that the electrochemical reaction involves the adsorption of the reaction intermediate. Cu2Te under dark conditions exhibits a higher charge transfer resistance (102.8 Ω). In the presence of light charge transfer resistance decreases to 33.93 Ω. The composite ReO3–Cu2Te exhibited a much lower charge transfer resistance of 8.899 Ω under dark conditions. Under light irradiation, the charge transfer resistance of the composite was further reduced to 1.278 Ω. This trend observed for the composite demonstrates the benefit of ReO3 incorporation for the photoexcitation, charge separation, and transport of the composite, illustrating enhanced electrical conductance. The fitted circuit parameter values are given in Table S1 (ESI†).
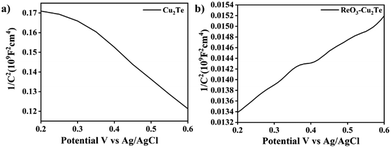
The Mott–Schottky (M–S) analysis gives an insight into the charge carriers in the photoelectrodes. Before ReO3 incorporation, the Mott–Schottky plot of Cu2Te exhibited a negative slope, which suggests the p-type behavior of the semiconductors, where the major charge carriers are holes. This is consistent with the literature. However, after the incorporation of ReO3, ReO3–Cu2Te showed a positive slope and behaved as an n-type (Fig. 7) semiconductor with electrons as the major charge carriers.
The band gap of the catalyst was estimated by UV-vis diffuse reflectance spectroscopy. Fig. S6 (ESI†) presents the UV-vis diffuse reflectance spectra of Cu2Te and ReO3 incorporated Cu2Te. The energy gap for the direct allowed transitions was determined using the Tauc plot (Fig. S6b and c, ESI†). Cu2Te shows absorption in the visible region, which is retained after the incorporation of rhenium oxide. The bandgap of the materials was calculated using the Tauc plot. Cu2Te exhibited a bandgap of 1.61 eV. Upon incorporating ReO3 its bandgap reduced to 1.47 eV.
3.6. Proposed mechanism
On account of the above results and band edge positions of copper telluride and rhenium oxides a plausible mechanism for the photoelectrochemical behavior of the composite is suggested as follows: generally, upon composite formation, the beneficial arrangement of band position facilitates improved light absorption and efficient charge separation. In such cases, upon contact, the Fermi level of semiconductors equilibrates, and an internal electric field is generated. This internal electric field promotes the electron movement from the conduction band (CB) of Cu2Te to the CB of ReO3, which in turn, increases the lifetime of the electron–hole pair. These electrons are then utilized for the reduction of H+ ions into H2. In addition to the above-mentioned mechanism, oxygen vacancies also play a role in tuning the bandgap, extending the absorption range and charge carrier separation leading to an overall enhancement of the photoelectrochemical reaction of the composite. Localized electrons trapped in these vacancies are injected into the adjacent empty 3d orbital of metal atoms. This will create a donor level below the conduction band minimum (CBM). The unsaturated metal atom also participates in electron donation to the oxygen atom that surrounds the defective site. This creates another donor level above the valence band maximum (VBM).44 Formation of these two donor states effectively helps to reduce the bandgap of ReO3. This bandgap tuning is illustrated in Fig. 8(a). The donor state below the CBM acts like an intermediate energy level and harvests photons with lower energy. Moreover, these oxygen vacancy states trap the electrons that participate in the subsequent HER reaction. Thus, rhenium oxide incorporated copper telluride benefits from both heterostructure formation and the oxygen vacancy creation on ReO3, which effectively contribute towards the catalytic activity. This mechanism is given in Fig. 8(b).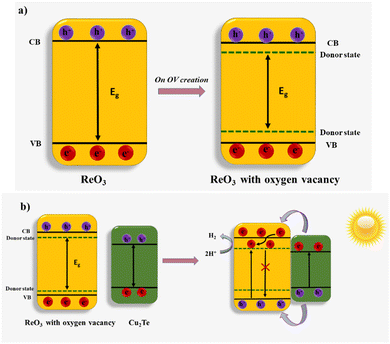 | ||
| Fig. 8 (a) Schematic illustration of the energy band structure and (b) the proposed photocatalytic mechanism of the Cu2Te–ReO3 composite. | ||
4. Conclusion
In summary, the present work established a CVD-synthesized rhenium oxide–copper chalcogenide composite as an efficient electro- and photo-electrocatalyst for the hydrogen evolution reaction. The electrochemical and photoelectrochemical performances of self-supported rhenium oxide incorporated Cu2Te were analyzed using linear sweep voltammetry, chronoamperometry, electrochemical impedance spectroscopy, Mott–Schottky analysis, etc., which confirmed the enhanced performance after rhenium oxide incorporation. The ReO3–Cu2Te composite exhibited the highest HER performance with a very low overpotential of −0.026 V at −10 mA cm−2 in the presence of light, confirming that this combination is a promising candidate to replace the costly platinum catalyst. The oxygen vacancies created during the incorporation of ReO3 through the CVD synthesis help enhance the catalytic properties. The work provided future insight into the wide opportunity of utilizing ReO3 and its combination with different TMDs for efficient energy conversion and storage applications.Conflicts of interest
The authors declare no competing financial interest.Acknowledgements
NS gratefully acknowledges the Science and Engineering Research Board, for the SERB POWER fellowship (grant no. SPF/2021/000008) for the work on rhenium based heterostructures for hydrogen generation. We extend our thanks to the Technology Business Incubator (TBI) at the National Institute of Technology Calicut for providing the chemical vapor deposition facility. The authors acknowledge the support of the Center for Materials Characterization, National Institute of Technology Calicut for the XRD and Raman facilities, and Nanotechnology Research Centre (NRC), SRMIST for the XPS facility. The authors acknowledge the help received from Teena Thomas, Shubham Kaurav, Haritha K., Rahul Rajan, and Anju V. S. during the synthesis process.Notes and references
- Y.-X. Yu, L. Pan, M.-K. Son, M. T. Mayer, W.-D. Zhang, A. Hagfeldt, J. Luo and M. Grätzel, ACS Energy Lett., 2018, 3, 760–766 CrossRef CAS.
- M. B. Askari and P. Salarizadeh, Synth. Met., 2019, 256, 116131 CrossRef CAS.
- H. Su, X. Pan, S. Li, H. Zhang and R. Zou, Carbon Energy, 2023, 8, 1851–1863 Search PubMed.
- J. Theerthagiri, S. J. Lee, A. P. Murthy, J. Madhavan and M. Y. Choi, Curr. Opin. Solid State Mater. Sci., 2020, 24, 100805 CrossRef CAS.
- Y. Zhang, W. Liao and G. Zhang, J. Power Sources, 2021, 512, 230514 CrossRef CAS.
- K. Bhunia, M. Chandra, S. Kumar Sharma, D. Pradhan and S.-J. Kim, Coord. Chem. Rev., 2023, 478, 214956 CrossRef CAS.
- J. Yang and H. S. Shin, J. Mater. Chem. A, 2014, 2, 5979–5985 RSC.
- X.-W. Lv, Q.-H. Kong, X.-L. Song, Y.-P. Liu and Z.-Y. Yuan, Inorg. Chem. Front., 2022, 9, 6182–6189 RSC.
- Y. Zhang, Z. Zhang, W. Liu, Y. Zheng, Y. Wu, J. Su, N. Liu and Y. Gao, J. Mater. Chem. A, 2021, 9, 26095–26104 RSC.
- T. Li, Q. Zhang, X. H. Wang, J. Luo, L. Shen, H. C. Fu, F. Gu, N. B. Li and H. Q. Luo, Nanoscale, 2021, 13, 17846–17853 RSC.
- Y. Xie, J. Huang, R. Xu, D. He, M. Niu, X. Li, G. Xu, L. Cao and L. Feng, Molecules, 2022, 27, 5961 CrossRef CAS PubMed.
- K. S. Bhat and H. S. Nagaraja, Int. J. Hydrogen Energy, 2019, 44, 17878–17886 CrossRef CAS.
- S. Anantharaj, S. Kundu and S. Noda, J. Mater. Chem. A, 2020, 8, 4174–4192 RSC.
- H. Zhong, C. Campos-Roldán, Y. Zhao, S. Zhang, Y. Feng and N. Alonso-Vante, Catalysts, 2018, 8, 559 CrossRef.
- J. Lu, G. Qian, L. Luo, H. He and S. Yin, Int. J. Hydrogen Energy, 2021, 46, 676–682 CrossRef CAS.
- H. Tian, X. Cui, L. Zeng, L. Su, Y. Song and J. Shi, J. Mater. Chem. A, 2019, 7, 6285–6293 RSC.
- S. Kajita, T. Eda, S. Feng, H. Tanaka, A. Bieberle-Hütter and N. Ohno, Adv. Energy Sustain. Res., 2023, 2200141, 2200141 CrossRef.
- S. Suragtkhuu, S. Sunderiya, S. Purevdorj, M. Bat-Erdene, B. Sainbileg, M. Hayashi, A. S. R. Bati, J. G. Shapter, S. Davaasambuu and M. Batmunkh, Nanoscale Adv., 2023, 5, 349–355 RSC.
- Y. L. Kim, H.-A. Choi, N.-S. Lee, B. Son, H. J. Kim, J. M. Baik, Y. Lee, C. Lee and M. H. Kim, Phys. Chem. Chem. Phys., 2015, 17, 7435–7442 RSC.
- W. Wu, J. Yao, S. Liu, L. Zhao, L. Xu, Y. Sun, Y. Lou, J. Zhao, J.-H. Choi, L. Jiang, H. Wang and G. Zou, Nanotechnology, 2019, 30, 355701 CrossRef CAS PubMed.
- A. Agrawal, S. H. Cho, O. Zandi, S. Ghosh, R. W. Johns and D. J. Milliron, Chem. Rev., 2018, 118, 3121–3207 CrossRef CAS PubMed.
- Y. Zhao, S. Wei, L. Xia, K. Pan, B. Zhang, H. Huang, Z. Dong, H.-H. Wu, J. Lin and H. Pang, Chem. Eng. J., 2022, 430, 133040 CrossRef CAS.
- H. Yu, J. Wang, X. Wang, N. Yu, X. Zuo, Y. Xue, N. Cai, J. Liu, J. Wang and F. Yu, Sustainable Energy Fuels, 2022, 74–83 Search PubMed.
- W. Yang and S. Chen, Chem. Eng. J., 2020, 393, 124726 CrossRef CAS.
- H. Sun, Z. Yan, F. Liu, W. Xu, F. Cheng and J. Chen, Adv. Mater., 2020, 32, 1806326 CrossRef CAS PubMed.
- Y. Zhang, K. Liu, F. Wang, T. A. Shifa, Y. Wen, F. Wang, K. Xu, Z. Wang, C. Jiang and J. He, Nanoscale, 2017, 9, 5641–5647 RSC.
- J. Gaidelene, A. Kuzmin, J. Purans and C. Guéry, Phys. Status Solidi, 2005, 2, 149–152 CrossRef CAS.
- M. E. Schweinefuß, I. A. Baburin, C. A. Schröder, C. Näther, S. Leoni and M. Wiebcke, Cryst. Growth Des., 2014, 14, 4664–4673 CrossRef.
- M. Balık, V. Bulut and I. Y. Erdogan, Int. J. Hydrogen Energy, 2019, 44, 18744–18755 CrossRef.
- J. Pandey, S. Mukherjee, D. Rawat, S. Athar, K. S. Rana, R. C. Mallik and A. Soni, ACS Appl. Energy Mater., 2020, 3, 2175–2181 CrossRef CAS.
- S. Mukherjee, R. Chetty, P. V. P. Madduri, A. K. Nayak, K. Wojciechowski, T. Ghosh, K. Chattopadhyay, S. Suwas and R. C. Mallik, Dalton Trans., 2019, 48, 1040–1050 RSC.
- J. Purans, A. Kuzmin, E. Cazzanelli and G. Mariotto, J. Phys.: Condens. Matter, 2007, 19, 226206 CrossRef.
- Y. Zhao, D. Wu, T. Tang, C. Lyu, J. Li, S. Ji, C. Yuan, K. San Hui, C. Zha, K. N. Hui and H. Chen, J. Mater. Chem. A, 2022, 10, 4015–4023 RSC.
- D. Park, H. Ju, T. Oh and J. Kim, CrystEngComm, 2019, 21, 1555–1563 RSC.
- Q. Zhang, Z. Ti, Y. Zhu, Y. Zhang, Y. Cao, S. Li, M. Wang, D. Li, B. Zou, Y. Hou, P. Wang and G. Tang, ACS Nano, 2021, 15, 19345–19356 CrossRef CAS PubMed.
- S. Suragtkhuu, S. Sunderiya, S. Purevdorj, M. Bat-Erdene, B. Sainbileg, M. Hayashi, A. S. R. Bati, J. G. Shapter, S. Davaasambuu and M. Batmunkh, Nanoscale Adv., 2023, 0–6 Search PubMed.
- Y. Yuan and Y. Iwasawa, J. Phys. Chem. B, 2002, 106, 4441–4449 CrossRef CAS.
- S. Kumar and C. Rath, Phys. Status Solidi, 2020, 217, 1900756 CrossRef CAS.
- C. Wang, X. Cui, J. Liu, X. Zhou, X. Cheng, P. Sun, X. Hu, X. Li, J. Zheng and G. Lu, ACS Sens., 2016, 1, 131–136 CrossRef CAS.
- Y. Huang, Y. Yu, Y. Yu and B. Zhang, Sol. RRL, 2020, 4, 2000037 CrossRef CAS.
- C. Wang, X. Cui, J. Liu, X. Zhou, X. Cheng, P. Sun, X. Hu, X. Li, J. Zheng and G. Lu, ACS Sens., 2016, 1, 131–136 CrossRef CAS.
- K. Zhu, F. Shi, X. Zhu and W. Yang, Nano Energy, 2020, 73, 104761 CrossRef CAS.
- M. A. Pires, C. Israel, W. Iwamoto, R. R. Urbano, O. Agüero, I. Torriani, C. Rettori, P. G. Pagliuso, L. Walmsley, Z. Le, J. L. Cohn and S. B. Oseroff, Phys. Rev. B: Condens. Matter Mater. Phys., 2006, 73, 224404 CrossRef.
- Y. Huang, Y. Yu, Y. Yu and B. Zhang, Sol. RRL, 2020, 4, 2000037 Search PubMed.
Footnote |
| † Electronic supplementary information (ESI) available. See DOI: https://doi.org/10.1039/d4ya00023d |
| This journal is © The Royal Society of Chemistry 2024 |

