 Open Access Article
Creative Commons Attribution 3.0 Unported Licence
Intrinsic effects of electrolytes on lithium metal deposition and dissolution investigated through a separator-free cell†
Tomoki
Takahashi‡
,
Di
Wang‡
 ,
Jinkwang
Hwang
 * and
Kazuhiko
Matsumoto
 *
*
Graduate School of Energy Science, Kyoto University, Yoshida-honmachi, Sakyo-ku, Kyoto 606-8501, Japan. E-mail: matsumoto.kazuhiko.4c@kyoto-u.ac.jp; hwang.jinkwang.5c@kyoto-u.ac.jp
First published on 29th May 2024
Abstract
Lithium metal batteries are a significant promise for next-generation energy storage due to their high energy density. However, challenges persist in their commercialization stemming from issues during the lithium deposition/dissolution processes, such as low Coulombic efficiency, dendrite formation, and dead-lithium formation. Addressing these challenges requires careful electrolyte design to enhance the reversibility of the lithium metal negative electrode by modifying solvation structures and engineering interfaces. The Coulombic efficiency of lithium deposition/dissolution is one of the most crucial factors in evaluating the performance of electrolytes toward lithium metal, although this is influenced by various factors. In this study, a separator-free cell is adopted to minimize extraneous influences and focus on assessing the intrinsic effects of electrolytes on lithium deposition/dissolution. 48 different electrolytes based on three salts of Li[PF6], Li[FSA] and Li[TFSA] varying in solvents were investigated with or without additives. Moreover, Raman spectroscopy and X-ray photon spectroscopy enhance the discussion by revealing variations in the major species of solid electrolyte interphase components under different electrolyte conditions.
1 Introduction
Lithium-ion batteries (LIBs) have gained widespread popularity due to their long lifespan.1 Over the past three decades, their performance has significantly increased.2,3 However, the energy density of LIBs based on intercalation electrode materials is gradually approaching its theoretical limit, which fails to meet the increasing demands for higher energy densities in energy storage systems.4,5 Specifically, a target of 500 W h kg−1 has been set for next-generation secondary batteries, while conventional LIBs usually offer energy densities below 300 W h kg−1 (based on a LIB including active materials and cell-housing components).6–8 In response to this challenge, lithium metal batteries (LMBs), which employ lithium metal as the negative electrode material, have been attracting attention as the next-generation batteries to fulfill these demands.9–11 The use of lithium metal negative electrode is particularly promising, offering the lowest standard reduction potential (−3.04 V vs. SHE), which results in higher working voltages than any other negative electrodes, and a theoretical capacity that is about ten times higher than that of graphite (3860 mA h g−1vs. 340 mA h g−1 based on the charged state). Furthermore, the study on lithium metal negative electrode is expanding beyond current positive electrode materials to explore conversion-type positive electrode materials, such as in lithium–sulfur (Li–S) batteries and lithium–air (Li–air) batteries.12Despite the promising features of lithium metal negative electrodes, they face several challenges that limit their practical application in secondary batteries, one of which is the poor reversibility of lithium deposition/dissolution processes.13,14 Firstly, uneven lithium ion flux and surface defects can lead to dendritic lithium metal growth, worsening with cycling and increasing the risk of short circuits and fires due to potential piercing of the separator and contact with the cathode. Secondly, the high reactivity of lithium metal with the electrolyte leads to irreversible side reactions and the formation of solid electrolyte interphase (SEI). A robust and effective SEI can prevent further side reactions, while organic-dominated SEI with low ionic conductivity (for example, derived from commonly used carbonate electrolytes) degrades metal electrode performance. Furthermore, lithium deposition/dissolution accompanies significant volume changes and internal structure destruction, potentially damaging the existing SEI and leading to continuous consumption of the freshly exposed lithium metal and electrolyte. This process also led to the formation of inactive lithium, known as “dead lithium”, causing capacity loss. It is crucial to highlight that the mechanical properties of the SEI are highly dependent on a balanced composition. An optimal SEI should consist of a robust inorganic inner layer to improve reversibility and a flexible organic outer layer to accommodate the volumetric changes during cycling. These issues not only consume a large amount of electrolyte and active lithium but also increase battery impedance, leading to severe capacity degradation.15 To solve these problems, several strategies have been proposed focusing on electrolyte engineering,16–19 the formation of artificial SEI and interface modification,20–22 utilizing the three-dimensional structure of current collectors,23,24 and modifying separators.25,26
Among these strategies, electrolyte engineering stands out as an effective and facile method for enhancing battery performance and longevity.27,28 On one hand, the use of base solvents compatible with lithium metal, such as ethers and ionic liquids, offers relatively better reduction stability and robust SEI formation capabilities, resulting in improved reversibility of lithium deposition and dissolution.18,29,30 Another widely studied approach for stabilizing the SEI involves the use of additives. For example, the addition of FEC (fluoroethylene carbonate) has been reported to lead to the formation of a stable and LiF-rich SEI, effectively suppressing dendrite growth.16 Moreover, the concept of high-concentration electrolytes has facilitated the accessibility of lithium metal negative electrodes, bringing the role and impact of solvation chemistry in battery electrolytes into intensive focus.31 In this context, the Coulombic efficiency (CE) of lithium metal deposition and dissolution process on a current collector, typically Cu, serves as a crucial indicator of electrolyte performance.32–34 However, CE measurements are susceptible to various factors, making it difficult to reproduce results even with similar cell designs and complicating the comparison across different electrolytes. For instance, in the widely used lithium–copper coin cells lab level, the reversibility of lithium metal is significantly influenced by cell components, including the porous separator and spring,35–37 conventional polyolefin-based microporous separators play an essential role in electronically insulating the positive and negative electrodes while also regulating lithium-ion transport, which is a critical factor in lithium metal deposition/dissolution. Additionally, mechanical pressure plays a significant role in determining the morphology and cycling behavior of the ductile lithium metal.
Therefore, to focus on the electrolyte properties affecting the reversibility of lithium metal, other influencing factors need to be eliminated. This study aims to obtain comprehensive data on the impact of electrolytes on the deposition and dissolution of lithium metal. So thus, herein, separator-free cells are employed as shown in Fig. 1a and b, which replace the separator with a hollow spacer with a fixed thickness of 1 mm. The hollow tube-shaped space (thickness of 1 mm, outer diameter 20 of mm and inner diameter of 12 mm) is filled with the electrolyte, and the electrodes are separated by the liquid electrolyte, eliminating variability introduced by conventional separators. This setup also allows for minimizing external factors of the microporous separator and the impact of pressure on different performance evaluations. Meanwhile, commonly used lithium salts were examined, including Li[PF6], Li[FSA] (FSA− = bis(fluorosulfonyl)amide), and Li[TFSA] (TFSA− = bis(trifluoromethanesulfonyl)amide), as well as a variety of electrolyte solvents encompassing ethers, carbonates, sulfones, phosphates, and Ionic liquids. Additionally, two prevalent additives, FEC and LiNO3 were selected. A total of 48 combinations have been prepared using different concentrations of lithium salts, solvents, and additives. All the electrolyte species involved are shown in Fig. 1c.
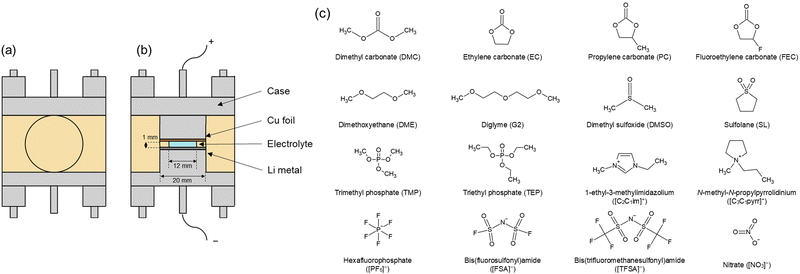 | ||
| Fig. 1 Schematic illustration of a separator-free cell: (a) Front and (b) cross-sectional views. (c) Anion, cation, and solvents species comprising electrolytes involved in the investigation. | ||
2. Experimental details
2.1 Materials
All the moisture- and air-sensitive materials were handled and prepared under a dry Ar gas atmosphere (H2O < 1 ppm and O2 < 1 ppm) in a glove box (Miwa Manufacturing Co., Ltd). All the prepared electrolytes are listed in Table S1 (ESI†). Three types of salts were used: Li[PF6] (Kishida Chemical, purity > 99.9%), Li[FSA] (Kishida Chemical, purity > 99.9%), and Li[TFSA] (Kishida Chemical, purity > 99.9%), and twelve types of solvents were employed (see Fig. 1c for abbreviation): SL (Kishida Chemical, purity > 99.5%), TMP (Kishida Chemical, purity > 99.0%), TEP (Kishida Chemical, purity > 99.0), DMC (Kishida Chemical, purity > 99.5%), PC (Kishida Chemical, purity > 99.5%), EC![[thin space (1/6-em)]](https://www.rsc.org/images/entities/char_2009.gif) :
:![[thin space (1/6-em)]](https://www.rsc.org/images/entities/char_2009.gif) DMC (1
DMC (1![[thin space (1/6-em)]](https://www.rsc.org/images/entities/char_2009.gif) :
:![[thin space (1/6-em)]](https://www.rsc.org/images/entities/char_2009.gif) 1 v/v, Kishida Chemical, purity > 99.5%), AN (Kishida Chemical, purity > 99.5%), DMSO (Kishida Chemical, purity > 99.0%), G2 (Kishida Chemical, purity > 99.0%), DME (Kishida Chemical, purity > 99.5%), [C3C1pyrr][FSA] (Kanto Chemical, purity > 99.9%), [C2C1im][FSA] (Kanto Chemical, purity > 99.9%), [C3C1pyrr][TFSA] (Kanto Chemical, purity > 99.9%), and [C2C1im][TFSA] (Kanto Chemical, purity > 99.9%). FEC (Kishida Chemical, purity > 99.5%) and LiNO3 (Sigma Aldrich, purity > 99.99%) were used for additives. Li[FSA], Li[TFSA], [C3C1pyrr][FSA], [C2C1im][FSA], [C3C1pyrr][TFSA], and [C2C1im][TFSA] were vacuum-dried at 60 °C for more than 24 h.
1 v/v, Kishida Chemical, purity > 99.5%), AN (Kishida Chemical, purity > 99.5%), DMSO (Kishida Chemical, purity > 99.0%), G2 (Kishida Chemical, purity > 99.0%), DME (Kishida Chemical, purity > 99.5%), [C3C1pyrr][FSA] (Kanto Chemical, purity > 99.9%), [C2C1im][FSA] (Kanto Chemical, purity > 99.9%), [C3C1pyrr][TFSA] (Kanto Chemical, purity > 99.9%), and [C2C1im][TFSA] (Kanto Chemical, purity > 99.9%). FEC (Kishida Chemical, purity > 99.5%) and LiNO3 (Sigma Aldrich, purity > 99.99%) were used for additives. Li[FSA], Li[TFSA], [C3C1pyrr][FSA], [C2C1im][FSA], [C3C1pyrr][TFSA], and [C2C1im][TFSA] were vacuum-dried at 60 °C for more than 24 h.
2.3 Cell assembly and electrochemical measurements
A separator-free cell shown in Fig. 1a and b was employed for electrochemical measurements. The working electrode was Cu foil, and the counter electrode was lithium metal with a diameter of 20 mm. Oxides on the Cu foil surface were removed with dilute hydrochloric acid and washed with ethanol in an atmospheric environment. The cell was subsequently assembled under an Ar atmosphere. Lithium metal was cut and shaped after removing the surface oxides. A spacer was placed between the electrodes, and the interior hollow of the spacer (inner diameter: 12 mm, thickness: 1 mm) was filled with the electrolyte.Lithium deposition/dissolution measurements were conducted using an electrochemical measurement apparatus (VSP, Bio-Logic Co). The operating temperature was maintained at 25 °C in a thermostatic chamber (SU221, ESPEC), and the tests were initiated after 3-hour rest. At a constant current density (1 mA cm−2), lithium was deposited onto the Cu foil (1 mA h cm−2), followed by the dissolution with the reversed current. The cutoff voltage was set at −0.5 V for the deposition reaction and +0.5 V for the dissolution reaction. The tests were conducted for 10 cycles.
2.4 Characterization
The SEI layer components were analyzed using X-ray photoelectron spectroscopy (XPS) (JEOL, JPS-9030, Mg Kα source). The electrodes after electrochemical tests limited to one cycle were washed with PC and THF (tetrahydrofuran), and then dried under vacuum. Raman spectra were recorded on a Raman instrument (Thermo Scientific, DXR3) using the 532 nm excitation line of a diode-pumped solid-state laser.3 Results and discussion
3.1 Cycle performance of Li metal deposition/dissolution
The lithium deposition/dissolution behavior on a Cu working electrode was scrutinized in separator-free cells for 46 different electrolytes, excluding Li[PF6] in either DME or G2 due to its low solubility (<1 M).38Table 1 collates the first and second CEs, the average CE for overall 10 cycles, and the overpotential at 0.2 mA h cm−2 during the second cycle of lithium deposition/dissolution test in the Li/Cu cell. The specific charge–discharge curves for each electrolyte are presented in Fig. S1–S3 (ESI†). In cases where the voltage fell below the cutoff or short-circuited to 0 V from the second cycle onward, preventing the same amount of lithium deposition, the CE was calculated for the preceding cycles. Otherwise, the CE was calculated for each cycle based on the ratio of the quantities of electricity during deposition (1 mA h cm−2) and dissolution.| Salt | Concentration | Solvent | Additive | 1st CE (%) | 2nd CE (%) | Average CE (%) | Overpotential (V) |
|---|---|---|---|---|---|---|---|
| a Electrolytes that lost cycle performance within 10 cycles. Average CE was calculated using data from only the 2nd cycle for 1 M Li[PF6]-TEP, the 2nd to the 7th cycles for 1 M Li[PF6]-EC:DMC 3 wt% FEC, the 2nd to the 4th cycles for 1 M Li[PF6]-DMSO, only the 2nd cycle for 1 M Li[FSA]-DME 3wt% LiNO3, the 2nd to the 6th cycles for 4 M Li[FSA]-DME, and the 2nd to the 3rd cycles for 1 M Li[TFSA]-TEP. | |||||||
| Li[PF6] | 1 M | SL | 26.4 | 39.1 | 48.7 | 0.177 | |
| Li[PF6] | 1 M | TMP | 5.2 | 7.2 | 7.2a | 0.302 | |
| Li[PF6] | 1 M | TEP | |||||
| Li[PF6] | 1 M | DMC | |||||
| Li[PF6] | 1 M | PC | 67.0 | 78.0 | 73.2 | 0.155 | |
| Li[PF6] | 1 M | EC:DMC | 54.8 | 76.3 | 84.6 | 0.125 | |
| Li[PF6] | 1 M | EC:DMC | 3 wt% FEC | 83.3 | 94.4 | 86.1a | 0.032 |
| Li[PF6] | 1 M | AN | |||||
| Li[PF6] | 1 M | DMSO | 19.3 | 29.7 | 27.1a | 0.112 | |
| Li[PF6] | 1 M | G2 | — | — | — | — | |
| Li[PF6] | 1 M | DME | — | — | — | — | |
| Li[FSA] | 1 M | SL | 68.3 | 84.2 | 81.5 | 0.072 | |
| Li[FSA] | 1 M | TMP | |||||
| Li[FSA] | 1 M | TEP | |||||
| Li[FSA] | 1 M | DMC | 1.1 | 2.0 | 2.5 | 0.184 | |
| Li[FSA] | 1 M | PC | 60.5 | 78.8 | 80.0 | 0.122 | |
| Li[FSA] | 1 M | PC | 3 wt% FEC | 85.4 | 92.5 | 92.7 | 0.167 |
| Li[FSA] | 4 M | PC | 89.6 | 92.4 | 88.4 | 0.118 | |
| Li[FSA] | 4 M | PC | 3 wt% FEC | 84.6 | 93.3 | 84.4 | 0.120 |
| Li[FSA] | 1 M | EC:DMC | 49.4 | 86.0 | 84.1 | 0.068 | |
| Li[FSA] | 1 M | EC:DMC | 3 wt% FEC | 89.0 | 90.0 | 84.4 | 0.094 |
| Li[FSA] | 4 M | EC:DMC | 82.4 | 89.1 | 88.7 | 0.070 | |
| Li[FSA] | 4 M | EC:DMC | 3 wt% FEC | 82.2 | 94.4 | 92.0 | 0.105 |
| Li[FSA] | 1 M | AN | |||||
| Li[FSA] | 1 M | DMSO | 21.3 | 34.9 | 34.4 | 0.054 | |
| Li[FSA] | 1 M | G2 | |||||
| Li[FSA] | 1 M | DME | 26.2 | 40.2 | 41.8 | 0.034 | |
| Li[FSA] | 1 M | DME | 3 wt% LiNO3 | 67.2 | 90.2 | 90.2a | 0.071 |
| Li[FSA] | 4 M | DME | 66.4 | 70.0 | 60.6a | 0.058 | |
| Li[FSA] | 20 mol% | [C3C1pyrr][FSA] | 44.1 | 71.9 | 68.1 | 0.094 | |
| Li[FSA] | 40 mol% | [C3C1pyrr][FSA] | 66.9 | 74.5 | 72.9 | 0.080 | |
| Li[FSA] | 20 mol% | [C2C1im][FSA] | 69.9 | 61.3 | 63.3 | 0.045 | |
| Li[FSA] | 40 mol% | [C2C1im][FSA] | 81.2 | 70.3 | 77.8 | 0.054 | |
| Li[TFSA] | 1 M | SL | 58.7 | 80.2 | 70.0 | 0.071 | |
| Li[TFSA] | 1 M | TMP | |||||
| Li[TFSA] | 1 M | TEP | 11.1 | 19.6 | 15.3a | 0.281 | |
| Li[TFSA] | 1 M | DMC | 4.4 | 7.7 | 3.2 | 0.201 | |
| Li[TFSA] | 1 M | PC | 44.4 | 83.0 | 83.7 | 0.134 | |
| Li[TFSA] | 1 M | EC:DMC | 57.2 | 87.1 | 90.3 | 0.070 | |
| Li[TFSA] | 1 M | EC:DMC | 3 wt% FEC | 77.0 | 73.2 | 87.5 | 0.078 |
| Li[TFSA] | 1 M | AN | |||||
| Li[TFSA] | 1 M | DMSO | |||||
| Li[TFSA] | 1 M | G2 | 15.8 | 16.8 | 16.4 | 0.065 | |
| Li[TFSA] | 1 M | DME | 19.3 | 13.1 | 10.7 | 0.091 | |
| Li[TFSA] | 1 M | DME | 3 wt% LiNO3 | 86.5 | 91.2 | 91.7 | 0.078 |
| Li[TFSA] | Saturated | DME | 26.5 | 60.9 | 60.5 | 0.116 | |
| Li[TFSA] | 20 mol% | [C3C1pyrr][TFSA] | |||||
| Li[TFSA] | 20 mol% | [C2C1im][TFSA] | |||||
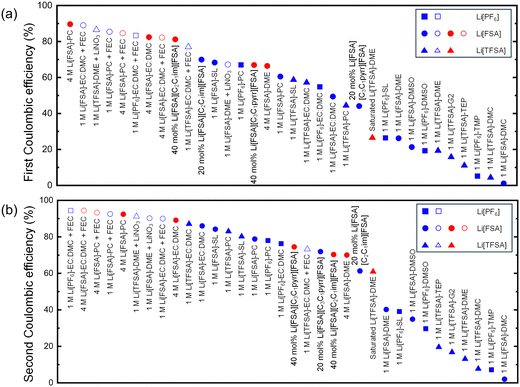
The performance of the investigated electrolytes is visually represented in a descending order of CE for the first (Fig. 2a) and second cycles (Fig. 2b), respectively. Overall, the use of the separator-free cell results in lower CEs compared to conventional coin cells with separators. For instance, 1 M Li[FSA] in DME exhibited an initial CE of only 26.2% and an average CE of merely 41.8%, significantly lower than the values of over 97% reported in the literature using PP separators.18 This discrepancy arises because separators in coin cells exert additional pressure on the electrode surface, thereby enhancing the density and reversibility of lithium deposition. However, in separator-free cells, the electrode distance is maintained by spacers, leading to no pressure on the electrolyte within these spacers and, consequently, insufficient interfacial pressure to anchor lithium metal on the electrode surface or reactivate generated dead lithium. Nonetheless, these cells minimize the impact of external factors from cell assembly and experimental handling, allowing for a focused examination of the key factors affecting the performance of the electrolyte itself. From the trends of CE in Fig. 2, these influencing factors can still be categorically divided into the type of solvent and salt, salt concentration, and the presence of additive. Each parameter will be further discussed in subsequent Sections in 3.2.
It is also noteworthy that in certain cycles, such as with 4 M Li[FSA]-EC:DMC + FEC, the 8th CE exceeded 100% (Fig. S2j, ESI†). Such an anomaly was included in the average value calculation because the CE exceeding 100% is attributed to “dead lithium” generated in earlier cycles becoming conductive again, and dissolving back into the electrolyte.39 Furthermore, results for electrolytes such as 1 M Li[PF6]-TEP, which fell below the cutoff voltage immediately after the first cycle, were excluded from the CE calculation due to almost no lithium being deposited. For the IL electrolyte containing 20 mol% Li[TFSA]-[C2C1im][TFSA] (Fig. S3l, ESI†), even when the cutoff voltage was set to ±2.5 V, it reached this limit during the first cycle's lithium deposition process, resulting in no reversible lithium deposition and dissolution reaction. In 20 mol% Li[TFSA]-[C3C1pyrr][TFSA] (Fig. S3k, ESI†), although the cell voltage reached the cutoff limit during the lithium deposition process in all cycles, a small amount of lithium dissolution was observed. These outcomes are likely due to the relatively high viscosity and low ionic conductivity of the TFSA-based ionic liquids,40 coupled with the increased overpotential due to the longer working distance of 1 mm in separator-free cells compared to traditional microporous separators (measured in tens of micrometers).
3.2 Parameters for Li metal deposition/dissolution
Notably, certain solvents such as AN, TEP, DMC, TMP, and DMSO exhibited similar behaviors. These solvents caused either an inability to cycle due to the reaction potential immediately reaching the cutoff voltage or a significantly low CE below 20% (Fig. S4, ESI†). This poor cyclability can be attributed to the chemical instability of the electrolytes. Electrolytes based on such as AN can be severely decomposed during lithium deposition. In fact, yellow decomposition products were observed in 1 M Li[FSA]-AN. AN spontaneously reacts with lithium metal, a strong reductant, which can lead to irreversible cycles.41 The absence of a correlation between the overpotential and the CE during the second cycle further supports the notion that the issue stems from the reductive stability of the electrolyte, rather than solvation, ion transport, or other kinetic factors (see Fig. S2, ESI†).
In contrast, SL, PC, and EC:DMC-based electrolytes show high CE. On the other hand, pure DMC solvents resulted in lower cycle performance; however, the inclusion of EC to form EC:DMC mixtures led to enhanced cycling performance. This improvement is attributed to the preferential formation of Li+ and EC pairs, which are believed to form stable SEI and inhibit further electrolyte decomposition.42 Upon comparing the CE of nine electrolytes derived from three distinct solvents (SL, PC, and EC:DMC) and salts (Li[PF6], Li[FSA], Li[TFSA]), a higher CE was not consistently attributed to specific solvents or salts (Fig. S5, ESI†). The results suggest that Li[PF6] with PC, Li[FSA] with SL, and Li[TFSA] with EC:DMC were good matches. However, 1 M Li[PF6]-SL shows a clearly lower CE.
The bad match between Li[PF6] and SL might be caused by the close reductive potentials of SL and [PF6]−.43 In contrast, [FSA]− and [TFSA]− undergo reductive decomposition at higher potentials, leading to the formation of inorganic SEI components such as LiF.
For subsequent experiments, PC was selected, which demonstrated high compatibility with all the three salts, to further analyze the composition of the SEI. Fig. 3 shows the results of XPS analysis for the PC-based electrolytes to characterize the composition of the SEI layer on Cu electrodes after one cycle.
 | ||
| Fig. 3 XPS analysis of the SEI layers formed on Cu foil in the 1 M Li[PF6]-PC, 1 M Li[FSA]-PC, and 1 M Li[TFSA]-PC. (a) F 1s, (b) Li 1s, and (c) C 1s regions. | ||
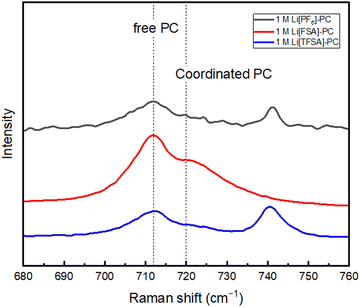
The F 1s spectra of the Cu substrates in 1 M Li[PF6]-PC, 1 M Li[FSA]-PC, and 1 M Li[TFSA]-PC electrolytes reveal the presence of LiF in the SEI across all the electrolytes with its quantity correlating with the CE value in the first cycle CE. It was further corroborated in the Li 1s spectra, where a significant increase in peaks attributed to LiF was observed in 1 M Li[PF6]-PC, consistent with the F 1s spectra. The exixitence of LiF in SEI, which contributes to the rigid frame due to its very low solubility, effectively enhances the reversibility of lithium deposition/dissolution process, despite that its detailed mechanism still remains a topic of debate in research.44 The C 1s spectra demonstrated peaks associated with the decomposition of the solvent, underscoring the solvent's contribution to the SEI formation under conventional salt concentrations. Fig. 4 shows the Raman spectra of three PC-based electrolytes. The peaks associated with free PC (712 cm−1) and solvated PC (720 cm−1) were observed across all the electrolytes.45 Although there are still some differences in SEI components by the type of salts, uncoordinated solvent molecules are prevalent and participate in SEI formation alongside inorganic components derived from anions under the condition of 1 M concentration.
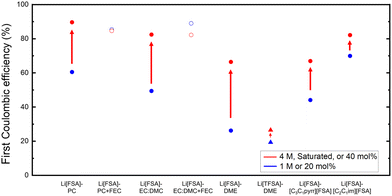 | ||
| Fig. 5 Effects of electrolyte concentration on the 1st cycle Coulombic efficiency of Li metal deposition/dissolution. | ||
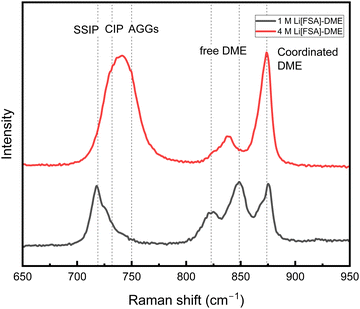
Fig. 6 illustrates the variation in Raman shift with increased concentration for Li[FSA]-DME. The peaks at 719, 732, and 750 cm−1 are attributed to the S–N–S bending mode of [FSA]− in solvent-separated ion pairs (SSIP), contact ion pairs (CIP), and ion aggregates (AGGs), respectively.46,47 Furthermore, the peaks around 823 and 849 cm−1 are assigned to the the C–O–C stretching mode of uncoordinated DME, while the peak around 874 cm−1 originates from DME coordinated with Li+. As the concentration increased, the peak intensity of uncoordinated DME decreased, while that of Li+-coordinated DME increased. Furthermore, the peak associated with SSIP declined, and the peak corresponding to AGGs appeared.
The composition of the SEI layer on Cu electrodes after one cycle was characterized using XPS for 1 M Li[FSA]-PC, 4M Li[FSA]-PC, and 1 M Li[FSA]-PC + FEC electrolytes. The F 1s, Li 1s, and C 1s spectra of the three electrolytes are shown in Fig. 7a, b and c, respectively. Focusing on 1 M Li[FSA]-PC and 4 M Li[FSA]-PC, the XPS analysis of the F 1s peak identified S–F and LiF as predominant components, indicating an increased presence of LiF in the 4 M electrolyte compared to the 1 M variant. This observation suggests a greater involvement of the decomposition of [FSA]− within the SEI layer. It is because, in highly concentrated electrolytes, the coordination structure around Li+ changes significantly, with Li+ being coordinated more by anions rather than solvent molecules. This transformation leads to the formation of a more stable and inorganic-rich SEI. The enhanced contribution of anions to SEI formation in highly concentrated electrolytes results in a more robust SEI that is less reactive with the electrolyte. The XPS analysis of the Li 1s peak is consistent with the F 1s spectra, revealing that the 4 M electrolyte contained a higher proportion of LiF within the SEI. The C 1s peaks indicate solvent decomposition in both the electrolytes.
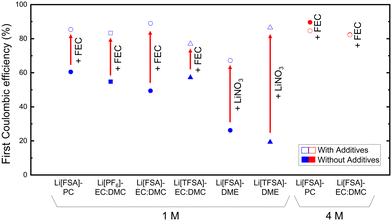 | ||
| Fig. 8 Effects of additives on the 1st cycle Coulombic efficiency of Li deposition/dissolution tests. Additive: FEC for carbonate electrolytes and LiNO3 for ether electrolytes. | ||
Conversely, at a higher concentration (4 M), the influence of FEC addition was minimal, which is likely due to the increase of ion pairs and aggregates at higher concentrations, causing the shift of reductive species from solvent to anion, resulting in the preferential reduction and decomposition of the anion as mentioned earlier. Hence, the incorporation of additives may not consistently yield favorable outcomes; it can also adversely affect bulk properties. For instance, additive can cause an undesirable increase in viscosity and a decrease in ionic conductivity, distinct from the benefits associated with higher concentrations.49 However, in the CEs during the first 10 cycles focused in this study, the introduction of a small amount of additives in high-concentration electrolytes, as well as in their derived localized high concentration electrolyte, still plays a crucial role in maintaining robust SEI for the electrolyte's long-term cyclability.50,51
4. Conclusions
In conclusion, this study exclusively assessed the impact of electrolytes on this fundamental process by employing a separator-free cell to minimize external influences on lithium metal deposition/dissolution. Comprehensively selected 48 electrolytes were prepared by varying solvent type, salt type, concentration, and the presence of additives. Among them, lithium deposition and dissolution tests were conducted on 46 electrolytes. Initially, evaluation focusing on electrolytes at a 1 M concentration revealed a number of free solvent molecules exist at this concentration and CE significantly depends on the type of solvent. Interestingly, carbonate solvents with FEC show very high CEs. In highly concentrated electrolytes, there was transformation in the coordination structure around Li+, characterized by an increase of coordinated solvents and CIP and AGGs anions, leading to an enhanced contribution of anions to the SEI formation. The inclusion of easily reducible solvents or salts as additives resulted in anion-derived SEI formation. It is worth mentioning that combining two approaches of increasing concentration and additives did not necessarily yield the highest CE.Separator-free cells stand as a pivotal guide to amplifying and focusing on the role of electrolyte itself. By enhancing the CE, these insights could better facilitate applications in more practical low-pressure cell systems. These comprehensive lithium deposition/dissolution results underline the potential of optimizing electrolyte to achieve higher efficiency and stability in lithium metal batteries, especially in environments where electrolyte and electrode interactions are critical for overall performance.
Author contributions
Tomoki Takahashi and Di Wang: investigation, data curation, visualization, writing – original draft. Jinkwang Hwang: conceptualization, methodology, investigation, writing – original draft, review & editing supervision. Kazuhiko Matsumoto: validation, supervision, funding acquisition, writing – review & editing, revision & suggestions.Conflicts of interest
There are no conflicts to declare.Acknowledgements
This study was supported by Grant-in-Aid for Scientific Research (B) conducted through the support of the Japan Society for the Promotion of Science (JSPS, KAKENHI Grant Number 19H02811). The authors express their gratitude to Prof. Hagiwara of Kyoto University for engaging in a fruitful discussion.Notes and references
- T. Kim, W. T. Song, D. Y. Son, L. K. Ono and Y. B. Qi, J. Mater. Chem. A, 2019, 7, 2942–2964 RSC.
- M. Li, J. Lu, Z. Chen and K. Amine, Adv. Mater., 2018, 30, 1800561 CrossRef PubMed.
- M. Winter, B. Barnett and K. Xu, Chem. Rev., 2018, 118, 11433–11456 CrossRef CAS PubMed.
- Q. Liu, X. Su, D. Lei, Y. Qin, J. Wen, F. Guo, Y. A. Wu, Y. Rong, R. Kou, X. Xiao, F. Aguesse, J. Bareño, Y. Ren, W. Lu and Y. Li, Nat. Energy, 2018, 3, 936–943 CrossRef CAS.
- C. Wang, C. Yang and Z. Zheng, Adv. Sci., 2022, 9, 2105213 CrossRef CAS PubMed.
- S. P. Li, F. Lorandi, J. F. Whitacre and K. Matyjaszewski, Macromol. Chem. Phys., 2020, 221, 1900379 CrossRef CAS.
- R. Van Noorden, Nature, 2014, 507, 26–28 CrossRef CAS PubMed.
- J. Betz, G. Bieker, P. Meister, T. Placke, M. Winter and R. Schmuch, Adv. Energy Mater., 2019, 9, 1803170 CrossRef.
- J. Liu, Z. N. Bao, Y. Cui, E. J. Dufek, J. B. Goodenough, P. Khalifah, Q. Y. Li, B. Y. Liaw, P. Liu, A. Manthiram, Y. S. Meng, V. R. Subramanian, M. F. Toney, V. V. Viswanathan, M. S. Whittingham, J. Xiao, W. Xu, J. H. Yang, X. Q. Yang and J. G. Zhang, Nat. Energy, 2019, 4, 180–186 CrossRef CAS.
- A. Varzi, K. Thanner, R. Scipioni, D. Di Lecce, J. Hassoun, S. Dörfler, H. Altheus, S. Kaskel, C. Prehal and S. A. Freunberger, J. Power Sources, 2020, 480, 228803 CrossRef CAS.
- D. Wang, J. Qiu, N. Inui, R. Hagiwara, J. Hwang and K. Matsumoto, ACS Energy Lett., 2023, 8, 5248–5252 CrossRef CAS.
- W. Cao, J. Zhang and H. Li, Energy Storage Mater., 2020, 26, 46–55 CrossRef.
- J. I. Lee, G. Song, S. Cho, D. Y. Han and S. Park, Batteries Supercaps, 2020, 3, 828–859 CrossRef CAS.
- B. Liu, J. G. Zhang and W. Xu, Joule, 2018, 2, 833–845 CrossRef CAS.
- L. Du, B. Zhang, C. Yang, L. Cui, L. Mai and L. Xu, Energy Storage Mater., 2023, 61, 102914 CrossRef.
- X. Q. Zhang, X. B. Cheng, X. Chen, C. Yan and Q. Zhang, Adv. Funct. Mater., 2017, 27, 1605989 CrossRef.
- X.-Q. Zhang, X. Chen, L.-P. Hou, B.-Q. Li, X.-B. Cheng, J.-Q. Huang and Q. Zhang, ACS Energy Lett., 2019, 4, 411–416 CrossRef CAS.
- J. Qian, W. A. Henderson, W. Xu, P. Bhattacharya, M. Engelhard, O. Borodin and J.-G. Zhang, Nat. Commun., 2015, 6, 6362 CrossRef CAS PubMed.
- S. Chen, J. Zheng, D. Mei, K. S. Han, M. H. Engelhard, W. Zhao, W. Xu, J. Liu and J.-G. Zhang, Adv. Mater., 2018, 30, 1706102 CrossRef PubMed.
- A. C. Kozen, C.-F. Lin, O. Zhao, S. B. Lee, G. W. Rubloff and M. Noked, Chem. Mater., 2017, 29, 6298–6307 CrossRef CAS.
- Y. Liu, D. Lin, P. Y. Yuen, K. Liu, J. Xie, R. H. Dauskardt and Y. Cui, Adv. Mater., 2017, 29, 1605531 CrossRef PubMed.
- L. Zhao, L. Du, H. Xu, J. Deng and L. Xu, ACS Appl. Energy Mater., 2023, 6, 9523–9531 CrossRef CAS.
- H. Zhao, D. Lei, Y.-B. He, Y. Yuan, Q. Yun, B. Ni, W. Lv, B. Li, Q.-H. Yang, F. Kang and J. Lu, Adv. Energy Mater., 2018, 8, 1800266 CrossRef.
- L.-L. Lu, J. Ge, J.-N. Yang, S.-M. Chen, H.-B. Yao, F. Zhou and S.-H. Yu, Nano Lett., 2016, 16, 4431–4437 CrossRef CAS PubMed.
- Y. Liu, Q. Liu, L. Xin, Y. Liu, F. Yang, E. A. Stach and J. Xie, Nat. Energy, 2017, 2, 17083 CrossRef CAS.
- H. Jia, C. Zeng, H. S. Lim, A. Simmons, Y. P. Zhang, M. H. Weber, M. H. Engelhard, P. Y. Gao, C. J. Niu, Z. J. Xu, J. G. Zhang and W. Xu, Adv. Mater., 2024, 36, 2311312 CrossRef CAS PubMed.
- S. H. Lee, J.-Y. Hwang, J. Ming, Z. Cao, H. A. Nguyen, H.-G. Jung, J. Kim and Y.-K. Sun, Adv. Energy Mater., 2020, 10, 2000567 CrossRef CAS.
- M. D. Tikekar, S. Choudhury, Z. Tu and L. A. Archer, Nat. Energy, 2016, 1, 16114 CrossRef CAS.
- Y. Y. Zheng, D. Wang, S. Kaushik, S. N. Zhang, T. Wada, J. Hwang, K. Matsumoto and R. Hagiwara, Energychem, 2022, 4, 100075 CrossRef CAS.
- J. Hwang, H. Okada, R. Haraguchi, S. Tawa, K. Matsumoto and R. Hagiwara, J. Power Sources, 2020, 453, 227911 CrossRef CAS.
- X. Chen and Q. Zhang, Acc. Chem. Res., 2020, 53, 1992–2002 CrossRef CAS PubMed.
- G. M. Hobold, J. Lopez, R. Guo, N. Minafra, A. Banerjee, Y. Shirley Meng, Y. Shao-Horn and B. M. Gallant, Nat. Energy, 2021, 6, 951–960 CrossRef CAS.
- J. Xiao, Q. Li, Y. Bi, M. Cai, B. Dunn, T. Glossmann, J. Liu, T. Osaka, R. Sugiura, B. Wu, J. Yang, J.-G. Zhang and M. S. Whittingham, Nat. Energy, 2020, 5, 561–568 CrossRef CAS.
- B. D. Adams, J. Zheng, X. Ren, W. Xu and J.-G. Zhang, Adv. Energy Mater., 2018, 8, 1702097 CrossRef.
- R. Rodriguez, R. A. Edison, R. M. Stephens, H.-H. Sun, A. Heller and C. B. Mullins, J. Mater. Chem. A, 2020, 8, 3999–4006 RSC.
- J. Ahn, M. Kim, J. Seo, S. Yoon and K. Y. Cho, J. Power Sources, 2023, 566, 232931 CrossRef CAS.
- H. An, Y. Roh, Y. Jo, H. Lee, M. Lim, M. Lee, Y. M. Lee and H. Lee, Energy Environ. Mater., 2023, 6, e12397 CrossRef CAS.
- L. Su, X. Zhao, M. Yi, H. Charalambous, H. Celio, Y. Liu and A. Manthiram, Adv. Energy Mater., 2022, 12, 2201911 CrossRef CAS.
- F. Liu, R. Xu, Y. Wu, D. T. Boyle, A. Yang, J. Xu, Y. Zhu, Y. Ye, Z. Yu, Z. Zhang, X. Xiao, W. Huang, H. Wang, H. Chen and Y. Cui, Nature, 2021, 600, 659–663 CrossRef CAS PubMed.
- H. Matsumoto, H. Sakaebe, K. Tatsumi, M. Kikuta, E. Ishiko and M. Kono, J. Power Sources, 2006, 160, 1308–1313 CrossRef CAS.
- Y. Yamada, K. Furukawa, K. Sodeyama, K. Kikuchi, M. Yaegashi, Y. Tateyama and A. Yamada, J. Am. Chem. Soc., 2014, 136, 5039–5046 CrossRef CAS PubMed.
- Q. Li, Z. Cao, W. Wahyudi, G. Liu, G.-T. Park, L. Cavallo, T. D. Anthopoulos, L. Wang, Y.-K. Sun, H. N. Alshareef and J. Ming, ACS Energy Lett., 2021, 6, 69–78 CrossRef CAS.
- J. Alvarado, M. A. Schroeder, M. Zhang, O. Borodin, E. Gobrogge, M. Olguin, M. S. Ding, M. Gobet, S. Greenbaum, Y. S. Meng and K. Xu, Mater. Today, 2018, 21, 341–353 CrossRef CAS.
- Z. Li, L. Wang, X. D. Huang and X. M. He, Small, 2023, 20, 2305429 CrossRef PubMed.
- T. Doi, R. Masuhara, M. Hashinokuchi, Y. Shimizu and M. Inaba, Electrochim. Acta, 2016, 209, 219–224 CrossRef CAS.
- R. Okada, Y. Aoki, M. Oda, M. Nakazawa, M. Inaba and T. Doi, ACS Appl. Energy Mater., 2023, 6, 546–553 CrossRef CAS.
- Y. Zhao, T. Zhou, T. Ashirov, M. E. Kazzi, C. Cancellieri, L. P. H. Jeurgens, J. W. Choi and A. Coskun, Nat. Commun., 2022, 13, 2575 CrossRef CAS PubMed.
- Z. Wang, Y. Wang, C. Wu, W. K. Pang, J. Mao and Z. Guo, Chem. Sci., 2021, 12, 8945–8966 RSC.
- Y. Yamada and A. Yamada, J. Electrochem. Soc., 2015, 162, A2406 CrossRef CAS.
- H. Jia, J.-M. Kim, P. Gao, Y. Xu, M. H. Engelhard, B. E. Matthews, C. Wang and W. Xu, Angew. Chem., Int. Ed., 2023, 62, e202218005 CrossRef CAS PubMed.
- Q.-K. Zhang, X.-Q. Zhang, J. Wan, N. Yao, T.-L. Song, J. Xie, L.-P. Hou, M.-Y. Zhou, X. Chen, B.-Q. Li, R. Wen, H.-J. Peng, Q. Zhang and J.-Q. Huang, Nat. Energy, 2023, 8, 725–735 CrossRef CAS.
Footnotes |
| † Electronic supplementary information (ESI) available: Detailed material preparation, physical and chemical data, additional electrochemical measurement data and results. See DOI: https://doi.org/10.1039/d4ya00245h |
| ‡ Equal contribution. |
| This journal is © The Royal Society of Chemistry 2024 |

