DOI:
10.1039/D4YA00376D
(Paper)
Energy Adv., 2024,
3, 2972-2985
Effect of Zn/Mn on the supercapacitor behavior of high-entropy FeCoNiCrZn/Mn alloy†
Received
12th June 2024
, Accepted 23rd September 2024
First published on 24th September 2024
Abstract
High-entropy alloys (HEAs) are emerging as potential electrode materials for energy storage owing to their unique multivalent transition states. Herein, we demonstrate the supercapacitor behavior of an HEA consisting of structural elements (earth abundant metals) iron, cobalt, nickel, chromium, and zinc (FeCoNiCrZn). The role of zinc as a replacement for manganese in FeCoNiCrZn/Mn was studied. The highest specific capacitance obtained was ∼556 F g−1 at 5 mV s−1 in an aqueous electrolyte. Further, an asymmetric liquid-state device was fabricated, which demonstrated the highest capacitance of 98 F g−1 at 1 A g−1 with a specific energy density of 34.8 W h kg−1 at a specific power density of 800 W kg−1. Detailed microscopy and spectroscopy analyses provided insights into the electrochemical behavior of individual elements in the HEA. Experimental observations were further supported by density functional theory (DFT) calculations, which showed d-band shifts in each individual element and the synergistic nature of the FeCoNiCrZn HEA compared to its individual nanoclusters.
Introduction
In the last few decades, the evolution of high-entropy alloys (HEAs) has attracted the attention of researchers because of their chemical homogeneity, higher electrocatalytic activity with multielement framework, and high entropy effects.1,2 In addition, two well-known core effects directly impact the electrochemical reactions in multi-metallic HEAs: the “cocktail effect”,3 where all components of the alloys dangle over the surface (five or more metallic elements) and are susceptible to the chemisorption of analytes, and “lattice distortion”,4 which directly alters localized atomic spacing (both available in the form of tensile and compressive strain due to differences in atomic radii) and benefits electrochemical activity by providing an easy electrolytic interaction path for electrolytic ions.5 Owing to the above high-entropy characteristics, these alloys have found application in electrochemical energy storage,6 energy conversion,7,8 electrocatalysis,9 gas storage and sensing,10 electromagnetic wave adsorption,11 environment and radiation protection,12 and Zn–air batteries.13 The energy-storage field with respect to supercapacitors has been seldom explored with HEAs. In this regard, it is the right time to develop a novel low-cost HEA and study its activity towards electrochemical energy storage. Among different HEA-based supercapacitors, AlCoCrFeNi,14 FeNiCoMnMg,15 (CrMnFeCoNi)3O4,16 rHEO-CNT,17 HEA-nitrides,18 and K(MgMnFeCuNi)Fe(CN)619 have been preferred for supercapacitor applications. Recently, we have reported the supercapacitor behavior of an HEA (FeCoNiCrMn) with multistructural elements.20 A detailed spectroscopy analysis concluded that manganese plays a crucial role in supercapacitor behavior because of its multivalent states. It would be interesting to explore the supercapacitor behavior of HEAs consisting of the well-reported element zinc as a replacement for manganese. Therefore, in this article, FeCoNiCrZn HEA was prepared using induction melting and subsequent high-energy ball milling to form a flake-like porous HEA. In-depth structural, morphological, and surface analyses were performed, followed by three-electrode electrochemical analysis. Furthermore, an asymmetric liquid-state device was fabricated with activated carbon as the negative electrode. Surface characteristics, such as BET, zeta potential, and pore-size distribution, were determined as these affect the electrochemistry. Post-electrochemical analyses, such as XPS and FESEM, were performed to understand chemical compositional changes and morphological stability after long continuous cycling processes. In order to understand the role of zinc over manganese in the FeCoNiCrZn HEA, we compared spectroscopy and microscopy analysis results for the HEA before and after the electrochemical reaction.20 The different electrochemical pathways were compared for FeCoNiCrZn and FeCoNiCrMn. In addition, DFT calculations showed that the d-states near the Fermi level were significantly increased in FeCoNiCrZn HEA compared to in the individual atom nanoclusters.
Experimental section
Synthesis of FeCoNiCrZn HEA
The aforementioned metals and N-methyl-2-pyrrolidone were purchased from Loba Chemicals (India). Potassium hydroxide (KOH), carbon black, activated carbon, and PVDF were obtained from Sigma Aldrich. Equimolar ratios were measured and induction melted to synthesize the HEA in a sealed argon environment at 1350 °C. The melting was repeated three to four times to ensure a homogeneous mixing of the elements. Additionally, the ingot was homogenized for 96 h at 1000 °C and furnace cooled. Later the sample was milled in a vibratory ball mill to form HEA powders for further usage.
Characterization
Optical images of the single-phase bulk Fe–Co–Ni–Cr–Zn HEA were taken using a Leica DM2500M, Germany. X-ray diffraction was performed in the 2θ range of 10° to 90° with the aid of a Bruker d8 Advance instrument (source: Cu Kα radiation of 1.54 Å). Field emission scanning electron microscopy was performed using a Zeiss Sigma 300 system (Germany). Samples for high-resolution transmission electron microscopy analysis were prepared on a Cu-grid 400 mesh (Titan Themis 300 kV, Thermo fisher). X-ray photoelectron spectroscopy analyses before and after the electrochemical measurements were done using a Microprobe PHI Versa Probe (III) system with Al kα radiation (1486.7 eV). The Litesizer 500 instrument (model BM 10) was used to quantify the particle size and zeta potential. An iQ2 Autosorb (Quantachrome) Chem-BET analyzer was used to conduct the Brunauer–Emmett–Teller (BET) using the N2 adsorption–desorption isotherms.
Computational methodology
To gain further insights, first-principles calculations were carried out using density functional theory (DFT) (details of the software tools used are mentioned in our previous work20). Insights from the d-band center study were used to create the Fe–Co–Ni–Cr–Zn nanocluster in an equimolar concentration of the component elements. In order to prevent spurious interactions between the periodic pictures, a vacuum of 10 Å was imposed in each of the three orientations. The Brillouin zone was sampled at the Γ point for all the calculations with a plane wave cut-off of 450 eV. Using a conjugate gradient method, the 13-atom nanoclusters were totally relaxed until the energy reached 10−5 eV and force converged to 0.01 eV Å−1.
Results and discussion
Structural and morphological analyses
Fe–Co–Ni–Cr–Zn HEA was synthesized by a simple and cost-effective induction melting and later the samples were ball milled, as shown in the schematic representation in Fig. 1(a). Fig. 1(b) displays the XRD pattern of the FeCoNiCrZn HEA, with peaks at 43.66°, 50.85°, and 74.96°, belonging to the (111), (200), (220) planes, respectively, of the FCC (face center cubic) structure. Considering the (111) plane, the lattice constant was calculated to be 3.58 Å. Fig. 1(b) inset shows an optical image of the FeCoNiCrZn HEA bulk sample, which suggests a single uniform phase formation. Morphological details of the synthesized structure were obtained from the HRTEM images (Fig. 1(c)–(e)). A thin flake-like morphology along with agglomerated regions was observed in the bright-field TEM micrograph Fig. 1(c). The HRTEM image in Fig. 1(d) shows a thin section on the flake edge of the sample. The inverse FFT pattern was derived from the previous figure and is shown in Fig. 1(e). The inter-planar spacing was around 0.206 nm, corresponding to the (111) plane in the FCC structure, which was similar to that for the CrFeCoNiMn structure.21 The SAED ring pattern was also obtained, as depicted in Fig. 1(e) inset, where we mapped the corresponding (111), (200), and (220) planes. Fig. 1(g) depicts the morphology of FeCoNiCrZn HEA powder obtained after ball milling the bulk. The low-magnification images show the agglomerated growth of flake-like structures after ball milling. The particles displayed a uniform morphological wide network linkage with a porous flake architecture. This quinary HEA system can provide sufficient active sites, making the internal surface area of the porous structure accessible for electrolyte penetration during the electrochemical process. Furthermore, elemental mapping through EDS showed uniformity over the morphological distribution of Fe, Co, Cr, Ni, and Zn elements, as displayed in Fig. 1(g)–(k), respectively.
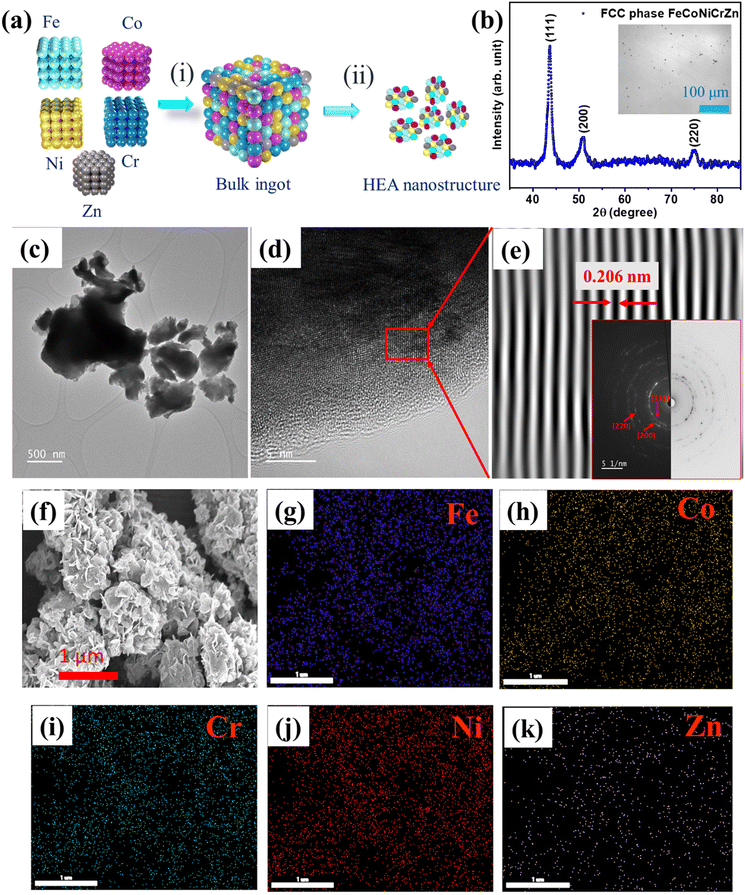 |
| | Fig. 1 (a) Schematic of the synthesis protocol: (i) induction melting and homogenized bulk sample, (ii) pneumatically actuated vibratory ball-milled sample, (b) XRD pattern; inset shows an optical image of the bulk sample, (c) Bright-field TEM micrograph of the ball-milled sample, (d) HRTEM micrograph of the milled sample, (e) Inverse FFT; inset shows the corresponding selected area ring diffraction pattern, (f) FESEM image of FeCoNiCrZn HEA, and (g)–(k) EDS elemental mapping of all the elements Fe, Co, Cr, Ni and Zn, respectively. | |
Chemical compositional analysis
Fig. 2(a) presents the XPS survey spectrum for determining the actual oxidation state associated with the FeCoNiCrZn HEA along with the elements mapped. The Fe 2p spectrum in Fig. 2(a) shows the primary peaks, corresponding to Fe2+, satellite, and Fe0 of Fe 2p3/2, respectively, at 711.56, 715.62, and 718.40 eV. Additional large peaks associated with Fe3+ and Fe2+ can be seen at 723.37 and 725.78 eV, respectively.22,23 Similarly, the deconvoluted peaks in Fig. 2(b) are located at 780.65 and 796.64 eV, respectively, and correspond to Co2+ and Co 2p1/2 of Co 2p3/2.24 The satellite peaks of Co 2p are referenced by other peaks at 784.90 and 802.78 eV.25 In a comparable manner, Fig. 2(c) displays the Ni XPS peaks. Ni 2p3/2 and Ni 2p1/2 show widely deconvoluted peaks at 855.59 and 873.11 eV, respectively. Ni2+ is the oxidation state of nickel. Additionally, Ni 2p's satellite peaks at 861.57 and 879.45 eV demonstrate the mixed valence state of Ni.26 Additionally, Fig. 2(d) displays Cr's XPS spectra. The peaks at 588.11 belong to Cr3+ and 576.40 and 586 eV, respectively, corresponding to Cr3+ of Cr 2p.27 Further deconvoluted XPS peaks of Zn can be seen in Fig. 2(e) at 1021.45 (2p3/2) and 1044.59 eV (2p1/2), respectively, corresponding to the Zn2+ state of Zn 2p.28Fig. 2(f) shows the survey spectrum of the distributed elements.
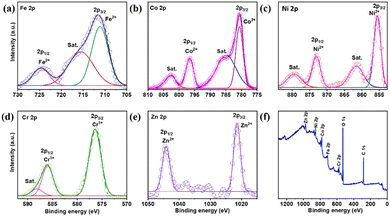 |
| | Fig. 2 XPS analysis of Fe–Co–Ni–Cr–Zn HEA. (a) Fe 2p spectrum, (b) Co 2p spectrum, (c) Ni 2p spectrum, (d) Cr 2p spectrum, (e) Zn 2p spectrum and (f) XPS survey spectrum. | |
The specific surface area, pore distribution, electrostatic interaction (zeta potential), and particle distribution were also analyzed to test the nature of the samples for the electrochemical activity of the system.29 Multi-point BET analysis was carried out to determine the specific surface area of the FeCoNiCrZn HEA. Fig. S1(a) (ESI†) shows the hysteresis loop from N2 adsorption/desorption over the pores of quinary HEA with a BET surface area of 56.11 m2 g−1. This high specific surface area of the FeCoNiCrZn high-entropy nanostructure is crucial for analyzing the interaction with electrolyte. Similarly, the pore distribution over the adsorption volume is shown in Fig. S1(b) (ESI†). The mesoporous structure (<50 nm) provides for possible interactions with electrolyte ions, boosting the specific energy of the supercapacitor. The dynamic electrostatic interaction of the HEA particles was studied based on the zeta potential. The mean zeta potential was found to be 14 mV for FeCoNiCrZn HEA (Fig. S1(c), ESI†). The positive zeta potential value signifies a more stable electrochemical double-layer formation with electrolytic ions. The average hydrodynamic particle size was obtained from DLS and was around 628 nm, indicating agglomerated particles (Fig. S1(d), ESI†).
Electrochemical performance of the FeCoNiCrZn HEA
The FeCoNiCrZn HEA electrode performance was studied in optimized 3 M KOH aqueous electrolyte. The CV scans were taken at a sweep rate of 5–200 mV s−1 between the stable potential window of −0.2 to 0.45 V (0.65 V) (Fig. 3(a)). From the CV analysis, the curves were neither pure rectangular nor showed a pure redox faradaic behavior, suggesting the sample contained both EDLC (capacitive) and faradaic behaviors.30 The higher cyclic area under the CV curves referred to the synergistic effect of all the quinary elements.
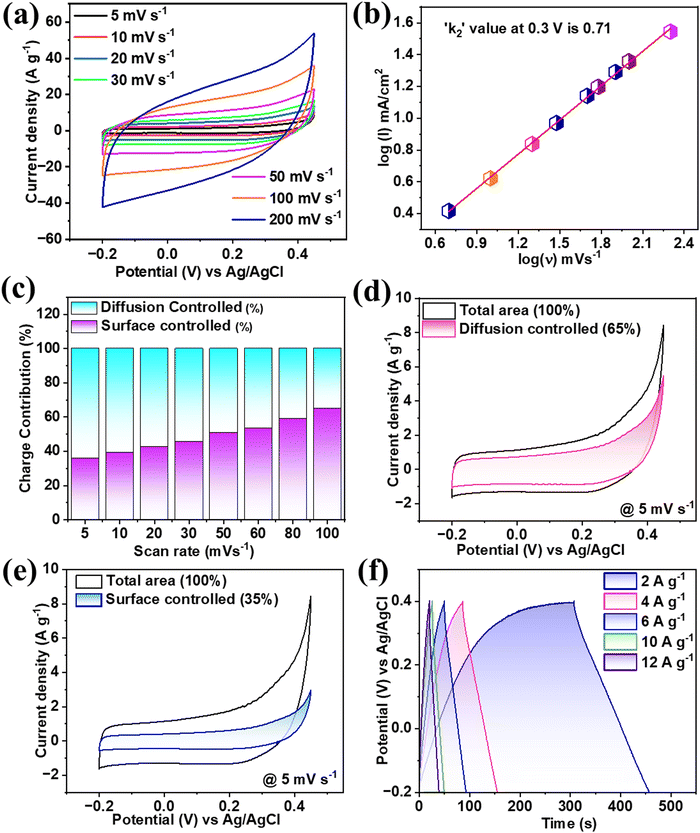 |
| | Fig. 3 (a) CV plots for various scan rates and (b) log(I) vs. log(ν), (c) Contribution (%) of each mechanism at various scan rates, (d) and (e) Current contribution at 5 mV s−1 for diffusion-controlled and surface-controlled mechanisms and (f) GCD plots at various current densities. | |
The contribution of EDLC and faradaic activities can be more precisely explained using the power law31 as given by eqn (1). According to which, the relation between the current over the scan rate is directly proportional (i = ν), which is purely EDLC, while i = ν1/2 refers to a purely faradaic nature. Therefore, the exact value of the proportionality power constant was calculated through the slope of the graph between log(i) vs. log(ν) providing k2. From Fig. 3(b), the value of k2 was estimated to be 0.71 at 0.3 V. This value suggests a mixed contribution from both mechanisms of energy storage.
Trasatati's group32 was the first to measure the distinction between surface-controlled and diffusion-controlled mechanisms for electrochemical processes. The relation between the voltammetric charge q(ν) at a particular scan rate was thus evaluated from the polygon area under CV. The value of q(ν) can be separated into two types as shown in eqn (2), which combines (i) qout, which comes from the outer surface-active electrode material exposed to the electrolyte, and (ii) qin, which is due to the inner redox activities associated with pores, grains, cracks, etc., which is directly proportional to ν−1/2. The above relation can be described as33
| | | q(ν) = qout + qin = qcapacitive + k3ν−1/2 | (2) |
| |  | (3) |
We then calculated the value of the total charge and the corresponding contribution above
qout and
qin from the intercept of the plot total charge and ν
−1/2 as per Fig. S2(a) (ESI
†). Further for each scan rate, the quantified percentage of both mechanisms to the total charge was as shown in
Fig. 3(c). From this, it could be observed that at a lower scan rate, the major charge accumulation is proposed to be due to a slow diffusion-controlled process. As the scan rate increases, the involvement of the surface-controlled mechanism becomes more dominant. From the above results, it was noted that the multivalent quinary FeCoNiCrZn electrode had limited diffusion-controlled processes for ion intercalation and deintercalation activities, with no changes in the original crystal structure of the quinary HEA or morphology.
A more detailed current contribution for the voltage instance can be expressed in terms of a combination of both capacitive surface-controlled mechanisms with a slow diffusion-control process concerning the scan rate as34
| |  | (5) |
By determining the values of
k5 and
k6, the exact value of the current response can be easily determined for a lower scan rate. Here, the current response for both mechanisms could be differentiated from the overall response, as shown in
Fig. 3(d) and (e). At the scan rate of 5 mV s
−1, a 65% contribution of slow-diffusion faradaic current and 35% surface-controlled current were observed. Therefore, electrolyte ions have an adequate duration for intercalation with the FeCoNiCrZn HEA quinary framework, showing a significant diffusion-controlled phenomenon. The specific capacitance was calculated using eqn (S1) (ESI
†) and noted to be 556.3 F g
−1 at 5 mV s
−1, while further increasing the scan rate for up to 40 times led to the value of
Cs dropping to 52.1%. GCD was performed on the FeCoNiCrZn HEA electrode between the potential ranges −0.2 to 0.4 V with a current density of 2–12 A g
−1, as shown in
Fig. 3(f). The characteristic behavior of the GCD curves was nonlinear, which followed the EDLC phenomenon along with slow faradaic pseudocapacitive associated with the multivalent FeCoNiCrZn HEA system. So,
Cs was evaluated using eqn (S2) (ESI
†), considering a negligible current drop. The maximum value of specific capacitance was 490 F g
−1 for a current rate of 2 A g
−1. With increasing the current rate up to six times, the capacitance retention value dropped to 80%. This practical capacitance retention provides good pseudocapacitive nature to the material, which signifies smooth electron transport through the porous structure with sufficient electrochemical interactions. The maximum specific capacitance obtained was around 490 F g
−1 for a standard current density of 2 A g
−1 in the three-electrode system, which is comparable to various pure HEAs, composites, as well as oxide-based electrodes. More specifically, our results were comparable with some similar HEA-based electrodes, as seen in
Table 1.
Table 1 Comparison of the specific capacitance of the HEA-based material reported in this work with other reported HEA-based materials
| Electrode material |
Synthesis method |
Morphology |
Electrolyte |
Potential window |
Specific capacitance |
Ref. |
| AlCoCrFeNi two-phase dissolution |
Selective phase dissolution |
Nanoporous structure |
2 M KOH |
−0.2 to 0.5 V |
700 mF cm−2 at 1 mA cm−2 |
14
|
| FeNiCoMnMg HEA-NPs/ACNFs |
CTS method |
Nanoporous structure |
6 M KOH |
0.0 to 0.8 V |
203 F g−1@1 mA cm−2 |
15
|
| (CrMnFeCoNi)3O4 |
Co-precipitation |
Quasi spherical |
2 M KOH |
0.0 to 0.45 V |
239 F g−1@0.5 A g−1 |
16
|
| (FeCoCrMnZn)3O4 |
Solid-state reaction |
Irregular particles and agglomeration |
1 M KOH |
0.15 to 0.5 V |
340.3 F g−1@0.5 A g−1 |
35
|
| rHEO-CNT |
Sol–gel method |
Connected nanoparticles in nanotubes |
1 M H2SO4 |
0.0 to 1.0 V |
157.5 F g−1 at 1 A g−1 |
17
|
| HEA-nitrides |
Mechanochemical-assisted synthesis |
Nanoflake architecture |
1 M KOH |
−1.0 to 0.0 V |
230 F g−1 at 10 mV s−1 |
18
|
| HEA-NP@MOL/HCPC |
Liquid-phase synthesis |
Cluster of nanoparticles |
1 M KOH |
−1.0 to 0.0 V |
495.4 F g−1 at 0.5 A g−1 |
25
|
| K(MgMnFeCuNi)Fe(CN)6 |
Mechanochemical |
Agglomeration |
1 M Na2SO4 |
0.2 to 1.0 V |
175 F g−1 at 5 mV s−1 |
19
|
| HEO/f-CSAC |
Grinding |
Cavity-type microstructure |
1 M NaCl |
0.0 to 1.0 V |
147.5 F g−1 at 1 A g−1 |
36
|
| (TiNbTaZrHf)C powder |
Facile electrochemical process |
Spherical nanoparticles |
1 M KOH |
−1.0 to 0.0 V |
95.2 F g−1 at 10 mV s−1 |
37
|
| (VNbTaZrHf)C |
Direct electro-deoxidation |
Dense block structure |
1 M KOH |
−0.7 to −0.2 V |
151 F g−1 at 10 mV s−1 |
38
|
| (Zr0.5Ti0.5Ce0.5Hf0.5)O7 |
Sol–gel synthesis |
Roughly rice-like |
1 M Na2SO4 |
−1.0 to 1 V |
703.3 F g−1 at 1 A g−1 |
39
|
|
FeCoNiCrZn nanoparticle
|
Induction melting, ball milling
|
Nanoflake architecture
|
3 M KOH
|
0.0 to 0.5 V
|
490 F g
−1
at 2 A g
−1
|
This work
|
Further, electrochemical impedance spectroscopy (EIS) measurements of the FeCoNiCrZn HEA electrode were carried out in the frequency range of 10 kHz to 1 Hz. The Nyquist plot was fitted by simple equivalent series resistance (ESR) and a constant phase eliminator (Fig. S2(C), ESI†). The value of Rs obtained from the intercept of the real impedance axis was around 4.01 Ohm cm−2, with this low series providing less resistance for ion interactions.40 The constant phase eliminator consists of two forms: (a) admittance (Y0), and (b) S, sn, where the value of n ranges from 0 to 1, and a value closer to 1 value refers to more capacitive.41 For this fitted circuit, ‘n’ was 0.81, which signifies a combination of both capacitive and faradaic interactions. In addition to EIS measurements, the cyclic stability of the FeCoNiCrZn HEA electrode in a three-electrode system was tested at 10 A g−1 for 5000 cycles (Fig. S2(b), ESI†). It was found that the capacity retention decreased to 85% when reaching 3000 cycles but further remained stable up to 5000 cycles. The initial and final charge–discharge curve, inset Fig. S2(b) (ESI†), at a current density of 10 A g−1 showed that the nature of the CV and GCD displayed very little change, signifying that the mechanism involved with the electrode remained intact even after 5000 continuous charge–discharge cycles.
Asymmetric liquid-state supercapacitor study
The higher energy density, long cyclic performance, along with wide potential window enables the FeCoNiCrZn HEA and activate AC to be cast as an ASC device. The mass loading in both electrodes was determine with the help of the charge balance equation, expressed as42| |  | (8) |
where m+, V+, CS+, and m−, V−, CS− are the mass loading, stable potential window, and specific capacitance for the FeCoNiCrZn and AC electrodes, respectively. Therefore, AC ranged from −1.0 to 0.0 V, while for the FeCoNiCrZn HEA it was (−0.2 to 0.45) with specific capacitances of 95.66 and 392.61 F g−1 (Fig. 4(a)). Putting the respective values in the above eqn (8), the ratio was found to be ∼0.37. Therefore, balanced weights of 1.81 mg of AC with 0.5 mg of FeCoNiCrZn HEA were used for fabricating the negative and positive electrodes, respectively. Detailed CV, GCD, as well as EIS analyses of the AC electrode are shown in Fig. S1(d)–(f) (ESI†). This ASC device voltage could be extended up to 1.6 V without any electrolyte disintegration, as confirmed from the CV's potential window of the three-electrode system. For more detailed understanding of the CV performance, scans were taken in between 0.8–1.6 V, as shown in Fig. 4(b). The CV plots (recorded between 5–200 mV s−1) were pseudo-rectangular, signifying the presence of pseudocapacitive with double-layer ion-adsorption characteristics (Fig. 4(c)). Also, the ion-interaction characteristics associated with the HEA framework contributed to a higher current response at the present scan rate. This was due to the high ionic conductivity, high ionic mobility, fast reversible redox activities, and higher ionic feasibility of the liquid-state device. We further explain the contribution of the individual elements for the electrochemical interactions.
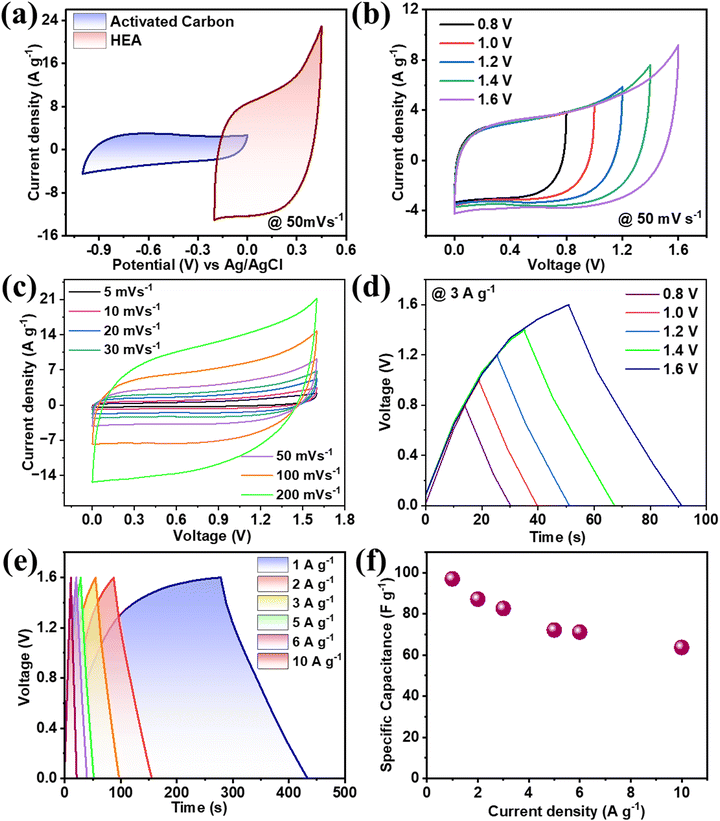 |
| | Fig. 4 (a) CV curves of AC and HEA for evaluating the charge balance at 50 mV s−1, (b) stability of the CV curves from 0.8–1.6 V at 50 mV s−1, (c) CV curves for different scan rates 5–200 mV s−1, (d) Stability of charge–discharge from 0.8–1.8 V at 3 A g−1, (e) charge discharge for different current densities and (f) Specific capacitance vs. current density. | |
GCD was studied between the voltage range 0–1.6 V at 3 A g−1 and no discontinuity was observed (Fig. 4(d)). The corresponding charge–discharge cycles were taken between 1–10 A g−1, which showed nonlinear characteristics that proved the pseudocapacitive nature of the material (Fig. 4(e)). The specific capacitance obtained was 98 F g−1 at a current rate of 1 A g−1, and even when increasing the current rate ten times the capacity retention was around 80% (Fig. 4(f)). This shows the multivalent and multi-redox active sites’ contribution to the FeCoNiCrZn HEA and the unique capacity phenomenon of the ASC device. Using eqn (S3) and (S4) (ESI†), the energy density and power density of the device were evaluated with specific energy of 34.84 W h kg−1 at specific power 800 W kg−1, as shown in Fig. 5(a). In comparison with various reported HEA-based materials, our device showed stable performance (Table 2).
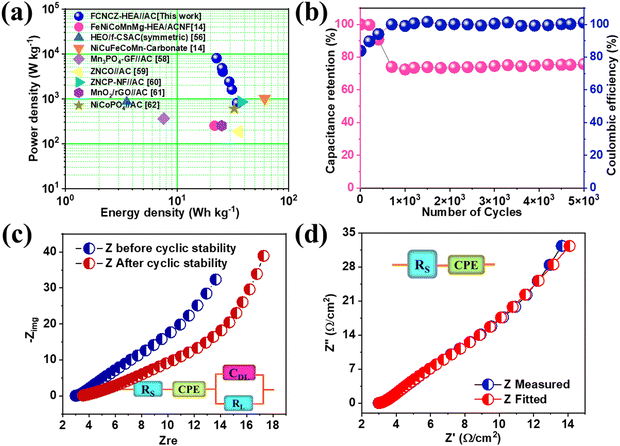 |
| | Fig. 5 (a) Ragone plot of the ASC device together with various HEA and liquid-state devices, (b) Cyclic stability with respect to coulombic efficiency for 5000 cycles, (c) Nyquist plots as measured and fitted and (d) EIS before and after cyclic stability with the fitted circuit before and after the stability tests for up to 5000 cycles shown in the inset. | |
Table 2 Comparison of the device reported in this work with some recently reported liquid-state devices
| Electrode material |
Specific capacitance (F g−1) |
Electrolyte |
Energy density (W h kg−1) |
Power density (W kg−1) |
Cyclic stability |
Ref. |
| Mn3(PO4)2 GF//AC |
28 F g−1 at 1 A g−1 |
6 M KOH |
7.6 |
360 |
96% after 10k cycle |
43
|
| ZNCO//AC |
113.9 F g−1 at 1 A g−1 |
6 M KOH |
35.6 |
187.6 |
90% after 3k cycles |
44
|
| ZNCP-NF//AC |
181.6 C g−1 at 0.2 A g−1 |
3 M KOH |
37.59 |
856.52 |
92.68% after 5k cycles |
45
|
| MnO2/rGO//AC |
45.25 F g−1 at 0.25 A g−1 |
1 M Na2SO4 |
25.14 |
250 |
— |
46
|
| Ni–Co–PO4//AC |
162.8 F g−1 at 1 A g−1 |
3 M KOH |
32.5 |
600 |
80.4% after 5k cycles |
47
|
| CaCu2O3//AC |
40.41 F g−1 at 1 A g−1 |
3 M KOH |
11.8 |
362.5 |
94% after 10k cycles |
48
|
| AgCoS@CNT//AC |
65 F g−1 at 1 A g−1 |
1 M KOH |
32 |
750 |
82% after 5k cycles |
49
|
| NixCo1−xP−2.5//AC |
115.8 F g−1 at 1 A g−1 |
2 M KOH |
31.52 |
700 |
98.3% after 10k cycles |
50
|
| NiCo2O4@MnO2//AC |
112 F g at 1 mA cm−2 |
1 M NaOH |
35 |
163 |
71% after 5k cycles |
51
|
| CoMoO4@NiMoO4//AC |
— |
2 M KOH |
28.7 |
262 |
99% after 3k cycles |
52
|
|
FeCoNiCrZn//AC
|
98 F g
−1
at 1 A g
−1
|
3 M KOH
|
34.8
|
800
|
83.8% after 5k cycles
|
This Work
|
The cyclic stability of a device can be studied through continuous charge–discharge cycles at 10 A g−1 for up to 5000 cycles. Fig. 5(b) shows the capacity retention along with the coulombic efficiency with respect to the number of cycles. The capacity retention was around 83.5% at 5000 cycles, showing the good capacity retention of the ASC device (initial and final CD in Fig. S3(d), ESI†). The initial decay is believed to be generated from the strong intercalation and respective ion absorption of the ion electrode's active material. The capacity remained stable when a stable electrochemical double-layer capacitance developed across the material. To further understand the contributions from the individual elements, individual surface oxidation reactions with aqueous KOH can be explained as follows,
| CoO2 + H2O + e− → CoOOH + OH− |
| Fe3O4 + 2OH− → 3Fe(OH)2 + 2e− |
| 3Fe(OH)2 + 2OH− → Fe3O4 + 4H2O + 2e− |
| CrO(OH) + OH− → CrO(OH)3 + e− |
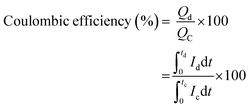
The coulombic efficiency was calculated to understand the capacitive behavior using
eqn (9). The initial coulombic efficiency was 83.8%, and after 5000 cycles, it was 101.16%. The value of coulombic efficiency greater than 100% for the aqueous asymmetric device was due to the undesirable side reactions associated with the FeCoNiCrZn HEA electrode with fast redox kinetics.
53 This higher coulombic efficiency and highly reversibly CV (fast kinetics) indicated a pseudocapacitive behavior.
54 An EIS study was performed for the device in the frequency range between 5 kHz to 100 MHz, as shown in
Fig. 6(d). The fitted circuit matched the experimental data, see
Fig. 6(e). The value of
Rs was evaluated from the
x-axis intercept, as 3.09 Ω, which defines the lower value of series resistance along with a constant phase eliminator (CPE)
Q. The fitted circuit showed the good penetration of electrolytic ions deep in to the electrode material. The constant phase eliminator was due to various factors, such as the electrolyte's nature, porosity, and slow diffusion, and disorder activities related to the electrochemical process.
55 Additionally, Nyquist plots were also plotted after 5000 cycles in
Fig. 6(c) along with the fitted circuit
Fig. 6(f), which showed that the nature of the frequency response or impedance characteristics remained unaltered (Additional device studies are described in detail in the ESI
†).
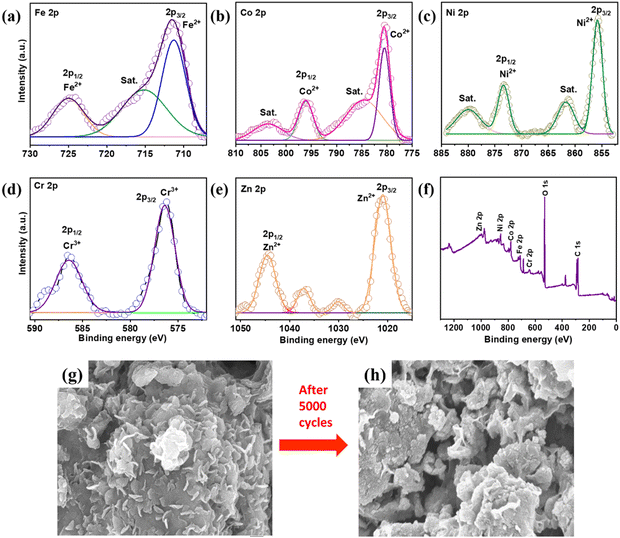 |
| | Fig. 6 XPS analysis of the Fe–Co–Ni–Cr–Zn HEA electrode after 5000 cycles: (a) Fe 2p spectrum, (b) Co 2p spectrum, (c) Ni 2p spectrum, (d) Cr 2p spectrum, (e) Zn 2p spectrum, (f) XPS survey of all the elements and (g) and (h) FESEM of the electrode before and after cyclic stability tests. | |
The chemical composition for the post-electrochemical activity was probed and detailed XPS analysis was done to study the morphological structural changes in the electrode material. Fig. 6(a)–(f) show the XPS results after 5000 cycles of intercalation–deintercalation. The post XPS studies showed that the products after electrochemical interaction retained their original composition with the surface oxidation state formation. Fig. 6(a) depicts the Fe 2p spectrum. Major peaks emerged at 711.56, 715.62, and 718.40 eV, representing Fe2+, satellite, and Fe0 of Fe 2p3/2, respectively.1 Other large peaks existed at 723.37 and 725.78 eV, corresponding to Fe3+ and Fe2+, respectively.2Fig. 6(b) shows deconvoluted peaks at 780.65 and 796.64 eV, corresponding to Co2+ and Co 2p1/2 of Co 2p3/2, respectively.3 Other peaks at 784.90 and 802.78 eV corresponded to the satellite peaks of Co 2p.4Fig. 6(c) shows the XPS peaks of Ni. Ni 2p3/2 and Ni 2p1/2 have substantially deconvoluted peaks at 855.59 and 873.11 eV, respectively. The oxidation state of Ni was Ni2+.5 Furthermore, the satellite peaks at 861.57 and 879.45 eV of Ni 2p indicated a mixed valence state of Ni. Similarly, Fig. 6(d) shows Cr's XPS spectrum. The peaks at 576.40 and 586 eV belonged to Cr3+ of Cr 2p, whereas the peak at 588.11 corresponded to Cr6+.6Fig. 6(e) shows that XPS peaks of Zn emerged at 1021.45 (2p3/2) and 1044.59 eV (2p1/2), corresponding to the Zn2+ state of Zn 2p. The large oxygen peak was related with the elements as a result of the spontaneous surface oxidation of quinary elements during ball milling with air.1 We also observed an increased intensity of oxygen peaks, associated with the redox reaction of multiple HEA elements present in the sample. A few peaks which were not to here referred were due to the mixed oxidation state of the elements along with satellite peaks. The peak intensity was increased and broadened for Fe 2p1/2. Whereas satellite peaks were less evident with the Co 2p peaks. Co 2p1/2 also showed a reduction compared to the pre-electrochemical measurements. The Ni XPS peaks were quite stable and remained unaltered. The Cr 2p1/2 peaks showed a broadened peak post-processing. The intensity of the Zn 2p1/2 peak was reduced and the satellite peaks were more prominent after continuous intercalation–deintercalation. Fig. 6(f) shows the XPS survey spectrum used to identify the accurate oxidation state associated with FeCoNiCrZn HEA, as well as the elements mapped. Fig. S6(a) (ESI†) shows a large oxygen peak, which occurred from the spontaneous surface oxidation of quinary elements during ball milling in the presence of air. The O 1s spectrum was split into two subpeaks for lattice oxygen (OL, M–O in metal oxide) (529.4 eV) and surface adsorbed oxygen (Ov) (532.4 eV). Fig. S7 (ESI†) shows the HRSTEM image in the HAADF mode, which clearly shows a thin oxide layer. We also confirmed the thin oxide layer in the observed diffraction patterns. After 5000 cycles, FESEM analysis (Fig. 6(g) and (h)) of the FeCoNiCrZn HEA electrode revealed its original structure with minimal change, highlighting its morphological stability even after continuous GCD cycles.
| |  | (9) |
where,
Qd,
Qc are the amount of charge associated with discharging and charging durations, respectively, and

refers to the respective integral area in the charge–discharge plots. Energy efficiency is a critical parameter to evaluate the performance of energy-storage devices. While the coulombic efficiency can be deduced from the data along the
x-axis of the
i–
V curve, energy efficiency utilizes the information of both the
x- and the
y-axes. HEA-based supercapacitors have a low coulombic efficiency due to variables such as charge redistribution, parasitic faradaic reactions, and ohmic leakage between electrodes. Using quinary elements offers synergistic and high entropy effects, resulting in a modest coulombic efficiency. Based on the above specifications, HEA-based supercapacitive materials have a modest energy efficiency. Energy efficiency is defined as the ratio of electrical energy drawn out from a device to the electrical energy required to put the energy-storage device back into the same state of charge. Voltage efficiency is defined as the ratio of discharge voltage to charge voltage of the energy-storage system. Fig. S5 (ESI
†) schematically shows the charge/discharge time and voltage of the different energy-storage systems as well as their recovered and stored energy.
| |  | (10) |
Theoretical studies
In order to further understand the contribution of each individual element, we used a d-band center approach. The FeCoNiCrZn HEA nanocluster has 13 atoms. Hence, it can be made equimolar when three units of three elements each and two units of two elements each are present. The electronic contribution of a metal increases when its d-band center is closer to the Fermi level.56 The order of closeness of individual elements with respect to the Fermi level is Cr > Ni > Fe > Co > Zn (Table 3). Hence, the ratio of the elements in the nanocluster is Cr![[thin space (1/6-em)]](https://www.rsc.org/images/entities/char_2009.gif) :
:![[thin space (1/6-em)]](https://www.rsc.org/images/entities/char_2009.gif) Ni
Ni![[thin space (1/6-em)]](https://www.rsc.org/images/entities/char_2009.gif) :
:![[thin space (1/6-em)]](https://www.rsc.org/images/entities/char_2009.gif) Fe
Fe![[thin space (1/6-em)]](https://www.rsc.org/images/entities/char_2009.gif) :
:![[thin space (1/6-em)]](https://www.rsc.org/images/entities/char_2009.gif) Co
Co![[thin space (1/6-em)]](https://www.rsc.org/images/entities/char_2009.gif) :
:![[thin space (1/6-em)]](https://www.rsc.org/images/entities/char_2009.gif) Zn: 3
Zn: 3![[thin space (1/6-em)]](https://www.rsc.org/images/entities/char_2009.gif) :
:![[thin space (1/6-em)]](https://www.rsc.org/images/entities/char_2009.gif) 3
3![[thin space (1/6-em)]](https://www.rsc.org/images/entities/char_2009.gif) :
:![[thin space (1/6-em)]](https://www.rsc.org/images/entities/char_2009.gif) 3
3![[thin space (1/6-em)]](https://www.rsc.org/images/entities/char_2009.gif) :
:![[thin space (1/6-em)]](https://www.rsc.org/images/entities/char_2009.gif) 2
2![[thin space (1/6-em)]](https://www.rsc.org/images/entities/char_2009.gif) :
:![[thin space (1/6-em)]](https://www.rsc.org/images/entities/char_2009.gif) 2.
2.
Table 3 Average d-band centres
| S. no. |
Element |
d-Band centres (eV) |
| 1 |
Cr |
−0.95 |
| 2 |
Fe |
−1.59 |
| 3 |
Ni |
−1.17 |
| 4 |
Co |
−1.71 |
| 5 |
Zn |
−6.29 |
The supercapacitance of a material is enhanced with increased d-states near the Fermi level.20,57 Density of states calculations showed that the d-states near the Fermi level were significantly increased in random FeCoNiCrZn HEA compared to the individual atom nanoclusters (Fig. 7). The redistribution of the electronic d-states was a maximum for the case of Ni and Co below the Fermi level, which indicates that Ni and Co make more contributions to the HOMO, whereas Fe has more hybridized d-states above the Fermi level, therefore, the LUMO has more contribution from Fe. The possible enhancement in the supercapacitance in HEA products could be understood from theoretical computations. Through these computations, we aimed to gain insights into the possible mechanism. However, the calculation was small-scale and did not consider several other factors which can affect supercapacitance, such as defect states, surface planes, surface area, redox mechanisms and other charge-state contributions. Most of the metals used in the current HEA will form a thin protective oxide layer, which will protect against further oxidation at room temperature. As a result, we did not observe oxide peaks in XRD and TEM. The surface oxide was very clear from XPS, but the metal state qualitatively confirmed that the thickness of the oxide layer was not very high. Hence the oxide layer (<5%) cannot affect the properties drastically. We did not include the oxidized HEA states in the theoretical calculations, as this is part of another study.
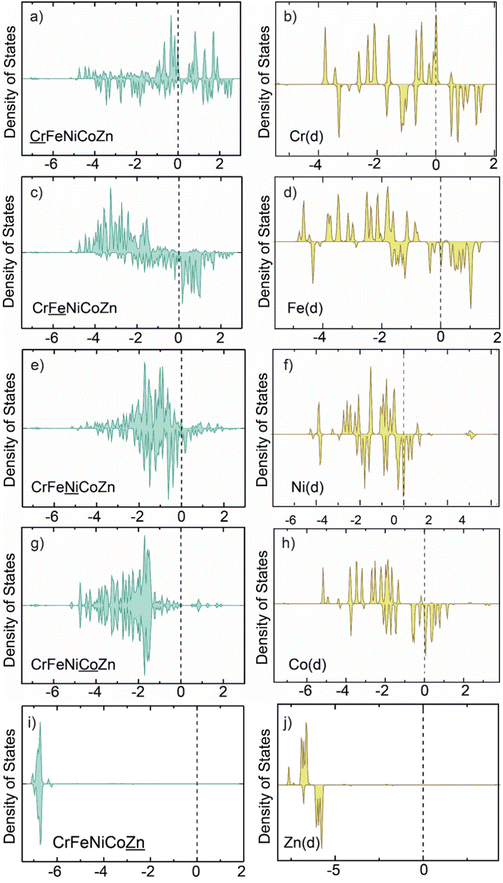 |
| | Fig. 7 d-States of Cr, Fe, Ni, Co, and Zn in CrFeNiCoZn HEA (a), (c), (e), (g) and (i) and in the individual nanocluster (b), (d), (f), (h) and (j). | |
Further, OH species were adsorbed on each individual atom nanocluster and the same atom in the HEA nanocluster (Fig. S8, ESI†). It was observed that Cr had the maximum change in adsorption energy as calculated by eqn (11). However, Zn showed the least change in adsorption energy of OH species. Fig. S9 (ESI†) shows the difference in adsorption energy of OH on each element of the HEA nanocluster and the individual element nanocluster.
| | | Eads(OH) = E(OH + nanocluster) − E(nanocluster) − (E(H2O) − 0.5 × E(H2)) | (11) |
Zn contribution in the FeCoNiCrZn/Mn HEA
In continuation of one of our previous works on FeCoNiCrMn,20 we replaced manganese with zinc in this study. We observed a higher specific area with a porous flake-like morphology distribution. The specific capacitance of FeCoNiCrMn was ∼386 F g−1 and we observed a ∼140% improved capacitance of 556 F g−1 for this work (@50 mV s−1). This improved capacitive behavior of the FeCoNiCrZn quinary HEA was attributed to transition between the oxidation states during the intercalation/deintercalation process. This was observed with the chemical integrity of the sample being analyzed previously in XPS studies (Fig. 6). Further probing into the binding energy shifts in the material, we could see that the Mn states (Fig. 8a) observed were shifted after cycling, whereas the Zn element showed very little change in its peak, as seen in Fig. 8b. Also, from theoretical studies we were able to observe a similar trend in the d-band shifts of the elements. We compared the k2 value for the same potential at 0.3 V, whereby k2 was 0.65 for FeCoNiCrMn and 0.71 for FeCoNiCrZn. In comparison with the d-band analysis, the replacement by zinc resulted in a higher reactivity of the capacitive elements, such as Fe, Co, Ni, which was further reflected in the specific capacitance results. When both alloys were compared for their electrochemical activity, they mimicked similar surface-controlled and diffusion-controlled processes for different scan rates. But as shown in Fig. 8(c), the diffusion-controlled process had the edge in FeCoNiCrMn, while for FeCoNiCrZn HEA, the surface-controlled process was more dominant due its higher specific surface area as well as tuned morphology. The diffusion- and surface-controlled processes contributions for both the HEAs for various rates can be seen in Fig. 8(d). Compared to our previous study on FeCoNiCrMn as a supercapacitor, the replacement of Mn with Zn led to a significant difference in the density of states near the Fermi level (EF) for Co and Cr. Zn has a maximum number of d electrons, due to which the difference between the d-band center and Fermi level is extremely large. In addition to that, the availability of d-states near the Fermi level is low (Fig. 8(e)–(h)). When Zn is introduced in a HEA system, the resulting density of states near the Fermi level is reduced as a direct consequence of shifting the d-band center. Therefore, the supercapacitance is modified in Zn-incorporated HEA systems.
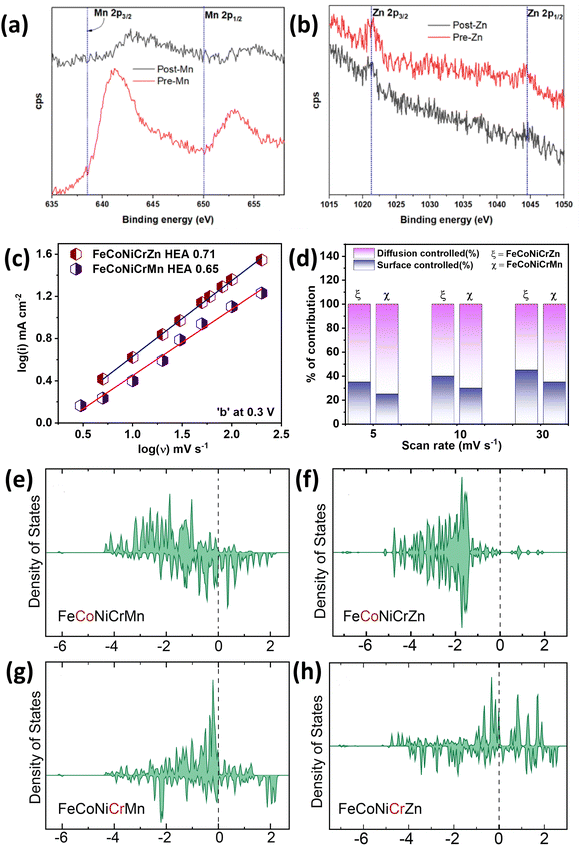 |
| | Fig. 8 Pre and post XPS analyses of (a) Mn and (b) Zn. (c) ‘k2’ value for FeCoNiCr (Zn and Mn) HEA at 0.3 V. (d) Diffusion- and surface-controlled process contributions for both the HEAs for various rates. DOS of FeCoNiCrMn (e) and (g) and FeCoNiCrZn (f) and (h). | |
Conclusions
The current study demonstrated the large-scale synthesis of FeCoNiCrZn HEA by induction melting and grinding. The HEA was then been utilized to fabricate an asymmetric supercapacitor device. The flake-like porous HEA's morphology, compositional, and structural characteristics resulted in a specific capacitance of 556 F g−1 at a 5 mV s−1 scan rate (CV), while for 2 A g−1 current density, it was around 490 F g−1 (GCD). For practical application, the HEA was fabricated as a liquid-state asymmetric (ASC) device. DFT study showed that the contribution of the d-band electron near the Fermi level enriched the supercapacitive kinetics of this FeCoNiCrZn HEA. The oxidation states and the d-band shifts contributed to the electrochemical activity in the material. Post-electrochemical characterizations showed the morphological and chemical stability of the material for long cycling of the device. Better electrochemical performance was observed for Zn inclusion in place of Mn in the high-entropy FeCoNiCrZn. Due to the asymmetric combination, the ASC device could endure for up to 1.6 V without electrolyte decomposition. The energy density obtained was around 34.8 W h kg−1 at 800 W kg−1. Such combined experimental and theoretical studies can help to build high-performance supercapacitors consisting of HEA materials.
Abbreviations
| HEA | High entropy alloy |
| XPS | X-ray photo electron spectroscopy |
| XRD | X-ray diffraction |
| FESEM | Field emission scanning electron microscope |
| HRTEM | High resolution transmission electron microscope |
| CV | Cyclic voltammetry |
| GCD | Galvanostatic charge discharge |
| EIS | Electrochemical impedance spectroscopy |
|
C
s
| Specific capacitance |
| NMP |
N-Methyl-2-pyrrolidene |
| PVDF | Polyvinylidene fluoride |
Author contributions
The manuscript was written through contributions of all authors. All authors have given approval to the final version of the manuscript.
Data availability
The data supporting this article have been included as part of the ESI.†
Conflicts of interest
There are no conflicts of interest to declare.
Acknowledgements
C. S. T. acknowledges a Core Research Grant of SERB, India. STARS project by MHRD India, DAE young scientist research award (DAEYSRA) and AOARD (Asian Office of Aerospace Research and Development) Grant no. FA2386-21-1-4014, FA2386-23-14034. Naval research board for the funding.
References
- N. K. Katiyar, S. Nellaiappan, R. Kumar, K. D. Malviya, K. G. Pradeep, A. K. Singh, S. Sharma, C. S. Tiwary and K. Biswas, Mater. Today Energy, 2020, 16, 100393 CrossRef.
- N. Kumar Katiyar, K. Biswas, J.-W. Yeh, S. Sharma and C. Sekhar Tiwary, Nano Energy, 2021, 88, 106261 CrossRef.
- S. Ranganathan, Curr. Sci., 2003, 85, 1404–1406 Search PubMed.
- J.-W. Yeh, S.-Y. Chang, Y.-D. Hong, S.-K. Chen and S.-J. Lin, Mater. Chem. Phys., 2007, 103, 41–46 CrossRef.
- T. Löffler, A. Ludwig, J. Rossmeisl and W. Schuhmann, Angew. Chem., Int. Ed., 2021, 60, 26894–26903 CrossRef PubMed.
- S. Chen, Y. Wang, G. Pu, Y. Xue, K. Zhang and Y. Huang, Energy Fuels, 2023, 37, 36–57 CrossRef CAS.
- A. Amiri and R. Shahbazian-Yassar, J. Mater. Chem. A, 2021, 9, 782–823 RSC.
- I. Hussain, C. Lamiel, M. Ahmad, Y. Chen, S. Shuang, M. S. Javed, Y. Yang and K. Zhang, J. Energy Storage, 2021, 44, 103405 CrossRef.
- N. Zhang, X. Chen, S. Liu, J. Meng, M. Armbrüster and C. Liang, ACS Appl. Mater. Interfaces, 2023, 15, 23276–23285 CrossRef CAS PubMed.
- Y.-F. Kao, S.-K. Chen, J.-H. Sheu, J.-T. Lin, W.-E. Lin, J.-W. Yeh, S.-J. Lin, T.-H. Liou and C.-W. Wang, Int. J. Hydrogen Energy, 2010, 35, 9046–9059 CrossRef CAS.
- Z. Yingzhe, C. Yudao, Q. Qingdong and L. Wei, J. Magn. Magn. Mater., 2020, 498, 166151 CrossRef.
- T. Yang, S. Xia, W. Guo, R. Hu, J. D. Poplawsky, G. Sha, Y. Fang, Z. Yan, C. Wang, C. Li, Y. Zhang, S. J. Zinkle and Y. Wang, Scr. Mater., 2018, 144, 31–35 CrossRef CAS.
- X. Cao, Y. Gao, Z. Wang, H. Zeng, Y. Song, S. Tang, L. Luo and S. Gong, ACS Appl. Mater. Interfaces, 2023, 15, 32365–32375 CrossRef CAS.
- K. Kong, J. Hyun, Y. Kim, W. Kim and D. Kim, J. Power Sources, 2019, 437, 226927 CrossRef CAS.
- X. Xu, Y. Du, C. Wang, Y. Guo, J. Zou, K. Zhou, Z. Zeng, Y. Liu and L. Li, J. Alloys Compd., 2020, 822, 153642 CrossRef CAS.
- B. Talluri, M. L. Aparna, N. Sreenivasulu, S. S. Bhattacharya and T. Thomas, J. Energy Storage, 2021, 42, 103004 CrossRef.
- M. S. Lal and R. Sundara, ACS Appl. Mater. Interfaces, 2019, 11, 30846–30857 CrossRef PubMed.
- T. Jin, X. Sang, R. R. Unocic, R. T. Kinch, X. Liu, J. Hu, H. Liu and S. Dai, Adv. Mater., 2018, 30, 1707512 CrossRef PubMed.
- W. Jiang, T. Wang, H. Chen, X. Suo, J. Liang, W. Zhu, H. Li and S. Dai, Nano Energy, 2021, 79, 105464 CrossRef.
- G. C. Mohanty, C. C. Gowda, P. Gakhad, M. Sanjay, S. Sarkar, K. Biswas, A. Singh and C. S. Tiwary, Mater. Adv., 2023, 4, 3839–3852 RSC.
- L. L. Xiao, Z. Q. Zheng, S. W. Guo, P. Huang and F. Wang, Mater. Des., 2020, 194, 108895 CrossRef.
- L.-Z. Miao, Y.-X. Guo, Z.-Y. Liu, Y. Li, J. Zhu and L. Wu, Chem. Eng. J., 2023, 467, 143451 CrossRef CAS.
- A. H. Phakatkar, M. T. Saray, M. G. Rasul, L. V. Sorokina, T. G. Ritter, T. Shokuhfar and R. Shahbazian-Yassar, Langmuir, 2021, 37, 9059–9068 CrossRef CAS.
- K. Huang, D. Peng, Z. Yao, J. Xia, B. Zhang, H. Liu, Z. Chen, F. Wu, J. Wu and Y. Huang, Chem. Eng. J., 2021, 425, 131533 CrossRef.
- E. Shen, X. Song, Q. Chen, M. Zheng, J. Bian and H. Liu, ChemElectroChem, 2021, 8, 260–269 CrossRef.
- S. Das, M. Sanjay, A. R. Singh Gautam, R. Behera, C. S. Tiwary and S. Chowdhury, J. Environ. Manage., 2023, 342, 118081 CrossRef.
- D. Zhang, S. Xu, T. Li, M. Zhang, J. Qi, F. Wei, Q. Meng, Y. Ren, P. Cao and Y. Sui, ACS Appl. Eng. Mater., 2023, 1, 780–789 CrossRef.
- L. Sharma, N. K. Katiyar, A. Parui, R. Das, R. Kumar, C. S. Tiwary, A. K. Singh, A. Halder and K. Biswas, Nano Res., 2022, 15, 4799–4806 CrossRef.
- K. Chen and D. Xue, J. Mater. Chem. A, 2016, 4, 7522–7537 RSC.
- N. R. Chodankar, H. D. Pham, A. K. Nanjundan, J. F. S. Fernando, K. Jayaramulu, D. Golberg, Y. Han and D. P. Dubal, Small, 2020, 16(37) DOI:10.1002/smll.202002806.
- J. Zhuo, Y. Zheng, S. Li and J. Sha, ACS Appl. Energy Mater., 2022, 5, 13627–13634 CrossRef.
- S. Ardizzone, G. Fregonara and S. Trasatti, Electrochim. Acta, 1990, 35, 263–267 CrossRef.
- C. Jo, I. Hwang, J. Lee, C. W. Lee and S. Yoon, J. Phys. Chem. C, 2011, 115, 11880–11886 CrossRef.
- X. Jia, Y. Zhao, X. Xu, Z. Xiao, S. Lv, F. Zhou, Q. Zhang, C. Chen, J. Liu and L. Wang, ACS Appl. Energy Mater., 2023, 6(1) DOI:10.1021/acsaem.2c03468.
- B. Liang, Y. Ai, Y. Wang, C. Liu, S. Ouyang and M. Liu, Materials, 2020, 13, 5798 CrossRef PubMed.
- M. S. Lal and R. Sundara, Electrochim. Acta, 2022, 405, 139828 CrossRef.
- J. Sure, D. Sri Maha Vishnu, H. Kim and C. Schwandt, Angew. Chem., Int. Ed., 2020, 59, 11830–11835 CrossRef PubMed.
- Y. Yang, B. Chen, J. Chen, L. Hu and M. Hu, Can. Metall. Q., 2022, 61, 389–397 CrossRef.
- P. Tang, Y. Cao, H. Li, M. Lu and W. Qiu, Ceram. Int., 2022, 48, 2660–2669 CrossRef.
- C. J. Raj, R. Manikandan, M. Rajesh, P. Sivakumar, H. Jung, S. J. Das and B. C. Kim, J. Power Sources, 2021, 490, 229518 CrossRef.
- L. K. Bommineedi, T. B. Deshmukh, A. Agarwal, N. Upadhyay, A. C. Mendhe, S. R. Sankapal, S. A. Pande and B. R. Sankapal, J. Taiwan Inst. Chem. Eng., 2023, 142, 104607 CrossRef.
- J. Cai, H. Niu, Z. Li, Y. Du, P. Cizek, Z. Xie, H. Xiong and T. Lin, ACS Appl. Mater. Interfaces, 2015, 7, 14946–14953 CrossRef.
- A. A. Mirghni, M. J. Madito, T. M. Masikhwa, K. O. Oyedotun, A. Bello and N. Manyala, J. Colloid Interface Sci., 2017, 494, 325–337 CrossRef.
- C. Wu, J. Cai, Q. Zhang, X. Zhou, Y. Zhu, P. K. Shen and K. Zhang, ACS Appl. Mater. Interfaces, 2015, 7, 26512–26521 CrossRef.
- X. Lei, S. Ge, Y. Tan, Z. Wang, J. Li, X. Li, G. Hu, X. Zhu, M. Huang, Y. Zhu and B. Xiang, ACS Appl. Mater. Interfaces, 2020, 12, 9158–9168 CrossRef.
- S. Jangu, B. K. Satpathy, M. Raju, C. Jacob and D. Pradhan, Dalton Trans., 2021, 50, 6878–6888 RSC.
- B. Li, P. Gu, Y. Feng, G. Zhang, K. Huang, H. Xue and H. Pang, Adv. Funct. Mater., 2017, 27, 1605784 CrossRef.
- G. Veerapandi, S. Prabhu, R. Ramesh, R. Govindan and C. Sekar, J. Energy Storage, 2022, 48, 104051 CrossRef.
- A. Al Ojeery, H. ul Hassan, S. A. Al Balawi, M. W. Iqbal, A. M. Afzal and N. M. A. Hadia, J. Phys. Chem. Solids, 2023, 180, 111473 CrossRef.
- Y. Xu, S. Hou, G. Yang, X. Wang, T. Lu and L. Pan, Electrochim. Acta, 2018, 285, 192–201 CrossRef.
- K. Xu, W. Li, Q. Liu, B. Li, X. Liu, L. An, Z. Chen, R. Zou and J. Hu, J. Mater. Chem. A, 2014, 2, 4795 RSC.
- Z. Zhang, H. Zhang, X. Zhang, D. Yu, Y. Ji, Q. Sun, Y. Wang and X. Liu, J. Mater. Chem. A, 2016, 4, 18578–18584 RSC.
- E. Pameté, L. Köps, F. A. Kreth, S. Pohlmann, A. Varzi, T. Brousse, A. Balducci and V. Presser, Adv. Energy Mater., 2023, 13(29) DOI:10.1002/aenm.202301008.
- P.-C. Gao, W.-Y. Tsai, B. Daffos, P.-L. Taberna, C. R. Pérez, Y. Gogotsi, P. Simon and F. Favier, Nano Energy, 2015, 12, 197–206 CrossRef CAS.
- J.-B. Jorcin, M. E. Orazem, N. Pébère and B. Tribollet, Electrochim. Acta, 2006, 51, 1473–1479 CrossRef CAS.
-
J. K. Nørskov, F. Studt, F. Abild-Pedersen and T. Bligaard, Fundamental Concepts in Heterogeneous Catalysis, John Wiley & Sons, Inc, Hoboken, NJ, USA, 2014 Search PubMed.
- Y. Guan, Y. Cong, R. Zhao, K. Li, X. Li, H. Zhu, Q. Zhang, Z. Dong and N. Yang, Small, 2023, 19(35) DOI:10.1002/smll.202301276.
|
| This journal is © The Royal Society of Chemistry 2024 |
Click here to see how this site uses Cookies. View our privacy policy here.  Open Access Article
 a,
Chinmayee
Chowde Gowda
 a,
Pooja
Gakhad
b,
M.
Sanjay
c,
Abhishek
Singh
 *b,
Koushik
Biswas
*ac and
Chandra Sekhar
Tiwary
 *ac
*ac


 refers to the respective integral area in the charge–discharge plots. Energy efficiency is a critical parameter to evaluate the performance of energy-storage devices. While the coulombic efficiency can be deduced from the data along the x-axis of the i–V curve, energy efficiency utilizes the information of both the x- and the y-axes. HEA-based supercapacitors have a low coulombic efficiency due to variables such as charge redistribution, parasitic faradaic reactions, and ohmic leakage between electrodes. Using quinary elements offers synergistic and high entropy effects, resulting in a modest coulombic efficiency. Based on the above specifications, HEA-based supercapacitive materials have a modest energy efficiency. Energy efficiency is defined as the ratio of electrical energy drawn out from a device to the electrical energy required to put the energy-storage device back into the same state of charge. Voltage efficiency is defined as the ratio of discharge voltage to charge voltage of the energy-storage system. Fig. S5 (ESI†) schematically shows the charge/discharge time and voltage of the different energy-storage systems as well as their recovered and stored energy.
![[thin space (1/6-em)]](https://www.rsc.org/images/entities/char_2009.gif) :
:![[thin space (1/6-em)]](https://www.rsc.org/images/entities/char_2009.gif) Ni
Ni![[thin space (1/6-em)]](https://www.rsc.org/images/entities/char_2009.gif) :
:![[thin space (1/6-em)]](https://www.rsc.org/images/entities/char_2009.gif) Fe
Fe![[thin space (1/6-em)]](https://www.rsc.org/images/entities/char_2009.gif) :
:![[thin space (1/6-em)]](https://www.rsc.org/images/entities/char_2009.gif) Co
Co![[thin space (1/6-em)]](https://www.rsc.org/images/entities/char_2009.gif) :
:![[thin space (1/6-em)]](https://www.rsc.org/images/entities/char_2009.gif) Zn: 3
Zn: 3![[thin space (1/6-em)]](https://www.rsc.org/images/entities/char_2009.gif) :
:![[thin space (1/6-em)]](https://www.rsc.org/images/entities/char_2009.gif) 3
3![[thin space (1/6-em)]](https://www.rsc.org/images/entities/char_2009.gif) :
:![[thin space (1/6-em)]](https://www.rsc.org/images/entities/char_2009.gif) 3
3![[thin space (1/6-em)]](https://www.rsc.org/images/entities/char_2009.gif) :
:![[thin space (1/6-em)]](https://www.rsc.org/images/entities/char_2009.gif) 2
2![[thin space (1/6-em)]](https://www.rsc.org/images/entities/char_2009.gif) :
:![[thin space (1/6-em)]](https://www.rsc.org/images/entities/char_2009.gif) 2.
2.


