
 Open Access Article
 This Open Access Article is licensed under a Creative Commons Attribution-Non Commercial 3.0 Unported Licence
Unlocking the potential of Ti3C2 electrodes: a data-driven capacitance prediction study†
Sanjith
Krishna
and
Afkham
Mir
 *
*
Chemical Engineering Department, Birla Institute of Technology and Science Pilani, Hyderabad Campus, Jawahar, Nagar, 500078, Telangana, India. E-mail: mirafkham@hyderabad.bits-pilani.ac.in; f20200742@hyderabad.bits-pilani.ac.in
First published on 21st October 2024
Abstract
In the dynamic realm of energy storage devices, supercapacitors (SCs) stand out as promising options. Among the various materials considered for SC electrodes, layered substances like Ti3C2 have drawn attention due to their outstanding electrochemical qualities, especially their impressive volumetric capacitance. This study focuses on assessing the predictive abilities of three machine learning models: Bayesian ridge regression (BRR), K-nearest neighbors (KNN), and artificial neural network (ANN) in estimating specific capacitance in Ti3C2-based supercapacitors. BRR offered reliable predictions with an R-squared (R2) value of 0.759 and a low root mean square error (RMSE) of 0.074. KNN excelled in predicting supercapacitor performance with an impressive R2 of 0.928 and a minimal RMSE of 0.040. However, the ANN model stood out as it could reveal the significance of various inputs much like the human brain's intricate functioning. It achieved a high R2 of 0.8929 with a low RMSE of 0.0493, demonstrating its proficiency in capturing complex relationships in the dataset. The precise tuning of hyperparameters further enhanced its accuracy. The use of SHAP (SHapley Additive exPlanations) values emphasized cation mobility, and scan rates as key contributing factors. These findings provide a strong foundation for utilizing machine learning to predict specific capacitance in Ti3C2-based supercapacitors. Researchers can benefit from these versatile tools for precise predictions, facilitating systematic supercapacitor design and enhancing our understanding of electrode materials.
1. Introduction
Energy storage technology has advanced significantly in recent years, and improving the performance of supercapacitors (SCs) as effective energy storage devices is becoming more and more important. These SCs are promising alternatives for energy storage, given their attributes of high power density, extended lifespan, and rapid charging capabilities.1 Furthermore, their potential contribution to renewable energy solutions, through the storage of energy in lightweight, cost-effective, and ecologically friendly materials, underscores their significance.2Among the diverse array of materials explored for this purpose, one class, namely layered materials, has garnered significant attention, and within it, MXene has emerged as an exceptional contender for supercapacitor electrodes, showcasing exceptional electrochemical properties.3 MXenes, characterized as 2D layered materials with a general formula of Mn+1XnTx (where n ranges from 1 to 3), possess a fundamental framework composed of an early transition metal (M), a metal or non-metal (A), carbon or nitrogen (X), and an end termination typically represented by F, O, OH, or Cl (T).4 Notably, when compared to other 2D materials, MXenes exhibit remarkable traits such as high mechanical flexibility,5 elevated energy density,6 and robust electrochemical performance,7 rendering them particularly suited as electrode materials for SCs.
Among the myriad of MXenes, one that has found significant application in supercapacitor synthesis is Ti3C2, distinguished by its remarkable volumetric capacitance, which can soar to values as impressive as 1500 F cm−3.8 The intricacies of the charge storage mechanism in Ti3C2MXene supercapacitors involve a harmonious interplay between electric double-layer capacitance (EDLC) and pseudo capacitance. The layered structure and expansive surface area of Ti3C2 MXene facilitate the congregation of ions at the interface between electrode and electrolyte, culminating in the formation of an electric double layer9 In addition, the participation of redox reactions at active sites on the MXene's surface contributes to pseudo capacitance, ushering in a process of reversible charge transfer between the electrode and electrolyte.10 This dual mechanism underscores the versatility of Ti3C2 MXene, enabling it to deliver a harmonious synergy of swift charge–discharge11 kinetics and augmented energy storage capacity. Thus, the prowess of Ti3C2 MXene positions it as a material with immense potential for driving high-performance supercapacitors. While earlier research has emphasized similar characteristics, our study takes a fresh approach by using Ti3C2's innate benefits inside a revolutionary machine learning framework. Unlike previous research, which frequently generalize over other MXenes, this study focusses particularly on Ti3C2, using tailored ML techniques that takes into consideration its distinctive characteristics, including specific surface area and unique charge storage mechanisms. This specificity not only improves the models' predictive accuracy but also sheds new light on the optimization of Ti3C2 for energy storage applications. By doing so, this study contributes to a deeper understanding of how Ti3C2's characteristics can be best exploited, setting a new benchmark for future research in the field.
Supercapacitor (SC) performance typically hinges upon a myriad of physical and chemical characteristics inherent to the system, encompassing factors such as specific surface,12 electrode thickness,13 electrolyte concentration,14 cation/anion mobility of the electrolyte,15 scan rate,16 and the working potential window17 to name a few. Wang and his colleagues18 recently conducted a study involving the assessment of charge storage in Ti3C2 using various lithium-containing electrolytes with distinct solvent types, including nitrile, carbonate, and sulfoxide-based solvents. Their findings revealed that the utilization of a carbonate-based solvent notably increases the charge stored in Ti3C2 compared to other solvent systems. Wang concluded that the chemical properties of the electrolyte solvent exert a substantial influence on the molecular and ionic arrangement within Ti3C2, leading to a direct correlation with the overall charge storage capacity. Similarly, it has been established that the adsorption and diffusion of ions within the electrolyte, as well as the process of charge transfer, exert a notable influence on capacitance.19 However, the process of experimentally assessing the electrochemical performance of Ti3C2-based supercapacitors based on these parameters is not only resource-intensive but also remarkably time-consuming. This challenge is compounded by the vast array of available configurations and materials, further emphasizing the complexity of the task at hand.20 In recent years, the combination of machine learning and material science has created new opportunities for the advancement of supercapacitor technology.21,22 However, despite the abundance of experimental data for Ti3C2-based supercapacitors, there has been a surprising dearth of research that use machine learning to forecast their electrochemical performance.23 This study is unique in that it uses machine learning (ML) not only as a supplemental tool, but as a primary component in revealing previously unknown insights into the particular capacitance and other essential features of Ti3C2 supercapacitors. This study establishes a robust predictive framework for high-performance supercapacitors by applying advanced ML models such as artificial neural networks (ANNs) and refining them to the unique characteristics of Ti3C2. This significantly reduces the reliance on trial-and-error experimentation, accelerating the development cycle. This approach represents a significant leap forward in the methodology used to design and optimize Ti3C2-based energy storage devices.
A substantial body of experimental data exists regarding the supercapacitance properties of Ti3C2, yet thus far, no machine learning-based insights have been extracted from this dataset. In previous instances, machine learning methodologies have been effectively harnessed to forecast properties of materials like MXenes, primarily by reducing the computational burden associated with density functional theory (DFT) calculations.24 For instance, research in this domain has demonstrated the potential of machine learning to expedite and enhance predictions of material properties,25 offering a promising avenue for the application of similar techniques to unlock hidden insights within the Ti3C2 supercapacitance dataset.
Likewise, machine learning models have found application in predicting pseudocapacitive properties across various MXene type.26 However, it's worth noting that these models have often overlooked the distinctive factors associated with individual MXenes, such as specific surface area and current density associated specifically with Ti3C2. Table 1, presented below, offers a comprehensive overview of the utilization of machine learning models in predicting properties of MXenes, with particular emphasis on Ti3C2.
| S. no. | MXene | Input features | Output parameters | ML models | Ref. |
|---|---|---|---|---|---|
| 1 | 85 MXene | DFT data | Locate band edges | Gaussian process regression | 27 |
| 2 | 1000 MXenes | Defect properties based on DFT | Ideal defects | Random forest, graph networks | 28 |
| 3 | 132 MXenes | DFT data | HER catalytic capacity | Random forest, ANN, KRR, SVR | 29 |
| 4 | 85 MXenes | Atomic empirical radius, atomic van der Waals radius, electronegativity, atomic, s-orbital electron number, first ionization energy. | Stability | Random forest, KNN, Logistic regression, SVM and Gaussian NB | 30 |
| 5 | 66 MX and 792 MAX | DFT data | Synthesis possibility | Positive and unlabelled learning | 31 |
| 6 | 450 MXenes | DFT data (electronic properties) | Pseudo capacitance | Crystal graph convolutional neural network | 32 |
| 7 | Ti3C2 | Experimental values of specific capacitance, cation and anion ion mobility, electrolyte concentration, scan rate, cell configuration, and potential window | Specific capacitance | KNN, ANN, BRR | This work |
In this study, we introduce machine learning (ML) frameworks to develop a predictive model bridging experimental data of specific capacitance, cation and anion ion mobility, electrolyte concentration, scan rate, cell configuration and potential window and electrolyte properties. This framework is pivotal for enabling the methodical design of Ti3C2-based supercapacitors. To scrutinize the impact of these seven crucial parameters, we meticulously curated 84 raw training data points encompassing a range of experimental scenarios from our extensive dataset. Our research scrutinized the predictive capabilities of three distinct ML algorithms (KNN, BRR, and ANN), with the artificial neural network (ANN) helping us quantify the weights of different input parameters. ANN successfully establishes a comprehensive ML model boasting a coefficient of determination (R2) as high as 0.89 and a very low root mean square error (RMSE) of just 0.049. KNN model gave us the best fit with the highest value of R2 as 0.93. These outcomes provide profound guidance for shaping future designs of Ti3C2-based supercapacitors.
One of the primary limitations of this study is the relatively small size of the dataset used for training and testing the machine learning models. The dataset, consisting of 84 raw data points, was curated from approximately 100 recent academic publications. However, the number of papers specifically focused on Ti3C2 supercapacitors is limited. Moreover, only a subset of these papers provided the complete set of experimental data necessary for our selected features, such as specific surface area, cation/anion mobility, and scan rate. This constraint on data availability may limit the generalizability of our findings. While machine learning techniques have proven effective in extracting insights from small datasets,33 future research with more extensive datasets will be crucial for validating and expanding upon the results presented here. Despite this limitation, the findings offer valuable preliminary insights and lay the groundwork for further exploration in the domain of Ti3C2-based supercapacitors.
The unique contributions made by this study are as follows:
• First-ever machine learning study on Ti3C2-based super: this research pioneers the application of machine learning models to predict, from experimental data, the capacitance of Ti3C2-based supercapacitors. Earlier studies have focused broadly on MXenes.34
• Exploration of diverse ML models: the study evaluates the performance of three advanced machine learning models—K-nearest neighbors (KNN), artificial neural networks (ANN), and Bayesian ridge regression (BRR)—to forecast specific capacitance, assessing their accuracy and robustness.
• Novel insights using SHAP analysis: this work reveals hitherto unexamined connections that affect Ti3C2 supercapacitor performance by using SHAP values to highlight important parameters like cation mobility and scan rate.
• Extensive dataset and model optimization: the study includes finely calibrated machine learning models designed for forecasting particular capacitance in Ti3C2 materials, together with a carefully selected dataset based on experimental settings. These techniques provide useful tools for expediting the design of supercapacitors.
The manuscript is structured as follows. Section 2 outlines the methodology used to curate the dataset and develop the machine learning models. In Section 3, the results of the model evaluations are presented, including the predictive performance of the KNN, ANN, and BRR models, along with insights derived from the SHAP analysis. Finally, Section 4 concludes the study by summarizing the key findings and suggesting future directions for research on Ti3C2-based supercapacitors and machine learning-guided design optimization.
2. Methodology
The dataset employed for constructing the machine learning models in this study was sourced from an extensive review of around 100 recent academic publications. While these surveyed research works provided substantial information, it's worth noting that only a limited subset furnished the complete array of data required for our feature selection process. Many of the studies we scrutinized did not include the specific numerical data essential for defining critical electrode structural attributes. The judicious selection of input characteristics plays a pivotal role in ensuring the accuracy and effectiveness of our machine-learning models.We incorporated a range of features rooted in electrode structural properties and chemical attributes. These encompassed the specific surface area, cation and anion mobility, electrolyte concentration, scan rate, current density, cell configuration, potential window, sheet thickness, and the weight percentage of Ti3C2. The inclusion of these features was aimed at comprehensively capturing the intricate nuances and complexities inherent in supercapacitor experimental research. Notably, the specific capacitance (measured in F g−1) served as the target output feature for the Ti3C2-based electrode materials.
The integration of this extensive set of features was imperative to fully encapsulate the wide spectrum of variations observed in experimental work. Our intention to encompass the complete scope of experimental diversity is further underscored by the substantial upper limit of specific capacitance, reaching up to 1850 F g−1, within the dataset used to train our machine learning models.
2.1 Machine learning pathway
The specific capacitance (F g−1) was selected as the target feature due to its prevalence in the reviewed research papers. Other capacitance measurements, such as volumetric and areal capacitance expressed in (F cm−3) and (F cm−2), were infrequent in the literature. Therefore, to maintain consistency in the dataset, we focused exclusively on specific capacitance. Unnecessary or redundant features were deliberately avoided to streamline the training process without compromising model accuracy. Consequently, we excluded the upper and lower limits of the potential window, incorporating only the absolute value of the potential window derived from the GCD test. All input variables were then classified according to the types of input parameters into three groups, which are shown in Table 2. These are: (i) electrode characteristic features including specific surface area, Sheet thickness, and weight % of Ti3C2; (ii) electrolyte properties including cation mobility, anion mobility, and electrolyte concentration; (iii) experimental parameters and measurement conditions: including scan rate, current density, working potential window and cell configurations. Subsequent to the data collection phase, a rigorous filtration process was applied to enhance dataset quality as shown in Fig. 1. Data points with fewer than seven available features were removed from consideration. While this reduction led to a smaller dataset, it significantly improved the precision of our machine learning models. Initially comprising 84 data points, this curation yielded a refined dataset consisting of 72 data points. Data preprocessing involved standardizing all input features to have a mean of 0 and a standard deviation of 1 prior to training the models. This step was essential to ensure consistent scaling across all features, which is particularly critical for models like KNN and ANN, where distance-based metrics and gradient calculations can be significantly affected by variations in feature scales. For model evaluation, a 5-fold cross-validation approach was used to fine-tune hyperparameters and assess model performance across different data subsets. This method helped ensure that the models generalize well to unseen data. Additionally, the dataset was split into 80% training and 20% test data. In both splits, input features were standardized to ensure consistent and robust model training and assessment. The models were trained on the training set, and their performance was assessed on the test set using two key evaluation metrics: RMSE and R-squared, to capture both the prediction accuracy and the variance explained by the models.| Inputs | Units | Output | Units | |
|---|---|---|---|---|
| Electrode characteristics | Specific surface area | m2 g−1 | Specific capacitance | F g−1 |
| Sheet thickness | mm | |||
| Weight % of Ti3C2 | ||||
| Electrolyte properties | Cation mobility | cm2 V−1 s−1 × 10⁴ | ||
| Anion mobility | cm2 V−1 s−1 × 10⁴ | |||
| Electrolyte concentration | M | |||
| Operational parameters | Scan rate | mV s−1 | ||
| Cell configurations | ||||
| Working potential window | V | |||
| Current density | A g−1 |
 | ||
| Fig. 1 Flowchart of the machine learning pathway. | ||
3. Results and discussion
3.1 Correlation analysis
The Pearson correlation coefficient, commonly referred to as the correlation coefficient, serves as a metric to assess the linear relationship between two features, delivering a result ranging from −1 to 1. Pearson correlation coefficient (r) is defined as: | (1) |
![[X with combining macron]](https://www.rsc.org/images/entities/i_char_0058_0304.gif) and Ȳ are the means of X and Y respectively.
and Ȳ are the means of X and Y respectively.
The colour inside each square in the Pearson correlation displayed in Fig. 2 indicates the degree of the linear correlation between the intersecting features. Positive correlation coefficients indicate that one feature tends to increase or decrease alongside the other, while negative coefficients signify that an increase in one feature corresponds to a decrease in the other and vice versa. The heat map depicted in Fig. 2 employs purple and yellow shades to indicate strong correlations between features, with greenish hue signifies weaker associations. Correlation coefficients near zero suggest a low linear interdependence between the features.35 Notably, a correlation coefficient approaching 1 or −1 with specific capacitance suggests that the feature may be valuable for machine learning models in predicting specific capacitance. As the correlation of a feature with itself is always 1, all diagonal values in the heatmap are inherently 1. The results in Fig. 2 reveal a high correlation, in descending order, between specific capacitance and the following features: specific surface area > anion mobility > electrolyte concentration > sheet thickness > weight percentage of Ti3C2 > current density > potential window > scan rate >cation mobility > cell configuration. Utilizing all 9 features in model development yielded better performance than solely relying on features with high correlation values (those falling between 0.6 and 0.98) with specific capacitance.
 | ||
| Fig. 2 Heatmap presenting Pearson correlation coefficient values, illustrating the degree of linear association between variables. | ||
Conversely, there exists a discernible yet weak ascending correlation between specific capacitance and the following factors: cell configuration, cation mobility, scan rate, potential window, and current density. This indicates that the prediction of capacitance cannot rely solely on straightforward linear or inverse associations. The intricate relationships between specific capacitance and these features, as modeled by machine learning algorithms, contribute to more accurate predictions. Fig. 3 depicts the histogram distribution of features utilized in constructing the machine learning models, alongside the mean and standard deviation (STD) values for each feature's distribution. Several notable insights arise from these distribution curves. For instance, the relatively low mean value of 0.69, accompanied by a standard deviation of 0.36, for the potential window, suggests that many surveyed research papers concentrated around a potential window of approximately 0.7. The substantial standard deviation and mean values for scan rate indicate a wide range (1–40![[thin space (1/6-em)]](https://www.rsc.org/images/entities/char_2009.gif) 000 mV s−1) covered in the surveyed experimental studies, occasionally reaching up to 40 V during GCD tests. Expanding the operational potential window and investigating supercapacitor performance at higher scan rates align with the objectives of supercapacitor design. The specific capacitance stands out for its large standard deviation, indicating the diverse array of supercapacitors encompassed within this study.
000 mV s−1) covered in the surveyed experimental studies, occasionally reaching up to 40 V during GCD tests. Expanding the operational potential window and investigating supercapacitor performance at higher scan rates align with the objectives of supercapacitor design. The specific capacitance stands out for its large standard deviation, indicating the diverse array of supercapacitors encompassed within this study.
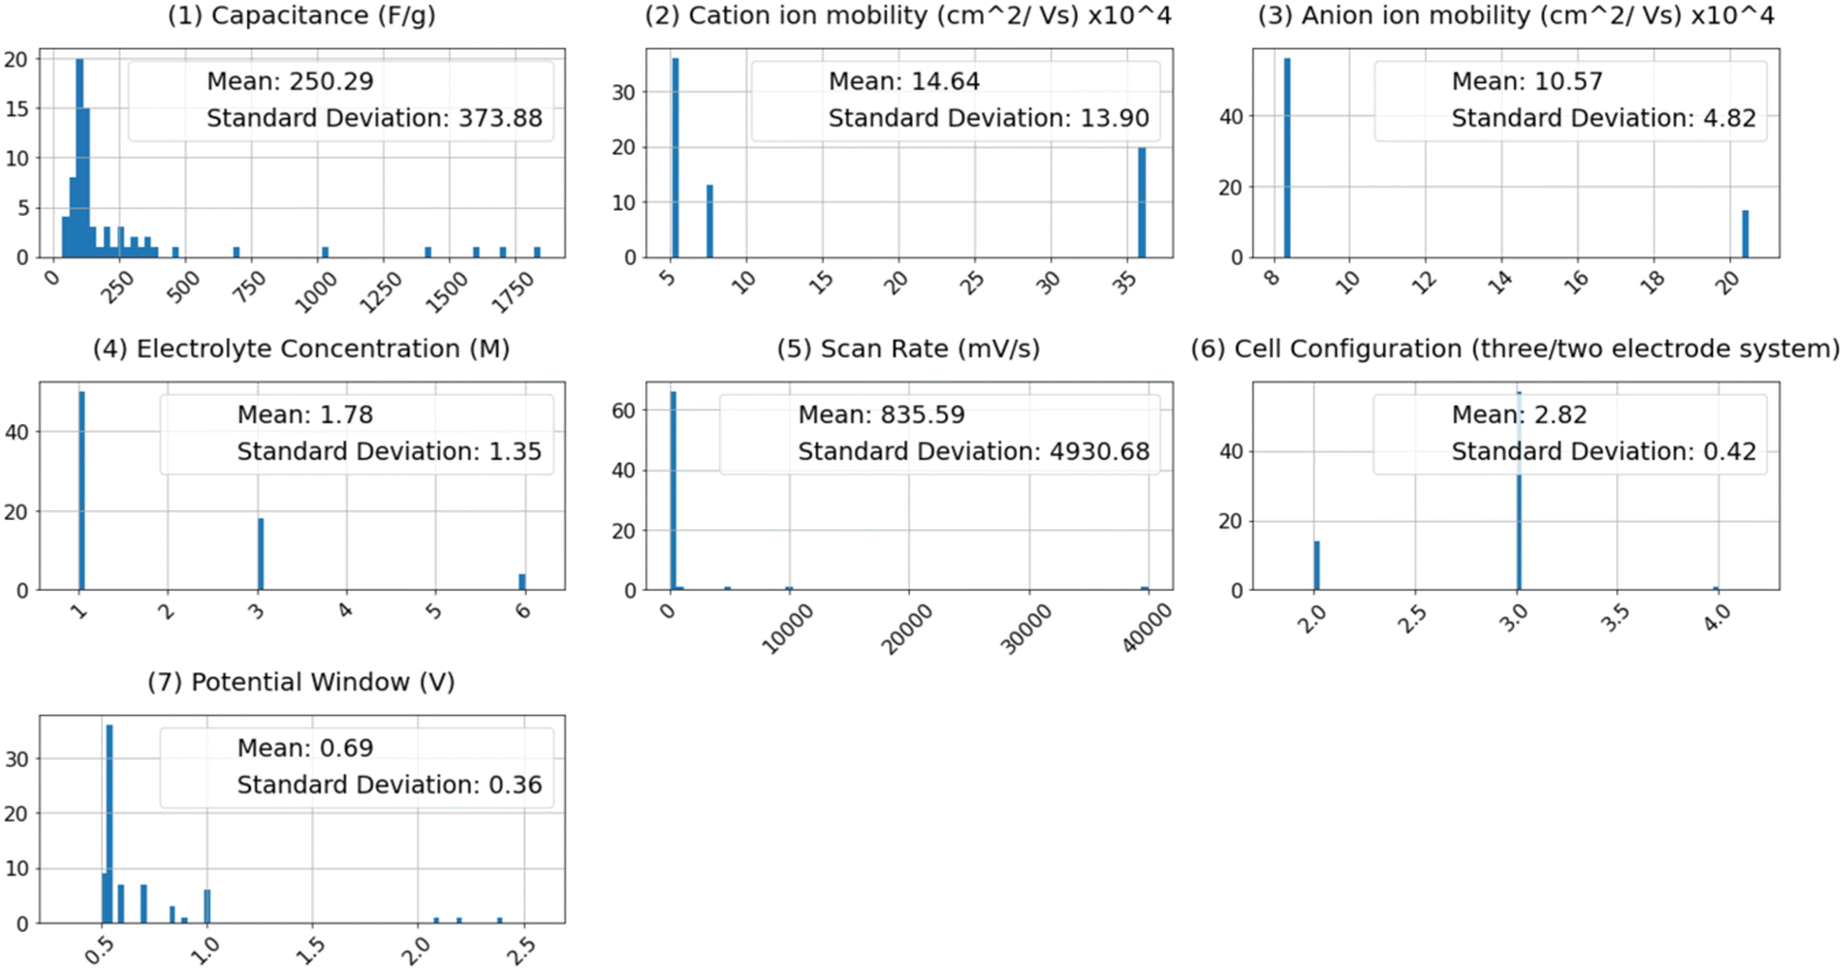 | ||
| Fig. 3 A visual exploration of individual features within the dataset. | ||
Similarly, the relatively high standard deviations of both pore size and pore volume, when contrasted with their low mean values, suggest a diverse set of surface morphologies within the dataset. The specific surface area spans from a minimum value of 22.35 m2 g−1 to a maximum of 98 m2 g−1, with a standard deviation of 41.14. The significant standard deviations and mean values for electrode configuration reflect the dataset's variety. In the interest of enhancing the flexibility of the machine learning models, we categorized different electrolyte compositions as cationic and anionic mobility, showcasing standard deviation values of 14.64 and 10.57, respectively, which are indicative of the wide range of electrolytes employed in the research.
3.2 Model evaluation
To assess the predictive performance of the developed models, we conducted calculations for RMSE and R-squared (R2) values. These metrics are defined as follows: | (2) |
 | (3) |
Our work employs RMSE and R2 as evaluation metrics due to their specific advantages for supercapacitor performance predictions. RMSE was chosen for its ability to penalize larger errors more severely, which is critical in applications where large deviations in predicted capacitance can significantly impact design efficiency and performance. By weighting larger errors more heavily, RMSE ensures that models focus on minimizing these critical inaccuracies. R2 was selected to assess the proportion of variance in the data explained by the model. It provides a clear indication of how well input features, such as specific surface area, ion mobility, and scan rate, contribute to predicting the output variable—specific capacitance. This metric gives an intuitive sense of the model's overall predictive power and helps gauge how effectively the model captures the underlying patterns in the data. Together, RMSE and R2 offer complementary insights: RMSE focuses on reducing large errors, while R2 evaluates the overall explanatory power of the model, making them suitable choices for this study.
BRR
Bayesian ridge regression is a probabilistic regression approach that blends Bayesian inference principles with a linear regression framework. It uses a Bayesian technique to estimate model parameters by considering previous assumptions and adding observed data, resulting in posterior distributions over the parameters. Bayesian ridge regression is helpful for regression applications when model parameter uncertainty is essential, as it automatically calculates the regularization strength. Bayesian ridge regression begins with specifying a prior distribution over the model parameters (weights and precision). Before seeing any data, the prior represents the thoughts or assumptions about the parameter values. The observed data is then used to create a probability function. Given the model parameters, the likelihood function indicates the likelihood of witnessing the data. The prior distribution and likelihood function are merged using Bayes’ theorem to determine the posterior distribution over the model parameters. After absorbing the observed data, the posterior distribution provides revised views about the parameter values. To estimate the model parameters, the posterior distribution is employed. After obtaining the posterior distribution, Bayesian ridge regression may provide predictions based on the uncertainty in the parameter estimations.Notably, we employed a grid search approach to optimize the hyperparameter, denoted as alpha (α).37 Our Bayesian ridge regression (BRR) model exhibited a relatively modest alpha value of 0.001, indicative of mild L2 regularization. This modest regularization suggests that while the model imposes some constraint on the coefficient magnitudes to prevent overfitting, it remains sufficiently flexible to capture the complex relationships inherent in the data.
The significance here is the model's adeptness in closely adhering to the training data, potentially capturing intricate relationships, albeit with the caveat of overfitting in the presence of noisy or multicollinear data. Highlighting the model's predictive competence, our BRR model achieved a commendable R-squared (R2) value of 0.759, accompanied by an impressively low root mean square error (RMSE) of 0.074, substantiating its aptitude for precise predictions of Ti3C2 capacitances. Fig. 4d illustrates the convergence behaviour of the Bayesian regression model applied to predict the specific capacitance of Ti3C2 electrodes during the variational inference process. As shown, the log marginal likelihood stabilizes at approximately 50% following a key isolation step. This stabilization suggests that the model has reached an equilibrium point, where further iterations no longer enhance the model's fit to the data. The constant likelihood indicates that the model has successfully captured the critical relationships within the Ti3C2 dataset, balancing model complexity with explanatory power. This convergence confirms the model's robustness in predicting Ti3C2 capacitance without the risk of overfitting.
 | ||
| Fig. 4 The normalized values of actual specific capacitance plotted vs. the predicted specific capacitances for test data based on (a) KNN, (b) ANN, (c) BRR Models. (d) The convergence behaviour of the Bayesian ridge regression model under different regularization strengths. | ||
KNN
The K-nearest neighbors (KNN) algorithm is a method that leverages a comprehensive database of previous cases to make predictions based on the similarity between data points. It forecasts values for new or test data by assessing ‘feature similarity.’ KNN identifies the nearest neighbors for a given data point, facilitating the assignment of a class label to that particular data point. It excels in delivering precise predictions through the utilization of perceptible data similarities and sophisticated distance metrics. It's worth noting that KNN performs optimally when applied to datasets with a limited number of features due to the ‘curse of dimensionality.’ As the number of features increases, more data becomes a prerequisite.38The outcomes of the KNN model reveal its efficacy, with a notable R-squared value of 0.928, signifying a high level of accuracy. Accompanying this, the root mean square error (RMSE) registers at 0.040, indicating minimal loss in prediction quality. The optimal value for K (1 to 12) in this context is determined to be 5 (highest R2), underlining the potential for KNN in predicting supercapacitance values with a remarkable degree of precision. Fig. 5a presents the validation curves for the KNN model. The first graph shows the relationship between RMSE and the number of neighbours, where the RMSE reaches its minimum at K = 5, highlighting this value as the optimal choice for minimizing prediction error. Similarly Fig. 5b shows the R-squared versus the number of neighbours, with the R-squared value peaking at K = 5, further validating this as the most effective choice for achieving the highest accuracy. Together, these curves demonstrate that K = 5 is the best choice for balancing model complexity and predictive performance, which makes the KNN model a reliable method for predicting Ti3C2 supercapacitance.
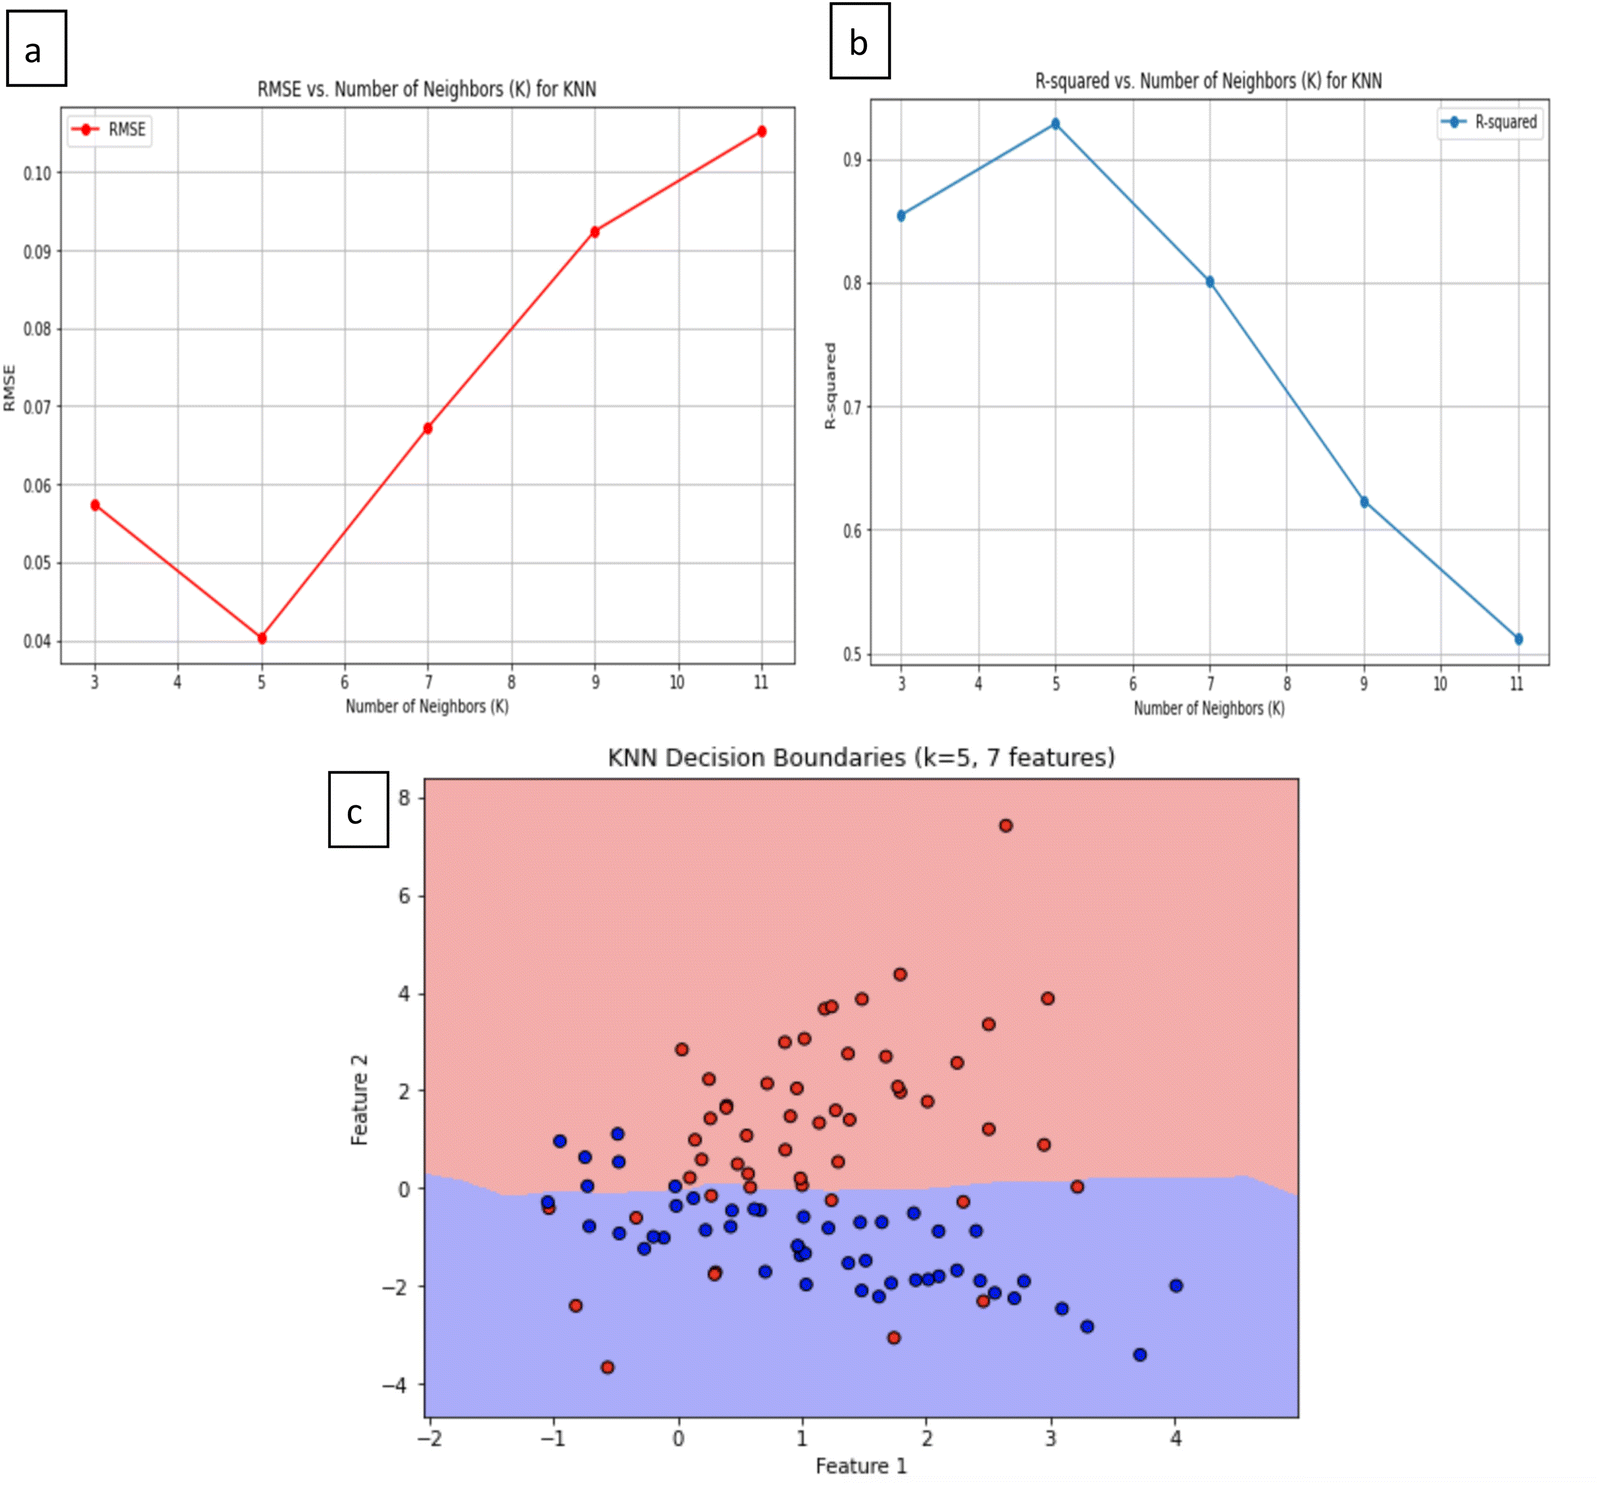 | ||
| Fig. 5 (a) Validation curves for the KNN model showing the variation of RMSE with different values of K. (b) Validation curves for the KNN model showing changes in R-squared with different values of K. (c) The figure depicts decision boundaries generated by the K-nearest neighbors (KNN) algorithm for K = 5, illustrating the classification boundary between two features in a seven-feature dataset. | ||
ANN
An artificial neural network (ANN) is a machine learning model inspired by the functioning of the human brain. It processes data by connecting input values through layers of nodes, often called hidden layers, to produce an output. These networks are designed to mimic the way biological neurons work and can identify patterns, analyze data trends, and extract meaning from complex information. Unlike traditional computers that follow sequential algorithms, neural networks process information in a more parallel and brain-like fashion. In a neural network, many interconnected processing components, or neurons, collaborate to solve a specific problem. These networks learn through experience, and structurally, they are organized into layers. The simplest architecture involves grouping neurons into layers, establishing connections between these layers, and implementing summation and transfer functions. Typically, each neuron in a hidden layer receives signals from all neurons in the layer above it, which is usually an input layer. After performing their functions, neurons pass their outputs to all neurons in the layer below, forming a feedforward path to the final output.The training process of a neural network involves using the Levenberg–Marquardt backpropagation algorithm to adjust the weights and biases of the neurons as depicted in Fig. 6b. This training was done in Python using the framework TensorFlow. In this specific ANN model, four layers are employed: an input layer with seven neurons, an output layer with a single neuron, and two hidden layers consisting of 64 neurons each (Fig. 6a). The dataset is divided randomly, with 75% used for training the ANN and 25% for validation. The information flows through the network, with weights in the hidden layer neurons being adjusted to reach the desired output. This is done through the use of a nonlinear activation function, ReLu, represented by eqn (4),
 | (4) |
 | ||
| Fig. 6 (a) Illustrates the neural network architecture of the ANN model, which consists of seven input nodes and two hidden layers with 64 units, and one output node (b) neural network computation showing the key operations in the neural network, including input processing through weighted sums with bias, followed by the application of the rectified linear unit (ReLu) activation function. | ||
To enhance the training process further, the Adam optimizer is used, and hyperparameter optimization is performed through a grid search. This systematic exploration of hyperparameter combinations ensures the network's performance is fine-tuned to its best configuration. Training involves adapting the weights (w) and biases (b) through thousands of iterations. The iterative weight adjustments, informed by the Levenberg–Marquart backpropagation algorithm (shown in Fig. 6b) and the influence of the Adam optimizer, occur over 100 iterations according to eqn (5),
 | (5) |
The results of this ANN model are impressive, with a high R-squared value of 0.8929, indicating that it can explain nearly 89.29% of the data's variance (Fig. 4c). Additionally, a low root mean square error (RMSE) of 0.0493 suggests accurate predictions. These results validate the model's accuracy and reliability. The optimal selection of hyperparameters, including a batch size of 16, 100 training epochs, and 64 hidden units, underscores the careful tuning of the model, enhancing its overall effectiveness. Based on the results presented, it is evident that there is a strong correspondence between the actual and predicted specific capacitance values during both the training and test phases. In all the sample cases, we observed consistent and accurate agreement between the actual and predicted values, as depicted in Fig. 7b. This suggests that the ANN model can be effectively utilized to achieve high-speed processing and enhance the accuracy of predictions.
 | ||
| Fig. 7 The forecasting performance of the ANN model (a) an overview diagram depicting SHAP values, showcasing the influence of features on the ANN model's performance (b) the comparison of actual and predicted specific capacitance values obtained from the artificial neural network across two distinct phases: the training phase and the testing phase. It emphasizes the ANN's performance in replicating real-world data and its ability to generalize beyond the training data to make accurate predictions during the testing phase. (c) The convergence curve: mean square error (MSE) plotted against the number of training epochs. | ||
SHAP values were applied to gain insights from the developed ANN model. They were used to calculate the importance of each feature for specific predictions. A baseline value was established by averaging predictions on the test dataset. A positive SHAP value signifies that a feature contributed to an increased prediction compared to the baseline, while a negative SHAP value suggests a contribution to a decreased prediction. To explore the inner workings of the ANN model, SHAP values were computed for all predictions on the test data split. Fig. 7a offers an overview of these SHAP values. Examining the distribution of positive and negative SHAP values for each feature horizontally provides insights into the relationship between a feature's value and its associated SHAP value. Notably, in Fig. 7a, the most significant feature for the ANN predictions were cation mobility, electrolyte concentrations and scan rate. A closer look at the SHAP values gives important insights into the impact of each attribute on the model's predictions. Positive SHAP values for the scan rate, cation ion mobility, and electrolyte concentration imply all have a major role in increasing the model's anticipated specific capacitance. Higher specific capacitance for higher cation ion mobility can also be explained by the fact that higherion mobility makes it possible for ions to move through the electrolyte more quickly and efficiently. This leads to faster cycles of charge and discharge and higher supercapacitance performance. However, the SHAP analysis also reveals a nuanced perspective: beyond a certain threshold, the cation ion mobility can negatively impact the system, as indicated by the negative SHAP values. This negative effect may be attributed to phenomena such as ion overcrowding or excessive diffusion rates, which can lead to non-ideal interactions at the electrode interface. For instance, too rapid ion movement might reduce the time available for ions to effectively interact with the active sites on the electrode, leading to a decrease in capacitance. Additionally, high mobility might also cause an imbalance in the distribution of ions, potentially leading to reduced electrode efficiency and uneven charge storage, thus detracting from overall performance.
Furthermore, other parameters like potential window and cell configuration also show a mix of positive and negative SHAP values, implying that their effect on capacitance is context-dependent, altering with particular combinations of other input characteristics. For example, a positive SHAP for potential window implies a broader potential window will allow for a greater energy storage capacity, enabling the supercapacitor to store and deliver more charge. However, if the potential window is too wide, it may result in the breakdown of the electrolyte or degradation of the electrode material, leading to negative SHAP values. Therefore, the potential window must be carefully controlled to balance the trade-off between maximizing energy storage and maintaining system stability. This nuanced interpretation highlights the ANN model's intricate interconnections and gives a more complete understanding of how different parameters affect the performance of Ti3C2-based supercapacitors.
Fig. 7c displays the mean squared error (MSE) throughout the training process across various epochs. It is noteworthy that the MSE steadily decreases from an initial value of 0.65 to a significantly lower 0.0493, precisely over 100 iterations or epochs. Notably, the MSE exhibits rapid convergence, plummeting from 0.65 to a little over 0 within the first 20 epochs. However, as the training progresses beyond these initial 20 epochs, the reduction in MSE becomes more gradual, further decreasing to 0.0493. It's important to highlight that a smaller MSE implies a closer alignment between the actual and predicted values. These findings underscore the robust capability of the artificial neural network (ANN) model in accurately assessing the relative influences of the seven factors on the specific capacitance property.
Model parameters and hyperparameters
• Distance netric: the Euclidean distance was used as the distance metric to identify nearest neighbors.
• Weighting: uniform weighting was applied, meaning each of the k nearest neighbors contributed equally to the prediction.
• Activation function: the rectified linear unit (ReLU) was used as the activation function for the hidden layers to handle non-linear relationships in the data, while a linear activation function was used for the output layer.
• Optimization: the Adam optimizer was used for training, with a learning rate of 0.001. The optimizer parameters, such as beta_1 (0.9), beta_2 (0.999), and epsilon (1 × 10⁻⁷), were set to their default values in TensorFlow.
• Training setup: a batch size of 16 was used, and the model was trained for 100 epochs. Early stopping was employed based on validation RMSE to prevent overfitting.
• Hyperparameter tuning: a grid search approach was used to determine the optimal values for the number of neurons in the hidden layers, learning rate, and batch size. Cross-validation with 5-fold splits was conducted to ensure generalizability of the results.
• Convergence criteria: the model training was terminated when the log marginal likelihood stabilized after approximately 50 iterations, indicating convergence.
• Training process: a probabilistic approach was used, meaning the BRR model estimates both the mean and variance of the parameters during training, allowing for uncertainty in the predictions to be quantified. The regularization strength (α) was optimized to prevent overfitting while ensuring flexibility in capturing the relationships within the data.
4. Conclusion
In conclusion, our research presents a comprehensive methodology for predicting specific capacitance in layered material, Ti3C2. We meticulously curated a dataset from a wide range of academic publications, despite the challenges posed by data availability. The selection of input features played a crucial role in ensuring the accuracy and effectiveness of our machine learning models. Through the implementation of Bayesian ridge regression (BRR), we harnessed the power of probabilistic regression, enabling precise estimations of model parameters while considering uncertainties. Our BRR model demonstrated its predictive competence with a commendable R-squared (R2) value of 0.759 and a low root mean square error (RMSE) of 0.074, showcasing its proficiency in predicting specific capacitance for Ti3C2. The K-nearest neighbors (KNN) algorithm emerged as a robust tool for predicting supercapacitance values. With an impressive R-squared value of 0.928 and a minimal RMSE of 0.040, the KNN model demonstrated its accuracy and precision, particularly when handling datasets with a limited number of features. The artificial neural network (ANN) model further enriched our predictive capabilities, achieving an R-squared value of 0.8929 and a low RMSE of 0.0493. The meticulous tuning of hyperparameters, including batch size, training epochs, and hidden units, emphasized the model's effectiveness in capturing intricate relationships. Moreover, SHAP values allowed us to explore feature importance in our ANN model, with cation mobility emerging as a significant contributing factor. The mean squared error (MSE) analysis indicated the model's ability to align actual and predicted values, underlining its accuracy. In this research, we successfully integrated machine learning techniques to predict specific capacitance, providing a valuable tool for the field of supercapacitor design and contributing to the understanding of complex relationships within electrode materials.Data availability
Data generated at BITS Pilani Hyderabad Campus, available upon request. Codes were generated at BITS Pilani Hyderabad Campus. Derived data supporting the findings of this study are available from the corresponding author, Prof Afkham Mir (mirafkham@hyderabad.bits-pilani.ac.in) on request.Conflicts of interest
There are no conflicts to declare.References
- W. Z. Tawfik, S. N. Mohammad, K. H. Rahouma, E. Tammam and G. M. Salama, An artificial neural network model for capacitance prediction of porous carbon-based supercapacitor electrodes, J. Energy Storage, 2023, 73, 108830 CrossRef.
- E. Frackowiak and F. Béguin, Carbon materials for the electrochemical storage of energy in capacitors, Carbon, 2001, 39, 937–950 CrossRef CAS.
- A. Bhat, et al., Prospects challenges and stability of 2D MXenes for clean energy conversion and storage applications, npj 2D Mater. Appl., 2021, 5, 61 CrossRef CAS.
- M. Naguib, et al., Two-Dimensional Nanocrystals Produced by Exfoliation of Ti3AlC2, Adv. Mater., 2011, 23, 4248–4253 CrossRef CAS.
- Z. Ling, et al., Flexible and conductive MXene films and nanocomposites with high capacitance, Proc. Natl. Acad. Sci. U. S. A., 2014, 111, 16676–16681 CrossRef CAS.
- X. Xu, et al., MXenes with applications in supercapacitors and secondary batteries: A comprehensive review, Mater. Rep. Energy, 2022, 2, 100080 CAS.
- Z. Lin, H. Shao, K. Xu, P. L. Taberna and P. Simon, MXenes as High-Rate Electrodes for Energy Storage, Trends Chem., 2020, 2, 654–664 CrossRef CAS.
- M. R. Lukatskaya, et al., Ultra-high-rate pseudocapacitive energy storage in two-dimensional transition metal carbides, Nat. Energy, 2017, 2, 17105 CrossRef CAS.
- Q. Gao, et al., Tracking ion intercalation into layered Ti3C2 MXene films across length scales, Energy Environ. Sci., 2020, 13, 2549–2558 RSC.
- X. Gao, et al., Maximizing ion accessibility in MXene-knotted carbon nanotube composite electrodes for high-rate electrochemical energy storage, Nat. Commun., 2020, 11, 6160 CrossRef CAS.
- J. Li, et al., Machine learning assisted prediction in the discharge capacities of novel MXene cathodes for aluminum ion batteries, J. Energy Chem., 2024, 78, 102510 Search PubMed.
- P. Mone, S. Deore, S. Balgude and V. Pandit, Fabrication, design and performance evaluation of supercapacitors review, Mater. Today Proc., 2022, 53, 130–133 CrossRef CAS.
- L. T. Ngo, T. P. Tran, V. K. T. Ngo and Q. H. Do, High performance supercapacitor based on thick buckypaper/polyaniline composite electrodes, Adv. Nat. Sci.: Nanosci. Nanotechnol., 2019, 10, 025004 CAS.
- P. Krishnan and V. Biju, Effect of electrolyte concentration on the electrochemical performance of RGO–KOH supercapacitor, Bull. Mater. Sci., 2021, 44, 288 CrossRef CAS.
- B. Pal, S. Yang, S. Ramesh, V. Thangadurai and R. Jose, Electrolyte selection for supercapacitive devices: a critical review, Nanoscale Adv., 2019, 1, 3807–3835 RSC.
- L. Yang, J. Li, Y. Zhou and J. Yao, Towards high-performance supercapacitors with cellulose-based carbon for zinc-ion storage, J. Energy Storage, 2022, 50, 104252 CrossRef.
- Y. M. Volfkovich, Electrochemical Supercapacitors (a Review), Russ. J. Electrochem., 2021, 57, 311–347 CrossRef CAS.
- X. Wang, et al., Influences from solvents on charge storage in titanium carbide MXenes, Nat. Energy, 2019, 4, 241–248 CrossRef CAS.
- L. Wang, et al., Design rules of pseudocapacitive electrode materials: ion adsorption, diffusion, and electron transmission over prototype TiO2, Sci. China Mater., 2022, 65, 391–399 CrossRef CAS.
- R. Garg, A. Agarwal and M. Agarwal, Synthesis and optimisation of MXene for supercapacitor application, J. Mater. Sci.: Mater. Electron., 2020, 31, 18614–18626 CrossRef CAS.
- F. Mashkoor, S. M. Adnan, M. Shoeb and C. Jeong, Waste-to-Wealth Strategy: Ti3AlC2-Max-Supported WS2/Halloysite Nanocomposite for the Removal of Nickel Metal Ions from Wastewater with Machine Learning Simulation and Subsequent Application in Supercapacitors. ACS Sustain, Chem. Eng., 2024, 12, 6547–6563 CAS.
- K. Kawai, Y. Ando and M. Okubo, Machine Learning-Assisted Survey on Charge Storage of MXenes in Aqueous Electrolytes, Small Methods, 2024, 26, 2400062 CrossRef.
- S. S. Pradeepa, K. Sutharthani, Y. P. Fu and M. Sivakumar, Two-dimensional layered Ti3C2 MXene nanosheets decked with ZrO2 nanospheres for the high-performance solid-state hybrid supercapacitors, J. Energy Storage, 2024, 98, 112821 CrossRef.
- B. M. Abraham, P. Sinha, P. Halder and J. K. Singh, Fusing a machine learning strategy with density functional theory to hasten the discovery of 2D MXene-based catalysts for hydrogen generation, J. Mater. Chem. A, 2023, 11, 8091–8100 RSC.
- P. Roy, et al., Predicting the work function of 2D MXenes using machine-learning methods, J. Phys. Energy, 2023, 5, 034005 CrossRef.
- N. C. Frey, D. Akinwande, D. Jariwala and V. B. Shenoy, Machine Learning-Enabled Design of Point Defects in 2D Materials for Quantum and Neuromorphic Information Processing, ACS Nano, 2020, 14, 13406–13417 CrossRef CAS PubMed.
- A. Mishra, et al., Accelerated Data-Driven Accurate Positioning of the Band Edges of MXenes, J. Phys. Chem. Lett., 2019, 10, 780–785 CrossRef CAS.
- N. C. Frey, D. Akinwande, D. Jariwala and V. B. Shenoy, Machine Learning-Enabled Design of Point Defects in 2D Materials for Quantum and Neuromorphic Information Processing, ACS Nano, 2020, 14, 13406–13417 CrossRef CAS.
- J. Zheng, et al., High-Throughput Screening of Hydrogen Evolution Reaction Catalysts in MXene Materials, J. Phys. Chem. C, 2020, 124, 13695–13705 CrossRef CAS.
- M. He and L. Zhang, Machine learning and symbolic regression investigation on stability of MXene materials, Comput. Mater. Sci., 2021, 196, 110578 CrossRef CAS.
- N. C. Frey, et al., Prediction of Synthesis of 2D Metal Carbides and Nitrides (MXenes) and Their Precursors with Positive and Unlabeled Machine Learning, ACS Nano, 2019, 13, 3031–3041 CrossRef CAS.
- K. Boonpalit, J. Kinchagawat, C. Prommin, S. Nutanong and S. Namuangruk, Efficient exploration of transition-metal decorated MXene for carbon monoxide sensing using integrated active learning and density functional theory, Phys. Chem. Chem. Phys., 2023, 25, 28657–28668 RSC.
- Y. Khatri, et al., Magnetic MXene: A Machine-Learning Model With Small Data. IEEE Trans, Comput. Mater. Sci., 2024, 34, 1245–1253 Search PubMed.
- M. Shariq, et al., Machine learning models for prediction of electrochemical properties in supercapacitor electrodes using MXene and graphene nanoplatelets, J. Energy Storage, 2024, 50, 105968 Search PubMed.
- L. T. Ngo, T. P. Tran, V. K. T. Ngo and Q. H. Do, High performance supercapacitor based on thick buckypaper/polyaniline composite electrodes, Adv. Nat. Sci.: Nanosci. Nanotechnol., 2019, 10, 025004 CAS.
- F. Pedregosa, et al., Scikit-learn: Machine Learning in Python, J. Mach. Learn. Res., 2011, 12, 2825–2830 Search PubMed.
- A. G. Saad, A. Emad-Eldeen, W. Z. Tawfik and A. G. El-Deen, Data-driven machine learning approach for predicting the capacitance of graphene-based supercapacitor electrodes, J. Energy Storage, 2022, 55, 105411 CrossRef.
- M. L. Zhang and Z. H. Zhou, ML-KNN: A lazy learning approach to multi-label learning, Pattern Recognit., 2007, 40, 2038–2048 CrossRef.
- A. Bhat, et al., Prospects challenges and stability of 2D MXenes for clean energy conversion and storage applications, npj 2D Mater. Appl., 2021, 5, 61 CrossRef CAS.
Footnote |
| † Electronic supplementary information (ESI) available: [DETAILS]. See DOI: https://doi.org/10.1039/d4ya00460d |
| This journal is © The Royal Society of Chemistry 2024 |