 Open Access Article
Effective electrochemical water oxidation to H2O2 based on a bimetallic Fe/Co metal–organic framework
Kunpeng
Liu†
ab,
Xu
Wang†
ab,
Nan
Wang
*ac,
Ruiyong
Zhang
 *ac,
Meinan
Yang
a,
Baorong
Hou
ac and
Wolfgang
Sand
a
aKey Laboratory of Advanced Marine Materials, Key Laboratory of Marine Environmental Corrosion and Bio-fouling, Institute of Oceanology, Chinese Academy of Sciences, Qingdao, 266071, China. E-mail: wangnan123@qdio.ac.cn; ruiyong.zhang@qdio.ac.cn
bCollege of Materials Science and Engineering, Qingdao University of Science and Technology, 53 Zhengzhou Rd., Qingdao, Shandong 266042, China
cInstitute of Marine Corrosion Protection, Guangxi Academy of Sciences, Nanning 530007, P. R. China
First published on 16th September 2024
Abstract
Rationally designing high-efficiency catalysts for electrochemical two-electron water oxidation reaction (2e− WOR) to produce hydrogen peroxide (H2O2) is extremely important, while designing bimetallic metal–organic frameworks (MOFs) is of great significance for effective 2e− WOR. Herein, MIL-53(Fe) and different proportions of Co-doped MIL-53(Fe) were prepared by a hydrothermal method. The structural characterization and elemental analysis showed that the Co ions were successfully doped into MIL-53(Fe) to form a MIL-53(Fe/Co) bimetallic MOF, and the morphology of MIL-53(Fe/Co) became more regular after Co doping. We found that the optimized MIL-53(Fe/Co) exhibits remarkable 2e− WOR performance, which gave an overpotential of 150 mV at 1 mA cm−2. The overpotential of MIL-53(Fe/Co) was approximately 220 mV (at 1 mA cm−2) lower than that of MIL-53(Fe), which may be attributed to the change of microstructure of MIL-53(Fe) after Co doping and the synergistic effect between Fe/Co. Our work introduces a strategy for designing bimetallic MOF-based electrocatalysts, opening up new possibilities for efficient 2e− WOR systems.
1. Introduction
Hydrogen peroxide is an environmentally friendly oxidizing agent. In addition to the anthraquinone method, which is a main technique for H2O2 synthesis at present,1,2 electrochemical H2O2 preparation has attracted extensive attention. This method has the advantages of environmental friendliness, less by-products, in situ synthesis, and not requiring additional gas supply.3–5 There are two methods for electrosynthesis of H2O2: the two-electron oxygen reduction reaction (2e− ORR, eqn (1)) and the two-electron water oxidation reaction (eqn (2)).6 H2O2 synthesis via the 2e− ORR has been extensively researched in recent years,7,8 and it has reached a high value of H2O2 production rate and Faraday efficiency (FE).9,10 However, the drawbacks of this approach are that it requires a constant supply of oxygen gas. Compared to the 2e− ORR, the WOR requires no additional aeration. The process is simple and has more practical application prospects.11| O2 + 2H+ + 2e− ↔ H2O2 E0 = 0.67 V vs. RHE | (1) |
| 2H2O ↔ H2O2 + 2H+ + 2e− E0 = 1.76 V vs. RHE | (2) |
Generally, a suitable anode material for the 2e− WOR should have some prerequisite properties, including high stability to fulfil the demand for long-term operation, high selectivity to prevent the formation of by-products and high activity to save energy input.12 At present, a variety of metal oxides have been developed for H2O2 generation via the 2e− WOR owing to their high selectivity and excellent stability under oxidation conditions, such as ZnO,13 WO3,14 SnO2,15 TiO2,16 BiVO417 and CaSnO3.18 However, due to the poor conductivity of metal oxides, these electrocatalysts generally show relatively low current density, which leads to low H2O2 yield.19 Carbon materials generally possess relatively high electrical conductivity and electrochemical stability, for instance, carbon cloth (CC), carbon felt (CF), carbon-based materials boron-doped diamond (BDD) and PTFE modified carbon fiber paper (CFP).20–22 But the low selectivity limits the application of carbon materials. As a consequence, high selectivity and high H2O2 production yield are hardly achieved simultaneously.
Transition metal–organic frameworks have gained considerable attention in recent years due to their large specific surface area, more active sites and large porosity.23,24 Significantly, the inherent flexibility of MOFs has empowered researchers to fabricate a diverse array of MOF-based materials possessing distinct structures and functionalities.25 Currently, iron-based MOFs have broad development prospects and excellent research value.26 However, their electrocatalytic performances are far from meeting the needs of practical applications due to their instability, poor electrical conductivity, and solvent-free or water-solvent conditions.27,28 To overcome these limitations, extensive research endeavors have been devoted to exploring multiple approaches. An effective method is to hybridize the MOF with secondary highly conductive carriers, such as graphene and polyaniline.29 However, using this method may block the micropores of the MOF, which would severely limit the effective mass transfer during electrocatalysis.30
Another method is to use a MOF as a precursor to prepare high performance electrocatalysts such as metal oxides, porous carbon and metal sulfides at high temperature,31,32 but it may destroy the ordered channel structure of the MOF and sacrifice the metal active sites.33,34 In recent years, novel composite materials with bimetallic MOFs have gained considerable attention in heterogeneous catalysis.35 This approach preserves the MOF's skeleton while enhancing cycling stability and interfacial electron transfer efficiency.36 Bimetallic MOF-based composites have many advantages over monometallic MOF-based materials: (i) different monometallic MOFs have different metallic elements, organic ligands, morphology, and structure, which can be prepared by different combination strategies to construct bimetallic MOF materials with different compositions, structures, and functions; (ii) most monometallic MOFs have undeveloped holes, but the synthesis of binary metal MOFs can further effectively improve this property. In addition, the preparation process of bimetallic MOFs is relatively simple and mild; (iii) the regular staggered arrangement of metal ions (or metal ion clusters) and organic ligands in bimetallic MOF structures is conducive to further fixing and dispersing metals (or metal oxides), improving the stability and catalytic activity of materials.37 While the development of bimetallic MOFs is still in its infancy, an increasing number of studies demonstrate their great potential in various practical applications.38
Motivated by these concepts, we prepared MIL-53(Fe/Co) for electrocatalytic synthesis of H2O2 by a hydrothermal method and carried out structural characterization and elemental analysis, which manifest that the introduction of Co atoms precisely replaces the Fe site in MIL-53(Fe) to form MIL-53(Fe/Co) bimetallic MOF. Meanwhile we investigated the electrocatalytic WOR performance of MIL-53(Fe) and MIL-53(Fe/Co). Compared with MIL-53(Fe), MIL-53(Fe/Co) exhibits improved WOR activity. The results showed that the MIL-53(Fe/Co) bimetallic MOF showed good synergistic catalysis.
2. Experimental section
2.1. Materials
N,N-Dimethylformamide (DMF) was purchased from Macklin Biochemical Co., Ltd (Shanghai, China). Ferric chloride hexahydrate (FeCl3·6H2O), cobalt(II) acetate tetrahydrate ((CH3COO)2Co·4H2O), potassium hydrogen carbonate (KHCO3), methanol and ethyl alcohol were purchased from Macklin Biochemical Co., Ltd (Shanghai, China). Cerium(IV) sulfate tetrahydrate (Ce(SO4)2) and isopropyl alcohol were purchased from Shanghai Aladdin Bio-Chem Technology Co., Ltd. Terephthalic acid was purchased from Tianjin Guangfu Fine Chemical Research Institute (Tianjin, China). Disodium terephthalate was purchased from Sinopharm Chemical Reagent Co., Ltd (China). 2,3-Bis(2methoxy-4-nitro-5-sulfophehyl)-2H-tetrazolium-5-carboxanilide (XTT) was purchased from Yuanye Co., Ltd, China. All experimental reagents and chemicals were used without further purification.2.2. Material preparation
![[thin space (1/6-em)]](https://www.rsc.org/images/entities/char_2009.gif) :
:![[thin space (1/6-em)]](https://www.rsc.org/images/entities/char_2009.gif) Co = 1
Co = 1![[thin space (1/6-em)]](https://www.rsc.org/images/entities/char_2009.gif) :
:![[thin space (1/6-em)]](https://www.rsc.org/images/entities/char_2009.gif) 4) catalyst. By varying the proportion of FeCl3·6H2O to (CH3COO)2Co·4H2O, we successfully synthesized MIL-53(Fe), MIL-53(Fe
4) catalyst. By varying the proportion of FeCl3·6H2O to (CH3COO)2Co·4H2O, we successfully synthesized MIL-53(Fe), MIL-53(Fe![[thin space (1/6-em)]](https://www.rsc.org/images/entities/char_2009.gif) :
:![[thin space (1/6-em)]](https://www.rsc.org/images/entities/char_2009.gif) Co = 4
Co = 4![[thin space (1/6-em)]](https://www.rsc.org/images/entities/char_2009.gif) :
:![[thin space (1/6-em)]](https://www.rsc.org/images/entities/char_2009.gif) 1), MIL-53(Fe
1), MIL-53(Fe![[thin space (1/6-em)]](https://www.rsc.org/images/entities/char_2009.gif) :
:![[thin space (1/6-em)]](https://www.rsc.org/images/entities/char_2009.gif) Co = 3
Co = 3![[thin space (1/6-em)]](https://www.rsc.org/images/entities/char_2009.gif) :
:![[thin space (1/6-em)]](https://www.rsc.org/images/entities/char_2009.gif) 2) and MIL-53(Fe
2) and MIL-53(Fe![[thin space (1/6-em)]](https://www.rsc.org/images/entities/char_2009.gif) :
:![[thin space (1/6-em)]](https://www.rsc.org/images/entities/char_2009.gif) Co = 2
Co = 2![[thin space (1/6-em)]](https://www.rsc.org/images/entities/char_2009.gif) :
:![[thin space (1/6-em)]](https://www.rsc.org/images/entities/char_2009.gif) 3), and when the FeCl3·6H2O content is zero, we synthesized a purple sample called MIL-53(Co).
3), and when the FeCl3·6H2O content is zero, we synthesized a purple sample called MIL-53(Co).
2.3. Characterization
The crystal structure and micromorphology of the samples were analyzed using an X-ray diffractometer (XRD, Rigaku, Japan) and scanning electron microscope (SEM, HITCH, Japan), respectively. The chemical state of the samples was measured by X-ray photoelectron spectroscopy (XPS, ESCALAB 250Xi, Thermo Fisher Scientific, USA). The oxygen vacancies of the samples were measured by electron paramagnetic resonance (EPR, Bruker-E500, Germany). The photoelectrochemical properties of the samples were tested on the standard three-electrode system of the CHI 660E electrochemical workstation (Shanghai Chenhua Instrument Co, China). UV-vis absorption spectra were acquired using a UV-vis spectrophotometer (UV-vis, HITCH 3900, Japan).2.4. Electrochemical measurements
The electrochemical (EC) measurements were conducted in a three-electrode system, where a saturated calomel electrode (SCE) and graphite were used as the reference and counter electrodes, respectively. The catalyst-coated fluorine-doped tin oxide (FTO) was used as the working electrode and the test area is 0.2826 cm2. Dispersions with 5 mg of catalysts were prepared in 1 mL of isopropyl alcohol and homogenized in an ultrasonic bath for 20 min. 5 μL Nafion solution was then added into above the catalyst solution and homogenized in an ultrasonic bath for 20 min again. After homogenization, 10 μL of the solution was placed in the working electrode and dried.The electrolyte solution is 2.0 M KHCO3. Linear sweep voltammetry (LSV) was conducted in the potential range of 1.5–2.75 V (vs. RHE) at a scan rate of 10 mV s−1. The conditions for measuring electrochemical impedance spectroscopy (EIS) were 0.05 V amplitude and 100 kHz–0.01 Hz frequency.
2.5. Detection of H2O2 production
Electrocatalytic H2O2 production on FTO loaded with catalysts was performed in a two-compartment cell with Nafion 117 membrane as a separator. Both the cathode compartment (30 mL) and anode compartment were filled with the same electrolyte (2.0 M KHCO3).The H2O2 concentration was measured by a traditional cerium sulfate Ce(SO4)2 titration method based on the mechanism that a yellow solution of Ce4+ would be reduced by H2O2 to colorless Ce3+ (eqn (3)).40 Thus, the concentration of Ce4+ before and after the reaction can be measured by ultraviolet-visible spectroscopy. The wavelength used for the measurement was 316 nm.
| 2Ce4+ + H2O2 → 2Ce3+ + 2H+ + O2 | (3) |
Therefore, the concentration of H2O2 (M) can be determined by eqn (4) where MCe4+ is the mole of consumed Ce4+.
| M = 2 × MCe4+ | (4) |
3. Results and discussion
3.1. Characterizations
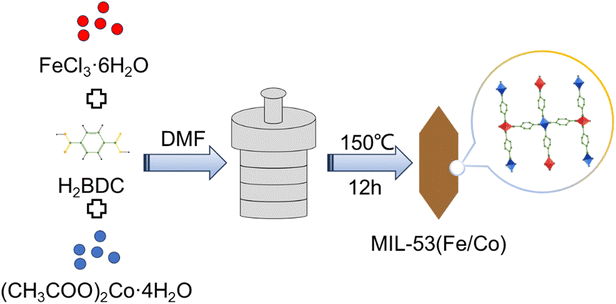
According to Fig. 1, the synthesis of MIL-53(Fe/Co) was achieved through a one-step hydrothermal method. Subsequently, SEM images were collected to characterize the microstructure of the precursor and the composite. As seen from Fig. 2a, the images show that the MIL-53(Fe) displayed rod-like crystallites with a rough surface with diameters of ∼0.5 μm. With the incorporation of Co2+, the surface morphology of MIL-53(Fe) was changed obviously. As shown in Fig. 2b–e, MIL-53(Fe/Co) displayed a typical bipyramidal prism structure with sharp edges and had a smooth surface, indicating that Co ion doping can regulate the MOF morphology of MIL-53(Fe). And the SEM images showed that the MIL-53(Fe/Co) with different proportions had different sizes. With the increase in the Co2+ percentage from 20 to 80% in the MIL-53(Fe/Co), the bipyramidal morphology of MIL-53(Fe/Co) gradually became smaller and the prism of MIL-53(Fe/Co) gradually became longer. However, the MIL-53(Co) showed a random block when only single-metal Co is present (Fig. 2f). This may be due to the fact that after Co ions are completely doped to replace Fe ions, the destruction of the original ordered structure of MIL-53(Fe) weakens the connection between metal ions and ligands, resulting in the complete destruction of the morphology of the MOF. The mapping images (Fig. 2(g–i)) of MIL-53(Fe![[thin space (1/6-em)]](https://www.rsc.org/images/entities/char_2009.gif) :
:![[thin space (1/6-em)]](https://www.rsc.org/images/entities/char_2009.gif) Co = 1
Co = 1![[thin space (1/6-em)]](https://www.rsc.org/images/entities/char_2009.gif) :
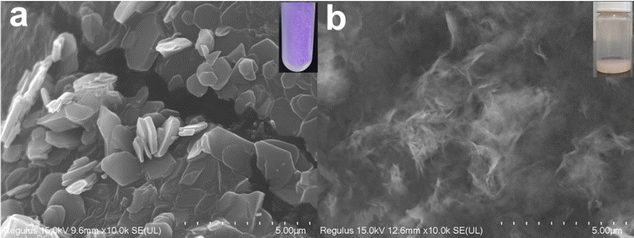
:![[thin space (1/6-em)]](https://www.rsc.org/images/entities/char_2009.gif) 4) confirmed the presence of Fe and Co elements distributed uniformly across the surface of the material. In addition, we found that when MIL-53(Co) was prepared into a catalyst solution, the colour of MIL-53(Co) changed from a purple powder to a pink solution, as shown in the inset images. In order to observe whether the microstructure of MIL-53(Co) changes, we collected the SEM images of the powder and solution.
4) confirmed the presence of Fe and Co elements distributed uniformly across the surface of the material. In addition, we found that when MIL-53(Co) was prepared into a catalyst solution, the colour of MIL-53(Co) changed from a purple powder to a pink solution, as shown in the inset images. In order to observe whether the microstructure of MIL-53(Co) changes, we collected the SEM images of the powder and solution.
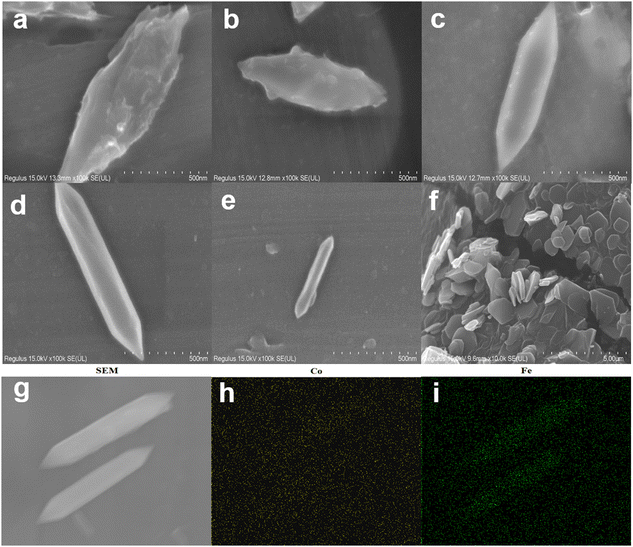 | ||
Fig. 2 SEM image of MIL-53(Fe) (a), MIL-53(Fe![[thin space (1/6-em)]](https://www.rsc.org/images/entities/char_2009.gif) : :![[thin space (1/6-em)]](https://www.rsc.org/images/entities/char_2009.gif) Co = 4 Co = 4![[thin space (1/6-em)]](https://www.rsc.org/images/entities/char_2009.gif) : :![[thin space (1/6-em)]](https://www.rsc.org/images/entities/char_2009.gif) 1 (b), 3 1 (b), 3![[thin space (1/6-em)]](https://www.rsc.org/images/entities/char_2009.gif) : :![[thin space (1/6-em)]](https://www.rsc.org/images/entities/char_2009.gif) 2 (c), 2 2 (c), 2![[thin space (1/6-em)]](https://www.rsc.org/images/entities/char_2009.gif) : :![[thin space (1/6-em)]](https://www.rsc.org/images/entities/char_2009.gif) 3 (d), 1 3 (d), 1![[thin space (1/6-em)]](https://www.rsc.org/images/entities/char_2009.gif) : :![[thin space (1/6-em)]](https://www.rsc.org/images/entities/char_2009.gif) 4 (e)), MIL-53(Co) (f) and MIL-53(Fe 4 (e)), MIL-53(Co) (f) and MIL-53(Fe![[thin space (1/6-em)]](https://www.rsc.org/images/entities/char_2009.gif) : :![[thin space (1/6-em)]](https://www.rsc.org/images/entities/char_2009.gif) Co = 4 Co = 4![[thin space (1/6-em)]](https://www.rsc.org/images/entities/char_2009.gif) : :![[thin space (1/6-em)]](https://www.rsc.org/images/entities/char_2009.gif) 1), and (g) mapping of Co (h) and Fe (i). 1), and (g) mapping of Co (h) and Fe (i). | ||
Shown in Fig. 3 is a comparison of the SEM images of the powder and solution of MIL-53(Co). We can clearly observe that the morphology is completely destroyed when it dissolves in isopropyl alcohol, which shows that the MIL-53(Co) was extremely unstable and further supports the above conjecture. Therefore, we will not compare the electrocatalytic WOR performance of the MIL-53(Co) and MIL-53(Fe/Co) in the following.
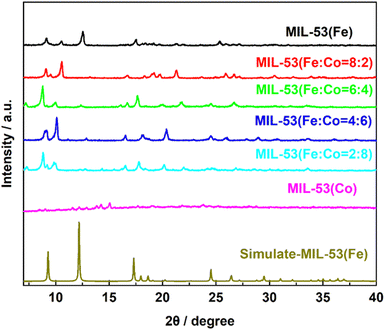
To determine the crystal structure and atomic arrangement, X-ray diffraction analysis was performed on the synthesized samples. As shown in Fig. 4, the characteristic diffraction peaks of the MIL-53(Fe) material matched well with the standard XRD simulation-MIL-53(Fe) results in the reported literature,28 indicating the high crystallinity of MIL-53(Fe).
Upon the introduction of Co into MIL-53(Fe), the diffraction peak of MIL-53(Fe) at 10.5° and 17.5° experienced a slight shift towards a lower angle (10° and 17°). This transformation can be attributed to the fact that the ionic radius of Co2+ (0.0745 nm) is much greater than that of Fe3+ (0.064 nm). When Co replaces Fe in MIL-53(Fe), the crystal plane spacing increases and lattice distortion occurs, which causes the diffraction peak to shift lower.41 Thus, the XRD results show that MIL-53(Fe) and MIL-53(Fe/Co) were successfully synthesized. In addition, we performed the crystal structure and atomic arrangement of MIL-53(Co) by XRD.
As shown in Fig. 4, the XRD analysis reveals that when only single-metal Co was present, the diffraction peak at 17.5° is almost non-existent, indicating that Co atom doping can accurately replace Fe atoms, leading to the destruction of the corresponding lattice faces. Meanwhile, the destruction of the original ordered structure of MIL-53(Fe) weakened the connection between metal ions and ligands, which caused the structure of MIL-53(Co) to be extremely unstable, supporting the previous inference.
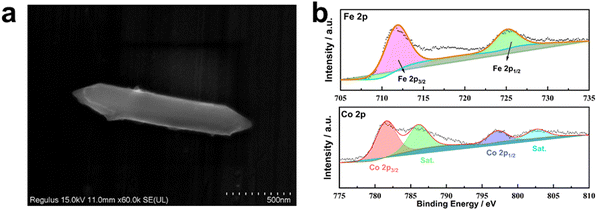
XPS was conducted to characterize the chemical elemental composition and valence states of MIL-53(Fe/Co), MIL-53(Fe) and MIL-53(Co). The XPS survey spectrum of MIL-53(Fe/Co) confirms the presence of Fe and Co (Fig. 5a), indicating the successful incorporation of Co. In the high-resolution Fe 2p spectrum (Fig. 5a), the two peaks at 712 and 725.9 eV can be assigned to the 2p3/2 and 2p1/2 characteristic peaks of MIL-53(Fe), respectively, which indicates that Fe is present mainly in the Fe3+ valence state in MIL-53(Fe/Co) and MIL-53(Fe).42 Notably, compared with MIL-53(Fe), the Fe 2p peak of MIL-53(Fe/Co) will be shifted to a higher energy level step by step as the proportion of Co atoms increases, suggesting that the lattice defects induced by Co substitution can modulate the electronic structure of the active Fe center. In the high-resolution spectrum of Co 2p in Fig. 5b, the binding energies of the 2p3/2 and 2p3/2 characteristic peaks of Co are located at 780.6 and 796.1 eV, with two satellite peaks at 785.5 and 802.6 eV, respectively, which show that the oxidation state of Co is +2 in MIL-53(Fe/Co) and MIL-53(Co).28 In addition, the peaks of Fe 2p increased with increasing percentages of iron in the MIL-53(Fe/Co) catalysts, whereas the peak of Co 2p decreased with decreasing percentages of cobalt in the MIL-53(Fe/Co) catalysts.
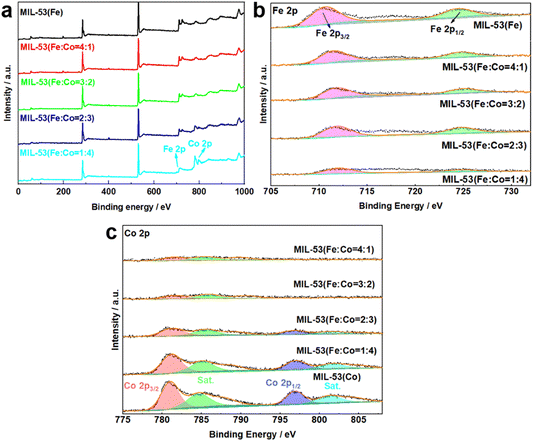 | ||
| Fig. 5 XPS spectra of MIL-53(Fe) and MIL-53(Fe/Co) (a), Fe 2p (b) of MIL-53(Fe) and MIL-53(Fe/Co) and Co 2p (c) of MIL-53(Fe/Co) and MIL-53(Co). | ||
3.2. Electrocatalytic performance of MIL-53(Fe/Co)
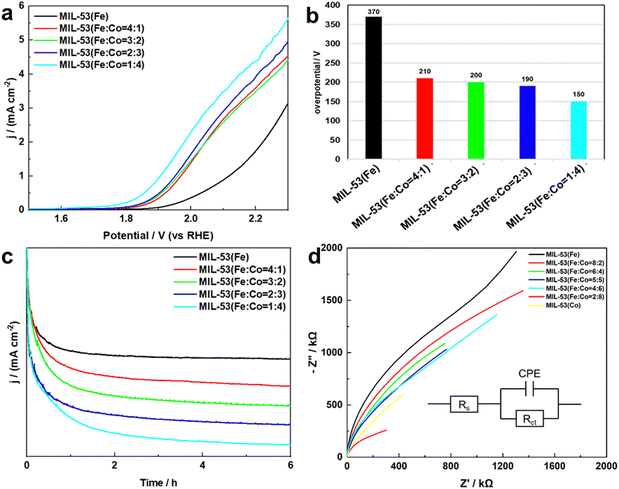
The electrocatalytic WOR performance of MIL-53(Fe/Co) was examined in 2.0 M KHCO3. For comparison, MIL-53(Fe) was also tested. Fig. 6a displays the LSV curves of MIL-53(Fe/Co) and MIL-53(Fe), respectively. The current density for MIL-53(Fe/Co) increased steadily with increased potential of the working electrode in the potential range of 1.5–2.3 V (vs. RHE). On comparison of MIL-53(Fe/Co) and MIL-53(Fe), the current density increased gradually with increased Co content at low overpotential and the MIL-53(Fe![[thin space (1/6-em)]](https://www.rsc.org/images/entities/char_2009.gif) :
:![[thin space (1/6-em)]](https://www.rsc.org/images/entities/char_2009.gif) Co = 1
Co = 1![[thin space (1/6-em)]](https://www.rsc.org/images/entities/char_2009.gif) :
:![[thin space (1/6-em)]](https://www.rsc.org/images/entities/char_2009.gif) 4) achieved the highest current density. This was consistent with the above morphological changes, indicating that the change of MIL-53(Fe/Co) morphology improved its catalytic performance with the increase of the Co content. In addition, we calculated the overpotential of MIL-53(Fe/Co) and MIL-53(Fe), as shown in Fig. 6b. The overpotential of the bimetal-based MOF was lower than that of the single metal-based MOFs. Therefore, the MIL-53(Fe/Co) exhibited better performance of electrocatalysis water oxidation. The reason may be that the synergistic interaction between Fe/Co bimetals improves the catalytic performance of water oxidation of MIL-53(Fe/Co).
4) achieved the highest current density. This was consistent with the above morphological changes, indicating that the change of MIL-53(Fe/Co) morphology improved its catalytic performance with the increase of the Co content. In addition, we calculated the overpotential of MIL-53(Fe/Co) and MIL-53(Fe), as shown in Fig. 6b. The overpotential of the bimetal-based MOF was lower than that of the single metal-based MOFs. Therefore, the MIL-53(Fe/Co) exhibited better performance of electrocatalysis water oxidation. The reason may be that the synergistic interaction between Fe/Co bimetals improves the catalytic performance of water oxidation of MIL-53(Fe/Co).
In addition, stability also plays a key role in the practical application of the catalyst, so we studied the stability of MIL-53(Fe/Co) and MIL-53(Fe). As demonstrated in Fig. 6c, MIL-53(Fe/Co) displays remarkable durability at a fixed potential of 2.03 V (vs. RHE) over 6 h of electrolytic water oxidation, indicating that both the MIL-53(Fe/Co) bimetallic MOF and MIL-53(Fe) monometallic MOF have good stability during electrocatalytic water oxidation.
To further understand the catalytic kinetics of the WOR process, electrochemical impedance spectroscopy (EIS) was performed. Fig. 6d shows the Nyquist plots of MIL-53(Fe/Co) and MIL-53(Fe). Clearly, the semicircle radius of MIL-53(Fe/Co) is significantly reduced, indicating excellent charge-transfer capability and excellent WOR intrinsic activity relative to MIL-53(Fe). In addition, to further investigate the charge transfer resistance, EIS was performed and the fitting circuit was inserted in Fig. 6d. The fitting equivalent circuit showed a charge transfer resistance of Rct in parallel with a constant phase element CPE related to the double layer, both coupled with the electrolyte resistor Rs. We could deduce that the charge transfer resistance decreased from ![[thin space (1/6-em)]](https://www.rsc.org/images/entities/char_2009.gif) 3.4 × 10¹¹ Ω to 2.2 × 10⁴ Ω with Co atoms replacing Fe atoms, which was consistent with the LSV data. Thus, the results above confirm the change of microstructure of MIL-53(Fe) after Co doping and the synergistic effect between Fe/Co improves the electrocatalytic performance of 2e− WOR of the MIL-53(Fe/Co) bimetallic MOF.
3.4 × 10¹¹ Ω to 2.2 × 10⁴ Ω with Co atoms replacing Fe atoms, which was consistent with the LSV data. Thus, the results above confirm the change of microstructure of MIL-53(Fe) after Co doping and the synergistic effect between Fe/Co improves the electrocatalytic performance of 2e− WOR of the MIL-53(Fe/Co) bimetallic MOF.
To assess the changes in the material after the reaction, the surface morphology of the catalysts after the reaction was further examined by SEM (Fig. 7a). Compared with the MIL-53(Fe![[thin space (1/6-em)]](https://www.rsc.org/images/entities/char_2009.gif) :
:![[thin space (1/6-em)]](https://www.rsc.org/images/entities/char_2009.gif) Co = 1
Co = 1![[thin space (1/6-em)]](https://www.rsc.org/images/entities/char_2009.gif) :
:![[thin space (1/6-em)]](https://www.rsc.org/images/entities/char_2009.gif) 4) before the reaction, there is no significant difference in the morphology of MIL-53(Fe
4) before the reaction, there is no significant difference in the morphology of MIL-53(Fe![[thin space (1/6-em)]](https://www.rsc.org/images/entities/char_2009.gif) :
:![[thin space (1/6-em)]](https://www.rsc.org/images/entities/char_2009.gif) Co = 1
Co = 1![[thin space (1/6-em)]](https://www.rsc.org/images/entities/char_2009.gif) :
:![[thin space (1/6-em)]](https://www.rsc.org/images/entities/char_2009.gif) 4) after the reaction. This indicates that the morphology is still maintained after long-term reaction. In addition, the XPS spectra (Fig. 7b) were measured to characterize the metal oxidation states. The results show that the spectra of Fe 2p and Co 2p show no changes in the MIL-53(Fe
4) after the reaction. This indicates that the morphology is still maintained after long-term reaction. In addition, the XPS spectra (Fig. 7b) were measured to characterize the metal oxidation states. The results show that the spectra of Fe 2p and Co 2p show no changes in the MIL-53(Fe![[thin space (1/6-em)]](https://www.rsc.org/images/entities/char_2009.gif) :
:![[thin space (1/6-em)]](https://www.rsc.org/images/entities/char_2009.gif) Co = 1
Co = 1![[thin space (1/6-em)]](https://www.rsc.org/images/entities/char_2009.gif) :
:![[thin space (1/6-em)]](https://www.rsc.org/images/entities/char_2009.gif) 4) before and after the reaction. Compared with the precatalyst, catalysts normally show better consistency after the reaction.43 These above results show the morphology and structure of the catalysts before and after the reaction.
4) before and after the reaction. Compared with the precatalyst, catalysts normally show better consistency after the reaction.43 These above results show the morphology and structure of the catalysts before and after the reaction.
In addition, the oxygen vacancies of MIL-53(Fe![[thin space (1/6-em)]](https://www.rsc.org/images/entities/char_2009.gif) :
:![[thin space (1/6-em)]](https://www.rsc.org/images/entities/char_2009.gif) Co = 1
Co = 1![[thin space (1/6-em)]](https://www.rsc.org/images/entities/char_2009.gif) :
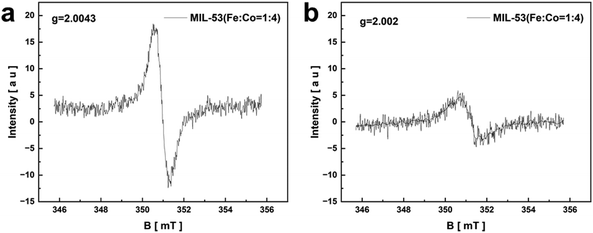
:![[thin space (1/6-em)]](https://www.rsc.org/images/entities/char_2009.gif) 4) before and after the reaction were tested by EPR in Fig. 8. There are apparent symmetrical and sharp signals at g = 2.0043 (Fig. 8a) and g = 2.002 (Fig. 8b) in MIL-53(Fe
4) before and after the reaction were tested by EPR in Fig. 8. There are apparent symmetrical and sharp signals at g = 2.0043 (Fig. 8a) and g = 2.002 (Fig. 8b) in MIL-53(Fe![[thin space (1/6-em)]](https://www.rsc.org/images/entities/char_2009.gif) :
:![[thin space (1/6-em)]](https://www.rsc.org/images/entities/char_2009.gif) Co = 1
Co = 1![[thin space (1/6-em)]](https://www.rsc.org/images/entities/char_2009.gif) :
:![[thin space (1/6-em)]](https://www.rsc.org/images/entities/char_2009.gif) 4) after the reaction, which are attributed to oxygen vacancies.44 The oxygen vacancies still exist in the catalysts after the reaction but with reduced intensity, which may be the influence of electron transfer.45
4) after the reaction, which are attributed to oxygen vacancies.44 The oxygen vacancies still exist in the catalysts after the reaction but with reduced intensity, which may be the influence of electron transfer.45
3.3. H2O2 production
The cumulative H2O2 yield measurement of MIL-53(Fe![[thin space (1/6-em)]](https://www.rsc.org/images/entities/char_2009.gif) :
:![[thin space (1/6-em)]](https://www.rsc.org/images/entities/char_2009.gif) Co = 1
Co = 1![[thin space (1/6-em)]](https://www.rsc.org/images/entities/char_2009.gif) :
:![[thin space (1/6-em)]](https://www.rsc.org/images/entities/char_2009.gif) 4) was conducted in a H-type electrolytic cell with SCE as the reference electrode, graphite rod as the counter electrode, and the MIL-53(Fe
4) was conducted in a H-type electrolytic cell with SCE as the reference electrode, graphite rod as the counter electrode, and the MIL-53(Fe![[thin space (1/6-em)]](https://www.rsc.org/images/entities/char_2009.gif) :
:![[thin space (1/6-em)]](https://www.rsc.org/images/entities/char_2009.gif) Co = 1
Co = 1![[thin space (1/6-em)]](https://www.rsc.org/images/entities/char_2009.gif) :
:![[thin space (1/6-em)]](https://www.rsc.org/images/entities/char_2009.gif) 4) supported on FTO as the working electrode. A Nafion 117 membrane was used for separating the electrolytic cells. The H2O2 production performances were investigated by measuring the H2O2 evolution rate. Firstly, the standard spectral curve of H2O2 was obtained using the traditional Ce(SO4)2 titration method, as shown in Fig. 9a. In addition, the H2O2 production of MIL-53(Fe
4) supported on FTO as the working electrode. A Nafion 117 membrane was used for separating the electrolytic cells. The H2O2 production performances were investigated by measuring the H2O2 evolution rate. Firstly, the standard spectral curve of H2O2 was obtained using the traditional Ce(SO4)2 titration method, as shown in Fig. 9a. In addition, the H2O2 production of MIL-53(Fe![[thin space (1/6-em)]](https://www.rsc.org/images/entities/char_2009.gif) :
:![[thin space (1/6-em)]](https://www.rsc.org/images/entities/char_2009.gif) Co = 1
Co = 1![[thin space (1/6-em)]](https://www.rsc.org/images/entities/char_2009.gif) :
:![[thin space (1/6-em)]](https://www.rsc.org/images/entities/char_2009.gif) 4) was measured using a chronoamperometry method for 60 min. The same amount of electrolyte was collected from the anode chamber at intervals of 5, 10, 20, 30, 45 and 60 minutes to detect the H2O2 production. Based on the standard spectral curve of H2O2, the yield of H2O2 was gained, as shown in Fig. 9b, and the H2O2 production generally showed an upward trend with time. Compared to the H2O2 production under different potentials (2.03 V, 2.13 V, 2.23 V vs. RHE), the H2O2 production of MIL-53(Fe
4) was measured using a chronoamperometry method for 60 min. The same amount of electrolyte was collected from the anode chamber at intervals of 5, 10, 20, 30, 45 and 60 minutes to detect the H2O2 production. Based on the standard spectral curve of H2O2, the yield of H2O2 was gained, as shown in Fig. 9b, and the H2O2 production generally showed an upward trend with time. Compared to the H2O2 production under different potentials (2.03 V, 2.13 V, 2.23 V vs. RHE), the H2O2 production of MIL-53(Fe![[thin space (1/6-em)]](https://www.rsc.org/images/entities/char_2009.gif) :
:![[thin space (1/6-em)]](https://www.rsc.org/images/entities/char_2009.gif) Co = 1
Co = 1![[thin space (1/6-em)]](https://www.rsc.org/images/entities/char_2009.gif) :
:![[thin space (1/6-em)]](https://www.rsc.org/images/entities/char_2009.gif) 4) was the highest at 2.13 V vs. RHE. H2O2 production was achieved by MIL-53(Fe
4) was the highest at 2.13 V vs. RHE. H2O2 production was achieved by MIL-53(Fe![[thin space (1/6-em)]](https://www.rsc.org/images/entities/char_2009.gif) :
:![[thin space (1/6-em)]](https://www.rsc.org/images/entities/char_2009.gif) Co = 1
Co = 1![[thin space (1/6-em)]](https://www.rsc.org/images/entities/char_2009.gif) :
:![[thin space (1/6-em)]](https://www.rsc.org/images/entities/char_2009.gif) 4) with a production rate of 4 mmol/gcatalyst. In addition, we calculated the Faraday efficiency (FE) of MIL-53(Fe
4) with a production rate of 4 mmol/gcatalyst. In addition, we calculated the Faraday efficiency (FE) of MIL-53(Fe![[thin space (1/6-em)]](https://www.rsc.org/images/entities/char_2009.gif) :
:![[thin space (1/6-em)]](https://www.rsc.org/images/entities/char_2009.gif) Co = 1
Co = 1![[thin space (1/6-em)]](https://www.rsc.org/images/entities/char_2009.gif) :
:![[thin space (1/6-em)]](https://www.rsc.org/images/entities/char_2009.gif) 4) under different potentials (Fig. 9c). The FE was also the highest at 2.13 V vs. RHE and reached 30%.
4) under different potentials (Fig. 9c). The FE was also the highest at 2.13 V vs. RHE and reached 30%.
 | ||
Fig. 9 Standard curve for the hydrogen peroxide test (a), time course for H2O2 accumulation (b) and Faraday efficiency with MIL-53(Fe![[thin space (1/6-em)]](https://www.rsc.org/images/entities/char_2009.gif) : :![[thin space (1/6-em)]](https://www.rsc.org/images/entities/char_2009.gif) Co = 1 Co = 1![[thin space (1/6-em)]](https://www.rsc.org/images/entities/char_2009.gif) : :![[thin space (1/6-em)]](https://www.rsc.org/images/entities/char_2009.gif) 4) at different electric potentials (c). 4) at different electric potentials (c). | ||
In addition, except for the produced H2O2, the hydroxyl radicals and superoxide anions were analyzed by fluorimetric assay and UV-vis spectrophotometer assay, respectively.46 The fluorescence intensity (Fig. 10a) and UV-vis absorption peak (Fig. 10b) also displayed no significant change in the absorption peak before and after the electrocatalytic reaction. These results indicate that a small amount hydroxyl radicals and superoxide anions are generated during the production of H2O2. The generation of superoxide anions and hydroxyl radicals may stem from the interaction of metals in MIL-53(Fe![[thin space (1/6-em)]](https://www.rsc.org/images/entities/char_2009.gif) :
:![[thin space (1/6-em)]](https://www.rsc.org/images/entities/char_2009.gif) Co = 1
Co = 1![[thin space (1/6-em)]](https://www.rsc.org/images/entities/char_2009.gif) :
:![[thin space (1/6-em)]](https://www.rsc.org/images/entities/char_2009.gif) 4) with the produced H2O2.47
4) with the produced H2O2.47
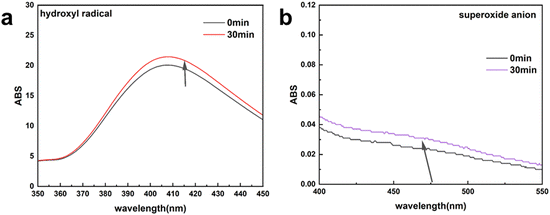 | ||
| Fig. 10 Absorbance spectra of electrolyte solution-trapped hydroxyl radicals (a) and superoxide anions (b). | ||
4. Conclusions
To conclude, we successfully prepared a MIL-53(Fe/Co) bimetallic MOF and MIL-53(Fe) monometallic MOF by a hydrothermal method and characterized the morphology and structure. The structural characterization and elemental analysis showed that Co ions were successfully doped into MIL-53(Fe), which adjusted the morphology of MIL-53(Fe) and made it more regular. Meanwhile, we explored the electrocatalysis water oxidation properties of MIL-53(Fe/Co). The overpotential of MIL-53(Fe/Co) was only 150 mV at 1 mA cm−2, which was lower than that of MIL-53(Fe). Therefore, the MIL-53(Fe/Co) exhibited good performance in electrocatalytic water oxidation. This may be attributed to the alteration of the microstructure of MIL-53(Fe) after Co ion doping and the synergistic interaction between Fe/Co bimetals. In addition, the ability of MIL-53(Fe/Co = 1![[thin space (1/6-em)]](https://www.rsc.org/images/entities/char_2009.gif) :
:![[thin space (1/6-em)]](https://www.rsc.org/images/entities/char_2009.gif) 4) to electrocatalyse water oxidation to produce H2O2 at different potentials was also investigated, and it was found that MIL-53(Fe/Co = 1
4) to electrocatalyse water oxidation to produce H2O2 at different potentials was also investigated, and it was found that MIL-53(Fe/Co = 1![[thin space (1/6-em)]](https://www.rsc.org/images/entities/char_2009.gif) :
:![[thin space (1/6-em)]](https://www.rsc.org/images/entities/char_2009.gif) 4) had the highest H2O2 production at 2.13 V (vs. RHE).
4) had the highest H2O2 production at 2.13 V (vs. RHE).
Author contributions
Kunpeng Liu and Xu Wang: conceptualization, methodology, investigation, characterize materials, performance tests, writing – original draft. Nan Wang: conceptualization, methodology, writing – review & editing, funding acquisition. Ruiyong Zhang: resources, funding acquisition. Meinan Yang: performance tests. Baorong Hou: resources. Wolfgang Sand: funding acquisition.Data availability
The data that support the findings of this study are available from the corresponding authors upon reasonable request.Conflicts of interest
The authors declare no conflict of interest.Acknowledgements
The present work was supported by the National Natural Science Foundation of China (No. 42306228), Shandong Provincial Natural Science Youth Fund Project (ZR2022QD001), Key R&D Program of Shandong Province, China (No. 2022CXPT027) and the Taishan Scholars Program.Notes and references
- A. Herman, J. L. Mathias and R. Neumann, ACS Catal., 2022, 12, 4149–4155 CrossRef CAS.
- S. Mavrikis, S. C. Perry, P. K. Leung, L. Wang and C. P. de León, ACS Sustainable Chem. Eng., 2021, 9, 76–91 CrossRef CAS.
- L. J. Li, Z. F. Hu and J. C. Yu, Angew. Chem., Int. Ed., 2020, 59, 20538–20544 CrossRef CAS PubMed.
- C. Ling, A. P. Liang, C. L. Li and W. H. Wang, J. Zhejiang Univ., Sci., A, 2023, 24, 377–386 CrossRef CAS.
- X. J. Shi, S. Back, T. M. Gill, S. Siahrostami and X. L. Zheng, Chem, 2021, 7, 38–63 CAS.
- Y. Yao, H. Wang, K. Dong, H. Li, J. Liang, R. Li, S. Sun, Z. Cai, X. He, D. Zheng, Y. Luo, S. Alfaifi, D. Ma, W. Hu and X. Sun, J. Mater. Chem. A, 2023, 11, 22154–22160 RSC.
- Z. Deng, L. Li, Y. Ren, C. Ma, J. Liang, K. Dong, Q. Liu, Y. Luo, T. Li, B. Tang, Y. Liu, S. Gao, A. M. Asiri, S. Yan and X. Sun, Nano Res., 2022, 15, 3880–3885 CrossRef CAS.
- K. Dong, J. Liang, Y. Wang, Z. Xu, Q. Liu, Y. Luo, T. Li, L. Li, X. Shi, A. M. Asiri, Q. Li, D. Ma and X. Sun, Angew. Chem., Int. Ed., 2021, 60, 10583–10587 CrossRef CAS PubMed.
- W. L. Guo, S. S. Wang, Y. Q. Xie, C. Fang, L. L. Liu, Q. Lou, X. Lian and G. Henkelman, ACS Sustainable Chem. Eng., 2023, 11, 12114–12122 CrossRef CAS.
- Y. H. Jiang, L. L. Guan, Y. J. Jiao, C. X. Yu, F. Zhao, X. W. Zhou and Z. Liu, Electron. Mater. Lett., 2024, 20, 199–206 CrossRef CAS.
- J. H. Wang, D. Kim, J. H. Park, S. Ryu, M. Shokouhimehr and H. W. Jang, Energy Fuels, 2023, 37, 17629–17651 CrossRef CAS.
- J. Baek, Q. Jin, N. S. Johnson, Y. Jiang, R. Ning, A. Mehta, S. Siahrostami and X. L. Zheng, Nat. Commun., 2022, 13, 7256 CrossRef CAS PubMed.
- S. R. Kelly, X. J. Shi, S. Back, L. Vallez, S. Y. Park, S. Siahrostami, X. L. Zheng and J. K. Norskov, ACS Catal., 2019, 9, 4593–4599 CrossRef CAS.
- X. J. Shi, S. Siahrostami, G. L. Li, Y. R. Zhang, P. Chakthranont, F. Studt, T. F. Jaramillo, X. L. Zheng and J. K. Norskov, Nat. Commun., 2017, 8, 701 CrossRef PubMed.
- W. Guo, Y. Xie, S. Tang, B. Yu, X. Lian, G. Henkelman and X. Liu, Appl. Surf. Sci., 2022, 596, 153634 CrossRef CAS.
- S. G. Xue, L. Tang, Y. K. Tang, C. X. Li, M. L. Li, J. J. Zhou, W. Chen, F. Zhu and J. Jiang, ACS Appl. Mater. Interfaces, 2020, 12, 4423–4431 CrossRef CAS PubMed.
- A. Nadar, S. S. Gupta, Y. Kar, S. Shetty, A. P. van Bavel and D. Khushalani, J. Phys. Chem. C, 2020, 124, 4152–4161 CrossRef CAS.
- C. Q. Zhang, R. H. Lu, C. Liu, L. Yuan, J. Wang, Y. Zhao and C. Z. Yu, Adv. Funct. Mater., 2021, 31, 2100099 CrossRef CAS.
- C. Q. Zhang, J. Y. Lu, C. Liu, Y. Y. Zou, L. Yuan, J. Wang and C. Z. Yu, Environ. Res., 2022, 206, 112290 CrossRef CAS PubMed.
- D. Pangotra, L. I. Csepei, A. Roth, C. P. de León, V. Sieber and L. Vieira, Appl. Catal., B, 2022, 303, 120848 CrossRef CAS.
- S. Mavrikis, M. Göltz, S. C. Perry, F. Bogdan, P. K. Leung, S. Rosiwal, L. Wang and C. P. de León, ACS Energy Lett., 2021, 6, 2369–2377 CrossRef CAS.
- C. Xia, S. Back, S. Ringe, K. Jiang, F. H. Chen, X. M. Sun, S. Siahrostami, K. R. Chan and H. T. Wang, Nat. Catal., 2020, 3, 125–134 CrossRef CAS.
- Y. Kondo, Y. Kuwahara, K. Mori and H. Yamashita, Chem, 2022, 8, 2924–2938 CAS.
- L. Chen, L. Wang, Y. Y. Wan, Y. Zhang, Z. M. Qi, X. J. Wu and H. X. Xu, Adv. Mater., 2020, 32, 1904433 CrossRef CAS PubMed.
- Z. B. Wang, H. B. Wang, P. Wang, X. W. Liu, X. F. Lei, R. Guo, J. H. You and H. Z. Zhang, Coord. Chem. Rev., 2024, 499, 215506 CrossRef CAS.
- A. Goswami, D. Ghosh, V. V. Chernyshev, A. Dey, D. Pradhan and K. Biradha, ACS Appl. Mater. Interfaces, 2020, 12, 33679–33689 CrossRef CAS PubMed.
- H. Chen, Y. Liu, T. Cai, W. Dong, L. Tang, X. Xia, L. Wang and T. Li, ACS Appl. Mater. Interfaces, 2019, 11, 28791–28800 CrossRef CAS PubMed.
- D. Wen, Y. Ma, G. M. Mu, Q. P. Huang, X. F. Luo, D. M. Lin, C. G. Xu, F. Y. Xie, G. Z. Wang and W. H. Guo, Dalton Trans., 2023, 52, 10662–10671 RSC.
- B. Cui, C. Wang, S. Huang, L. He, S. Zhang, Z. Zhang and M. Du, J. Colloid Interface Sci., 2020, 578, 10–23 CrossRef CAS PubMed.
- T. Qiu, Z. Liang, W. Guo, H. Tabassum, S. Gao and R. Zou, ACS Energy Lett., 2020, 5, 520–532 CrossRef CAS.
- D. Chen, Q. Sun, C. Han, Y. Guo, Q. Huang, W. A. Goddard and J. Qian, J. Mater. Chem. A, 2022, 10, 16007–16015 RSC.
- X. Wang, Z. Qin, J. Qian, L. Chen and K. Shen, ACS Catal., 2023, 13, 10672–10682 CrossRef CAS.
- Z. Q. Li, R. Gao, M. Feng, Y. P. Deng, D. J. Xiao, Y. Zheng, Z. Zhao, D. Luo, Y. L. Liu, Z. Zhang, D. D. Wang, Q. Li, H. B. Li, X. Wang and Z. W. Chen, Adv. Energy Mater., 2021, 11, 2003291 CrossRef CAS.
- Y. Zhou, R. Abazari, J. Chen, M. Tahir, A. Kumar, R. R. Ikreedeegh, E. Rani, H. Singh and A. M. Kirillov, Coord. Chem. Rev., 2022, 451, 214264 CrossRef CAS.
- K. Dong, J. Liang, Y. Wang, L. Zhang, Z. Xu, S. Sun, Y. Luo, T. Li, Q. Liu, N. Li, B. Tang, A. A. Alshehri, Q. Li, D. Ma and X. Sun, ACS Catal., 2022, 12, 6092–6099 CrossRef CAS.
- M. Fan, J. Yan, Q. Cui, R. Shang, Q. Zuo, L. Gong and W. Zhang, Molecules, 2023, 28, 3622 CrossRef CAS PubMed.
- J. Luo, X. Luo, Y. Gan, X. Xu, B. Xu, Z. Liu, C. Ding, Y. Cui and C. Sun, Nanomaterials, 2023, 13, 2194 CrossRef CAS PubMed.
- S. Xu, H. Ni, X. Zhang, C. Han and J. Qian, Inorg. Chem., 2023, 62, 14757–14763 CrossRef CAS PubMed.
- C. H. Zhang, L. H. Ai and J. Jiang, J. Mater. Chem. A, 2015, 3, 3074–3081 RSC.
- K. Jiang, M. Luo, Z. X. Liu, M. Peng, D. C. Chen, Y. R. Lu, T. S. Chan, F. M. F. de Groot and Y. W. Tan, Nat. Commun., 2021, 12, 1687 CrossRef CAS PubMed.
- S. F. Zhang, Z. Y. Huang, T. T. Isimjan, D. D. Cai and X. L. Yang, Appl. Catal., B, 2024, 343, 123448 CrossRef CAS.
- M. W. Xie, Y. Ma, D. M. Lin, C. G. Xu, F. Y. Xie and W. Zeng, Nanoscale, 2020, 12, 67–71 RSC.
- W. Zheng and L. Y. S. Lee, ACS Energy Lett., 2021, 6, 2838–2843 CrossRef CAS.
- J. Tong, J. Wang, X. Shen, H. Zhang, Y. Wang, Q. Fang and L. Chen, Inorg. Chem., 2021, 60, 10715–10721 CrossRef CAS PubMed.
- K. Dong, J. Liang, Y. Wang, Y. Ren, Z. Xu, H. Zhou, L. Li, Q. Liu, Y. Luo, T. Li, A. M. Asiri, Q. Li, D. Ma and X. Sun, Chem. Catal., 2021, 1, 1437–1448 CrossRef CAS.
- N. Wang, S. Ma, J. Duan, X. Zhai, F. Guan, X. Wang and B. Hou, Electrochim. Acta, 2020, 340, 135880 CrossRef CAS.
- K. Dong, Y. Yao, H. Li, H. Li, S. Sun, X. He, Y. Wang, Y. Luo, D. Zheng, Q. Liu, Q. Li, D. Ma, X. Sun and B. Tang, Nat. Synth., 2024, 3, 763–773 CrossRef.
Footnote |
| † These authors contributed to the work equally and should be regarded as co-first authors. |
| This journal is © The Royal Society of Chemistry 2024 |

