Integration of a Raman spectroscopic platform based on online sampling to monitor chemical reaction processes
Jin
Wang
,
Wuye
Yang
,
Meng
Su
,
Huipeng
Deng
and
Yiping
Du
 *
*
School of Chemistry and Molecular Engineering, Shanghai Key Laboratory of Functional Materials Chemistry, Research Centre of Analysis and Test, East China University of Science and Technology, Shanghai 200237, China. E-mail: yipingdu@ecust.edu.cn
First published on 15th November 2024
Abstract
During the pharmaceutical synthesis process, it is essential to control the reaction time to avoid by-product formation and the reduction of yield. In this study, a Raman spectroscopic platform based on online sampling was integrated to collect Raman spectra in real time and realize process monitoring. Considering its attractive features of strong light transmittance and resistance to acids, alkalis and high temperatures, polyfluoroalkoxy (PFA) tubes rather than cuvette-type flow cells or similar devices were used to transfer solutions and as a flow cell for collecting Raman spectra, therefore not requiring an in situ Raman probe, and significantly reducing the cost of equipment. The peristaltic pump is controlled by the sampling software to realize automatic sampling, and it automatically pushes the reaction solution back into the reaction vessel after the spectra are collected. Taking the aspirin synthesis reaction as an example, the platform was employed to monitor the chemical reaction in real-time. The internal standard method was adopted to minimize the interference of spectral oscillation and baseline drift during online monitoring. The characteristic peak of the PFA tube at 731 cm−1 was selected as the internal standard peak, which formed the relative intensity ratio R with the characteristic peak of the product acetylsalicylic acid at 1606 cm−1. The endpoint of the reaction was identified based on the trend of the relative intensity ratio with the reaction time. The results indicate that the method is feasible for monitoring the aspirin synthesis reaction and provides a research basis for real-time monitoring of other pharmaceutical processes.
1. Introduction
The goal of the pharmaceutical synthesis process is to produce the maximum amount of end product cost-effectively with minimum time and energy consumption, avoiding the formation of by-products. In an effort to improve understanding of the drug manufacturing process and better control product quality, the U.S. Food and Drug Administration (FDA) has launched an initiative to encourage the pharmaceutical industry to implement process analytical techniques (PAT).1 The scientific concept of PAT was introduced as process analytical chemistry by Callis et al. in 1987.2 PAT can be considered as an inseparable link between the scientific fields of analytical chemistry and pharmaceutical technology.3 Reaction process monitoring is the most important operation in the pharmaceutical process. The main traditional method of monitoring reactions is to collect samples at different time points during the reaction process with sampling probes, followed by analysis with chromatographic methods such as thin layer chromatography (TLC),4 gas chromatography (GC),5 and high performance liquid chromatography (HPLC),6,7 and their hyphenated techniques.8–10 However, these methods are limited by the problem of time delays between sampling and analysis results, which fail to provide real-time information on the chemical reaction. In addition, the transportation of samples may induce dynamic processes that can alter the composition of the reaction mixture, leading to serious measurement errors. Thus, the use of fast and automated analytical approaches and techniques is essential in modern pharmaceutical production processes. With the advancement of computer technology, optronics, and improved instrument portability, various spectral analysis techniques have emerged as alternatives for online monitoring of different production processes, including ultraviolet-visible (UV-Vis),11 near-infrared (NIR),12,13 and infrared (IR)14–17 spectroscopies. However, the challenges of spectral overlap and the difficulties in spectral data interpretation restrict their application, as samples from the reactor typically consist of complex mixtures of reactants, products, by-products, and other impurities. The complex spectra with overlapping bands result in a weak correlation of intensity variations with the content of the analyte and a strong interference from other components. Compared with NIR spectroscopy which has been widely used in process monitoring, Raman spectroscopy, owing to its clear and selective characteristics with a narrow peak, is able to track the content of the components in the reaction system directly based on the change in the characteristic peak intensity in a suitable detection environment and under suitable conditions. Raman spectroscopy analysis has the advantages of non-destructive detection, short detection time, providing abundant information, etc. Raman spectroscopic information of the reaction medium can be obtained rapidly with a fiber optic probe, which is widely used in real-time monitoring of the drug production process.Since chemical reactions are often carried out in strong acid or alkali environments, ordinary Raman probes are susceptible to corrosion when submerged in the reaction solution, which leads to damage to the probes. In general, Raman spectroscopy for real-time monitoring of chemical reactions uses in situ probes that can be submerged in the reaction solution,18–26 which places high demands on the production of Raman probes, including the need to employ high-temperature-resistant and corrosion-resistant materials, which can be costly for actual industrial production. Johansson et al.27 utilized a Kaiser-type immersion Raman probe to investigate the influence of nitrogen dioxide absorption on the sulfite oxidation rate in the presence of oxygen. The body of the Kaiser-type immersion Raman probe was made of a C276 alloy, and the optical window was composed of sapphire. The probe should be cleaned and wiped with water and ethanol to avoid cross-contamination before collecting the next spectrum. Moreover, the sealing of the in situ probe is not an easy issue to solve.28,29 A common type of immersion in situ probe features a flat sapphire or glass window in contact with the sample and a lensed tube that can be positioned within the outer tube to adjust the focal position of the laser for the sample. To withstand extremely harsh chemical environments, probes may also be constructed with internal stainless steel and external polyether ether ketone (PEEK) sleeves, which are radiation resistant and have low flammability. This type of immersion probe enables measurements to be conducted in chemical environments at 200 °C. Another novel immersion Raman probe incorporating a spherical lens has been designed and optimized for conducting Raman measurements in both laboratory and industrial environments.28 In recent decades, some researchers have also tried to avoid the use of in situ Raman probes by modifying the reaction device. For example, Bauer et al.30 set up a 6 mm-thick quartz window in the reactor wall and positioned the Raman probe at the window, with compressed air continuously passed around the probe for cooling and a rubber gasket to prevent the reflected light from coming out. Santos et al.31 attached a Raman probe to a reactor window, which is made of 15 mm-wide glass and is suitable for reaching internal reactor pressures up to 60 bar. Fu et al.32 utilized a quartz reactor with a quartz optical window and a water bath interlayer to realize online Raman spectrum acquisition. Although the modification of the reaction device can prevent the Raman probe from being directly submerged in the reaction solution, the mechanical properties of the reaction device are maintained while its optical properties are enhanced, which increases the cost of the equipment to a certain extent.
Although Raman spectroscopy for in situ monitoring has been previously implemented in various applications, this work primarily addresses the challenges associated with the high cost of in situ Raman spectrometers, which makes it difficult for factories to invest significantly in equipping in situ Raman probes. In this study, a Raman spectroscopic monitoring platform was integrated. In the platform, a polyfluoroalkoxy (PFA) tube, which has attractive features of strong light transmittance and resistance to acids, alkalis and high temperatures, is utilized to extract the reaction solution out of the reactor with a peristaltic pump and an optical probe touched the PFA tube to directly collect the Raman spectrum of the solution inside, eliminating the need for a cuvette-type flow cell or similar device; after spectrum collection the solution flows backward into the reactor with the same peristaltic pump that is controlled by a sampling software to realize automatic sampling. The Raman probe does not need to be submerged in the reaction solution, which has the advantages of lower requirements for expensive measurement probes, longer useful life, and lower cost of monitoring. In this way, it facilitates the wide application of online monitoring in industrial production. This work chose the aspirin synthesis reaction as an example to evaluate the performance of the Raman spectroscopic platform, determine the reaction endpoint, and monitor the reaction process.
2. Experimental
2.1. Experimental apparatus and reagents
2.2. Integration of the online monitoring Raman spectroscopic platform
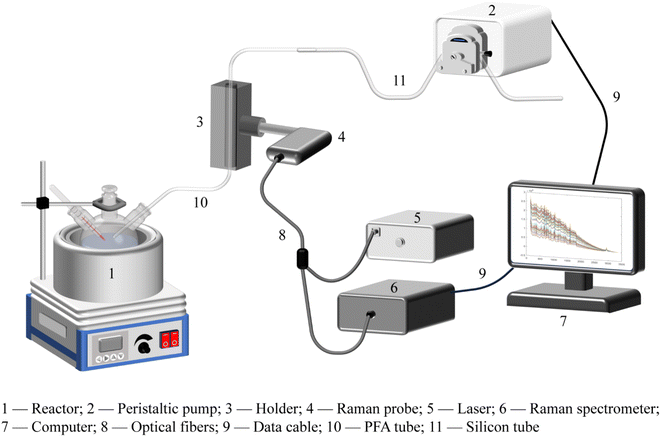
In this paper, a self-built Raman spectroscopic platform was assembled to realize the online monitoring of a chemical reaction system, as illustrated in Fig. 1, which mainly consists of a reaction device module, a solution extraction module, a spectral detection part, and a computer with an operation software. Specifically, the solution extraction module is composed of a peristaltic pump, a polyfluoroalkoxy tube and a silicon tube. The spectral detection part is made up of a Raman probe, a holder, a laser, a Raman spectrometer, and optical fibers. Polyfluoroalkoxy (PFA) is a polymer material with the advantages of resistance to acids and alkalis, as well as high temperatures. Due to its excellent light transmission and inexpensive cost, PFA has the potential to be utilized in a wide range of analytical applications. Herein, we compared the Raman spectra of a reaction solution inside the PFA tube with those obtained using a traditional cuvette. The experimental results demonstrated that the detected Raman spectra were nearly identical, indicating that PFA tubes could completely replace the cuvette-type flow cell for spectroscopic measurement, which significantly simplified the structure of the platform and reduced the equipment cost. A black resin holder is used to fix the PFA tube and the Raman probe to ensure a dark background for spectral detection. In order to prevent environmental light from interfering with Raman measurements, the connection between the PFA tube and the holder is wrapped on both ends with light-blocking tinfoil. A sampling software written in C# programming language is used to provide automatic peristaltic pump operation. This software can control the rotation direction, speed, time, and sampling interval of the peristaltic pump by sending commands through the peristaltic pump's interface. Using the sampling software, arbitrary sampling frequencies can be set, allowing for sufficient detection time. During the reaction process, the peristaltic pump pumps out the reaction solution from the reaction vessel according to the specific parameters, so that the solution can reach the appropriate detection position for static Raman detection. After the spectral collection is completed, the peristaltic pump runs in the reverse direction to push the extraction solution back into the reaction vessel. This process not only realizes automatic sampling but also avoids the loss of reaction solution, which ensures that the chemical reaction can be carried out as normal.2.3. Spectrum collection of the reaction process and spectral preprocessing
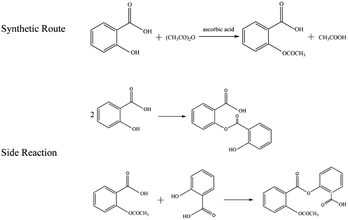
In this work, aspirin was prepared using the vitamin C-catalyzed method.33 The synthetic route and side reaction equations are shown in Fig. 2. In the traditional synthetic reaction system of aspirin, concentrated sulfuric acid is often used as a catalyst, which is highly corrosive to the equipment and has a certain extent of danger. Besides, it cannot be recycled and reused, and there are problems such as waste acid emission and pollution of the environment. Vitamin C can catalyze the acetylation of salicylic acid to synthesize aspirin, and has the characteristics of fast reaction speed, simple operation, and no need for recycling, requires mild reaction conditions, and exhibits no corrosion of instruments and equipment and no pollution of the environment, so it can be used instead of concentrated sulfuric acid as the catalyst for the acetylation of salicylic acid. In this experiment, the dosage ratio of salicylic acid and acetic anhydride was 1![[thin space (1/6-em)]](https://www.rsc.org/images/entities/char_2009.gif) :
:![[thin space (1/6-em)]](https://www.rsc.org/images/entities/char_2009.gif) 3, the amount of catalyst ascorbic acid was 3% of the mass of salicylic acid, and the reaction temperature was 65 °C. Since the initial stage of the reaction was the salicylic acid dissolution process, which was not suitable for extracting the solution for spectroscopic detection, the catalyst ascorbic acid was added after complete dissolution of salicylic acid. The dissolution time was about 15 min and the reaction time was about 60 ∼ 90 min.
3, the amount of catalyst ascorbic acid was 3% of the mass of salicylic acid, and the reaction temperature was 65 °C. Since the initial stage of the reaction was the salicylic acid dissolution process, which was not suitable for extracting the solution for spectroscopic detection, the catalyst ascorbic acid was added after complete dissolution of salicylic acid. The dissolution time was about 15 min and the reaction time was about 60 ∼ 90 min.
The spectral preprocessing method was baseline correction, which was performed using the adaptive iteratively reweighted Penalized Least Squares (airPLS) method,34 with the λ parameter set to 106. All Raman data processing and calculations in this work were completed in the Matlab software environment (Version R2023a, The Math Works, USA).
3. Results and discussion
3.1. Raman spectra of the reaction solution and compounds contained in the solution
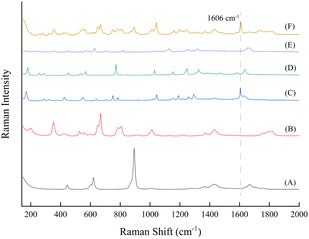
Including reactants and products, there are compounds of salicylic acid, acetic anhydride, acetylsalicylic acid, acetic acid and ascorbic acid in the reaction solution; spectra in the Raman shift range of 140 ∼ 2000 cm−1 of these compounds and a reaction solution at the midpoint of the reaction are shown in Fig. 3. In the figure, the Raman spectra of each compound exhibit a high degree of overlap between 200 and 1500 cm−1. Acetylsalicylic acid (C) has a strong characteristic peak at 1606 cm−1, which corresponds to the C![[double bond, length as m-dash]](https://www.rsc.org/images/entities/char_e001.gif) C stretching vibration on the benzene ring skeleton. Furthermore, the reaction solution at the midpoint of the reaction (F) also displays a distinct peak at the same wavenumber. This peak does not overlap with the characteristic peaks of other compounds, which means its intensity changes throughout the process of the reaction only in relation to its own content, so it can be utilized as a target peak for online monitoring, and the reaction process can be determined by tracking the intensity change of this peak during the reaction process.
C stretching vibration on the benzene ring skeleton. Furthermore, the reaction solution at the midpoint of the reaction (F) also displays a distinct peak at the same wavenumber. This peak does not overlap with the characteristic peaks of other compounds, which means its intensity changes throughout the process of the reaction only in relation to its own content, so it can be utilized as a target peak for online monitoring, and the reaction process can be determined by tracking the intensity change of this peak during the reaction process.
3.2. Optimization of the online monitoring platform
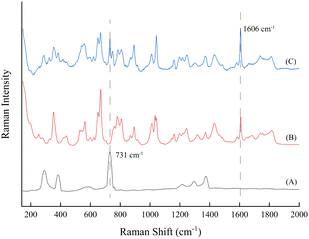
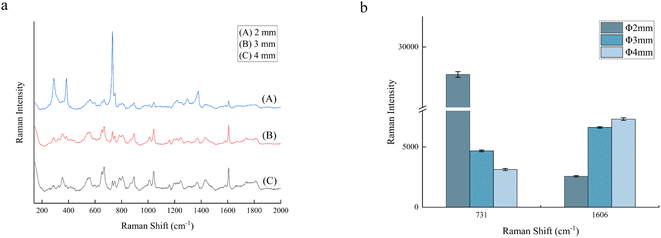
A reaction solution was prepared, and its Raman spectra were measured with the PFA tube and traditional glass cuvette. As shown in Fig. 4, the spectral peaks of compounds in the solution exhibit no obvious changes in both Raman shift and intensity, but in the spectrum of the PFA tube, the characteristic peaks of the PFA tube itself are observed. It is lucky that the few peaks are weak and have no interference with the reaction monitoring process, which proves that the PFA tube can be used to transport solutions and measure their Raman spectra.
3.3. Internal standard peak selection
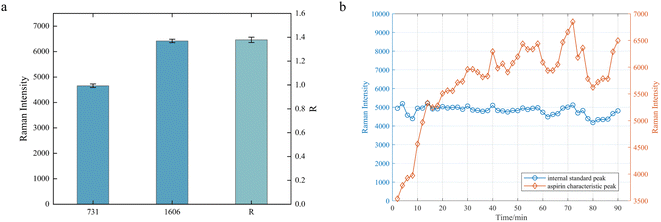
During the online monitoring, the Raman spectra of the reaction solution exhibit a strong spectral background and baseline shift phenomenon, which leads to the implementation of the method of determining the reaction process by tracking the intensity change of the target characteristic peak with certain difficulties. Besides, spectral oscillation may occur during the online monitoring process. Thus, the internal standard method was employed in this study to minimize the impact of these factors on detection.In contrast to the conventional internal standard approach, which relies on the addition of internal standards or the utilization of solvent characteristic peaks, the characteristic peak of the PFA tube at 731 cm−1 was selected as the internal standard reference peak in this study because the PFA tube exhibits no change during the reaction process and this peak is strong enough. The internal standard peak was analyzed and evaluated in terms of both interference and stability. As shown in Fig. 4, the peaks of the PFA tube at 731 cm−1 and the reaction solution at 1606 cm−1 do not interfere with each other. Fig. 7a shows the averaged intensities at the two peaks and their ratio of 10 measurements for the reaction solution at the end of the reaction, indicating that the internal standard peak, the characteristic peak of the product, and their relative intensities are stable, with relative standard deviations (RSDs) of less than 1.5%. In addition, Fig. 7b illustrates the intensity variation of the internal standard peak and the aspirin characteristic peak throughout the reaction process. It is evident that the intensity of the characteristic peak of aspirin fluctuates significantly, making it difficult to determine the endpoint of the reaction, while there is a smaller fluctuation in the peak intensity of the internal standard but a similar fluctuation tendency to that of the characteristic peak of aspirin. As mentioned above, the peak of the PFA tube at 731 cm−1 was demonstrated to function as the internal standard peak, thus avoiding any potential influence on the synthesis reaction resulting from the addition of the internal standard. The ratio of the characteristic peak intensity at 1606 cm−1 for aspirin to the characteristic peak intensity at 731 cm−1 for PFA is expressed as the relative intensity ratio, R = I1606/I731, which can be interpreted as the response value for tracking the reaction process.
3.4. Aspirin synthesis reaction monitoring with the online Raman method and comparison with the ultraviolet-visible (UV) offline approach
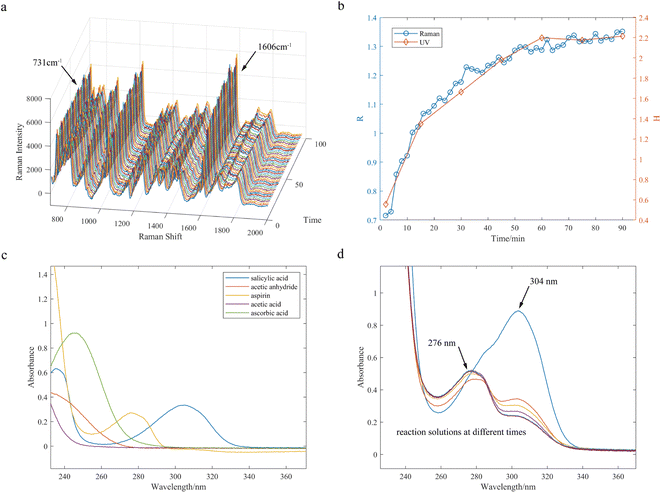
The 45 Raman spectra collected during the aspirin synthesis reaction at a temperature of 65 °C were employed as an illustrative example to demonstrate the changes in the characteristic peak of the products and the internal standard peak throughout the progression of the reaction (Fig. 8a). The intensity of the internal standard peak was not affected by the chemical reaction and remained stable during the reaction, and the intensity of the aspirin characteristic peak gradually increased, consistent with the principles of chemical reaction kinetics. As shown in Fig. 8b, the curve illustrates the relative intensity ratio R, composed of the intensity of the internal standard peak of PFA and the intensity of the spectral peak of acetylsalicylic acid at 1606 cm−1 as a function of reaction time, and the endpoint of the reaction can be easily determined from the curve.To verify the monitoring results obtained with the Raman spectroscopic platform, the UV spectroscopic offline approach was used to offline detect UV spectra and investigate changes in absorbance of a characteristic peak of aspirin at 276 nm. A volume of 200 μL of the reaction solution was taken out every 15 minutes during the reaction process, diluted with anhydrous ethanol, and prepared as an offline sample for UV analysis. Fig. 8c shows the UV absorption spectra of compounds contained in the reaction solution. The maximum absorption wavelengths of aspirin and salicylic acid are observed to be 276 nm and 304 nm, respectively; however, the absorption peak of aspirin significantly overlaps with those of salicylic acid and ascorbic acid. Ascorbic acid serves as the catalyst, with its concentration typically remaining constant throughout the reaction, while salicylic acid is a reactant whose concentration continuously decreases. Therefore, a ratio of H = A276/A304 is considered as a relative absorbance for tracking the reaction process. The UV absorption spectra of the offline samples are shown in Fig. 8d. A curve depicting the relationship between relative absorbance H and reaction time is shown in Fig. 8b. Comparing the curves obtained with the relative intensity ratio of Raman intensity and relative UV absorbance, it can be concluded that the trend of the relative intensity ratio R is basically consistent with the UV absorbance ratio H of the offline samples, which can validate the accuracy of Raman online monitoring using the internal standard method.
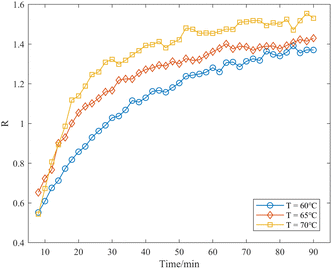
In this study, Raman spectra were collected for the aspirin synthesis reactions carried out at temperatures of 60 °C, 65 °C, and 70 °C. The relationship between the relative intensity ratio R and the reaction time at different temperatures was established, as illustrated in Fig. 9. The curves clearly reveal the dynamic trend of the production of aspirin throughout the reaction. Comparing the curves, it is obvious that the higher the reaction temperature, the higher the R value, which indicates the acceleration of the reaction rate and the increase in product yield with the increase in temperature in the range of 60 ∼ 70 °C. When the reaction temperature reached 70 °C, it tended to approach equilibrium after approximately 50 minutes. According to the results reported in the literature,33 when the reaction temperature of vitamin C-catalyzed synthesis of aspirin is maintained between 50 and 70 °C, the higher the reaction temperature, the higher the product yield, aligning with the findings presented herein. Compared with the traditional monitoring means, the method proposed in this study is able to track the reaction process, and determine the reaction endpoint and product yield in a fast and easy way, which makes it possible to quickly select the optimal reaction conditions in industrial synthesis.
4. Conclusions
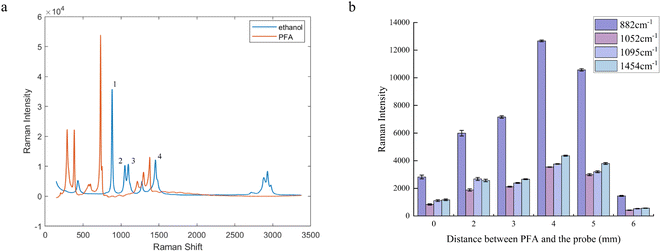
In this study, an online monitoring platform based on Raman spectroscopy was integrated, using PFA tubes in place of cuvette-type flow cells or similar devices. The operation of the peristaltic pump was controlled by sampling software to realize automatic sampling. Compared to conventional Raman spectroscopy for real-time monitoring of chemical reactions through in situ probes, which are instrumentally demanding and expensive, the online monitoring platform avoids the situation where the probe needs to be submerged in the reaction vessel and has lower requirements for the equipment, which greatly reduces the monitoring cost and extends the instrument life.Furthermore, this work selected the aspirin synthesis reaction as a case study to assess the performance of the Raman spectroscopic platform. The self-built platform was optimized in order to obtain Raman spectra of better quality. The inner diameter of the polyfluoroalkoxy (PFA) tube and the distance between the Raman probe and the PFA tube were carefully determined. The characteristic peak of the PFA tube at 731 cm−1 was chosen as the internal standard peak. The relative intensity ratio R was composed of the peak of the product acetylsalicylic acid at 1606 cm−1 and the internal standard peak. The trend of the relative intensity ratio with the reaction time can reflect the chemical reaction process and identify the endpoint of the reaction. Additionally, the results from offline samples analyzed through the UV absorbance ratio method corroborated the findings from Raman online monitoring. Compared to the traditional time-consuming and labor-intensive methods of reaction process monitoring, this online monitoring platform provides a fast, non-destructive and accurate analytical approach, which has widespread potential application prospects in the industrial field.
Data availability
Data collected from online monitoring platform and the software developed in this work, described in [Fig. 1], are not available for confidentiality reasons. The data are not publicly available due to privacy or ethical restrictions. The data that support the findings of this study are available on request from the corresponding author.Author contributions
Yiping Du: conceptualization, methodology, supervision, project administration, writing – review & editing. Jin Wang: formal analysis, investigation, methodology, writing – original draft. Wuye Yang: software. Meng Su: writing – review & editing. Huipeng Deng: formal analysis.Conflicts of interest
There are no conflicts to declare.References
- D. C. Hinz, Anal. Bioanal. Chem., 2006, 384, 1036–1042 CrossRef PubMed.
- J. B. Callis, D. L. Illman and B. R. Kowalski, Anal. Chem., 1987, 59, 624A CrossRef.
- T. R. M. De Beer, C. Bodson, B. Dejaegher, B. Walczak, P. Vercruysse, A. Burggraeve, A. Lemos, L. Delattre, Y. V. Heyden, J. P. Remon, C. Vervaet and W. R. G. Baeyens, J. Pharm. Biomed. Anal., 2008, 48, 772–779 CrossRef PubMed.
- B. Hemmateenejad, M. Akhond, Z. Mohammadpour and N. Mobaraki, Anal. Methods, 2012, 4, 933 RSC.
- X.-S. Chai, J.-F. Zhong and H.-C. Hu, J. Chromatogr. A, 2012, 1238, 128–131 CrossRef PubMed.
- N. V. Ganesh, K. Fujikawa, Y. H. Tan, K. J. Stine and A. V. Demchenko, Org. Lett., 2012, 14, 3036–3039 CrossRef PubMed.
- L. J. Coates, A. Gooley, S. C. Lam, B. Firme, P. R. Haddad, H.-J. Wirth, A. Diaz, F. Riley and B. Paull, Anal. Chim. Acta, 2023, 1247, 340903 CrossRef PubMed.
- L. Lohrey, S. Marschik, B. Cramer and H.-U. Humpf, J. Agric. Food Chem., 2013, 61, 114–120 CrossRef PubMed.
- Y. Qian, Z. Wang, J. Tuo, M. Zhang, C. Wu and T. Zhang, Pet. Sci. Technol., 2017, 35, 134–140 CrossRef.
- T. C. Malig, J. D. B. Koenig, H. Situ, N. K. Chehal, P. G. Hultin and J. E. Hein, React. Chem. Eng., 2017, 2, 309–314 RSC.
- F. Sánchez Rojas and C. Bosch Ojeda, Anal. Chim. Acta, 2009, 635, 22–44 CrossRef PubMed.
- Y. Roggo, P. Chalus, L. Maurer, C. Lema-Martinez, A. Edmond and N. Jent, J. Pharm. Biomed. Anal., 2007, 44, 683–700 CrossRef.
- Y. Wu, Y. Jin, Y. Li, D. Sun, X. Liu and Y. Chen, Vib. Spectrosc., 2012, 58, 109–118 CrossRef.
- G. Fevotte, Int. J. Pharm., 2002, 241, 263 CrossRef PubMed.
- N. Taquet, J. Pironon, P. De Donato, H. Lucas and O. Barres, Int. J. Greenhouse Gas Control, 2013, 12, 359–371 CrossRef.
- C. B. Minnich, P. Buskens, H. C. Steffens, P. S. Bäuerlein, L. N. Butvina, L. Küpper, W. Leitner, M. A. Liauw and L. Greiner, Org. Process Res. Dev., 2007, 11, 94–97 CrossRef.
- C. B. Minnich, L. Küpper, M. A. Liauw and L. Greiner, Catal. Today, 2007, 126, 191–195 CrossRef.
- M. Aßmann, A. Stöbener, C. Mügge, S. K. Gaßmeyer, L. Hilterhaus, R. Kourist, A. Liese and S. Kara, React. Chem. Eng., 2017, 2, 531–540 RSC.
- Y.-H. Liu, J.-D. Zhang, K. Yan, Y.-J. Wei, Q.-Q. Zhang, F. Lu and Z.-Y. Yan, Chin. J. Anal. Chem., 2017, 45, e1701–e1708 Search PubMed.
- W. Tong, G. Zhou and J. H. Waldman, Org. Process Res. Dev., 2022, 26, 1184–1190 CrossRef.
- V. Calvino-Casilda, M. A. Bañares and E. LozanoDiz, Catal. Today, 2010, 155, 279–281 CrossRef.
- Y. Hu, J. K. Liang, A. S. Myerson and L. S. Taylor, Ind. Eng. Chem. Res., 2005, 44, 1233–1240 CrossRef CAS.
- P. Novak, A. Kišić, T. Hrenar, T. Jednačak, S. Miljanić and G. Verbanec, J. Pharm. Biomed. Anal., 2011, 54, 660–666 CrossRef CAS PubMed.
- O. Elizalde, J. R. Leiza and J. M. Asua, Macromol. Symp., 2004, 206, 135–148 CrossRef CAS.
- T. R. M. De Beer, W. R. G. Baeyens, J. Ouyang, C. Vervaet and J. P. Remon, Analyst, 2006, 131, 1137 RSC.
- H. Wikström, I. R. Lewis and L. S. Taylor, Appl. Spectrosc., 2005, 59, 934–941 CrossRef PubMed.
- J. Johansson, J. D. Wagaarachchige, F. Normann, Z. Idris, E. R. Haugen, M. Halstensen, W. Jinadasa, K. J. Jens and K. Andersson, Ind. Eng. Chem. Res., 2023, 62, 21048–21056 CrossRef.
- B. Marquardt, T. Le and L. Burgess, Proceedings of SPIE - The International Society for Optical Engineering, 2001, 4469 Search PubMed.
- T. R. McCaffery and Y. G. Durant, J. Appl. Polym. Sci., 2002, 86, 1507–1515 CrossRef.
- C. Bauer, B. Amram, M. Agnely, D. Charmot, J. Sawatzki, N. Dupuy and J.-P. Huvenne, Appl. Spectrosc., 2000, 54, 528–535 CrossRef.
- J. C. Santos, M. M. Reis, R. A. F. Machado, A. Bolzan, C. Sayer, R. Giudici and P. H. H. Araújo, Ind. Eng. Chem. Res., 2004, 43, 7282–7289 CrossRef.
- H. Fu, M. Li, M. Guo, H. Tang, T. Zhang and H. Li, Spectrochim. Acta, Part A, 2023, 289, 122231 CrossRef PubMed.
- Z. Xiong and L. Yuan, J. Coll. Sci. Teach., 2008, 28, 74–77 Search PubMed.
- Z.-M. Zhang, S. Chen and Y.-Z. Liang, Analyst, 2010, 135, 1138 RSC.
| This journal is © The Royal Society of Chemistry 2025 |

