A simple and highly sensitive colorimetric assay for the visual detection of lead and chromium using ascorbic acid capped gold nanoparticles
Colby
Hladun†
a,
Maximilian
Beyer†
a,
John
Paliakkara
a,
Ali
Othman
 b and
Fadi
Bou-Abdallah
 *a
*a
aDepartment of Chemistry, State University of New York, Potsdam, NY 13676, USA. E-mail: bouabdf@potsdam.edu
bDepartment of Chemistry & Biomolecular Science, Clarkson University, Potsdam, NY 13699, USA
First published on 14th November 2024
Abstract
Lead (Pb2+) and hexavalent chromium (Cr6+) are highly toxic pollutants with no safe exposure levels, posing significant health risks globally, especially in developing countries. Current detection methods for these metals are often complex and inaccessible, highlighting the urgent need for innovative approaches. In this study, we present a rapid, cost-effective colorimetric assay utilizing ascorbic acid-capped gold nanoparticles (AuNPs) for the selective detection of Pb2+ and Cr3+/6+ ions at levels recommended by regulatory bodies such as the WHO and EPA. The synthesis of our AuNPs was achieved by reducing gold(III) chloride with ascorbic acid, resulting in stable, negatively charged nanoparticles, as characterized by dynamic light scattering, UV-vis spectroscopy and high-resolution transmission electron microscopy. Our method demonstrated high sensitivity, with limits of detection (LOD) of 5.4 ± 0.25 ppb for Pb2+, and 6.3 ± 0.23 ppb for Cr6+, confirming specificity towards these ions in various water samples. The assay's efficacy was validated in real-world applications, including testing drinking water from multiple sources and assessing the performance of filtration systems. This straightforward assay offers a promising tool for monitoring water quality, enhancing public health initiatives and accessibility to critical environmental testing.
Introduction
Lead and hexavalent chromium are highly toxic pollutants with no safe exposure levels,1–4 regulated by organizations like the WHO and EPA. Lead poisoning is particularly severe in developing nations, where the World Health Organization (WHO) estimates that about 240 million individuals are overexposed, leading to over one million deaths each year and underscoring a pressing need to develop technologies to detect and alleviate Pb2+ toxicity.5,6 Current detection methods, though accurate, are limited by complexity and accessibility.7–9 Gold nanoparticles (AuNPs) serve as versatile colorimetric sensors, detecting hazardous chemicals and ensuring food quality and safety.10,11 Moreover, functionalized AuNPs find extensive medical applications, including immunoassays, therapies, drug delivery, and bioimaging.12,13 Despite the extensive use of AuNPs in the detection of toxic metals like lead,14–18 there are no studies that report on the exclusive and selective detection of both lead and hexavalent chromium at EPA or WHO-recommended levels. Here, we propose a simple, rapid colorimetric assay using non-modified gold nanoparticles and ascorbic acid. Our method detects Pb2+ and Cr3+/6+ ions at levels recommended by regulatory bodies, with visual color changes occurring within seconds. Tested on various drinking water samples, our approach offers a cost-effective and efficient means of detecting these hazardous metals.At the nanoscale, quantum effects influence nanoparticle properties. As gold nanoparticles decrease in size, a surface plasmon, caused by electron oscillation, emerges. This phenomenon, called localized surface plasmon resonance (LSPR), generates electromagnetic waves along the metal dielectric interface. Changes in nanoparticle size, shape, and dielectric constant, along with chemical composition, alter refractive index in the presence of metal ions, leading to LSPR peak frequency shifts and nanoparticle color changes.19,20 This frequency shift forms the basis for biosensing, imaging, and other biomedical applications of gold nanoparticles, enabling their versatility in detecting various substances, including toxic metals such as lead and chromium.21,22
Materials and methods
Materials
Gold(III) chloride trihydrate (HAuCl4·3H2O, 99.9%) and L-ascorbic acid (99%) were obtained from Sigma-Aldrich. NaCl, ZnSO4·7H2O, NiSO4·6H2O, CaSO4·2H2O, PbCl2, FeSO4·7H2O, HgCl2, Na2HAsO4·7H2O, CrCl3·6H2O, HCl, and NaOH were obtained from Fisher Scientific, MgSO4·7H2O, Al2(SO4)3·16H2O, and CrO3 from J.T. Baker Chemical, Cd(NO3)2·4H2O from Mallinckrodt Chemicals, and Cu(NO3)2·2.5H2O from EM Science.Nanoparticle synthesis
Fresh working solutions of 5 mM HAuCl4·3H2O and 40 mM ascorbic acid (AA) were prepared in DI water. The pH of the AA solution was adjusted to 8.0 ± 0.1 with NaOH while stirring. The gold nanoparticles (AuNPs) were prepared by rapidly mixing 12 ml of 40 mM AA with 1.5 ml of 5 mM HAuCl4·3H2O and adjusting the volume to 30 ml with DI water. This mixture (0.25 mM HAuCl4 and 16 mM AA at pH 8) was vortexed for 30 seconds resulting in a royal blue color which when placed in a boiling water bath for ∼5 min, while stirring, led to a purple color change followed by a final ruby red color. We note that boiling the AuNPs solution resulted in a quicker color change to ruby color compared to up to 24 hours if the nanoparticles were left to mature at room temperature or at 4 °C.Preparation of stock solutions of metal ions
The metal ions tested in this study include Na+, K+, Ca2+, Ni2+, Cu2+, Mn2+, Mg2+, Zn2+, Fe2+, Cd2+, Pb2+, Hg2+, Fe3+, Al3+, Cr3+, As5+, and Cr6+ and were prepared in Milli-Q DI water using their respective metal salts. Fe3+ was prepared through the oxidation of Fe2+ ions in DI water over a period of a few hours, until a yellow tint color appears, the strength of it depended on the concentration used. For the colorimetric assay, AuNPs were added to different metal ions solutions prepared in parts per billion (ppb) concentrations ranging between 10 and 1000 ppb. Images were then taken either at 5 minutes following mixing, or up to 4 hours to see if further visual color change has occurred.Sample preparation
Stock solutions (500, 50, 5, and 0.5 μM) of metal ions were prepared by weighing 5–15 mg of metal salt and dissolving it in 500–1500 μl, followed by appropriate dilutions in DI water, pH 2. For ionic strength testing, 1.0 M working stock solutions of NaCl, KCl, KI, LiCl, CaCl2, and MgSO4 were prepared in DI water, pH 2. Metal ions from stock solutions were added to a plastic cuvette to achieve the desired concentration in a total volume of 1 ml. Typically, 50 μl from a metal ion stock solution, 15 μl of 1 M HCl and 15 μl of 1 M NaCl were mixed with 500 μl of the nanoparticle stock solution and adjusted to 1 ml with DI water. The addition of 15 mM HCl not only improved the detection and sensitivity of our assay, but also helped to dissolve insoluble metal oxide particles.Characterization of ascorbic acid capped gold nanoparticles (AuNPs)
The average particle size from dynamic light scattering (DLS) and surface charge from zeta-potentials (Z) were measured using a zeta-potential PALS analyzer (Brookhaven Institute Co.) at 25.0 °C with n = 6. The surface morphology of the AuNPs before and after exposure to metal ions was evaluated using high-resolution transmission electron microscopy (HR-TEM, JEOL JSM-2010) operated at an accelerating voltage of 200 kV. The samples were deposited on a TEM copper grid (obtained from Ted Pella) and were dried under vacuum before analysis. The average particle size was determined from HR-TEM images using an open-source image-processing program ImageJ (http://imagej.net/). The absorbance spectra of the AuNPs solutions were then characterized by UV-vis spectroscopy on a Varian Cary 50 Bio or Cary 60 spectrophotometers from Agilent Technologies in the range of 350–900 nm and shows the characteristics SPR peaks around 520 nm.19 The concentration of the gold nanoparticles solution was estimated to be 0.41 nM.20Limit of detection (LOD)
To determine the limit of detection (LOD) and its uncertainty, UV-vis calibration curves were generated from the mean of 2 to 3 runs, and the corresponding regression analysis for hexavalent chromium and lead were determined using eqn (1) and (2), and established protocols.23 All samples were prepared in a 50/50 v/v dilution of AuNPs with DI water in the presence of 15 mM NaCl and 15 mM HCl, and immediately scanned on the UV-vis spectrophotometer. | (1) |
 | (2) |
Colorimetric detection using smartphone
Standard curves for Pb2+ and Cr6+ were prepared by mixing cation concentrations of 0, 5, 10, 15, and 20 ppb with gold nanoparticles in 1 ml cuvettes. The mixtures were incubated in the dark at room temperature for 10 minutes. To evaluate the detection capability of the AuNPs using a smartphone, each sample was photographed under consistent ambient lighting against a white background to minimize external light interference, using a Samsung Galaxy S22 Ultra. Images were captured from the same region of interest (i.e. the center of each sample) and analyzed using ImageJ software (version 1.53), with the mean RGB values plotted against the metal ion concentrations, followed by linear regression analysis.Results and discussion
Gold nanoparticles: synthesis and characterization
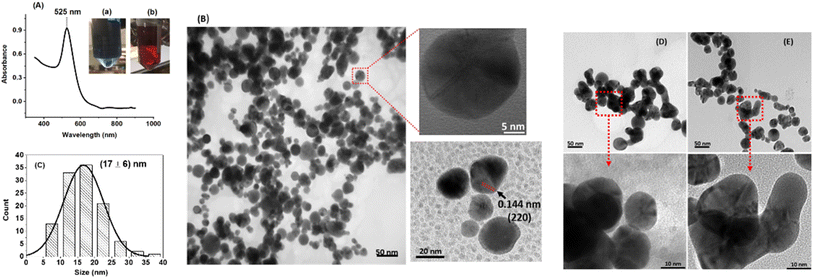
Our AuNPs were synthesized using ascorbic acid, acting as both a reducing and capping agent, determining their size and shape. These nanoparticles are stabilized by repulsive forces, mainly electrostatic repulsion from surface hydroxyl groups, preventing aggregation in water. Aggregation alters the electric field and surface charge, reflected in zeta potential values. Our negatively charged AuNPs showed a shift in zeta potential from −15.0 mV in the absence of metal ions to −10.7 mV and −4.2 mV in the presence of Pb2+ and Cr6+ cations, respectively.Fig. 1 displays the UV-vis spectrum and HR-TEM images of our AA-capped gold nanoparticles. The absorbance peak at 525 nm corresponds to surface plasmon resonance, giving the nanoparticles a ruby-red color.
HR-TEM shows mono-dispersed, spherical nanoparticles with an average size of 17 ± 6 nm. High magnification reveals lattice fringes with a characteristic interplanar distance of 0.144 nm, confirming successful AuNP preparation.24 The characteristic interplanar distance of 0.144 nm observed in high magnification lattice fringes of gold nanoparticles corresponds to the (220) planes in the face centered cubic (FCC) crystal structure of gold. This distance matches the theoretical interplanar spacing calculated for these planes based on the known lattice parameter of gold which is approximately 0.408 nm.
AuNPs assay stability, selectivity, and limit of detection (LOD)
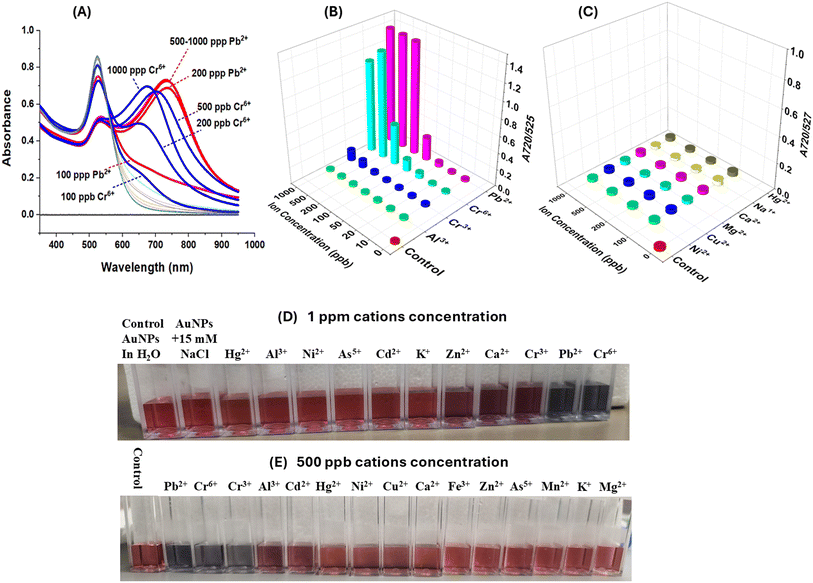
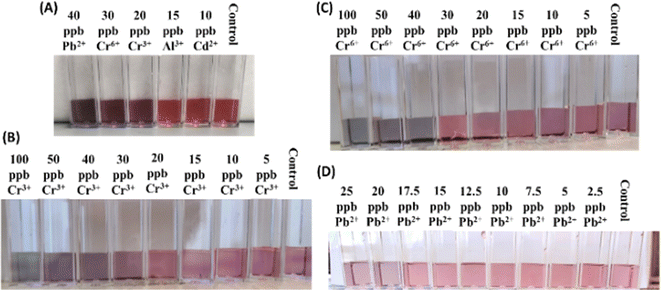
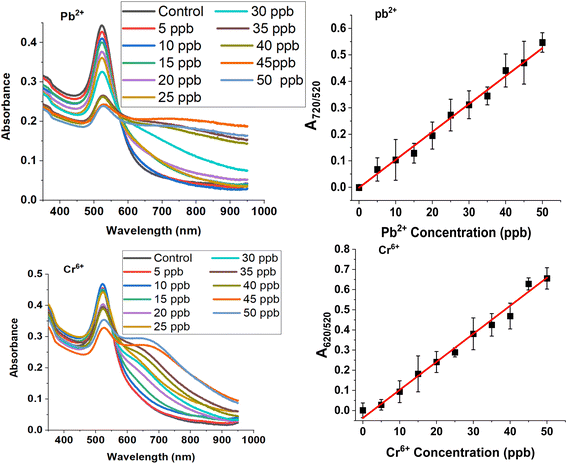
Our freshly synthesized AuNPs demonstrated stability at 4 °C for several days without compromising color or functionality. Our results were collected using either freshly prepared, or 2–5 days old, AuNPs with good reproducibility. We chose to work with a variety of relevant analytes such Na+, K+, Mg2+, Mn2+, Zn2+, Ca2+, Ni2+, Fe2+/3+, Cu2+, Al3+, Cd2+, As3+, Hg2+ and Pb2+ and Cr6+ because of their different ionic sizes and charges and presence in either bottled water or groundwater sources.25,26 UV-vis spectroscopy revealed cation-induced aggregation, notably by Pb2+ and Cr6+, leading to a decrease in the characteristic absorption band at ∼520 nm and the emergence of a new peak at ∼720 nm (Fig. 2). The ratio of SPR peaks varied with cation type and concentration, indicating the degree of AuNP aggregation. Testing various cations showed that only Pb2+ and Cr6+ caused significant changes in SPR bands and AuNP color, highlighting the assay's specificity for these ions. Even at 1 ppm concentration, the A730/520 absorbance ratio differed markedly for Pb2+ and Cr6+, compared to other cations (Fig. 2).The optical properties of gold nanoparticles are influenced by factors such as size, shape, surface structure, aggregation state, and the surrounding medium. Higher AuNPs concentrations enhance interaction with target analytes, improving nanoprobe strength, but can obscure small color changes due to a stronger background signal. Lower concentrations improve detection limits but reduce the number of nanoprobes. Thus, optimal detection occurs at intermediate AuNPs concentrations, balancing background noise and aggregation rate. To improve the visual detection of AuNP aggregation induced by cations, we focused on those causing color changes at 500 ppb (i.e. Cd2+, Al3+, Cr3+, Cr6+, and Pb2+), repeating the experiment with 15 mM NaCl and 15 mM HCl. These conditions enhanced visual detection of only Cr3+, Cr6+, and Pb2+ down to 100 ppb (Fig. 3). Further dilution in DI water (50/50 v/v) further improved detection down to 30 ppb for Cr3+, 40 ppb for Cr6+, and 20 ppb for Pb2+ due to a lighter AuNP background color (Fig. 3). The limit of detection (LOD) was calculated using the standard deviation of response and slope method23 using known analytes concentrations of (0–50 ppb) (Fig. 4, Table 1).
| Lead (Pb2+) | Hexavalent chromium (Cr6+) | |
|---|---|---|
| SE regression | 0.017 | 0.0266 |
| Slope of calibration curve | 0.011 | 0.0139 |
| LOD (ppb) | 5.4 | 6.3 |
| Slope standard error | ±5.3 × 10⁻⁴ | ±5.27 × 10⁻⁴ |
| LOD standard error | ±0.25 | ±0.23 |
The results in Fig. 4 and Table 1 show LOD values for Cr6+ and Pb2+ below the upper permissible limits in drinking water set by WHO or EPA. The assay demonstrates high sensitivity, with LOD values of 5.4 ± 0.25 ppb for Pb2+ and 6.3 ± 0.23 ppb for Cr6+. However, a LOD for Cr3+ ions couldn't be determined due to the absence of a bathochromic shift in the LSPR peak frequency at ppb concentrations.
Proposed mechanism of AuNPs formation and metal ion complexation
Ascorbic acid has been frequently used in the synthesis of spherical gold nanoparticles, acting as a two-electron donor, and demonstrating efficient reduction of gold(III) complex ions with a 1![[thin space (1/6-em)]](https://www.rsc.org/images/entities/char_2009.gif) :
:![[thin space (1/6-em)]](https://www.rsc.org/images/entities/char_2009.gif) 1 stoichiometry of ascorbic acid to Au(III):
1 stoichiometry of ascorbic acid to Au(III):| [AuCl4]− + AA → [AuCl2]− + AADH + 2Cl− |
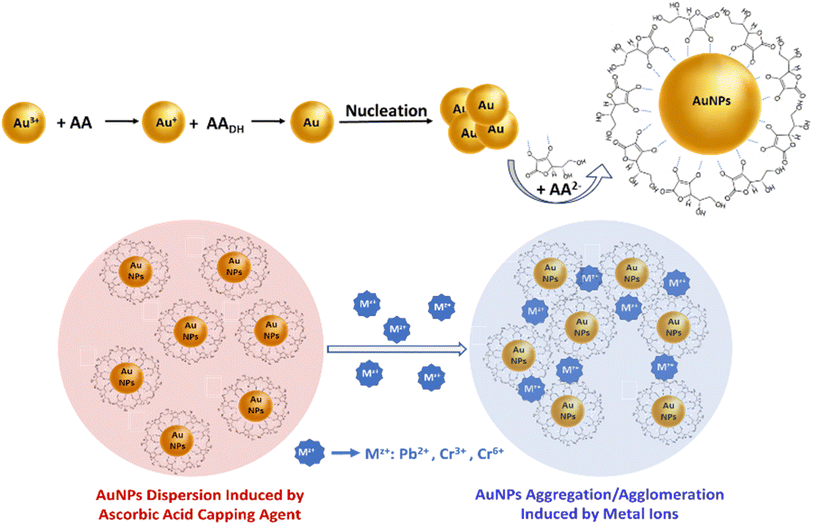 | ||
| Scheme 1 Representation of the AA-capped AuNPs formation process and illustration of the proposed mechanism of metal ions (Mz+) detection using ascorbic acid-capped AuNPs. | ||
The AA surface coordination of the AuNPs through the two hydroxy groups on the lactone ring, and the strong and stable AA surface coordination of the AuNPs through the two hydroxy groups on the lactone ring, and the strong and stable molecular assembly between Pb2+ and Cr3+/6+ cations and AA-capped AuNPs result in their aggregation.18,28 The change in color of the dispersed AA-AuNPs from their characteristic SPR band at 525 nm to a wavelength >620 nm indicates the aggregation of AA-AuNPs, as seen in the HR-TEM images (Fig. 1), and the Z-potential shift towards charge neutralization. This highly selective and metal-induced aggregation of the AuNPs is due to surface complexation between the metal cations and the functional groups (i.e. HO– of AA) attached to the AuNPs surface interface (Scheme 1).
An earlier study utilized ascorbic acid-capped gold nanoparticles for the selective colorimetric and visual detection of Al3+ in ground water.29 Although similar reagents were used, the synthesis of the AuNPs in the previous study differed significantly from our current assay. These differences include variations in pH, the concentration of chloroauric acid (HAuCl4), the heating during the initial phase of the AuNPs formation immediately after mixing, and the addition of HCl and NaCl for signal enhancement.
Application to real world samples
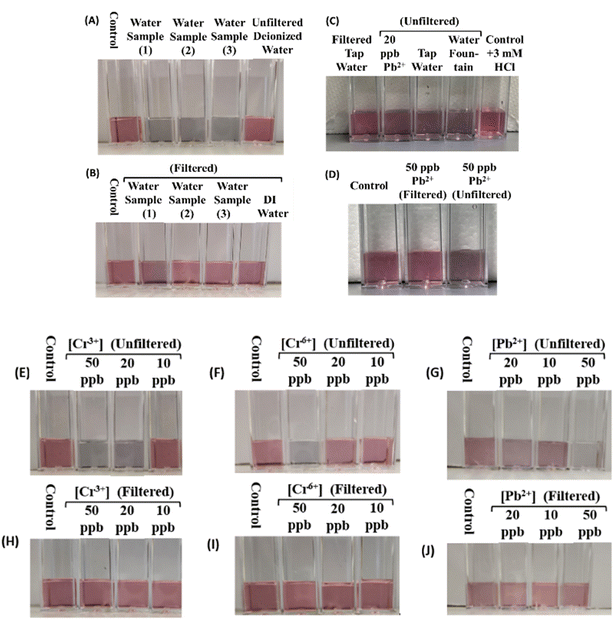
To assess the practical utility of our AuNP-based colorimetric detection, we applied our assay to real water samples collected from various sources, including a residence in Potsdam, NY, tap water from our laboratories, and fountains across the SUNY Potsdam College campus. We also evaluated the effectiveness of two water filtration systems (Brita™ and ZeroWater™) in removing Pb2+ and Cr3+/6+ contaminants from spiked water samples. Our results showed distinct color changes in all tested samples, indicating contamination (Fig. 5). Notably, ZeroWater™ filtration effectively eliminated contaminant traces, as evidenced by the lack of discernible color change after filtration. Images of spiked samples before and after ZeroWater™ filtration demonstrated its efficiency in removing Pb2+ and Cr6+ cations at ppb levels (Fig. 5). In contrast, Brita™ filtration showed no significant differences before and after filtration (data not shown), suggesting ineffectiveness of the Brita™ filters in removing the tested metal ions. We note that all our tests have been performed in the presence of 15 mM NaCl and 15 mM HCl. As shown in Fig. 2, the presence of 1 ppm of various metal ions had no effect on the assay signal, whether added individually, or combined. Furthermore, the presence of 100 μM cations like Mg2+, Ca2+, or Cu2+ (2.4, 4, and 6.3 ppm, respectively) has no influence on the aggregation of the AuNps, confirming that the aggregation is solely induced by Pb2+ and/or Cr3+/6+.Smartphone use for the quantitative detection of lead and chromium ions in water
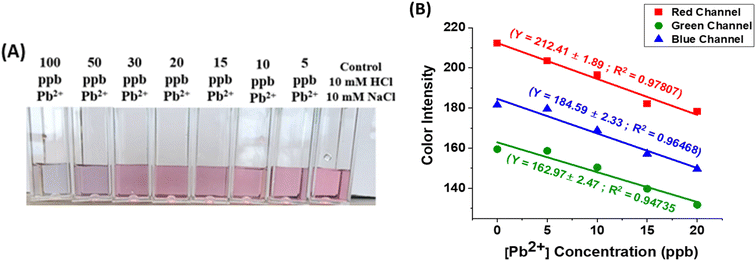
Smartphone-based platforms have been used to detect heavy metals, molecules, bacteria, viruses, and others,30–37 demonstrating their potential for on-site testing with additional simple instrumentations. In our study, we attempted to use such miniaturized systems to capture the color change with a smartphone camera as a result of AuNPs aggregation, without the need for time consuming functionalization processes of the AuNPs surface to improve sensitivity and selectivity.To prove the applicability of our assay for smartphone-based detection, standard curves for Pb2+ (0–20 ppb) and Cr6+ (0–40 ppb) were prepared, and images were captured following the addition of AuNPs (Fig. 6). Each image was split into red, green, and blue (RGB) channels, and the mean grey value intensity within a region of interest was measured using ImageJ software. Our preliminary analysis for Pb2+ showed strong linearity across all three channels (i.e. R2 value of 0.9781, 0.9476 and 0.9647 for channels R, G, and B, respectively). The decrease in intensity correlating with increasing Pb2+ concentrations is likely due to the diminishing color of the AuNPs. A similar result was observed with Cr6+ (data not shown) although in both cases further optimization is needed to (1) improve the sensitivity for the two metal cations, (2) to standardize image collection protocols and image analysis, and (3) enhance the reliability and user-friendliness of this detection method for at-home use.
These preliminary results are promising, demonstrating strong linearity in the 0–20 ppb range for lead detection and serve as a proof of concept that a compact device like a smartphone could enable untrained individuals to perform on-site direct testing of lead and chromium in drinking water at a low-cost. While the concept is simple, further development is needed to refine this process into a fully integrated, portable device for practical use. For instance, our study could be significantly enhanced by incorporating a robust, uniform RGB light source, developing machine learning algorithms for image processing and noise reduction, and exploring nonlinear regression methods for more accurate quantification of lead and chromium ions in water using smartphone-based colorimetry.31 Achieving quantitative detection of lead in a portable format has been a challenge due to cost and reliance on expensive equipment. Our research illustrates a lab-based innovation with the potential to have a substantial societal impact and improve public health.
Table 2 presents a summary of various studies on the use of gold nanoparticles (AuNPs) in colorimetry-based optical sensors, highlighting the limits of detection, functionalization strategies, and capping agents employed for the detection and quantification of Pb2+ and Cr3+/6+ cations. Notably, there remains a lack of AuNP-based assays or technologies capable of ultra-sensitive detection visible to the naked eye. Those that achieve such sensitivity often rely on costly equipment and complex experimental procedures to meet the sensitivity standards set by agencies like the WHO and EPA. Our study addresses this gap and offers a simple and straightforward method for detecting both Pb2+ and Cr3+/6+ at parts-per-billion (ppb) levels in drinking water. Nonetheless, significant efforts are needed to develop affordable, eco-friendly optical nanoprobes integrated with easy-to-read platforms for effective heavy metal sensing and quantification.
| AuNPs + functionalization and capping agent | Target metal ions and limit of detection (LOD) | Reference |
|---|---|---|
| Analyte (Pb 2+ ) | ||
| AuNPs | 18 μM (3730 ng ml−1) | 38 |
| AuNPs + tannic acid | 11.3–60 ng ml−1 | 39 |
| AuNPs + N-decanoyltromethamine | 72.4 ng ml−1 (350 nM) | 40 |
| AuNPs + oligonucleotide | 1035 ng ml−1 | 41 |
| AuNPs + valine | 6300 ng ml−1, or 96.5 μM (20 ppm) | 42 |
| AuNPs + 11-mercaptoundecanoic acid | 2 μM | 43 |
| AuNPs + maleic acid | 0.5 μg l−1 (2.41 nM) | 44 |
| AuNPs + 3-mercaptonicotinic acid 4-aminobenzo-18-crown-6 | 50 nM | 45 |
| AuNPs + gallic acid | 10 nM | 46 |
| AuNPs + triazole | 16.7 nM | 47 |
| AuNPs + tris | 0.1 nM | 48 |
| AuNPs + 4-methylthio-1-butanol | >100 μM | 49 |
| AuNPs (+DNAzyme), (+DNAzyme/biotin), or (+ DNAzyme duplex) | 20 pM, 50 pM, or 100 pM | 50, 51 or 52 |
| AuNPs + poly(styrene-co-maleic anhydride) | 30 nM | 53 |
| AuNPs + polymer polyethylenimine (PEI) | 700 pM | 54 |
| AuNPs (+Pb2+ aptamers), or (+Pb2+ aptamers and cationic hexapeptide) | 1 nM, and 98.7 pM | 55 and 56 |
| AuNPs + pyridine-formaldehyde | 1–4 μM | 57 |
| AuNPs + T and G-rich aptamers | 0.57 μM (120 ng ml−1) | 58 |
![[thin space (1/6-em)]](https://www.rsc.org/images/entities/char_2009.gif) |
||
| Analyte (Cr 3+/6+ ) | ||
| AuNPs + cysteamine | 0.236 nM (for Cr3+) | 59 |
| AuNPs + 3-merca-ptopropionic acid | 0.34 ppb (for Cr3+) | 60 |
| AuNPs + sodium hyaluronate | 0.78 nM (for Cr3+), 2.90 nM (Cr6+) | 61 |
| AuNPs (+meso-2,3-dimercaptosuccinic acid), or (+Tween 20) | 0.01 μM (for Cr3+/6+), or 0.02 μM (for Cr3+) | 62 and 63 |
| AuNPs + gold nanotetrapods | 0.5–3 nM (Cr6+) | 64 |
Conclusion
We have successfully demonstrated a simple, effective, and highly sensitive and selective colorimetric assay for the detection of Pb2+ and Cr3+/6+ using ascorbic acid-capped gold nanoparticles and no hazardous reagents. Using deionized water samples spiked with Pb2+, Cr6+ ions, we determined a limit of detection (LOD) of 5.4 ± 0.25 ppb for Pb2+ and 6.3 ± 0.23 for Cr6+, which are values lower than the EPA or the WHO's acceptable limits for drinking water. Our assay is quick, cost effective, and does not require expensive instrumentation, lengthy procedures, or surface modification of the AuNPs, and exhibits visual detection with the naked eye down to ∼20 ppb Pb2+ and ∼30–40 ppb for Cr3+/6+. When applied to real water samples and integrated with a smartphone application, our assay shows great promise for on-site testing. It provides a practical, cost-effective solution for detecting two highly toxic metals, lead and hexavalent chromium, in drinking water, and could significantly contribute to addressing water insecurity in vulnerable communities.Data availability
The datasets generated and/or analyzed during the current study are not publicly available due to privacy/ethical reasons but are available from the authors on reasonable request.Author contributions
C. H., M. B., and J. P. designed the study and aided in interpreting the results. C. H., M. B, J. P, and A. O. collected data and wrote the manuscript. F. B.-A. edited the manuscript and supervised the project. All authors have approved the final version of the manuscript.Conflicts of interest
There are no conflicts to declare.Acknowledgements
Financial support for this project comes from Cottrell Postbac Award #CS-PBP-2023 021(F. B.-A.) sponsored by Research Corporation for Science Advancement, and from the Eppley Foundation for Research Award #86561 (F. B.-A.).References
- D. L. Sparks, Toxic metals in the environment: the role of surfaces, Elements, 2005, 4, 193–197 CrossRef.
- G. Genchi, G. Lauria, A. Catalano, A. Carocci and M. Sinicropi, The double face of metals: the intriguing case of chromium, Appl. Sci., 2021, 2, 638 CrossRef.
- A. Zhitkovich, Chromium in drinking water: sources, metabolism, and cancer risks, Chem. Res. Toxicol., 2011, 10, 1617–1629 Search PubMed.
- R. Levin, C. L. Zilli Vieira, M. H. Rosenbaum, K. Bischoff, D. C. Mordarski and M. J. Brown, The urban lead (Pb) burden in humans, animals and the natural environment, Environ. Res., 2021, 193, 110377 CrossRef.
- P. Gottesfeld The Environmental and Health Impacts of Lead Battery Recycling, OK International, 2016 Search PubMed.
- World Health Organization, Almost 1 million people die every year due to lead poisoning, with more children suffering long-term health effects, 2022 Search PubMed.
- T. Simoni, B. Jonathan, T. Jennifer, C. Kelly, D. Michael, L. Darren and S. Michael, Variability and sampling of lead (Pb) in drinking water: assessing potential human exposure depends on the sampling protocol, Environ. Int., 2021, 146, 106259 CrossRef PubMed.
- E. Deshommes and M. Prevost, Erratum: pb particles from tap water: bioaccessibility and contribution to child exposure, Environ. Sci. Technol., 2012, 46, 6269 CrossRef.
- S. Triantafyllidou, J. Parks and M. Edwards, Lead particles in portable water, J. Am. Water Works Assoc., 2007, 99, 107–117 CrossRef.
- G. Liu, M. Lu, X. Huang, T. Li and D. Xu, Application of Gold-Nanoparticle Colorimetric Sensing to Rapid Food Safety Screening, Sensors, 2018, 18, 4166 CrossRef.
- E. Priyadarshini and N. Pradhan, Gold nanoparticles as efficient sensors in colorimetric detection of toxic metal ions: a review, Sens. Actuators, B, 2017, 238, 888–902 CrossRef.
- X. Hu, Y. Zhang, T. Ding, J. Liu and H. Zhao, Multifunctional gold nanoparticles: a novel nanomaterial for various medical applications and biological activities, Front. Bioeng. Biotechnol., 2020, 8, 990 CrossRef PubMed.
- S. K. Ghosh and T. Pal, Interparticle coupling effect on the surface plasmon resonance of gold nanoparticles: from theory to applications, Chem. Rev., 2007, 107, 4797 CrossRef PubMed.
- Y. Wang, M. Lv, Z. Chen, Z. Deng, N. Liu, J. Fan and W. Zhang, A fluorescence resonance energy transfer probe based on dna-modified upconversion and gold nanoparticles for detection of lead ions, Front. Chem., 2020, 8, 238 CrossRef PubMed.
- N. Ratnarathorn, O. Chailapakul and W. Dungchai, Highly sensitive colorimetric detection of lead using maleic acid functionalized gold nanoparticles, Talanta, 2015, 132, 613–618 CrossRef PubMed.
- F. Chai, C. Wang, T. Wang, L. Li and Z. Su, Colorimetric detection of pb2+ using glutathione functionalized gold nanoparticles, ACS Appl. Mater. Interfaces, 2010, 2, 1466–1470 CrossRef PubMed.
- G. Zhong, J. Liu and X. Liu, A Fast Colorimetric Assay for Lead Detection Using Label-Free Gold Nanoparticles (AuNPs), Micromachine, 2015, 6, 462–472 CrossRef.
- E. Priyadarshini and N. Pradhan, Metal-induced aggregation of valine capped gold nanoparticles: An efficient and rapid approach for colorimetric detection of Pb2+ ions, Sci. Rep., 2017, 7, 9278 CrossRef PubMed.
- X. Liu, M. Atwater, J. Wang and Q. Huo, Extinction coefficient of gold nanoparticles with different sizes and different capping ligands, Colloids Surf., B, 2007, 58, 3–7 CrossRef PubMed.
- C. Daruich De Souza, B. Ribeiro Nogueira and M. E. C. M. Rostelato, Review of the methodologies used in the synthesis gold nanoparticles by chemical reduction, J. Alloys Compd., 2019, 798, 714–740 CrossRef.
- V. Ramalingam, Multifunctionality of gold nanoparticles: Plausible and convincing properties, Adv. Colloid Interface Sci., 2019, 271, 101989 CrossRef PubMed.
- V. Amendola, R. Pilot, M. Frasconi, O. M. Maragò and M. A. Iatì, Surface plasmon resonance in gold nanoparticles: a review, J. Phys.: Condens. Matter, 2017, 29(20), 203002 CrossRef PubMed.
- A. Shrivastava and V. Gupta, Methods for the determination of limit of detection and limit of quantitation of the analytical methods, Chronicles Young Sci., 2011, 2, 21–25 CrossRef.
- A. M. M. Abeykoon, H. Hu, L. Wu, Y. Zhu and S. J. L. Billinge, Calibration and data collection protocols for reliable lattice parameter values in electron pair distribution function studies, J. Appl. Crystallogr., 2015, 48, 244–251 CrossRef.
- W. Y. Lim, A. Z. Aris and S. M. Praveena, Application of the chemometric approach to evaluate the spatial variation of water chemistry and the identification of the sources of pollution in Langat River, Malaysia, Arabian J. Geosci., 2013, 6, 4891–4901 CrossRef.
- H. Vu, B. Merkel and O. Wiche, Major ions, trace elements and evidence of groundwater contamination in Hanoi, Vietnam, Environ. Earth Sci., 2022, 81, 305 CrossRef CAS.
- M. Luty-Błocho, M. Wojnicki and K. Fitzner, Gold Nanoparticles Formation via Au(III) Complex Ions Reduction with L -Ascorbic Acid, Int. J. Chem. Kinet., 2017, 49, 789–797 CrossRef.
- S. L. D’souza, R. K. Pati and S. K. Kailasa, Ascorbic acid functionalized gold nanoparticles as a probe for colorimetric and visual read-out determination of dichlorvos in environmental samples, Anal. Methods, 2014, 6, 9007–9014 RSC.
- L. Rastogi, K. Dash and A. Ballal, Selective colorimetric/visual detection of Al3+ in ground water using ascorbic acid capped gold nanoparticles, Sens. Actuators, B, 2017, 248, 124–132 CrossRef.
- S. Sajed, M. Kolahdouz, M. A. Sadeghi and S. F. Razavi, High-Performance Estimation of Lead Ion Concentration Using Smartphone-Based Colorimetric Analysis and a Machine Learning Approach, ACS Omega, 2020, 5, 27675–27684 CrossRef.
- F. Aqillah, M. Diki Permana, D. R. Eddy, M. L. Firdaus, T. Takei and I. Rahayu, Detection and quantification of Cu ion using gold nanoparticles via Smartphone-based digital imaging colorimetry technique, Results Chem., 2024, 101418 CrossRef.
- H. Wang, L. Yang, S. Chu, B. Liu, Q. Zhang, L. Zou, S. Yu and C. Jiang, Semiquantitative Visual Detection of Lead Ions with a Smartphone via a Colorimetric Paper-Based Analytical Device, Anal. Chem., 2019, 91, 9292–9299 CrossRef PubMed.
- H. Nguyen, Y. Sung, K. O'Shaughnessy, X. Shan and W.-C. Shih, Smartphone Nanocolorimetry for On-Demand Lead Detection and Quantitation in Drinking Water, Anal. Chem., 2018, 90, 11517–11522 CrossRef.
- S. Muhammad-Aree and S. Teepoo, On-site detection of heavy metals in wastewater using a single paper strip integrated with a smartphone, Anal. Bioanal. Chem., 2020, 412, 1395–1405 CrossRef PubMed.
- V. D. Nguyenm, H. V. Nguyen, K. H. Bui and T. S. Seo, Smart phone-powered capillary electrophoresis on a chip for foodborne bacteria detection, Sens. Actuators, B, 2019, 301, 127108 CrossRef.
- S. Chung, L. E. Breshears, S. Perea, C. M. Morrison, W. Q. Betancourt, K. A. Reynolds and J.-Y. Yoon, Smartphone-Based Paper Microfluidic Particulometry of Norovirus from Environmental Water Samples at the Single Copy Level, ACS Omega, 2019, 4, 11180–11188 CrossRef PubMed.
- R. Yang, W. Cheng, X. Chen, Q. Qian, Q. Zhang, Y. Pan, P. Duan and P. Miao, Color Space Transformation-Based Smartphone Algorithm for Colorimetric Urinalysis, ACS Omega, 2018, 3, 12141–12146 CrossRef PubMed.
- R. M. Tripathi, S. H. Park, G. Kim, D. H. Kim, D. Ahn, Y. M. Kim and S. J. Chung, Metal-induced redshift of optical spectra of gold nanoparticles: an instant, sensitive, and selective visual detection of lead ions, Int. Biodeterior. Biodegrad., 2019, 1444, 104740 CrossRef.
- K. V. Serebrennikova, N. S. Komova, A. N. Berlina, A. V. Zherdev and B. B. Dzantiev, Tannic acid-capped gold nanoparticles as a novel nanozyme for colorimetric determination of Pb2+ ions, Chemosensors, 2021, 9, 332 CrossRef.
- M. Sengan, R. K. Kamlekar and A. Veerappan, Highly selective rapid colorimetric sensing of Pb2+ ion in water samples and paint based on metal induced aggregation of N-decanoyltromethamine capped gold nanoparticles, Spectrochim. Acta, Part A, 2020, 239, 118485 CrossRef PubMed.
- P. Chen, R. Zhang, Q. Jiang, X. Xiong and S. Deng, Colorimetric detection of lead ion based on gold nanoparticles and lead-stabilized g-quartet formation, J. Biomed. Sci. Eng., 2015, 8, 451–457 CrossRef.
- E. Priyadarshini and N. Pradhan, Metal-induced aggregation of valine capped gold nanoparticles: An efficient and rapid approach for colorimetric detection of Pb2+ ions, Sci. Rep., 2017, 7, 9278 CrossRef PubMed.
- G. Sener, L. Uzun and A. Denizli, Colorimetric sensor array based on gold nanoparticles and amino acids for identification of toxic metal ions in water, ACS Appl. Mater. Interfaces, 2014, 6, 18395–18400 CrossRef.
- N. Ratnarathorn, O. Chailapakul and W. Dungchai, Highly sensitive colorimetric detection of lead using maleic acid functionalized gold nanoparticles, Talanta, 2015, 132, 613–618 CrossRef PubMed.
- J. Qiu, Z. Li, L. Miao, H. Wang, Y. Zhang, S. Wu, Y. Zhang, X. Li and A. Wu, Colorimetric detection of Ba2+, Cd2+ and Pb2+ based on a multifunctionalized Au NP sensor, Analyst, 2019, 144, 5081–5089 RSC.
- K. W. Huang, C. J. Yu and W. L. Tseng, Sensitivity enhancement in the colorimetric detection of lead(II) ion using gallic acid-capped gold nanoparticles: improving size distribution and minimizing interparticle repulsion, Biosens. Bioelectron., 2010, 25, 984–989 CrossRef PubMed.
- I.-L. Lee, Y.-M. Sung and S.-P. Wu, Triazole-acetate functionalized gold nanoparticles for colorimetric Pb(II) sensing, RSC Adv., 2014, 4, 25251–25256 RSC.
- Y. Xiahou, P. Zhang, J. Wang, L. Huang and H. Xia, Simple synthesis of uniformly small gold nanoparticles for sensitivity enhancement in colorimetric detection of Pb2+ by improving nanoparticle reactivity and stability, J. Mater. Chem. C, 2018, 6, 637–645 RSC.
- J. Gahlaut, Y. S. Rajput, S. Meena, D. K. Nanda and R. Sharma, Spectrophotometric label-free determination of lead using thiol-functionalized gold nanoparticles, Anal. Lett., 2018, 51, 1208–1218 CrossRef.
- W. Yun, D. Cai, J. Jiang, P. Zhao, Y. Huang and G. Sang, Enzyme-free and label-free ultra-sensitive colorimetric detection of Pb2+ using molecular beacon and DNAzyme based amplification strategy, Biosens. Bioelectron., 2016, 80, 187–193 CrossRef PubMed.
- H.-B. Wang, L.-H. Ma, B.-Y. Fang, Y.-D. Zhao and X.-B. Hu, Graphene oxide-assisted Au nanoparticle strip biosensor based on GR-5 DNAzyme for rapid lead ion detection, Colloids Surf., B, 2018, 169, 305–312 CrossRef PubMed.
- C. Li, L. Wei, X. Liu, L. Lei and G. Li, Ultrasensitive detection of lead ion based on target induced assembly of DNAzyme modified gold nanoparticle and graphene oxide, Anal. Chim. Acta, 2014, 831, 60–64 CrossRef PubMed.
- T. H. A. Nguyen, T. T. V. Le, B. A. Huynh, N. V. Nguyen, V. T. Le, V. D. Doan, V. A. Tran, A. T. Nguyen, X. T. Cao and Y. Vasseghian, Novel biogenic gold nanoparticles stabilized on poly(styrene-co-maleic anhydride) as an effective material for reduction of nitrophenols and colorimetric detection of Pb(II), Environ. Res., 2022, 212, 113281 CrossRef PubMed.
- S. M. Taghdisi, N. M. Danesh, P. Lavaee, M. Ramezani and K. Abnous, An aptasensor for selective, sensitive and fast detection of lead(II) based on polyethyleneimine and gold nanoparticles, Environ. Toxicol. Pharmacol., 2015, 39, 1206–1211 CrossRef PubMed.
- N. Fakhri, M. Hosseini and O. Tavakoli, Aptamer-based colorimetric determination of Pb2+ using a paper-based microfluidic platform, Anal. Methods, 2018, 10, 4438–4444 RSC.
- M. Solra, R. Bala, N. Wangoo, G. K. Soni, M. Kumar and R. K. Sharma, Optical pico-biosensing of lead using plasmonic gold nanoparticles and a cationic peptide-based aptasensor, Chem. Commun., 2020, 56, 289–292 RSC.
- L. Lei, H. Song, J. Zhao, Q. Yang and Z. Chen, Preparation of gold nanoparticles using pyridine-formaldehyde as a reducing agent and its application in high sensitivity colorimetric detection of Pb2+, Anal. Methods, 2019, 11, 4362–4369 RSC.
- A. N. Berlina, A. V. Zherdev, S. M. Pridvorova, M. S. Gaur and B. B. Dzantiev, Rapid visual detection of lead and mercury via enhanced crosslinking aggregation of aptamer- labeled gold nanoparticles, J. Nanosci. Nanotechnol., 2019, 19, 5489–5495 CrossRef PubMed.
- M. Shellaiah and K. W. Sun, Conjugation of cysteamine functionalized nanodiamond to gold nanoparticles for pH enhanced colorimetric detection of Cr3+ ions demonstrated by real water sample analysis, Spectrochim. Acta, Part A, 2023, 286, 121962 CrossRef PubMed.
- S. Y. Ejeta and T. Imae, Selective colorimetric and electrochemical detections of Cr(III) pollutant in water on 3-mercaptopropionic acid-functionalized gold plasmon nanoparticles, Anal. Chim. Acta, 2021, 1152, 338272 CrossRef PubMed.
- S. Li, T. Wei, G. Ren, F. Chai, H. Wu and F. Qu, Gold nanoparticles based colorimetric probe for Cr(III) and Cr(VI) detection, Colloids Surf., A, 2017, 535, 215–224 CrossRef.
- W. Chen, F. Cao, W. Zheng, Y. Tian, Y. Xianyu, P. Xu, W. Zhang, Z. Wang, K. Deng and X. Jiang, Detection of nanomolar level of total Cr [(III) and (VI)] by functionalized gold nanoparticles and a smartphone with the assistance of theoretical calculation models, Nanoscale, 2015, 7(5), 2042–2049 RSC.
- X. Wang, Y. Wei, S. Wang and L. Chen, Red-to-blue colorimetric detection of chromium via Cr(III)-citrate chelating based on Tween 20-stabilized gold nanoparticles, Colloids Surf., A, 2015, 472, 57–62 CrossRef.
- S. Wang, Y. Shi, H. Zhang, Y. Sun, F. Wang, L. Zeng, X. Li, A. Wu and Y. Zhang, Colorimetric sensor for Cr (VI) by oxidative etching of gold nanotetrapods at room temperature, Spectrochim. Acta, Part A, 2023, 295, 122589 CrossRef PubMed.
Footnote |
| † These authors contributed equally to this work. |
| This journal is © The Royal Society of Chemistry 2025 |

