
 Open Access Article
 This Open Access Article is licensed under a Creative Commons Attribution-Non Commercial 3.0 Unported Licence
Mechanistic insights into allosteric regulation of the reductase component of p-hydroxyphenylacetate 3-hydroxylase by p-hydroxyphenylacetate: a model for effector-controlled activity of redox enzymes†
Surawit
Visitsatthawong
a,
Piyanuch
Anuwan
a,
Narin
Lawan
 b,
Pimchai
Chaiyen
a and
Thanyaporn
Wongnate
*a
b,
Pimchai
Chaiyen
a and
Thanyaporn
Wongnate
*a
aSchool of Biomolecular Science and Engineering, Vidyasirimedhi Institute of Science and Technology (VISTEC), Wangchan Valley, Rayong, Thailand. E-mail: thanyaporn.w@vistec.ac.th
bDepartment of Chemistry, Faculty of Science, Chiang Mai University, Chiang Mai, Thailand
First published on 5th December 2024
Abstract
Understanding how an enzyme regulates its function through substrate or allosteric regulation is crucial for controlling metabolic pathways. Some flavin-dependent monooxygenases (FDMOs) have evolved an allosteric mechanism to produce reduced flavin while minimizing the use of NADH and the production of harmful hydrogen peroxide (H2O2). In this work, we investigated in-depth mechanisms of how the reductase component (C1) of p-hydroxyphenylacetate (HPA) 3-hydroxylase (HPAH) from Acinetobacter baumanii is allosterically controlled by the binding of HPA, which is a substrate of its monooxygenase counterpart (C2). The C1 structure can be divided into three regions: the N-terminal domain (flavin reductase); a flexible loop; and the C-terminal domain, which is homologous to NadR, a repressor protein having HPA as an effector. The binding of HPA to NadR induces a conformational change in the recognition helix, causing it to disengage from the NadA gene. The HPA binding site of C1 is located at the C-terminal domain, which can be divided into five helices. Molecular dynamics simulations performed on HPA-docked C1 elucidated the allosteric mechanism. The carboxylate group of HPA maintains the salt bridge between helix 2 and the flexible loop. This maintenance shortens the loop between helices 2 and 3, causing helix 3 to disengage from the N-terminal domain. The aromatic ring of HPA induces a conformational change in helices 1 and 5, pulling helix 4, analogous to the recognition helix in NadR, away from the N-terminal domain. A Y189A mutation, obtained from site-saturation mutagenesis, confirms that HPA with an unsuitable conformation cannot induce the conformational change of C1. Additionally, an HPA-independent effect is observed, in which Arg20, an NADH binding residue on the N-terminal domain, occasionally disengages from helix 4. This model provides valuable insights into the allosteric regulation of two-component FDMOs and aromatic effector systems.
Introduction
Flavin-dependent monooxygenases (FDMOs) are a class of flavin-dependent enzymes that insert one atom of oxygen into an organic substrate, catalyzing a wide variety of chemical transformations, such as hydroxylation, Baeyer–Villiger oxidation, dehalogenation, halogenation, and light emission.1,2 The versatility of FDMOs and their classification, based on fold, function, and electron donor specificity3,4 was recently summarized by Paul et al.5 All of these diverse reactions use C4a-(hydro)peroxyflavin as the common intermediate, which is formed by the reaction between reduced flavin and molecular oxygen. In the absence of substrate, C4a-(hydro)peroxyflavin eliminates a hydrogen peroxide (H2O2), which is toxic to the cell, to regenerate oxidized flavin.6 FDMOs can be classified as single-component and two-component FDMOs.7 Some have evolved an allosteric mechanism to maximize oxygenation efficiency by minimizing wasteful H2O2 elimination and pyridine nucleotides utilization.Single-component FDMOs catalyze both the reductive-half and oxidative-half reactions using a single polypeptide.6 To minimize H2O2 generation from C4a-(hydro)peroxyflavin in the oxidative-half reaction, some single-component FDMOs (group A members) require the substrate binding to activate the flavin reduction by NAD(P)H in the reductive-half reaction, such as anthranilate hydroxylase,8 2-methyl-3-hydroxypyridine-5-carboxylic acid (MHPC) oxygenase,9–11 2-hydroxybiphenyl 3-monooxygenase,12 and p-hydroxybenzoate hydroxylase (PHBH).13 PHBH exhibits variability in its cofactor specificity, utilizing NADH or NADPH depending on its origin and specific active site features, and can be classified into three groups based on these preferences, highlighting the diversity within this enzyme family.14
For single-component aromatic hydroxylases, the substrate activation mechanisms to increase the rate of flavin reduction are well documented, such as in the reaction of PHBH from Pseudomonas fluorescens.15 PHBH utilizes flavin adenine dinucleotide (FAD), oxygen, and NADPH to hydroxylate p-hydroxybenzoate, forming 3,4-dihydroxybenzoate through a meta-hydroxylation reaction. Initially, FAD adopts an “in” conformation, inaccessible to NADPH. The reductive-half reaction begins with the binding of NADPH and p-hydroxybenzoate. A proton transfer network, composed of Tyr201, Tyr285, water molecules, and His72 located on the surface, deprotonates a hydroxyl group of p-hydroxybenzoate.16,17 The electrostatic repulsion between p-hydroxybenzoate and Pro293 transmits to Asn300, causing it to lose a hydrogen bond with the C2-carbonyl of FAD, allowing FAD to swing from “in” to the “out” conformation.18,19 In this “out” conformation,20–23 oxidized FAD is reduced by NADPH, then swings back to “in” conformation due to PHBH's positive electrostatic potential.24 In the oxidative half-reaction, reduced FAD reacts with molecular oxygen to form C4a-hydroperoxyflavin (C4aOOH), which hydroxylates p-hydroxybenzoate to form 3,4-dihydroxybenzoate.25 The presence of p-hydroxybenzoate enhances the rate of flavin reduction 105-fold.26 Moreover, p-hydroxybenzoate dissociates more slowly from the reduced enzyme than from the oxidized enzyme, and slower than the C4aOOH formation rate, kinetically trapping p-hydroxybenzoate in the reduced enzyme.25 This maximizes 3,4-dihydroxybenzoate production while minimizing H2O2 elimination.
Two-component FDMOs catalyze the reductive-half and oxidative-half reactions using two separate enzymes: reductase and monooxygenases.6 There are also two-component FDMOs that have fused partners.27 Some have evolved an allosteric mechanism where flavin reduction is stimulated by the substrate, such as nitrilotriacetate monooxygenase from “Chelatobacter” strain ATCC 29600,28p-hydroxyphenylacetate 3-hydroxylase (HPAH) from Pseudomonas putida,29 and Acinetobacter baumanii.30,31 The crystal structure of the allosteric reductase component is only available for HPAH from Acinetobacter baumanii32,33 while those of nitrilotriacetate monooxygenase from Chelatobacter strain ATCC 29600 and HPAH from Pseudomonas putida are predicted and deposited in the AlphaFold protein structure database (Uniprot accession: P54990 and A0A1B2F4I4, respectively).34 These reductase components not only have a flavin-binding site in the N-terminal domain but also possess an additional C-terminal domain, which is distinct from other flavin reductases.35,36 Because flavin reduction and oxidation occur at separate polypeptides, controlling by substrate binding, as in single-component enzymes, is more challenging. This complexity opens a fascinating area of study, highlighting the intricate regulatory mechanisms nature employs. HPAH from Acinetobacter baumanii could serve as an allosteric model for two-component FDMOs due to its comprehensive kinetic studies and the availability of crystal structures. However, the underlying mechanisms of this regulation are not well understood, making it a compelling topic for investigation.
HPAH catalyses the first step in the degradation of HPA in aerobic bacteria.37 The reductase component (C1) is a flavin reductase that reduces oxidized flavin mononucleotide (FMN) to its reduced form using NADH. Subsequently, the reduced FMN is transferred by free diffusion to the oxygenase component (C2).38,39 Reduced FMN reacts with molecular oxygen to form C4aOOH, which hydroxylates the incoming p-hydroxyphenylacetate (HPA) to form dihydroxyphenylacetate (DHPA).40 In the absence of HPA, C4aOOH eliminates H2O2 to regenerate oxidized flavin. Intriguingly, HPAH has evolved an allosteric mechanism by incorporating an HPA binding site into C1.41 In the presence of HPA, C1 exhibits an 80-fold tighter binding to NADH, a 20-fold faster transfer of a hydride to oxidized FMN, and 230-fold faster release of reduced FMN.41,42 Furthermore, HPA binding is necessary before NADH binding to achieve full stimulation of FMN reduction, suggesting that HPA binding induces a conformational change in C1, enhancing the binding site for NADH. Unlike PHBH, C1 has only been crystallized in the absence of HPA, leaving the exact HPA binding site in C1 unknown and the mechanism by which HPA induces the conformational change of C1 speculative.32,33
Sequence alignment indicates that the C-terminal domain of C1 (residues 191–315) is homologous to proteins in the MarR family,43,44 such as NadR, a repressor protein that binds with the NadA gene.42 Upon binding of an effector (HPA), NadR dissociates from the antibiotic resistance gene, enabling the transcription of the efflux pump that promotes antibiotic excretion.45 This mechanism mirrors how HPA induces the conformation change in C1 to facilitate NADH binding. Truncations studies of the C-terminal domain of C1 and comparisons of flavin reduction rates in the absence and presence of HPA suggest that residues 179–230 are crucial for HPA binding and the stimulation of flavin reduction.
On the other hand, the N-terminal domain (residues 1–168) of C1 is homologous to other flavin reductases.33 Arg20 of C1 is identified as a conserved residue interacting with NADH. Structural alignments of C1 with flavin reductases containing bound FAD and NAD+ from Sulfolobus tokodaii HpaC,46Thermus thermophilus HpaC,47Geobacillus thermoglucosidasius PheA2,48 and Burkholderia cepacia TftC49 reveal that the NADH binding site in C1 is obstructed by the α7 helix. This helix is comparable to the recognition helix in NadR, which often undergoes conformational changes upon ligand or DNA binding. Glu248 and Glu251, located on the α7 helix of C1, form a salt bridge with Arg20 of the N-terminal domain. To investigate this interaction, Glu248 and/or Glu251 were mutated to alanine to disrupt the salt bridge. Interestingly, only the double mutation (E248A/E251A) demonstrated a higher flavin reduction rate than the wild-type C1 in the absence of HPA, suggesting that the disruption of the salt bridge is part of the conformational change induced by HPA.33
In this study, we investigated how HPA stimulates FMN reduction in C1. First, the HPA binding site was identified using the existing crystal structures of C1 and NadR. HPA was then docked into the proposed binding site using molecular docking. The C1 protein complex, with HPA docked, was subjected to molecular dynamics (MD) simulations to gain insights into the allosteric regulation mechanisms of the protein. Allosteric regulation plays a crucial role in the biological activity of proteins, affecting their function at one site by the binding of a regulatory molecule at a separate site. By simulating the dynamics of C1 in the presence of HPA, this study aims to observe and analyze the conformational and functional changes within the protein, providing pivotal insights into its regulatory mechanisms. To validate our findings, we employed site-saturation mutagenesis to create the Y189A variant, which was the first variant found to bind HPA without stimulating FMN reduction. This result confirms our proposed allosteric mechanism of C1 and highlights the significance of specific amino acid residues in the regulatory process. These findings could significantly contribute to the development of targeted therapeutic strategies exploiting these allosteric sites.
Experimental
Structure analysis of C1 and molecular docking
The crystal structure, identified as 5zyr.pdb (an unpublished crystal structure), reveals a potential binding site for HPA, highlighted by the interaction of an acetate ion with ARG222. Before conducting docking simulations, both the acetate ion and crystallographic waters were removed to prepare the structure. HPA optimization was conducted using B3LYP50–52/6-31G(d)53–55 within the Gaussian16 program.56 Subsequently, both HPA and the protein were prepared using AutoDockTools,57,58 with the protonation states of the amino acids being predicted by PROPKA59 and an optimal hydrogen bond network being established.60The crystal structure reveals different interactions of the recognition helix in chain A and B. In chain A, the salt bridge between Glu248/Glu251 on the recognition helix and Arg20 is intact, measuring 4.0 and 4.3 Å, respectively (Fig. 1a). On the other hand, in chain B, the salt bridge between Glu248/Glu251 on the recognition helix and Arg20 is impaired, measuring 5.6 and 7.1 Å, respectively (Fig. 1b). Thus, HPA was only docked in chain A to study the effect of HPA on the recognition helix, while chain B was observed for HPA-independent effects.
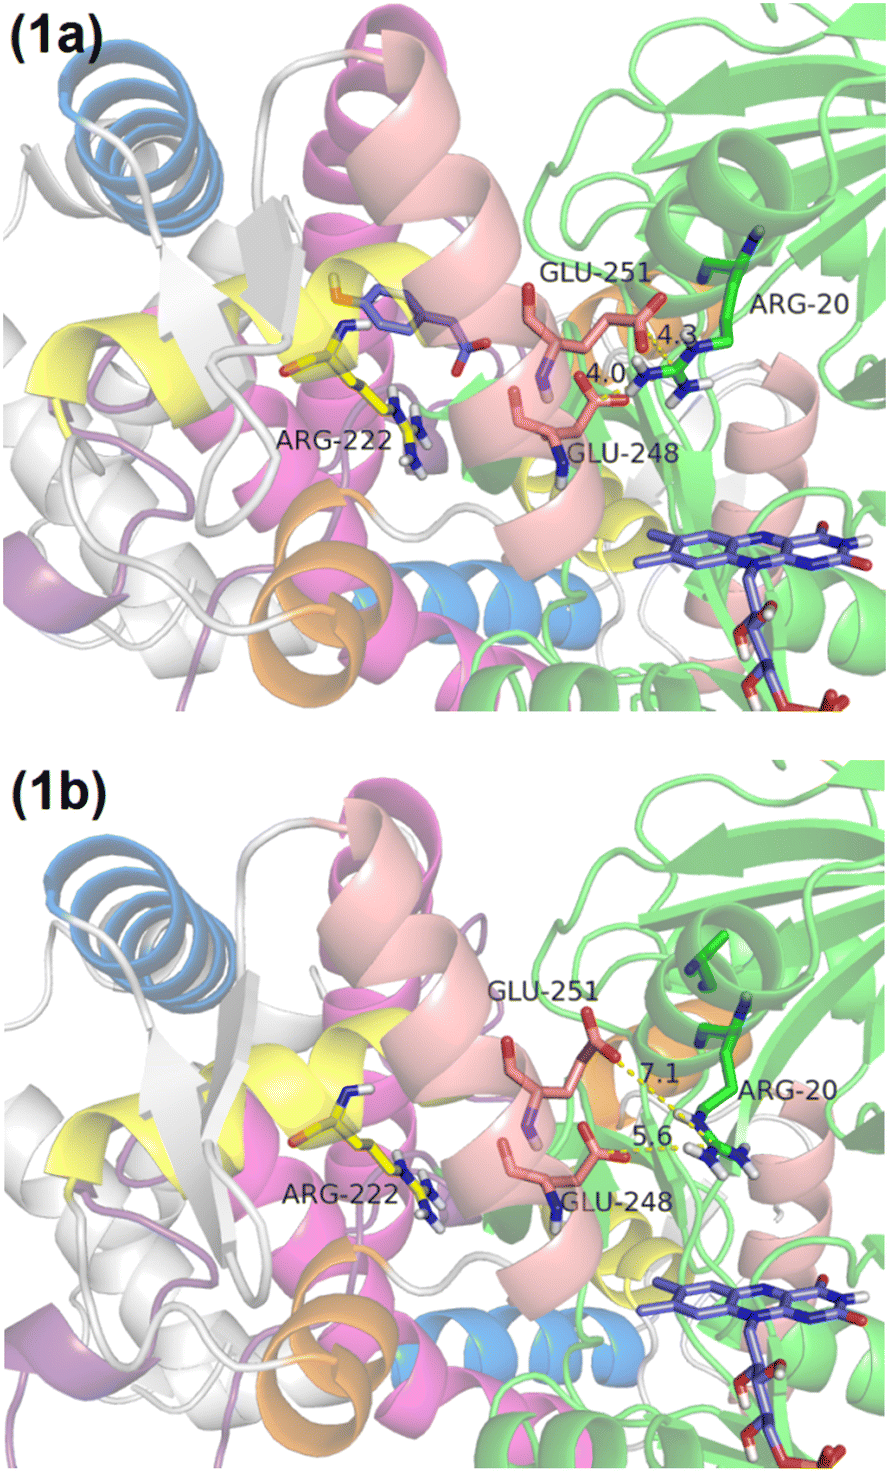 | ||
| Fig. 1 Panel (a) illustrates HPA docked in chain A with intact salt bridges between Glu248/Glu251 and Arg20. Panel (b) shows impaired salt bridges between Glu248/Glu251 and Arg20 in chain B. Helix 1, 2, 3, 4, and 5 are in pink, yellow, orange, cream, blue, respectively. | ||
Focusing on ARG222 in chain A, it was selected as the center for a cubic docking box, designed with dimensions of 25 Å3 on each side, to encompass the potential interaction zone. Notably, ARG222 was also made flexible to accommodate potential conformational changes during the docking procedure. Flexible docking was executed using AutoDock Vina,61 allowing for dynamic adjustment of the protein to HPA's binding and ensuring a more accurate simulation of potential interactions.
Allosteric regulation of C1 by HPA via molecular dynamics (MD) simulations
Hydrogen atoms were added to amino acid residues, considering results from propka.59 Atom types in the topology files were assigned based on the CHARMM27 parameter set.62 The C1 structure with HPA was solvated in a cubic box of TIP3P water, extending at least 15 Å in each direction from the solute. The dimensions of the solvated system were 95 × 98 × 102 Å. MD simulations were conducted using the NAMD program,63 with simulation protocols adapted from our previous work.64Simulations commenced with the minimization of hydrogen atom positions for 3000 steps, followed by water minimization for 6000 steps. Subsequently, the system's water was heated to 300 K over 5 ps and then equilibrated for 15 ps. The entire system underwent minimization for 10![[thin space (1/6-em)]](https://www.rsc.org/images/entities/char_2009.gif) 000 steps, was heated to 300 K over 20 ps, and then equilibrated for 180 ps before proceeding to the production stage for 4 microseconds.
000 steps, was heated to 300 K over 20 ps, and then equilibrated for 180 ps before proceeding to the production stage for 4 microseconds.
The Y189A structure was prepared by mutating Y189 to A189. The MD simulation protocol for Y189A was the same as for the wild-typed C1, except the production stage lasted for 1 microsecond.
Site-saturation mutagenesis of Y189
C1 primers were purchased from Pacific Science, and the C1 gene was constructed in a pET11a plasmid between the NdeI and BamHI sites, with a total length of 6585 bp (including the pET11a plasmid at 5677 bp and C1 at 946 bp).65 Y189X primers were designed for whole plasmid amplification using NNK-degenerate codons (Table S1, ESI†). The pET11a plasmid containing the wild type gene served as the template for PCR. The PCR conditions are detailed in Table S2 (ESI†) and were executed using a Mastercycler nexus gradient GSX1 PCR instrument. The PCR product was treated with DpnI to eliminate remaining template DNA and transformed into E. coli BL21(DE3) for DNA propagation. Subsequently, cells were harvested and plasmid DNA extracted for sequencing to verify the amino acid diversity at the target site.The electropherogram data from pooled plasmid DNA displays peak heights for each fluorescent base, corresponding to their concentrations. The fractional compositions of each base were calculated and then subtracted from their theoretical composition (0.25 for N positions and 0.50 for K positions). Summing these deviations provides  values for each base position. The weighted average across the three bases of a codon, after applying a scaling factor, yields a Qpool value ranging from 0 to 1. A Qpool value of 0.0 indicates the presence of a single sequence, while a Qpool score of 1.0 denotes perfect randomization.66
Screening of C1-Y189X site-saturation mutagenesis variants by MTT (3-(4,5-dimethylthiazol-2-yl)-2,5-diphenyltetrazolium bromide) assay
High-throughput screening of C1 activity from site-saturation and random mutagenesis was conducted using the VISTEC Explorer G3 cell workstation (robotic system). This included the K6-2 picker for auto-picking colonies, the LPT 220 incubator for incubating cells, the JANUS G3 mini MDT and JANUS G3 mini 8-tip for liquid handing, and the EnVision multimode plate reader for measuring C1 activity absorption.C1 site-saturation mutagenesis plasmids with a Qpool value higher than 0.7 were transformed into E. coli BL21(DE3) to express approximately 200 colonies, suitable for high-throughput colony pickers. Each well of a 96-well plate was filled with 100 μL of LB medium supplemented with 50 μg mL−1 ampicillin. Colonies were transferred to the 96-well plates using a high-throughput colony picker. The plates were then sealed with aluminum film using a sealer and incubated at 37 °C, 50 rpm overnight. 5% of the cells from the stater plate were inoculated onto a new plate containing 185 μL of LB medium, sealed again with aluminum film, and incubated at 37 °C, 50 rpm for 6–8 hours. Cells were induced with 5 μL of 4 mM IPTG and incubated at 16 °C, 50 rpm overnight.
The expression plates were centrifuged at 4 °C, 3756 g for 40–60 minutes. The supernatants were discarded before adding 100 μL of lysis buffer containing lysozyme. The samples were shaken at 37 °C for 1.5 hours and centrifuged again at 3756 g, 4 °C for 60 minutes. The MTT assay was performed at 25 °C. The reaction mixture contained 50 mM sodium phosphate (pH 7.5), 15 μM FMN, 200 μM NADH, 10 nM C1, and 5 mg mL−1 MTT. Reactions were initiated by adding C1 and the absorbance changes at 578 nm were monitored over time.
Gene expression and protein purification
The plasmid pET11a-C1 mutant Y189A was transformed into E. coli BL21(DE3) for gene expression. The recombinant cells were grown at 37 °C in Luria-Bertani (LB) broth medium containing 50 μg mL−1 ampicillin. Enzyme production was induced when the optical density at 600 nm (OD600) reached 1, by adding isopropyl β-D-1-thiogalactopyranoside (IPTG) to a final concentration of 1 mM. The cells were then grown at 16 °C and collected by centrifugation when the OD600 reached 4. Crude protein extracts were prepared by sonication of the cell paste in 50 mM sodium phosphate buffer, pH 7.0, containing 1 mM dithiothreitol (DTT), 0.5 mM ethylenediaminetetraacetic acid (EDTA), and 100 μM phenylmethylsulfonyl fluoride (PMSF). The insoluble fraction of the lysate was removed by centrifugation. The C1 flavin reductase enzyme was purified from the crude extracts using ammonium sulfate precipitation followed by DEAE ion-exchange chromatography. The purity of the purified enzyme was verified by SDS-PAGE.Steady-state kinetics
The kinetic parameters of C1, such as the maximum enzyme velocity (Vmax), the turnover number (kcat) representing of number of substrate molecules each enzyme site converts to product per unit time, and the Michaelis–Menten constant (Km), can be investigated by measuring NADH oxidase activity under various concentrations of NADH (1–400 μM). The assays were conducted at 25 °C in a 50 mM sodium phosphate buffer, pH 7.5, containing 15 μM FMN, 200 μM HPA, and 10 nM C1. The concentrations of the compounds were determined using known extinction coefficients at pH 7.0: NADH, ε340 = 6.22 × 10³ M−1 cm−1; FMN, ε446 = 12.8 × 10³ M−1 cm−1; and HPA, ε277 = 1.55 × 10³ M−1 cm−1. The concentration of C1 was estimated using an extinction coefficient of 12.8 × 10³ M−1 cm−1 at 458 nm.67 The NADH oxidase activity was measured using a Cary 300 UV-visible spectrophotometer from Agilent, and the reaction rates were analyzed with the Michaelis–Menten equation using GraphPad Prism version 7.0.Isothermal titration calorimetry (ITC) for determining dissociation constant of complex between C1-Y189A and HPA
Isothermal titration calorimetry (ITC) is a technique utilized to study the thermodynamics of binding interactions and to measure the changes in Gibbs free energy (ΔG°), enthalpy (ΔH°), and entropy (ΔS°) associated with the reaction between a ligand and its receptor.68 In this study, ITC was employed to measure the heat changes resulting from the binding interaction between C1-Y189A and HPA. C1-Y189A was dialyzed in 50 mM sodium phosphate buffer (pH 7.5) at 4 °C overnight to prepare it for the experiment. The ITC titrations were conducted using a MicroCal PEAQ-ITC machine, involving 19 injections of HPA: the first injection was 0.4 μL, followed by 18 injections of 2.0 μL each, at a constant temperature of 25 °C and a stirring speed of 750 rpm. For these experiments, a concentration of 50 μM C1-Y189A and 1 mM HPA was used. The results were analyzed with the MicroCal PEAQ-ITC analysis software.Results
Structural insights into HPA binding
The most favourable docking conformation of the C1-HPA complex showed similarities to the HPA-bound form of NadR, a homolog of the C-terminal domain of C1. In this conformation, ARG222 in C1 is positioned to form a salt bridge with HPA, mirroring the interaction observed with ARG43 in NadR (Fig. S1, ESI†).45 The root mean square deviation (RMSD) plot (Fig. S2, ESI†) reveals significant fluctuations in HPA's conformation during the initial 0–2 microseconds of the MD simulation. However, from 2 to 4 microseconds, HPA stabilizes, suggesting an adjustment period followed by stabilization within the binding site. HPA forms a crucial salt bridge with ARG222 from the simulation's onset, with the carboxylate group of HPA forming a stable salt bridge, approximately 1.8 Å in distance, with ARG222 after 4 microseconds (Fig. 2a). | ||
| Fig. 2 Panel (a) illustrates the hydrogen bond distances between HPA and Arg222, showcasing the dynamic nature of these interactions over 4 microseconds. Panel (b) details the van der Waals interactions between HPA and the surrounding residues. Panel (c) provides a quantitative analysis of these interactions, focusing specifically on the hydrogen bond distances between HPA and key residues, notably Phe216 and Arg222. Helix 1, 2, 3, 4, and 5 are in pink, yellow, orange, cream, blue, respectively. | ||
Around the 2-microsecond mark, HPA uses its carboxylate group as a pivot to rotate and form a hydrogen bond with Phe216. The fluctuating distance of this bond between 2 and 4 microseconds indicates its instability, suggesting that the hydroxyl group of HPA does not primarily contribute to the conformational change of C1. HPA is perfectly fitted and surrounded by residues Pro169, His170, Leu212, Ala213, Thr218, Ala221, and Arg222 (Fig. 2b).
The subsequent section explores conformational changes in the C-terminal domain (residues 191–315), categorizing it into five helices based on their residue numbers and functions (Table S3, ESI†). Helices 1 and 2 make direct contact with HPA, while helices 3 and 4 form salt bridges with the N-terminal domain (residues 1–168). Helix 5, the farthest from the N-terminal domain, directly contacts helix 1. HPA signals helix 3 to detach from the N-terminal domain through helix 2. Simultaneously, HPA signals helix 4 to detach from the N-terminal domain through helices 1 and 5, illustrating the intricate signaling mechanism within the protein structure.
Impact of HPA on helix 2 conformation
The RMSD plot for helix 2 (Fig. S3, ESI†) shows a significant conformational shift when HPA is absent compared to its presence, indicating HPA's critical role in preserving helix 2's structural integrity. In the absence of HPA (Fig. 3a), water molecules expand within the binding site, displacing Leu188 on a flexible loop (residues 169–190, purple) into the bulk solvent. This displacement disrupts a vital salt bridge between Arg187 and Glu228 (Fig. 3 and Fig. S4, ESI†), leading to the unfolding of Glu228 and nearby residues into a loop, which increases the RMSD value and indicates a significant structural deviation from the original conformation. | ||
| Fig. 3 MD simulations with and without HPA and analysis of key interactions. Panel (a) presents a snapshot from the MD simulation at 4 microseconds, showcasing the protein's structure in the absence of HPA. In contrast, panel (b) displays a corresponding snapshot at 4 microseconds in the presence of HPA. Panel (c) provides a detailed analysis of the distance between the CD atom of GLU228 and the CZ atom of ARG187, key residues forming a critical salt bridge. Helix 1, 2, 3, 4, and 5 are in pink, yellow, orange, cream, blue, respectively. | ||
The established role of HPA in influencing the flexible loop's conformation (residues 169–190) prompts further investigation into the potential reciprocal effect of mutations within this loop on HPA's conformation (Y189A section). This exploration into a regulatory mechanism between HPA and the protein structure is fascinating. It posits that just as HPA can modify the loop's conformation, specific mutations in the loop might also impact HPA's conformation and binding orientation. Investigating this hypothesis could provide valuable insights into the dynamic nature of protein–ligand interactions and the allosteric effects governing them, offering a deeper understanding of these complex biochemical processes.
Influence of HPA on helix 3 conformation
The RMSD plot for helix 3 (Fig. S5, ESI†) underscores a significant conformational shift when HPA is absent, compared to scenarios where it is present. This shift can largely be tracked back to changes in salt bridge formations involving key residues within helix 3. In the absence of HPA, Lys235 of helix 3 breaks its existing salt bridge with Glu250 on helix 4, forming a new one with Glu101 in the N-terminal domain instead (Fig. S6 and S7, ESI†). This reconfiguration affects Arg240 on helix 3 as well, leading it to establish a salt bridge with Glu91 in the N-terminal domain (Fig. S6 and S8, ESI†). Conversely, in the presence of HPA, Lys235 and Arg240 on helix 3 maintain their salt bridges with Glu250 and Asp237/Glu241, respectively, indicating HPA's stabilizing influence on these interactions (Fig. 4 and Fig. S8, ESI†).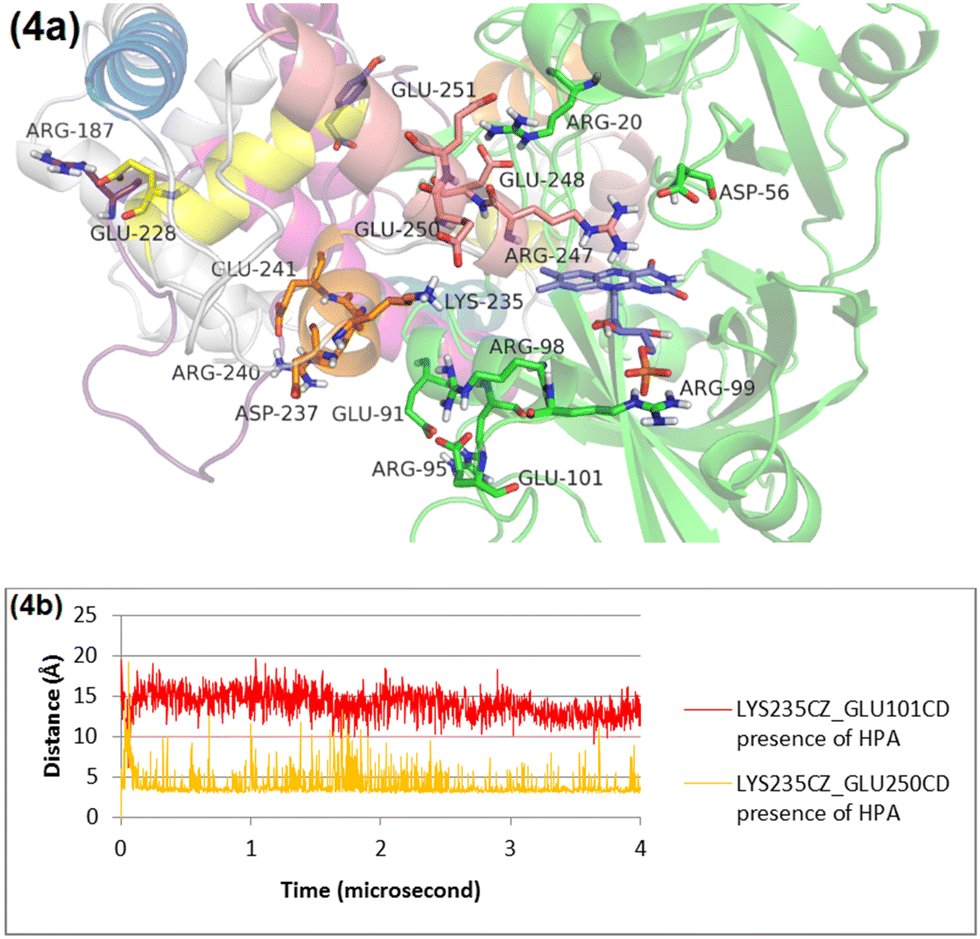 | ||
| Fig. 4 Panel (a) provides a detailed view of the interactions within helix 3 (orange) in the presence of HPA, captured in a snapshot from the MD simulation at 4 microseconds. Panel (b) presents a quantitative analysis, illustrating the distances between Leu235 and two key residues, Glu210 and Glu250, highlighting how the presence of HPA affects these interactions. Helix 1, 2, 3, 4, and 5 are in pink, yellow, orange, cream, blue, respectively. | ||
In short, the absence of HPA leads to the disruption of the salt bridge between Arg187 and Glu228 in helix 2, prompting the formation of a 7-residue loop between helix 2 and helix 3. This disruption leads helix 3 to form new salt bridges with the N-terminal domain, which is relatively farther away.
In contrast, the presence of HPA ensures the maintenance of the salt bridge between Arg187 and Glu228, shortening the loop from 7 to 5 residues. This change influences helix 3 to form salt bridges with the C-terminal domain, which is closer. These observations highlight HPA's critical role in modulating the protein's conformational dynamics, especially regarding inter-domain interactions and the stability of helices and loops, thus emphasizing HPA's essential contribution to the protein's structural integrity and functional specificity.
Impact of HPA on helix 1 conformation
The RMSD plot for helix 1 (Fig. S9, ESI†) reveals a notable conformational change in the presence of HPA, underscoring its significant impact on the structural dynamics of helix 1. Initially, Phe216 is observed forming a hydrogen bond (2.5 Å) with Gln211 (Fig. 5a). After 4 microseconds of simulation with HPA, Phe216 forms a tighter hydrogen bond (2.2 Å) with Leu212 (Fig. 5b). This reorientation of Leu212 suggests a significant structural adjustment in response to the presence of HPA.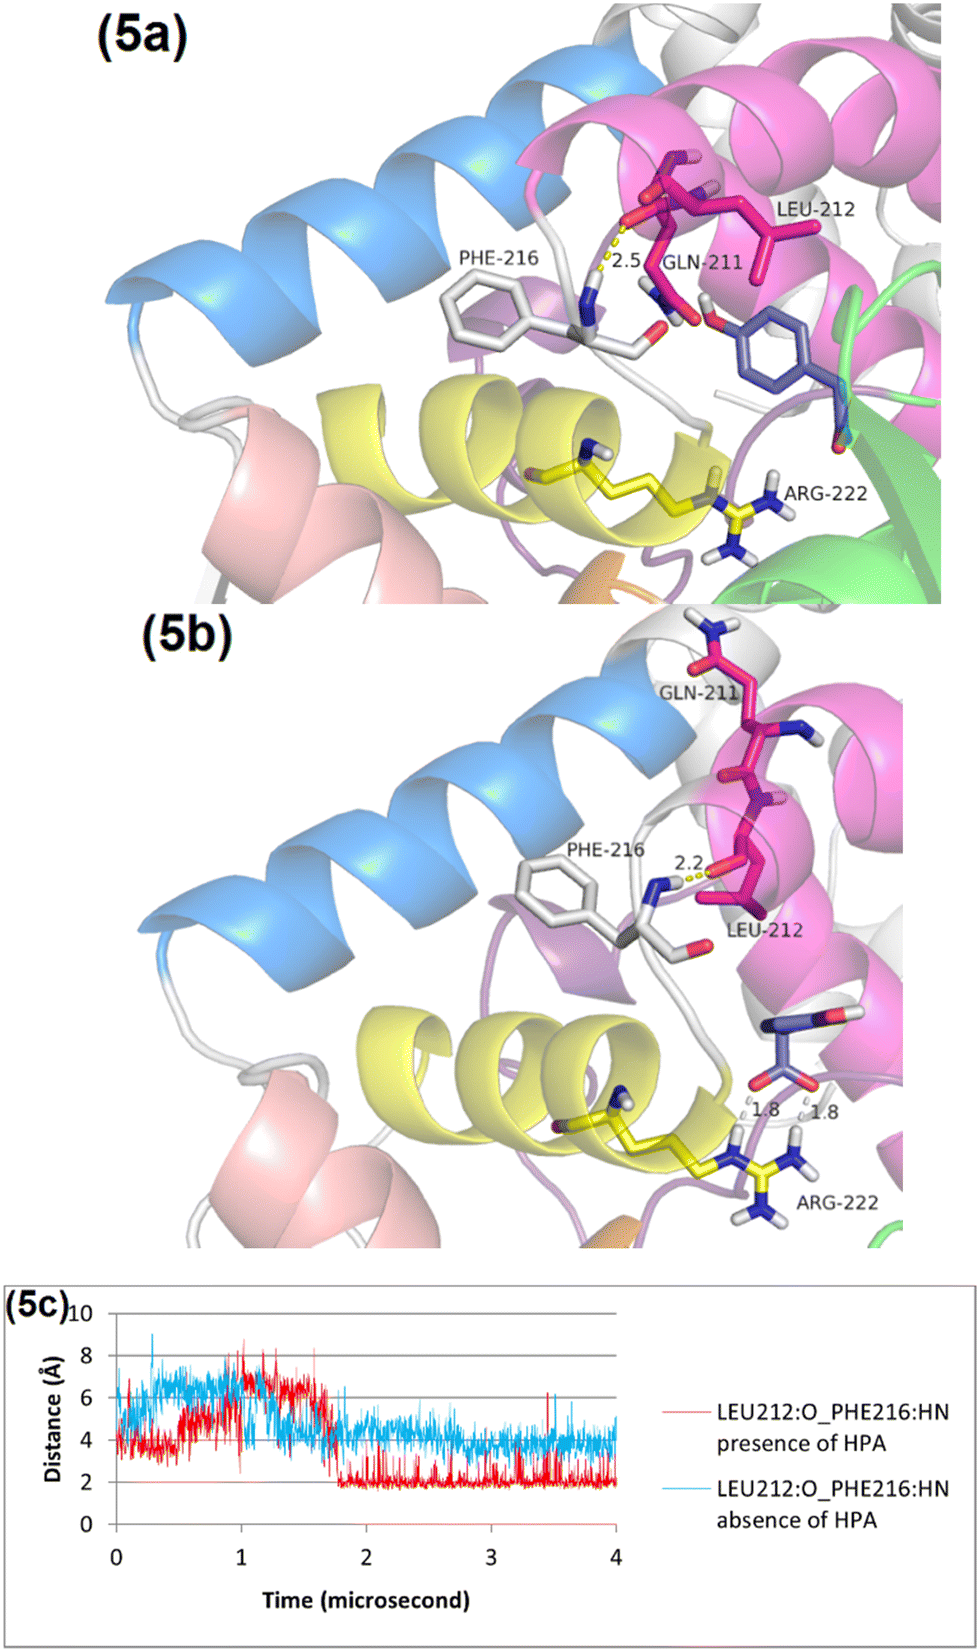 | ||
| Fig. 5 Comparative analysis of HPA's interaction with the C1 protein before and after an MD simulation. Panel (a) shows the initial state of the C1 protein with HPA docked, establishing the baseline for the simulation. Panel (b) depicts the structure of the protein after 4 microseconds of MD simulation, illustrating the dynamic changes over time. Panel (c) provides a focused view on the hydrogen bond interactions between Leu212 and Phe216, comparing these interactions under two scenarios: with and without the presence of HPA. Helix 1, 2, 3, 4, and 5 are in pink, yellow, orange, cream, blue, respectively. | ||
In essence, the presence of HPA induces a significant conformational change in helix 1, characterized by Leu212 rotating towards HPA to engage in a hydrophobic interaction with its aromatic ring. Concurrently, Gln211 rotates outward, better aligning with the surrounding hydrophilic environment. These shifts underscore the critical role of HPA in modulating the structure and interactions of helix 1, potentially affecting the protein's functionality and regulatory mechanisms.
Impact of HPA on helix 5 conformation
In the absence of HPA, Leu212 does not occupy the HPA binding site. Instead, residues Leu282 and Leu285 on helix 5 fill this space, making a distinct conformational state of the protein without HPA bound. The introduction of HPA, however, triggers a significant conformational change: Leu212 rotates into the binding site to engage in a hydrophobic interaction with HPA's benzene ring. This movement creates a spatial clash with Leu282 and Leu285, prompting a consequential repositioning of helix 5 (Fig. 6 and Fig. S10, ESI†).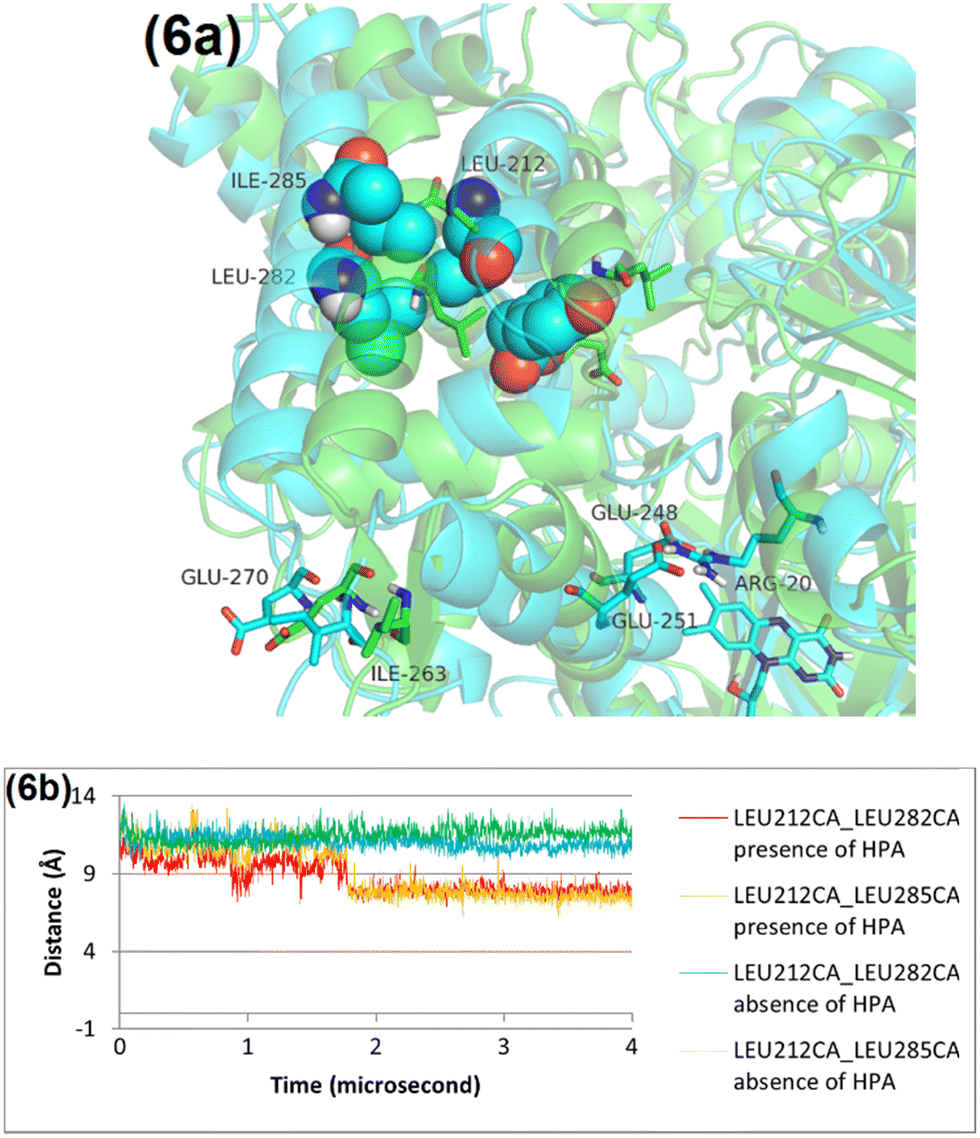 | ||
| Fig. 6 The structural changes observed in the C1 protein through MD simulations, with comparisons made before and after 4 microseconds of simulation. (a) The protein's configuration before the MD simulation is in green, while the structure after 4 microseconds of simulation is in blue. (b) Provides a detailed analysis of the distances between the alpha carbons of Leu212 and either Leu282 or Leu285, measured both in the presence and absence of HPA. | ||
This repositioning of helix 5 further leads to additional structural alterations, notably the separation of a short beta-sheet comprising Ile263 and Glu270 on the loop between helix 5 and helix 4 (Fig. S11 and S12, ESI†) and pulling the top part of helix 4 away from N-terminal domain. These changes illustrate the profound impact of HPA on the protein's spatial configuration, affecting not only the positioning of specific amino acids but also inducing broader structural rearrangements, including shifts in helices and beta sheets. Such observations are vital for understanding the nuanced molecular mechanisms driving protein–ligand interactions and the adaptive conformational flexibility of proteins in response to ligand binding.
Impact of HPA on helix 4 conformation
Despite helix 4 being shifted away from N-terminal domain by helix 5 in the presence of HPA, the RMSD values for helix 4 show remarkable consistency, regardless of HPA's presence or absence (Fig. S13, ESI†). A closer examination offers further insights. In the absence of HPA, the salt bridge between Glu248/Glu251 on helix 4 and Arg20 of the N-terminal domain spontaneously breaks from 1.3 to 1.7 microseconds (Fig. 7b). A snapshot (Fig. 7a) at 1.5 microseconds reveals that Arg20 forms a salt bridge (3.9 Å) with Asp56, while, Glu248 and Glu251 form salt bridges with Arg247 (4.4 Å) and Arg217 (3.8 Å), respectively. The breakage of the salt bridge between Glu248/Glu251 and Arg20 in the absence of HPA can be observed because the starting point of the MD simulation is chain B of C1 (Fig. 1b), which displays an impaired salt bridge between Glu248/Glu251 and Arg20. Thus, this state indicates that the breakage of the salt bridge between Glu248/Glu251 and Arg20 is independent of HPA. | ||
| Fig. 7 Structural changes observed in the C1 protein through MD simulations. Panel (a) shows the C1 structure at 1.5 microseconds in the absence of HPA. Panel (b) provides a detailed analysis of the distances between Arg20 and either Glu248 or Glu251, measured both in the presence and absence of HPA. Helix 1, 2, 3, 4, and 5 are in pink, yellow, orange, cream, blue, respectively. | ||
Then, what is the role of HPA in the conformation of helix 4? In the absence of HPA, Glu250 on helix 4 forms a salt bridge with Arg99 in the N-terminal domain (Fig. S6, ESI†), a connection that is disrupted by the presence of HPA (Fig. 4 and Fig. S14, ESI†). This indicates that HPA plays a role in distancing helix 4 from the N-terminal domain, thereby facilitating a new salt bridge between Arg99 and the phosphate of flavin. This may promote a favorable conformation for the formation of the FMN-NADH complex since the distance between Arg99 and the phosphate of flavin is stable at 4 Å in the presence of HPA (Fig. S15, ESI†). In addition, RMSD of the flavin is lower in the presence of HPA (Fig. S16, ESI†).
In order to approximate the location of the NADH binding site in C1, the crystal structure of flavin reductase PheA2 complexed with NAD+ (1rz1.pdb) is aligned with a 4-microsecond snapshot of C1 in the presence of HPA. Similar interactions are noted with C1's equivalents, Arg20 and His139, and their engagement with NADH (Fig. S17, ESI†). Nonetheless, the salt bridge between Arg247 on helix 4 and Asp56 on the N-terminal domain might obstruct NADH binding by displacing His139 and preventing essential disruptions of salt bridges involving Arg20, Glu248, and Glu251.
Recall that Arg20 can form a salt bridge with Asp56 in the absence of HPA; however, this interaction is not observed when HPA is present. Why does Asp56 form a salt bridge with Arg247 instead of Arg20 in the presence of HPA (Fig. S18, ESI†)? According to previous work,42 the rate of HPA-stimulated flavin reduction in the R247A variant is similar to that of wild-type C1. Thus, Arg247 is likely not involved, suggesting that a salt bridge between Arg247 and Asp56 could be an artifact resulting from the absence of initial residues (1–9). This absence might affect the positioning of Lys11, closest positive charge to Asp56 (Fig. S19, ESI†). In the absence of such an artifact, helix 4 is likely shifted away from N-terminal domain by the pulling force from helix 5, which is induced by HPA, to open the binding site for NADH.
While the current model does not fully elucidate the movement of helix 4, it highlights that allosteric HPA-stimulated flavin reduction in C1 consists of two independent effects. The first effect is HPA-independent, in which Arg20 departs from Glu248/Glu251 of helix 4 and forms a salt bridge with Asp56. The second effect is HPA-dependent, wherein HPA induces conformational changes in the C-terminal domain, leading to the separation of helix 3 and helix 4 from the N-terminal domain to create a binding site for NADH.
Impact of the Y189A mutation on HPA binding and flavin reduction
To gain a deeper understanding of the impact of specific residues on HPA binding and activity, we investigated the function of flexible loop through saturation mutagenesis. Y189 on the flexible loop was selected for site-saturation mutagenesis due to its potential role in HPA binding and activation. Primers were designed to encode all 20 amino acids, and the resulting plasmids were analyzed for the amino acid population using Qpool. The Qpool value for the site-saturation mutagenesis of Y189X is 0.90, indicating that the site-saturation library successfully represents all 20 amino acids, providing a sufficiently representative collection of variants for screening studies.After undergoing site-saturation mutagenesis, plasmids exhibiting high Qpool values were transformed into E. coli BL21(DE3). A total of 308 colonies of C1-Y189 were picked and cultured in four 96-well plates, with C1-wild type, media, and buffer serving as controls. The crude protein, after expression and extraction, was assayed using the MTT method. The results showed that the activity of most C1-Y189 variants decreased, both in the presence and absence of HPA (Fig. S20, ESI†). To confirm these results, some variants were selected for sequencing and porin field analysis. Y189A was chosen to observe the real kinetics of pure protein and to see the difference when Y189 is changed to a smaller amino acid. The results indicated that mutating tyrosine to alanine reduces the activity of C1 (Fig. S21, ESI†), even when HPA is present in the reaction. This suggests that Y189 is important for the activity of C1.
To further understand the role of Y189, isothermal titration calorimetry (ITC) was utilized to determine the dissociation constants (Kd) of C1 and its ligand compounds. This experiment measured the heat change resulting from the binding of HPA to C1. C1 was dialyzed and solubilized in 50 mM sodium phosphate buffer (pH 7.5) overnight at 4 °C. The ITC results showed that the wild-type C1 (C1-WT) exhibited a Kd of 27.90 ± 2.12 μM. When Y189 was mutated to alanine, the Kd increased to 47.15 ± 6.43 μM (Fig. S22, ESI†), indicating a slightly weaker interaction between the Y189A variant and HPA.
Although HPA binds to the Y189A variant, there is a notable absence of stimulation in flavin reduction by HPA. This observation indicates that analyzing the molecular dynamics of HPA's interaction with the Y189A variant could yield crucial insights into the underlying mechanisms of HPA's stimulatory effects. According to Fig. 8c, the RMSD of the flexible loop in the Y189A variant is significantly higher than in the wild type (WT), suggesting that the Y189A mutation leads to more pronounced conformational changes within the flexible loop and the C-terminal domain of C1. Consequently, these changes result in a displacement effect in the HPA binding site, causing HPA to shift positionally.
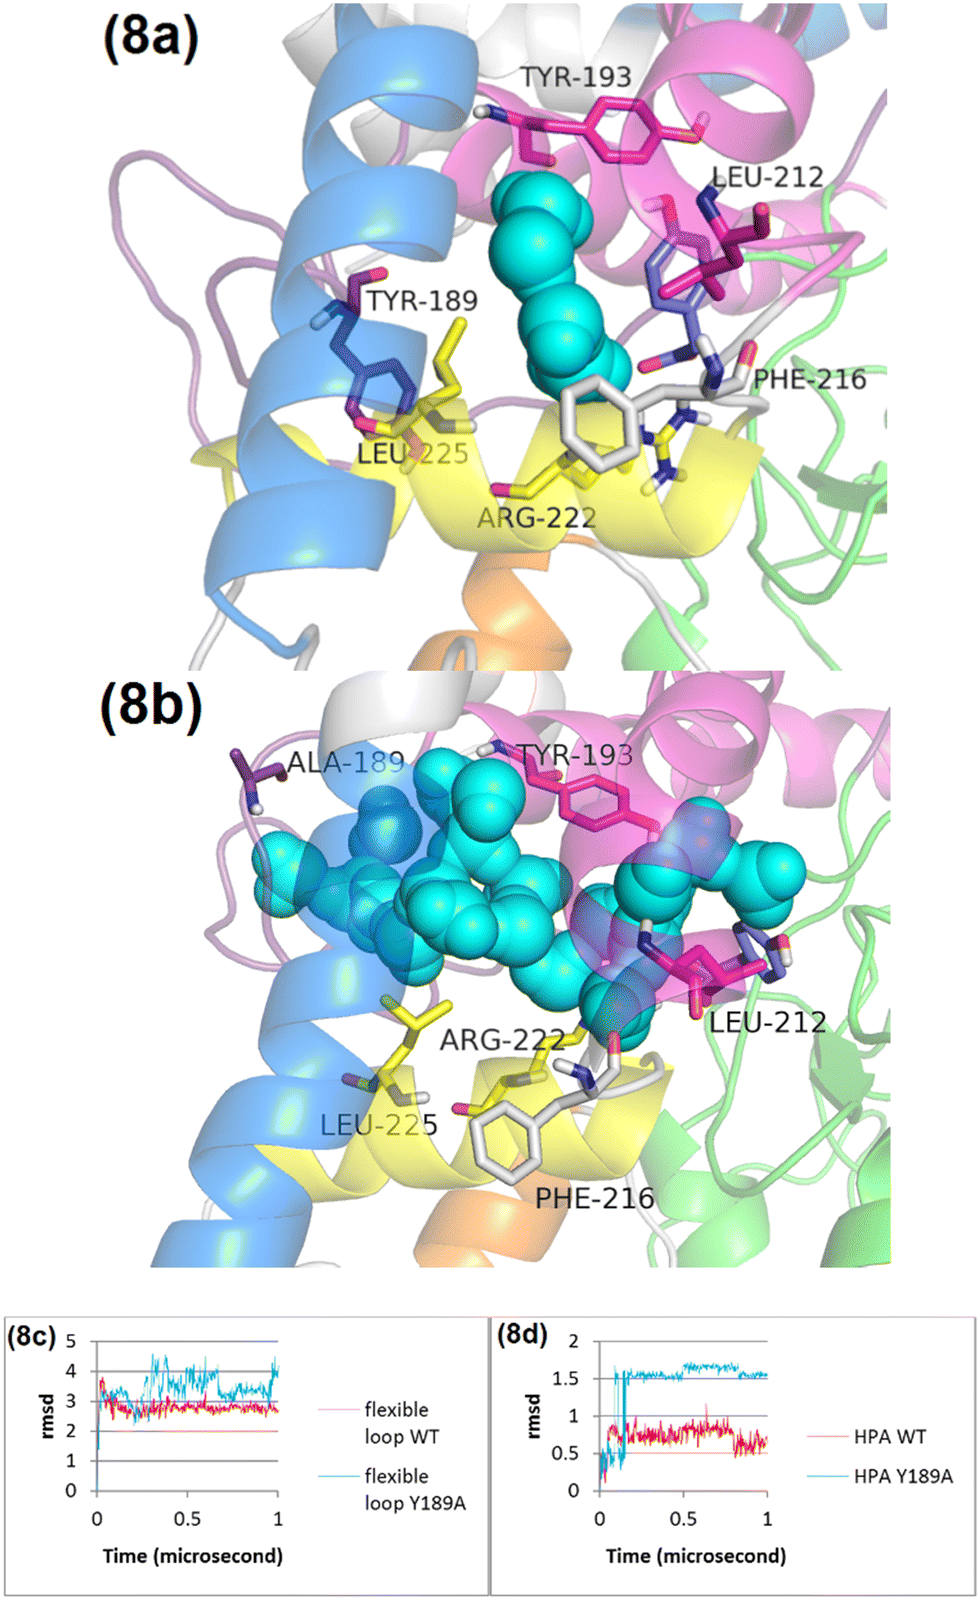 | ||
| Fig. 8 Comparative MD snapshots and RMSD analysis for the WT and the Y189A variant. Panel (a) displays an MD snapshot at 1 microsecond for the WT, showcasing the protein's structural conformation at this specific time point. Panel (b) presents an MD snapshot at 1 microsecond for the Y189A variant, facilitating a direct comparison of the structural differences resulting from the mutation. Panel (c) offers a detailed RMSD analysis, comparing the loop dynamics, and panel (d) illustrates HPA interactions in both the WT and the Y189A variant. Helix 1, 2, 3, 4, and 5 are in pink, yellow, orange, cream, blue, respectively. | ||
The marked difference in RMSD values for HPA when bound to Y189A (Fig. 8d), as opposed to WT, implies that the Y189A mutation triggers a conformational alteration in HPA itself. This altered conformation in the Y189A variant facilitates a distinct pattern of conformational changes in helix 1 (Fig. S23, ESI†). Unlike in WT, where Leu212 engages in van der Waals interactions with HPA's aromatic ring (Fig. 8a), the positional shift of HPA in the Y189A variant prevents Leu212 from forming these interactions, affecting the interaction with Leu282 and Leu285 as well (Fig. 8b). This finding underscores a critical point: for HPA to effectively stimulate flavin reduction, it must not only bind to the protein but also maintain an appropriate conformation. Our results from MD simulations and experimental data strongly suggest that Y189 is crucial for the proper conformational changes required for HPA to stimulate flavin reduction. The integration of structural dynamics insights and experimental validation with the Y189A variant supports our proposed allosteric mechanism, providing a foundation for further studies on other critical residues within the flexible loop and the C-terminal domain.
Discussion
This research identifies the HPA binding site using the acetate-bound crystal structure of C1 as a reference, with HPA docked into C1 to replace acetate. MD simulations in the absence of HPA show that helix 3 is connected to the N-terminal domain by two salt bridges: Arg240 of helix 3 with Glu91 of the N-terminal domain and Lys235 of helix 3 with Glu101 of the N-terminal domain (Fig. S6, ESI†). Similarly, helix 4 is anchored by salt bridges to the N-terminal domain: Glu250 of helix 4 with Arg99, and Glu248 with Glu251 of helix 4 with Arg20 (Fig. S6, ESI†). This arrangement causes the FMN to take a position that potentially obstructs NADH binding.In the presence of HPA, MD simulations reveals HPA's role in prompting Glu228 of helix 2 to form a salt bridge with Arg187 of the flexible loop (Fig. 3), shortening the loop between helix 2 and helix 3 and causing helix 3 to move away from the N-terminal domain. This shift leads Arg240 of helix 3 to form salt bridges with Asp237 and Glu241 on helix 3, while Lys235 binds with Glu250 of helix 4 (Fig. 4). Furthermore, HPA triggers Leu212 of helix 1 to engage in hydrophobic interactions with both HPA and Leu282/Leu285 of helix 5, pushing helix 5 leftward and disrupting a short-beta sheet between helix 4 and helix 5, composed of Ile263 and Glu270 (Fig. 5 and 6). This movement causes Glu250 of helix 4 to detach from Arg99 of the N-terminal domain, allowing Arg99 to form a salt bridge with FMN, thereby creating a favorable conformation for NADH binding (Fig. 4). Essentially, HPA encourages C1 to form intra-domain salt bridges, facilitating the creation of an NADH binding site. Another effect is HPA independent in which Arg20 departs from Glu248/Glu251 of helix 4 and forms a salt bridge with Asp56 (Fig. 7). The Y189A variant analysis shows that HPA must bind to C1 in the correct conformation to induce significant conformational changes, such as those seen in Leu212 of helix 1 (Fig. 8).
The binding mode of HPA in C1 and NadR exhibits similarities, characterized by a polar floor and a hydrophobic ceiling pattern.45 In C1, the carboxylate group of HPA forms hydrogen bonds with Arg222 and the backbones of Pro169 and His170, whereas in NadR, it engages with Ser9, Trp39, Arg43, and Tyr115. Furthermore, the hydroxyl group of HPA in C1 donates a hydrogen bond to the carbonyl group of Phe216, while in NadR, it interacts with Asp36. Surrounding HPA in C1 are residues Pro169, Leu212, Ala213, Thr218, and Ala221, contrasting with Leu21, Met22, Phe25, Leu29, and Val111 in NadR.
Comparing HPA binding in proteins C1 and C2, both utilize Arg222 and Arg263, respectively, to form salt bridges with the carboxylate group of HPA. While the interaction between Phe216 and HPA's hydroxyl group in C1 shows variability, C2's hydroxyl group consistently forms stable hydrogen bonds with Ser146 and His120. These interactions are essential for the efficient hydroxylation of HPA by C4aOOH.69–71 Additionally, C2 engages in van der Waals interactions with residues such as Leu116, Ile148, Phe266, Ala267, Phe270, Tyr296, His396, Tyr398, and FMN, enhancing the substrate's reactivity.72 A notable structural feature in C2 is a small cavity near the C4a position of FMN, adjacent to the ortho carbon of HPA, which accommodates molecular oxygen. This arrangement, involving reduced FMN and fully protonated His396, facilitates the formation of C4aOOH through proton-coupled electron transfer, followed by the nearly barrierless formation of the C4a-OOH bond.40,73,74
Mutations in C1 have been studied to assess their impact on flavin reduction stimulated by HPA.33 These variants are categorized into three groups based on their flavin reduction rates. The first group, including R20A, H170A, S172A, N174A, E248A and E251A, demonstrates stimulated flavin reduction by HPA but at a lower rate than the wild-type C1. Specifically, R20A shows a decreased rate due to the role of Arg20 as NADH binding residue. H170A, S172A, and N174A, located on the flexible loop, along with helix 2, are crucial for transmitting HPA's signal to helix 3, encouraging its departure from the N-terminal domain. In this study, Tyr189 on the flexible loop was targeted for site saturation mutagenesis. The Y189A variant exhibits an unusual property by causing excessive occupancy of water at the HPA binding site. Although HPA binds to Arg222, it is misaligned and fails to trigger the necessary conformational change in Leu212, resulting in an absence of flavin reduction stimulation by HPA. The flavin reduction rate in E248A and E251A variants is stimulated by HPA because of a salt bride with Arg20.
The second group, represented by Y207A, exhibits flavin reduction rates similar to wild-type C1 in the absence of HPA but lacks stimulation in its presence. Isothermal titration calorimetry (ITC) experiments indicate that Y207A does not bind HPA, likely due to a more pronounced flooding effect at the binding site, akin to Y189A, which displaces HPA into the bulk solvent. The third group, including F216A and the E248A/E251A double variant, shows a higher flavin reduction rate than wild-type C1 in the absence of HPA. F216A, located on the loop connecting helix 1 and helix 2, does not bind HPA, possibly due to significant conformational change that disrupts the salt bridge between helix 4 and the N-terminal domain, independently of HPA. The E248A/E251A double variant demonstrates an increased flavin reduction rate in the absence of HPA because Arg20 can only form a salt bridge with Asp56, reducing the negative charge on helix 4 and allowing better NADH binding. Furthermore, the flavin reduction rate of the E248A/E251A double variant is further increased to the same level as wild-type C1 in the presence of HPA because HPA induces helix 5 to pull helix 4 leftward, creating an even better NADH binding site between helix 4 and Arg20, which currently forms a salt bridge with Asp56. Thus, the results from the E248A/E251A double variant support the notion that C1 undergoes conformational changes due to both HPA-independent and HPA-dependent effects.
In this research, HPA stimulates flavin reduction in C1 through its carboxylate and hydrophobic phenyl group. The carboxylate group forms a salt bridge with Arg222 on helix 2, transmitting a signal for helix 3 to detach from the N-terminal domain. Simultaneously, the hydrophobic phenyl group triggers a conformational change in Leu212 on helix 1, causing a steric clash with Leu282 and Leu285 on helix 5. This clash leads to helix 4 moving away from the N-terminal domain. Notably, the hydroxyl group of HPA does not directly participates in this allosteric mechanism. Contrastingly, in PHBH from Pseudomonas fluorescens, an allosteric model for single-component FDMOs, flavin reduction is stimulated by the deprotonation of a hydroxyl group of p-hydroxybenzoate, influenced by a proton transfer network.22 Mutations, such as H72N, Y201F, and Y385F within this network, significantly reduce flavin reduction rates.16,75
A comparison of hydride transfer from NAD(P)H to flavin between PHBH and C1 reveals a distinct difference: in C1, NADH transfers a pro-(S)-hydride to FMN,41 whereas NADPH transfers a pro-(R)-hydride to FAD in PHBH.76 This distinction is evident in Fig. S17 (ESI†), showing the pro-(S)-hydride's closer proximity to N5 of FMN compared to the pro-(R)-hydride. Despite the availability of the PHBH variant's crystal structure in complex with NADPH, the observed binding mode does not accurately represent flavin reduction, as the adenine moiety is positioned near FAD while the nicotinamide ring remains distant.77
MD simulations of C1 in complex with HPA show that HPA prompts the C-terminal domain to form salt bridges internally rather than with the N-terminal domain. Small angle X-ray scattering (SAXS) experiments reveal that C1 bound to HPA exhibits a larger radius of gyration compared to C1 alone, suggesting HPA induces a more extended conformation in C1, This extended conformation aligns with an increased flavin reduction rate observed in the presence of HPA.33 In this state, Glu248 and Glu251 of helix 4 do not engage in salt bridges with Arg20 of the N-terminal domain, a conformation not predicted by MD simulations due to an artifact salt bridge between Arg247 of helix 4 and Asp56 of the N-terminal domain (Fig. S17, ESI†). The similarity in flavin reduction rates between the R247A variant and wild-type C1, regardless of HPA presence, suggests this salt bridge is an artifact, potentially arising from the absence of residues 1–9 in the N-terminal domain that would interact with Asp56, such as Lys11 (Fig. S19, ESI†). Addressing this artifact by accurately modeling missing residues in the N-terminal domain could provide more accurate insights into C1's allosteric mechanisms induced by HPA.
This study not only elucidates the mechanism of HPA binding and its allosteric effects on C1 but also sets a foundation for understanding similar mechanisms in two-component FDMOs or enzymes influenced by aromatic ligands, like NadR.
The structure of the reductase component of HPAH from Pseudomonas putida is predicted by Alphafold378 (Fig. S24, ESI†). The allosteric mechanism of the reductase component of HPAH from Pseudomonas putida is proposed to include HPA-independent and HPA-dependent effects. The HPA-independent effect involves Arg11 (Arg20 in C1) on the N-terminal domain dissociating from Glu241 (Glu248 in C1) and Glu244 (Glu251 in C1) on helix 4 to form a salt bridge with Asp47 (Asp56 in C1) on the N-terminal domain. The HPA-dependent effect occurs when HPA binds with Arg215 (Arg222 in C1) on helix 2 to preserve the salt bridge between Glu221 (Glu228 in C1) on helix 2 and Arg180 (Arg187 in C1) on the flexible loop, leading to the dissociation of Arg233 (Arg240 in C1) on helix 3 and Asp82 (Glu91 in C1) on the N-terminal domain. The aromatic ring of HPA induces a conformational change in Leu206 (Leu212 in C1) on helix 1, causing steric clashes with Leu275 (Leu282 in C1) and Leu278 (Ile285 in C1) on helix 5. This shifts helix 5 to the left, pulling helix 4 away from the N-terminal domain to create the NADH binding site. The key difference between C1 and this HPAH is the presence of Pro90 instead of Arg99. Consequently, Glu239 (Glu250 in C1) does not form a salt bridge with the N-terminal domain.
The structure of the reductase component of nitrilotriacetate monooxygenase (ntaB) from Chelatobacter strain ATCC 29600 is also predicted by Alphafold378 (Fig. S25, ESI†). Its allosteric mechanism includes nitrilotriacetate-independent and nitrilotriacetate-dependent effects. The nitrilotriacetate-independent effect involves Arg22 (Arg20 in C1) on the N-terminal domain dissociating from Glu248 (Glu248 in C1) and Asp251 (Glu251 in C1) on helix 4 to form a salt bridge with Asp57 (Asp56 in C1) on the N-terminal domain. The nitrilotriacetate-dependent effect involves nitrilotriacetate binding with Arg211 (Gln211 in C1) on helix 2, Arg280 (Ala279 in C1) on helix 5, and Arg178 (no homologous residue in C1) on the flexible loop. To accommodate the formation of three salt bridges, helix 5 shifts to the left, pulling helix 4 away from the N-terminal domain to create the NADH binding site. Key homologous residues in C1, such as Arg222, Leu212, Leu282, and Leu285, correspond to Lys222, Ser212, Met283, and Tyr286 in ntaB, respectively, but these residues in ntaB do not appear to be involved in the allosteric mechanism. Additionally, ntaB lacks many salt bridges observed in C1. For example, Tyr288 (Glu228 in C1) on helix 2 cannot form a salt bridge, and Arg240 (Arg240 in C1) on helix 3 cannot form a salt bridge with Gly92 (Glu91 in C1) on the N-terminal domain. There is also no salt bridge between Val250 (Glu250 in C1) on helix 4 and Gly100 (Arg99 in C1) on the N-terminal domain. Consequently, helix 2 and helix 3 in ntaB do not appear to be involved in the allosteric mechanism.
Although, the crystal structure of HPA-bound NadR is available, the superposition of apo-NadR and HPA-bound NadR reveals no conformational change of NadR (Fig. S26, ESI†). The conformation selection theory is proposed based on these structures, in which HPA stabilizes NadR in a conformation that is unsuitable for DNA binding.45 In this work, we propose an alternative theory in which HPA induces a conformational change in NadR similar to that in C1. The carboxylate group of HPA should bind with Arg40 of NadR (similar to Arg222 in C1) instead of Arg43, as observed in the crystal structure. Then, Leu29 (similar to Leu212 in C1) on helix1 changes its conformation to interact with HPA. Consequently, Leu29 clashes with Ile107 (similar to Leu282 in C1) and Val111 (similar to Ile285 in C1) on helix 5. Helix 5 then shifts to the left and pulls helix 4, which is a recognition helix, away from the DNA.
This allosteric model of C1 may also be applied to HpaR, a transcription regulator in the MarR family. This regulator plays a crucial role in controlling the expression of genes responsible for p-hydroxyphenylacetate degradation,79 demonstrating the broader applicability of these findings in the study of protein–ligand interactions and enzymatic regulation.
Author contributions
S. V., P. A., and T. W. designed the study. P. A. conducted experimental work. N. L. conducted molecular dynamics simulations. S. V. performed molecular docking and data analysis. S. V. and P. A. drafted the manuscript. P. C. and T. W. revised the manuscript.Data availability
All data supporting the findings of this study, including the code and molecular dynamics snapshots, are freely available at https://github.com/N-Lawan/Flavin-dependent-monooxygenases/tree/main. The repository contains all necessary files for reproducibility, including the exact versions of the code and the date of data deposition. The data supporting this article have also been included as part of the ESI.†Conflicts of interest
There are no conflicts to declare.Acknowledgements
This work was supported by the Thailand Science Research Innovation NSRF via the Program Management Unit for Human Resources & Institutional Development, Research and Innovation grant number B05F640089, Kasikorn bank, TSRI Fundamental Fund, Vidyasirimedhi Institute of Science and Technology (VISTEC), and Chiang Mai University.References
- E. Romero, J. R. Gómez Castellanos, G. Gadda, M. W. Fraaije and A. Mattevi, Chem. Rev., 2018, 118, 1742–1769 CrossRef CAS PubMed.
- A. Phintha and P. Chaiyen, J. Biol. Chem., 2023, 299, 105413 CrossRef CAS.
- W. J. H. van Berkel, N. M. Kamerbeek and M. W. Fraaije, J. Biotechnol., 2006, 124, 670–689 CrossRef CAS PubMed.
- M. M. E. Huijbers, S. Montersino, A. H. Westphal, D. Tischler and W. J. H. van Berkel, Arch. Biochem. Biophys., 2014, 544, 2–17 CrossRef CAS.
- C. E. Paul, D. Eggerichs, A. H. Westphal, D. Tischler and W. J. H. van Berkel, Biotechnol. Adv., 2021, 51, 107712 CrossRef CAS PubMed.
- B. A. Palfey and C. A. McDonald, Arch. Biochem. Biophys., 2010, 493, 26–36 CrossRef CAS PubMed.
- D. P. Ballou, B. Entsch and L. J. Cole, Biochem. Biophys. Res. Commun., 2005, 338, 590–598 CrossRef CAS PubMed.
- J. Powlowski, D. Ballou and V. Massey, J. Biol. Chem., 1989, 264, 16008–16016 CrossRef CAS PubMed.
- P. Chaiyen, P. Brissette, D. P. Ballou and V. Massey, Biochemistry, 1997, 36, 2612–2621 CrossRef CAS PubMed.
- P. Chaiyen, P. Brissette, D. P. Ballou and V. Massey, Biochemistry, 1997, 36, 13856–13864 CrossRef CAS.
- P. Chaiyen, J. Sucharitakul, J. Svasti, B. Entsch, V. Massey and D. P. Ballou, Biochemistry, 2004, 43, 3933–3943 CrossRef CAS.
- W. A. Suske, W. J. van Berkel and H. P. Kohler, J. Biol. Chem., 1999, 274, 33355–33365 CrossRef CAS PubMed.
- L. G. Howell, T. Spector and V. Massey, J. Biol. Chem., 1972, 247, 4340–4350 CrossRef CAS.
- A. H. Westphal, D. Tischler, F. Heinke, S. Hofmann, J. A. D. Gröning, D. Labudde and W. J. H. van Berkel, Front. Microbiol., 2018, 9, 3050 CrossRef.
- B. Entsch, L. J. Cole and D. P. Ballou, Arch. Biochem. Biophys., 2005, 433, 297–311 CrossRef CAS.
- B. A. Palfey, G. R. Moran, B. Entsch, D. P. Ballou and V. Massey, Biochemistry, 1999, 38, 1153–1158 CrossRef CAS PubMed.
- K. K. Frederick and B. A. Palfey, Biochemistry, 2005, 44, 13304–13314 CrossRef PubMed.
- B. A. Palfey, R. Basu, K. K. Frederick, B. Entsch and D. P. Ballou, Biochemistry, 2002, 41, 8438–8446 CrossRef CAS.
- D. P. Ballou and V. Massey, Biochemistry, 1997, 36, 15713–15723 CrossRef PubMed.
- H. A. Schreuder, P. A. Prick, R. K. Wierenga, G. Vriend, K. S. Wilson, W. G. Hol and J. Drenth, J. Mol. Biol., 1989, 208, 679–696 CrossRef CAS.
- D. L. Gatti, B. A. Palfey, M. S. Lah, B. Entsch, V. Massey, D. P. Ballou and M. L. Ludwig, Science, 1994, 266, 110–114 CrossRef CAS PubMed.
- H. A. Schreuder, A. Mattevi, G. Obmolova, K. H. Kalk, W. G. Hol, F. J. van der Bolt and W. J. van Berkel, Biochemistry, 1994, 33, 10161–10170 CrossRef CAS.
- W. J. van Berkel, M. H. Eppink and H. A. Schreuder, Protein Sci., 1994, 3, 2245–2253 CrossRef CAS.
- J. Vervoort, W. J. Van Berkel, F. Muller and C. T. Moonen, Eur. J. Biochem., 1991, 200, 731–738 CrossRef CAS.
- B. Entsch, D. P. Ballou and V. Massey, J. Biol. Chem., 1976, 251, 2550–2563 CrossRef CAS.
- M. Husain and V. Massey, J. Biol. Chem., 1979, 254, 6657–6666 CrossRef CAS.
- D. Tischler, D. Eulberg, S. Lakner, S. R. Kaschabek, W. J. H. V. Berkel and M. Schlömann, J. Bacteriol., 2009, 191, 4996–5009 CrossRef CAS PubMed.
- T. Uetz, R. Schneider, M. Snozzi and T. Egli, J. Bacteriol., 1992, 174, 1179–1188 CrossRef CAS.
- U. Arunachalam, V. Massey and C. S. Vaidyanathan, J. Biol. Chem., 1992, 267, 25848–25855 CrossRef CAS PubMed.
- P. Chaiyen, C. Suadee and P. Wilairat, Eur. J. Biochem., 2001, 268, 5550–5561 CrossRef CAS.
- K. Thotsaporn, J. Sucharitakul, J. Wongratana, C. Suadee and P. Chaiyen, Biochim. Biophys. Acta, 2004, 1680, 60–66 CrossRef CAS.
- W. Oonanant, J. Sucharitakul, P. Chaiyen and J. Yuvaniyama, Acta Crystallogr., Sect. F:Struct. Biol. Cryst. Commun., 2012, 68, 720–723 CrossRef CAS PubMed.
- A. Yuenyao, N. Petchyam, N. Kamonsutthipaijit, P. Chaiyen and D. Pakotiprapha, Arch. Biochem. Biophys., 2018, 653, 24–38 CrossRef CAS PubMed.
- M. Varadi, D. Bertoni, P. Magana, U. Paramval, I. Pidruchna, M. Radhakrishnan, M. Tsenkov, S. Nair, M. Mirdita, J. Yeo, O. Kovalevskiy, K. Tunyasuvunakool, A. Laydon, A. Žídek, H. Tomlinson, D. Hariharan, J. Abrahamson, T. Green, J. Jumper, E. Birney, M. Steinegger, D. Hassabis and S. Velankar, Nucleic Acids Res., 2023, 52, D368–D375 CrossRef.
- H. R. Ellis, Arch. Biochem. Biophys., 2010, 497, 1–12 CrossRef CAS.
- T. Heine, W. J. H. Van Berkel, G. Gassner, K.-H. Van Pée and D. Tischler, Biology, 2018, 7, 42 CrossRef CAS PubMed.
- K. Thotsaporn, R. Tinikul, S. Maenpuen, J. Phonbuppha, P. Watthaisong, P. Chenprakhon and P. Chaiyen, J. Mol. Catal. B: Enzym., 2016, 134, 353–366 CrossRef CAS.
- J. Sucharitakul, T. Phongsak, B. Entsch, J. Svasti, P. Chaiyen and D. P. Ballou, Biochemistry, 2007, 46, 8611–8623 CrossRef CAS PubMed.
- J. Sucharitakul, R. Tinikul and P. Chaiyen, Arch. Biochem. Biophys., 2014, 555–556, 33–46 CrossRef CAS.
- S. Visitsatthawong, P. Chenprakhon, P. Chaiyen and P. Surawatanawong, J. Am. Chem. Soc., 2015, 137, 9363–9374 CrossRef CAS PubMed.
- J. Sucharitakul, P. Chaiyen, B. Entsch and D. P. Ballou, Biochemistry, 2005, 44, 10434–10442 CrossRef CAS PubMed.
- T. Phongsak, J. Sucharitakul, K. Thotsaporn, W. Oonanant, J. Yuvaniyama, J. Svasti, D. P. Ballou and P. Chaiyen, J. Biol. Chem., 2012, 287, 26213–26222 CrossRef CAS.
- A. Grove, Curr. Biol., 2013, 23, R142–R143 CrossRef CAS PubMed.
- D. K. Deochand and A. Grove, Crit. Rev. Biochem. Mol. Biol., 2017, 52, 595–613 CrossRef CAS.
- A. Liguori, E. Malito, P. Lo Surdo, L. Fagnocchi, F. Cantini, A. F. Haag, S. Brier, M. Pizza, I. Delany and M. J. Bottomley, PLoS Pathog., 2016, 12, e1005557 CrossRef PubMed.
- M. Okai, N. Kudo, W. C. Lee, M. Kamo, K. Nagata and M. Tanokura, Biochemistry, 2006, 45, 5103–5110 CrossRef CAS PubMed.
- S. H. Kim, T. Hisano, W. Iwasaki, A. Ebihara and K. Miki, Proteins, 2008, 70, 718–730 CrossRef CAS.
- R. H. H. van den Heuvel, A. H. Westphal, A. J. R. Heck, M. A. Walsh, S. Rovida, W. J. H. van Berkel and A. Mattevi, J. Biol. Chem., 2004, 279, 12860–12867 CrossRef CAS PubMed.
- B. N. Webb, J. W. Ballinger, E. Kim, S. M. Belchik, K. S. Lam, B. Youn, M. S. Nissen, L. Xun and C. Kang, J. Biol. Chem., 2010, 285, 2014–2027 CrossRef CAS.
- A. D. Becke, J. Chem. Phys., 1993, 98, 5648–5652 CrossRef CAS.
- C. Lee, W. Yang and R. G. Parr, Phys. Rev. B: Condens. Matter Mater. Phys., 1988, 37, 785–789 CrossRef CAS PubMed.
- P. J. Stephens, F. J. Devlin, C. F. Chabalowski and M. J. Frisch, J. Phys. Chem., 1994, 98, 11623–11627 CrossRef CAS.
- P. C. Hariharan and J. A. Pople, Theor. Chim. Acta, 1973, 28, 213–222 CrossRef CAS.
- G. A. Petersson and M. A. Al-Laham, J. Chem. Phys., 1991, 94, 6081 CrossRef CAS.
- G. A. Petersson, A. Bennett, T. G. Tensfeldt, M. A. Al-Laham, W. A. Shirley and J. Mantzaris, J. Chem. Phys., 1988, 89, 2193 CrossRef CAS.
- M. J. Frisch, G. W. Trucks, H. B. Schlegel, G. E. Scuseria, M. A. Robb, J. R. Cheeseman, G. Scalmani, V. Barone, G. A. Petersson, H. Nakatsuji, X. Li, M. Caricato, A. V. Marenich, J. Bloino, B. G. Janesko, R. Gomperts, B. Mennucci, H. P. Hratchian, J. V. Ortiz, A. F. Izmaylov, J. L. Sonnenberg, D. Williams-Young, F. Ding, F. Lipparini, F. Egidi, J. Goings, B. Peng, A. Petrone, T. Henderson, D. Ranasinghe, V. G. Zakrzewski, J. Gao, N. Rega, G. Zheng, W. Liang, M. Hada, M. Ehara, K. Toyota, R. Fukuda, J. Hasegawa, M. Ishida, T. Nakajima, Y. Honda, O. Kitao, H. Nakai, T. Vreven, K. Throssell, J. A. Jr., J. E. Peralta, F. Ogliaro, M. J. Bearpark, J. J. Heyd, E. N. Brothers, K. N. Kudin, V. N. Staroverov, T. A. Keith, R. Kobayashi, J. Normand, K. Raghavachari, A. P. Rendell, J. C. Burant, S. S. Iyengar, J. Tomasi, M. Cossi, J. M. Millam, M. Klene, C. Adamo, R. Cammi, J. W. Ochterski, R. L. Martin, K. Morokuma, O. Farkas, J. B. Foresman and D. J. Fox, Gaussian 16 Rev. C.01, 2016 Search PubMed.
- G. M. Morris, R. Huey and A. J. Olson, Curr. Protoc. Bioinf., 2008, 24, 8.14.11–18.14.40 Search PubMed.
- M. F. Sanner, J. Mol. Graphics Modell., 1999, 17, 57–61 CAS.
- T. J. Dolinsky, J. E. Nielsen, J. A. McCammon and N. A. Baker, Nucleic Acids Res., 2004, 32, W665–W667 CrossRef CAS PubMed.
- R. W. W. Hooft, C. Sander and G. Vriend, Proteins, 1996, 26, 363–376 CrossRef CAS.
- O. Trott and A. J. Olson, J. Comput. Chem., 2010, 31, 455–461 CrossRef CAS PubMed.
- A. D. MacKerell, D. Bashford, M. Bellott, R. L. Dunbrack, J. D. Evanseck, M. J. Field, S. Fischer, J. Gao, H. Guo, S. Ha, D. Joseph-McCarthy, L. Kuchnir, K. Kuczera, F. T. K. Lau, C. Mattos, S. Michnick, T. Ngo, D. T. Nguyen, B. Prodhom, W. E. Reiher, B. Roux, M. Schlenkrich, J. C. Smith, R. Stote, J. Straub, M. Watanabe, J. Wirkiewicz-Kuczera, D. Yin and M. Karplus, J. Phys. Chem. B, 1998, 102, 3586–3616 CrossRef CAS PubMed.
- J. C. Phillips, R. Braun, W. Wang, J. Gumbart, E. Tajkhorshid, E. Villa, C. Chipot, R. D. Skeel, L. Kalé and K. Schulten, J. Comput. Chem., 2005, 26, 1781–1802 CrossRef CAS PubMed.
- P. Pongpamorn, P. Watthaisong, P. Pimviriyakul, A. Jaruwat, N. Lawan, P. Chitnumsub and P. Chaiyen, ChemBioChem, 2019, 20, 3020–3031 Search PubMed.
- K. Thotsaporn, J. Sucharitakul, J. Wongratana, C. Suadee and P. Chaiyen, Biochim. Biophys. Acta, 2004, 1680, 60–65 CrossRef CAS PubMed.
- B. Sullivan, A. Z. Walton and J. D. Stewart, Enzyme Microb. Technol., 2013, 53, 70–77 CrossRef CAS PubMed.
- P. Chaiyen, C. Suadee and P. Wilairat, Eur. J. Biochem., 2001, 268, 5550–5561 Search PubMed.
- A. K. Dutta, J. Rösgen and K. Rajarathnam, Methods Mol. Biol., 2015, 1229, 315–324 CrossRef CAS PubMed.
- W. Pitsawong, P. Chenprakhon, T. Dhammaraj, D. Medhanavyn, J. Sucharitakul, C. Tongsook, W. J. H. van Berkel, P. Chaiyen and A.-F. Miller, J. Biol. Chem., 2020, 295, 3965–3981 CrossRef CAS PubMed.
- C. Tongsook, J. Sucharitakul, K. Thotsaporn and P. Chaiyen, J. Biol. Chem., 2011, 286, 44491–44502 CrossRef CAS PubMed.
- J. Sucharitakul, P. Chaiyen, B. Entsch and D. P. Ballou, J. Biol. Chem., 2006, 281, 17044–17053 CrossRef CAS PubMed.
- A. Alfieri, F. Fersini, N. Ruangchan, M. Prongjit, P. Chaiyen and A. Mattevi, Proc. Natl. Acad. Sci. U. S. A., 2007, 104, 1177–1182 CrossRef CAS PubMed.
- P. Chenprakhon, D. Trisrivirat, K. Thotsaporn, J. Sucharitakul and P. Chaiyen, Biochemistry, 2014, 53, 4084–4086 CrossRef CAS PubMed.
- K. Thotsaporn, P. Chenprakhon, J. Sucharitakul, A. Mattevi and P. Chaiyen, J. Biol. Chem., 2011, 286, 28170–28180 CrossRef CAS PubMed.
- K. Eschrich, F. J. T. van der Bolt, A. de Kok and W. J. H. van Berkel, Eur. J. Biochem., 1993, 216, 137–146 CrossRef CAS PubMed.
- D. J. Manstein, E. F. Pai, L. M. Schopfer and V. Massey, Biochemistry, 1986, 25, 6807–6816 CrossRef CAS PubMed.
- J. Wang, M. Ortiz-Maldonado, B. Entsch, V. Massey, D. Ballou and D. L. Gatti, Proc. Natl. Acad. Sci. U. S. A., 2002, 99, 608–613 CrossRef CAS PubMed.
- J. Abramson, J. Adler, J. Dunger, R. Evans, T. Green, A. Pritzel, O. Ronneberger, L. Willmore, A. J. Ballard, J. Bambrick, S. W. Bodenstein, D. A. Evans, C.-C. Hung, M. O’Neill, D. Reiman, K. Tunyasuvunakool, Z. Wu, A. Žemgulytė, E. Arvaniti, C. Beattie, O. Bertolli, A. Bridgland, A. Cherepanov, M. Congreve, A. I. Cowen-Rivers, A. Cowie, M. Figurnov, F. B. Fuchs, H. Gladman, R. Jain, Y. A. Khan, C. M. R. Low, K. Perlin, A. Potapenko, P. Savy, S. Singh, A. Stecula, A. Thillaisundaram, C. Tong, S. Yakneen, E. D. Zhong, M. Zielinski, A. Žídek, V. Bapst, P. Kohli, M. Jaderberg, D. Hassabis and J. M. Jumper, Nature, 2024, 630, 493–500 CrossRef CAS PubMed.
- P. Permsirivisarn, A. Yuenyao, N. Pramanpol, R. Charoenwattanasatien, W. Suginta, P. Chaiyen and D. Pakotiprapha, FEBS J., 2022, 289, 3217–3240 CrossRef CAS PubMed.
Footnote |
| † Electronic supplementary information (ESI) available. See DOI: https://doi.org/10.1039/d4cb00213j |
| This journal is © The Royal Society of Chemistry 2025 |