
Exploring molecule–surface interactions of urania via IR spectroscopy and density functional theory†
Hicham
Idriss
 *a,
María Andrea
Barral‡
bc,
Solange Mariel
Di Napoli‡
bc,
Gustavo E.
Murgida‡
bc,
Eric
Sauter
a,
Ana María
Llois
bc,
M. Verónica
Ganduglia-Pirovano
d,
Verónica Laura
Vildosola
*bc and
Christof
Wöll
a
*a,
María Andrea
Barral‡
bc,
Solange Mariel
Di Napoli‡
bc,
Gustavo E.
Murgida‡
bc,
Eric
Sauter
a,
Ana María
Llois
bc,
M. Verónica
Ganduglia-Pirovano
d,
Verónica Laura
Vildosola
*bc and
Christof
Wöll
a
aInstitute of Functional Interfaces (IFG), Karlsruhe Institute of Technology (KIT), Eggenstein-Leopoldshafen, Germany. E-mail: hicham.idriss@kit.edu
bDepartamento de Física de la Materia Condensada, Gerencia de Investigación y Aplicaciones, Comisión Nacional de Energía Atómica, Av. General Paz 1499, B1650KNA San Martín, Pcia. de Buenos Aires, Argentina
cInstituto de Nanociencia y Nanotecnología CNEA-CONICET, Nodo Constituyentes, Av. General Paz 1499, B1650KNA San Martín, Pcia. de Buenos Aires, Argentina. E-mail: vildosol@tandar.cnea.gov.ar
dInstituto de Catálisis y Petroleoquímica, Consejo Superior de Investigaciones Científicas (ICP-CSIC), Madrid, 28049, Spain
First published on 8th January 2025
Abstract
Within the framework of surface–adsorbate interactions relevant to chemical reactions of spent nuclear fuel, the study of actinide oxide systems remains one of the most challenging tasks at both the experimental and computational levels. Consequently, our understanding of the effect of their unique electronic configurations on surface reactions lags behind that of d-block oxides. To investigate the surface properties of this system, we present the first infrared spectroscopy analysis of carbon monoxide (CO) interaction with a monocrystalline actinide oxide, UO2(111). Using a monocrystalline form largely avoids issues related to super-stoichiometries (UO2+x) and makes the experimental data suitable for further theoretical studies. Our findings reveal that CO adsorbs molecularly and shows a pronounced blue shift of the vibrational frequency to 2160 cm−1 relative to the gas-phase value. Interpreted through density functional theory (DFT) at different levels of computation, results indicate that to accurately describe the interaction between the CO molecule and the surface, it is essential to consider hybrid functionals, the non-collinearity of uranium's local magnetic moments, and spin–orbit coupling. Moreover, an intense IR absorption band at 978 cm−1 emerged upon CO adsorption, tentatively attributed to the frequency shift of the O–U–O asymmetric stretch of the UO2(111) surface in the presence of adsorbed oxygen. This new band, together with the observation of the importance of the relativistic effects in determining the nature of the chemical bonding of CO, is poised to broaden our understanding of actinide surface reactions.
Introduction
Carbon monoxide has been used for decades as a probe for surface sites of metals1 and metal oxides.2 Its significance in the chemical industry is considerable, as it is the primary source of carbon for the synthesis of chemical compounds. The most technologically important source for CO is the so-called “steam methane reforming (SMR)”, probably the globally most important chemical process. On the other hand, uranium dioxide (UO2) is one of the most widely used fuels in nuclear fission reactors. Understanding the physicochemical properties of its surfaces is essential for several aspects related to the nuclear industry, such as the manufacture of fuel pellets, the storage of UO2 waste, corrosion, and reactivity, among others, because it is through its surfaces that it interacts with environmental species. The main goal of this work is to root the interaction between the CO molecule and the UO2 surface. Unlike what might be expected from the electronegativity difference between its two atoms (oxygen and carbon), its electronic structure has its negative charge largely centered around the carbon atom. The frontier orbitals are composed of either the C-centered 5σ orbitals (HOMO) or the O-centered π* orbitals (LUMO). This molecular electronic structure governs the interaction with the oxide substrates, with the strongest binding occurring between the carbon atom and the surface metal cations. While the CO adsorbate state on metal oxides is weaker compared to metals, primarily due to its electrostatic nature, it provides a relatively pure form of bonding. This characteristic facilitates the classification of metal oxides in regards to various properties, including their acid–base characteristics, surface cation coordination, and electronic structure. CO adsorption on oxides generally does not lead to the breaking of the carbon–oxygen bond but in some cases to weakening it, allowing for further reactions, such as in methanol synthesis from syngas. The Blyholder mechanism3,4 is one chief example of such an activation.A large fraction of the investigated interactions of CO with metal oxides is conducted where the metal cations do not have electrons in their valence band, such as those of stoichiometric transition metal oxides TiO2, CeO2.5,6 This results in a pure acid–base type interaction, where CO acts as the base and the metal cation as the acid, resulting in a typical vibrational blue shift relative to the CO gas phase (2143 cm−1). Some metal oxides, in their stoichiometric or reduced states, have electrons in their d or f orbitals, such as Cu2O, UO2 or CeO2−x (x < 0.5). Depending on the degree of interaction between the d(f) orbital and the π* of CO, this may lead to a redshift with respect to gas phase CO.7 This considerably complicates the investigation, particularly at the theoretical level, due to difficulties related to electron correlation, and in some cases to relativistic effects. In this context, UO2, being a Mott insulator, stands out because its 5f2 orbitals are components of the valence band, thus participating in bonding.
One of the most noticeable characteristics of UO2 is its tendency to accommodate excess oxygen (up to UO2.25), making it virtually impossible to assess its stoichiometry in a polycrystalline form under dynamic conditions, in the presence of adsorbates. Therefore, to obtain relevant experimental information, the use of a single crystal form is needed, as it provides an ordered and stoichiometric atomic layer. There are, however, no reported vibrational spectroscopy studies of any adsorbate on a monocrystalline uranium oxide to date. An analogy can be made, however, with organometallic compounds (where they share a common characteristic with the oxide: the absence of metal–metal bond) and gas phase chemistry on oxide clusters. The formation of a carbonyl-like UO2(CO) complex on clusters of UO2 in the gas phase has been confirmed8,9 through IR spectroscopy, with observed frequencies at 870.9 and 1893.4 cm−1. The band at 870.9 cm−1, associated with the asymmetric O–U–O vibration (influenced by the CO ligand), remained unchanged upon substituting 12CO with 13CO. The first isolated organometallic U compound with CO was reported10 in 1986, with the unambiguous structural determination made about ten years later;11 U in both compounds was in the +3 oxidation state. Most of the studies of organometallic compounds of U cations interacting with carbonyl compounds focus on U in oxidation states lower than +4, where the 5f orbitals (5fn; n ≥ 3) have shown considerable involvement.12 In line with organometallic results, CO reacted with reduced uranium cations (<+4 oxidation state) of UO2(111) single crystal13 to give U carbide upon dissociation and a complex set of chemical compounds similar to those observed in organometallic U complexes with carbonyl species.14–16 In a recent study on U-based metal–organic frameworks, MOFs, a Uδ+-CO species (δ = 6 in the ideal configuration) was observed, characterized by a frequency of 2179 cm−1.17
Because there are no CO adsorption studies on any UO2 solid surfaces using vibrational spectroscopy, information on the role (if any) of the U 5f2 electrons in the bonding of the solid with this diatomic molecule is unavailable. Consequently, it is not known where this actinide oxide stands in the grand scheme of comparative surface activity. This lack of information has been one of the motivations for the present work. Equally important, UO2 is the actinide iso-electronic analogous of CeO2, one of the most stable active oxides for redox reactions. Both Ce4+ and U4+ have the same ionic size (1 Å) and share the same crystallographic structure, allowing them to form a perfect solid solution.18 The main difference between these oxides is in the valence band, where the electron population of the f-orbitals differs: Ce4+ has a 4f0 configuration, while U4+ has a 5f2 configuration. Moreover, changes in the vibrational surface dynamics are expected upon adsorption, due to ligand (adsorbate) effects, and indeed changes in the metal cation–oxygen anion vibration stretch have been reported in zeolites upon substitution of Si4+ cations.19 Adsorbate-induced modifications have also been observed for α-Al2O3(0001) through vibrational sum frequency studies. The prominent Al3+–O2− vibration around 950 cm−1, which intensifies upon annealing in Ultra High Vacuum, largely vanishes upon hydroxylation when the surface encounters water.20
On the theoretical side, the scenario presents just as many challenges as in experiments. It is well known that relativistic effects have an important influence on the electronic and crystal structure of uranium systems, since the electrons of heavy atoms considerably increase their mass when they move at high speed near the nucleus, giving rise to a contraction of their Bohr radii.21 On the other hand, the 5f orbitals are rather extended, yet sufficiently localized for local electronic correlations to be important. Besides, it has been demonstrated that the ground state of UO2 presents a non-collinear antiferromagnetic order22–24 called 3k, which is stabilized by relativistic effects through a strong spin–orbit coupling. Furthermore, at temperatures greater than 30.8 K, the compound is paramagnetic.25
The significant influence of the chemical environment on the properties of uranium oxide requires calculations that realistically describe the different compounds. The complexity of the electronic structure, with strong correlations, spatially extended orbitals, relativistic effects, and magnetic properties, results in an enormous challenge for computational simulations. These challenges can be tackled within the framework of density functional theory (DFT).
In this work, we have prepared a stoichiometric UO2(111) surface and studied its interaction with CO by p- and s-polarized infrared reflection absorption spectroscopy in order to determine its adsorption characteristics. In parallel, we have applied non-collinear DFT+U and HSE06 methods to validate the experimental finding and provide further explanation on the mode of interaction. The results from this work are poised to extend our knowledge of the early transition metal oxides to the late ones, specifically the actinides in this case.
Methodology
Experimental (surface preparation and methodology)
The UO2(111) single crystal (ca. 1 mm × 3 mm × 8 mm) was polished using a diamond paste (Buehler Germany) starting with Meta Di II 6 micrometer down to 0.25 micrometer, followed by using a diamond suspension (Meta Di supreme) of 50 nm size. This was then followed by cleaning in an ultrasound bath using concentrated acetic acid at 60 °C for 30-minute cycles to remove possible inorganic residuals, then in ethanol for 30 minutes to remove possible organic contamination. XRD (X-ray diffraction) was conducted using a Bruker D8 A25 with Cu Kα excitation. The crystal exhibited an exclusive diffraction line corresponding to the (111) orientation, with a coherent scattering domain size of 70 nm.To conduct the experiments, the crystal was mounted on a tantalum plate, which could be resistively heated. The thermocouple was positioned between the crystal and the plate. Potential deviations from the actual UO2 crystal temperature are expected to be small since the measurements are performed isothermally. The experimental procedure involved successive heating cycles above 1000 K, where the crystal was kept hot for about 30 minutes at a pressure of <10−8 torr. These were followed by Ar–ion sputtering for about 20 minutes each time (at a pressure of 3 × 10⁻⁵ torr, 2 kV beam voltage, and 9 mA emission current), first hot at about 1000 K and then cold. The pronounced luminescence observed (as shown in Fig. S1, ESI†) is primarily due to U 5f–O 2p and U 6d–U 5f decays. The final treatment was thermal also above 1000 K for about an hour to obtain an ordered (111) termination. The surface structure was checked by examining the quality of the LEED pattern (low energy electron diffraction) using a Vacuum MicroEngineering LEED model LPS300-D with microchannelplate model MCPS01/02. Surface stoichiometry and cleanliness were assessed by X-ray photoelectron spectroscopy using an Al Kα (300 W) X-ray source (Prevac) and a photoelectron analyzer VG Scienta R4000. Spectra were referenced to the XPS O 1s binding energy of 530.5 eV, which is typical of a clean and stoichiometric UO2 surface.
The infrared reflection absorption spectroscopy (IRRAS) measurements were recorded using a modified Bruker Vertex 80v with a PREVAC (Rogów, Poland) chamber, also connected to the ultrahigh vacuum system. The beam incidence on the crystal was 80°. The pressure during measurements was below 1 × 10⁻¹⁰ torr, unless otherwise stated. CO dosing was conducted using a dosing line made of 316 stainless steel ¼ inch pipes that was pumped with a Turbo molecular pump at a base pressure of ca. 10−7 torr. The line was baked out for ca. 1 hour at 150 °C before dosing and then filled with CO at ca. 5 bar. Dosing was performed via a leak valve, dosing pressures (exposures) were recorded in the IR chamber with a hot cathode pressure gauge. Both s- and p-polarized light were monitored. The angle with respect to the crystal surface was 174° for p-polarized light and 84° for s-polarized light. Two sources of ultra-pure CO were used (Linde); 12CO and 13CO. Data acquisition was conducted by measuring four spectra, each comprising 256 scans, which were then averaged. Spectra displayed are subtracted from the clean surface. Cooling was conducted using liquid He. Typically, it took about two hours to cool the crystal from 300 K to 75 K. For spectra recorded as a function of prior heating, the crystal was heated at the desired temperatures (between ca. 70 and 120 K) at a constant rate of ca. 0.2 K min−1, then cooled down to the initial temperature (ca. 70 K) before data collection. To extract the experimental activation energy, the CO change of coverage with temperature, θT, was fitted. Considering that the rate is expressed as k0θn![[thin space (1/6-em)]](https://www.rsc.org/images/entities/char_2009.gif) exp(−Ea/kBT), and noting that d(rate)/dT = 0 at the peak maximum, the following common equation is obtained26
exp(−Ea/kBT), and noting that d(rate)/dT = 0 at the peak maximum, the following common equation is obtained26
 | (1) |
Computation
First-principles DFT calculations were performed within the framework of the projector augmented wave (PAW) method, as implemented in the Vienna ab initio package (VASP).27,28 The valence electrons considered in the computations were 14 for U (6s26p65f27s26d2), 6 for O (2s22p4), and 4 for C (2s22p2). The generalized gradient approximation (GGA) with the PBE (Perdew–Burke–Ernzerhof) functional was used.29 Two distinct methodologies were considered to better describe the localized U-f orbitals: the DFT+U approach, which introduced an effective Hubbard U-like term of 4.0 eV specifically for the U 5f states, following the Dudarev implementation,30 and the utilization of a hybrid functional integrating a fraction of non-local Hartree–Fock exchange interactions through the Heyd–Scuseria–Ernzerhof functional ((HSE06) version [1]31). This hybrid functional was chosen to mitigate the self-interaction errors inherent of local or semilocal functionals, providing a more accurate description of the electronic structure. With respect to the effective U, the value of 4.0 eV gives rise to a 5f–5f gap of 2 eV in the simulated slab (see Fig. S2c, ESI†), in good agreement with the experimental bulk value.32 The 5f–5f electronic gap is related to the degree of the spatial localization of the wavefunction, that in turn will affect the chemical bonding with the adsorbed molecule and consequently its vibration frequency.The UO2(111) surface was modelled using a 1 × 1 surface unit cell and three O–U–O tri-layers stacked along the z-axis, utilizing the calculated UO2 bulk equilibrium lattice constant (Table 1). During geometry optimization, two tri-layers were allowed to relax, while the last tri-layer was held fixed at its bulk position. The relaxation process was performed for each calculation mode until the forces on each ion were less than 0.01 eV Å−1. A vacuum spacer of around 15 Å along the perpendicular z-axis was used to prevent self-interactions through periodic boundary conditions. All the DFT calculations were performed using a 450 eV energy cutoff in the plane waves basis. To evaluate integrals within the Brillouin zone (BZ), a Monkhorst–Pack k-point grid centered at the Γ-point was used, with a 6 × 6 × 1 grid for DFT+U and a 3 × 3 × 1 grid for HSE06, respectively.
| Case | Magnetic method | a (Å) | d(C–O) (pm) | ΔdCO (pm) | d(U4+–C) (pm) | ν (cm−1) | Δν (cm−1) | −E a (meV) |
|---|---|---|---|---|---|---|---|---|
| a These calculations exclude dipolar corrections. Including them gives similar conclusions, with frequency shifts of −8 and −2 cm−1 for the tilted and non-tilted CL-FM cases, respectively. NCL calculations became unstable with these corrections.CL-FM: collinear ferromagnetic; NCL: non-collinear; SOC: spin–orbit coupling; tilt.: tilted configuration. Bond length (d(C–O)) of adsorbed CO, its difference with respect to the value in its gas phase (ΔdCO = d(C–O)adsorbed − d(C–O)gas), bond distance between C of CO and surface U4+ cation (d(C–U)), scaled CO stretching vibrational frequency (ν = λνcalc(CO)adsorbed), and frequency shift (Δν = ν – νgas) and the adsorption energy Ea, obtained with the different functionals and magnetic formalisms. The scaling factor is λ = (ν(CO)gas)/νcalc(COgas), with ν(COgas) = 2143 cm−1 and νcalc(COgas) = 2126 cm−1 (DFT+U) and 2233 cm−1 (HSE06). The C–O calculated bond length d(COgas) is 114.34 pm (DFT+U) and 113.18 pm (HSE06). Ea = [ECOads+slab − (ECOg + Eslab)]. | ||||||||
| DFT+U Tilt.a | CL-FM | 5.538 | 114.53 | 0.19 | 276.17 | 2132 | −11 | 383 |
| DFT+Ua | CL-FM | 5.538 | 114.45 | 0.09 | 273.43 | 2140 | −3 | 371 |
| DFT+Ua | NCL | 5.538 | 114.39 | 0.05 | 271.15 | 2142 | −1 | 289 |
| HSE | CL-FM | 5.461 | 113.24 | 0.06 | 269.83 | 2147 | +3 | 332 |
| HSE | NCL∼FM | 5.461 | 113.17 | −0.01 | 276.86 | 2155 | +12 | 313 |
| HSE | NCL | 5.461 | 113.17 | −0.01 | 275.89 | 2154 | +11 | 315 |
| HSE-SOC | NCL | 5.453 | 113.14 | −0.04 | 284.17 | 2157 | +14 | 302 |
A k-point convergence test was conducted for 3 × 3 × 1, 4 × 4 × 1, 5 × 5 × 1 and 6 × 6 × 1 grids within the DFT+U framework and for 3 × 3 × 1 and 4 × 4 × 1 for HSE. The results indicate that the CO vibrational frequency is already converged within 0.2 cm−1 with the 3 × 3 × 1 k-point sampling in both tests. It is worth mentioning that HSE calculations can be extremely computationally demanding, sometimes requiring up to two orders of magnitude more resources than DFT+U. Charge density differences were obtained using the VESTA33 and VASPKIT34 codes.
The CO adsorption was modelled with one CO molecule initially located on top of the U-atom (full coverage). During the relaxation process, the two outermost UO2 tri-layers, as well as the CO position, were allowed to relax according to the same aforementioned criteria. The vibration frequencies were obtained from the second-order derivatives of the total energy with respect to the position of the ions using a finite differences approach. The two outermost trilayers and the CO molecule could vibrate. Due to the lack of inversion symmetry, the dipole correction, as implemented in VASP, was used. Additionally, the van der Waals correction within the method of Becke–Johnson damping function (DFT-D3)35 was included to provide a more accurate description of the CO adsorption on UO2.
Due to the complex magnetic structure present in bulk UO2, two different magnetic calculation modes were explored: collinear ferromagnetic (CL-FM) and non-collinear (NCL) calculations. In collinear calculations, magnetic moments are assumed to align either parallel or antiparallel to a single, fixed quantization axis, usually chosen as the z-axis. Conversely, non-collinear computations allow magnetic moments to point in any direction (mi = (mix, miy, miz)), permitting arbitrary angles between them, and the electronic minimization considers the full 2 × 2 spin density matrix.36 In the HSE06-NCL method, two different magnetic configurations were performed: one where the U magnetic moments are aligned nearly along the same quantization axis (NCL ∼ FM), and another one where these moments end up pointing in different directions.
As mentioned in the introduction, relativistic effects significantly influence the electronic and crystal structure of uranium systems. Therefore, spin–orbit coupling (SOC) was also considered in the calculations. When SOC is switched on, the magnetic calculation mode automatically sets the NCL framework.37 The relaxed lattice constants of bulk UO2 were calculated specifically for the collinear DFT+U, collinear HSE, and non-collinear HSE with SOC cases (Table 1). The approach aims to address the sole effect of introducing non-collinearity.
Results and discussion
The UO2(111) surface is composed of O atoms arranged in a hexagonal pattern, with a non-relaxed O to O distance of 3.866 Å in the p(1 × 1) phase. O atoms in the outermost atomic layer of the (111) surface are three-fold coordinated, whereas they are four-fold coordinated in the bulk fluorite structure. The second layer is composed of U cations arranged at the same spacing, where they are seven-fold coordinated (compared to eight-fold coordinated in the bulk fluorite structure), with a distance of 2.367 Å to the O atoms in the bulk-truncated structure. The third layer consists of O atoms at the same O–O spacing, all of which are four-fold coordinated. Fig. 1A presents the LEED pattern at two different primary energies. The sharp hexagonal pattern is indicative of a good surface crystallinity, consistent with previously reported patterns.38Fig. 1B presents the XPS U 4f of the UO2(111) single crystal obtained with a non-monochromated system. The main peaks at binding energies of 380.0 and 391.0 eV are due to U 4f7/2 and U 4f5/2 spin–orbits of U cations, respectively. Assessment of the oxidation state is based on several factors: (i) the binding energy of these lines, (ii) the presence of a satellite peak 6.9 eV after each main line, and (iii) the ratio of the satellite to the main peak. All these factors indicate a stoichiometric surface in which U cations are in the +4 oxidation state. XPS of the C 1s region was acquired and no adventitious carbon was found. The XPS O 1s signal (Fig. 1C) shows the typical lattice oxygen signature of an oxide, with negligible asymmetry at the high binding energy side, indicative of weak surface hydroxyls contribution under the analyzed conditions (300 K, ca. 1 × 10⁻¹⁰ torr). The XPS valence band (Fig. 1D) shows the expected pronounced peak of U 5f, with a peak ratio (U 5f/O 2p) similar to that obtained for stoichiometric39 UO2. XPS spectra of U 4d and U 5d, while less studied, are presented for reference and to complement the characterization. The satellite structures above the main lines of U 4d5/2,3/2 and U 5d5/2,3/2 are observed at approximately 7 eV, consistent with seminal works of Tobin et al.40 and Allen et al.41 | ||
| Fig. 1 Electron diffraction and photoelectron spectroscopy of UO2(111) single crystal. (A) LEED at 51 and 115 eV primary excitation (Ep); the sharp hexagonal spots at the given energy are in line with previous work (ref. 38) and indicate a (111) termination. (B) XPS U 4f. (C) XPS O 1s. (D) XPS valence band (U 5f, O 2p/U 6d). (E) XPS U 4d. (F) XPS U 5d. | ||
Based on the above results, the crystal is found to be clean, stoichiometric or “near stoichiometric”, and with a well-defined (111) surface termination.
Fig. 2 presents the 12CO adsorption under p- and s-polarized lights. s-Polarized light showed no signal for all collected spectra and will not be mentioned further. For simplicity, since all spectra are collected with p-polarized light, this attribute will be omitted too. All spectra shown here are difference spectra obtained by subtraction of a spectrum recorded prior to adsorption. The spectra show a clear band at 2160 cm−1, which can be assigned to the ν-CO on U4+ cations by analogy to many other ν-CO adsorptions on Ce4+ of CeO2(111) and on Ti4+ of TiO2(110) for example; see Table S1 (ESI†). Under ca. 10−9 mbar of CO pressure, another peak appears at 2144 cm−1 (Fig. 2D), this peak disappears once CO is pumped down to <10−10 mbar at the same temperature. Equally important, this peak is not seen when the temperature is increased to 80 K, even at 10−8 mbar (not shown). In addition, an unexpected derivative-like feature centered at 978 cm−1 is observed, which tracked the 2160 cm−1 peak in its appearance, trend, and disappearance. The unusual line-shape of the 978 cm−1 feature might be indicative of a polarization-dependent splitting of adsorbate-vibrations with a sizeable transition dipole moment.42 However, this explanation can be ruled out from studies using an isotope of CO (13CO). Fig. 3 presents the coverage effect upon exposing the clean surface to 13CO at 73 K. The complete spectra in the 800–3000 cm−1 range are shown in Fig. S3 (ESI†).
 | ||
| Fig. 2 Difference IRRAS spectra obtained upon adsorption of 12CO on UO2(111) single crystal at 74.4 K at near-saturation. The top spectrum in (A) is that of p-polarized signal at near saturation, 10 points smoothed. The bottom spectrum in (A) is the signal obtained with s-polarized light where no peaks are observed. (B) and (C) are for the magnified range related to νCO and the 978 cm−1 peaks, respectively. (D) and (E) Difference IRRAS spectra obtained upon adsorption of 12CO on UO2(111) single crystal at 74.4 K at 0.2 L of CO, bottom spectrum, and under 1.6 × 10⁻⁹ mbar (middle spectrum), and 3.0 × 10⁻⁹ mbar of CO (top spectrum), respectively. | ||
 | ||
| Fig. 3 Difference IRRAS spectra obtained after exposure of the clean UO2(111) single crystal at 73 K at the indicated Langmuir exposure (one Langmuir = 10−6 torr s). Effect of 13CO exposure on the surface uptake of UO2(111) single crystal as tracked by the ν13CO peak at 2123 cm−1 (A) and 978 cm−1 peak (B). Note that both peaks saturate at the same exposure. | ||
For 13CO, a peak appears at 2123 cm−1 and did not shift with increasing coverage at 73 K (Fig. 3A). It corresponds to the vibration of 13CO, with a frequency ratio 2160/2123 close to the expected value due to the isotope effect (of 1.017 compared to the expected 1.02). Interestingly, the derivative-like feature occurred at the same frequency, 978 cm−1 (Fig. 3B), as observed for the 12CO isotopologue. This indicates that the 978 cm−1 feature is not related to the vibration of a carbon containing species. Additionally, a shoulder appears at 2100 cm−1, which seems to increase with increasing exposure, as seen in the difference spectra at 0.2 L and 1.2 L exposures. The intensity of the 978 cm−1 feature is again pronounced and closely follows that of the νCO. The 2100 cm−1 peak is the same one observed using 12CO with a frequency equal 2144 cm−1. Also, it responded to CO pressure similarly to the 12CO experiment (not shown). This may be related to adsorption of CO on top of unavoidable surface hydroxyls, or adjacent to them, or it can be at the edge of multilayers of CO. While CO multilayers are typically seen at lower temperatures, some studies have shown their formation at 60 K on (H,Na)-Y zeolite43 and up to 80 K on amorphous solid water.44 Multiplayers of CO give rise to multiple νCO peaks (2176, 2173, 2161, 2141, and 2135 cm−1 on (H,Na)-Y zeolite) with complex shapes depending on CO pressure deserving a study of its own merit on UO2, which is not part of the objectives of this work.
The computed areas of the νCO and the 978 cm−1 peaks as a function of exposure are presented in Fig. 3C and D. The rise and saturation of the areas of the two peaks are identical.
Fig. 4 presents CO adsorption over the UO2(111) single crystal at 73 K. Upon heating to the indicated temperatures and then cooling back to 73 K to collect the spectra, a gradual decrease in intensity is seen for both the νCO peak and the 978 cm−1 feature. By 125 K no peaks are detected and this is taken as evidence of complete CO desorption. To further investigate, Fig. 5(A) and (B) presents the zoom-in on the respective frequency range of both features. Focusing on the νCO, the small peak at 2100 cm−1 disappears upon heating to 80 K, accompanied by a slight decrease in the peak at 2123 cm−1. Additionally, a change in the νCO frequency is observed. At 112 K, the CO wavenumber increases to 2133 cm−1 (about 10 cm−1). Considering that the νCO is blue-shifted with respect to the gas phase CO at surface saturation by about 15 cm−1 due to the strengthening of the CO triple bond, the further shift with decreasing coverage may indicate additional strengthening. Given that the distance between two U cations of 3.86 Å is large enough to prevent lateral interaction, the further stabilization of CO may therefore be due to increased movement of the U4+ cation away from the C of CO (larger static effect) and not solely to a decrease in coverage. Examining the 978 cm−1 feature, no observable shift is noted with decreasing CO coverage (upon heating the surface). Therefore, regarding this peak, it can be stated that its frequency does not shift with the carbon isotope of CO nor with CO coverage, yet its intensity tracks that of νCO peak intensity.
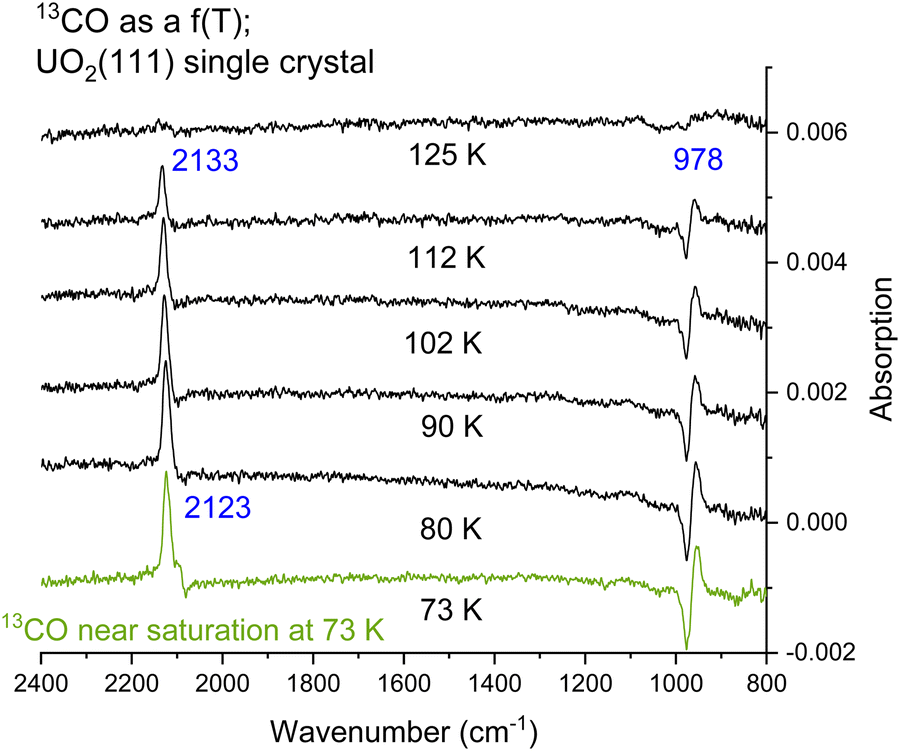 | ||
| Fig. 4 Difference IRRAS spectra collected after the surface has been exposed to 0.2 L of CO (near saturation) at 73 K. This is followed by flashing the crystal at a rate of 0.1–0.2 K s−1 to the indicated temperatures then cooled back to 73 K for further spectral collection. | ||
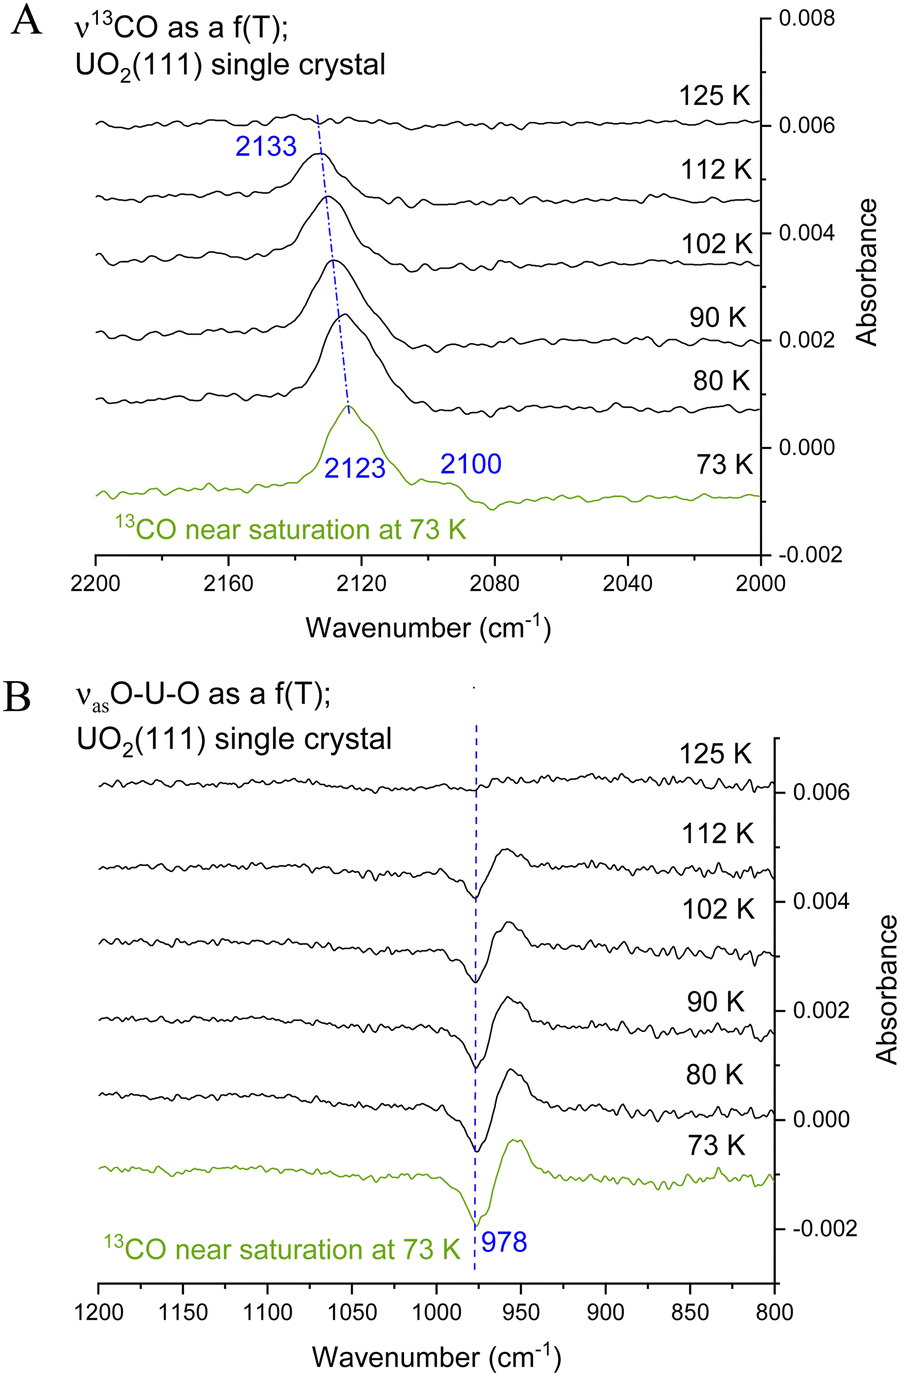 | ||
| Fig. 5 (A) Difference IRRAS spectra for ν13CO at near saturation (0.2 L exposure) on UO2(111) single crystal at 73 K followed by flashing the crystal at a rate of 0.1–0.2 K s−1 to the indicated temperature then cooled to 73 K for further collection. (B) The low frequency region (1200–800 cm−1), note the absence of change in the wavenumber with temperature. | ||
The data from Fig. 5 were then quantitatively analyzed (Fig. S4 and S5, ESI†), and shown in Fig. 6. The decay of both signals is virtually identical. The profile was then fitted using a Langmuir-type function (Y = 1/(a + bxc−1) where a, b, and c are constants), yielding an R2 of about 0.94. Since this represents a change of coverage, θT, with temperature, its differential would be the desorption rate with respect to temperature, rate = dθ/dT, as presented in Fig. 6B. The ramping rate was about 0.2 K s−1 (see the Methodology section for more details). The best numerical values obtained were k0 = 1 × 10⁻¹³ s−1 and Ea = 28 kJ mol−1 (295 meV). Alternatively, a simpler method, also valid,26 is to take the maximum desorption peak and multiply it by 30kB. Using this approach, Ea was calculated to be 26 kJ mol−1 (270 meV).
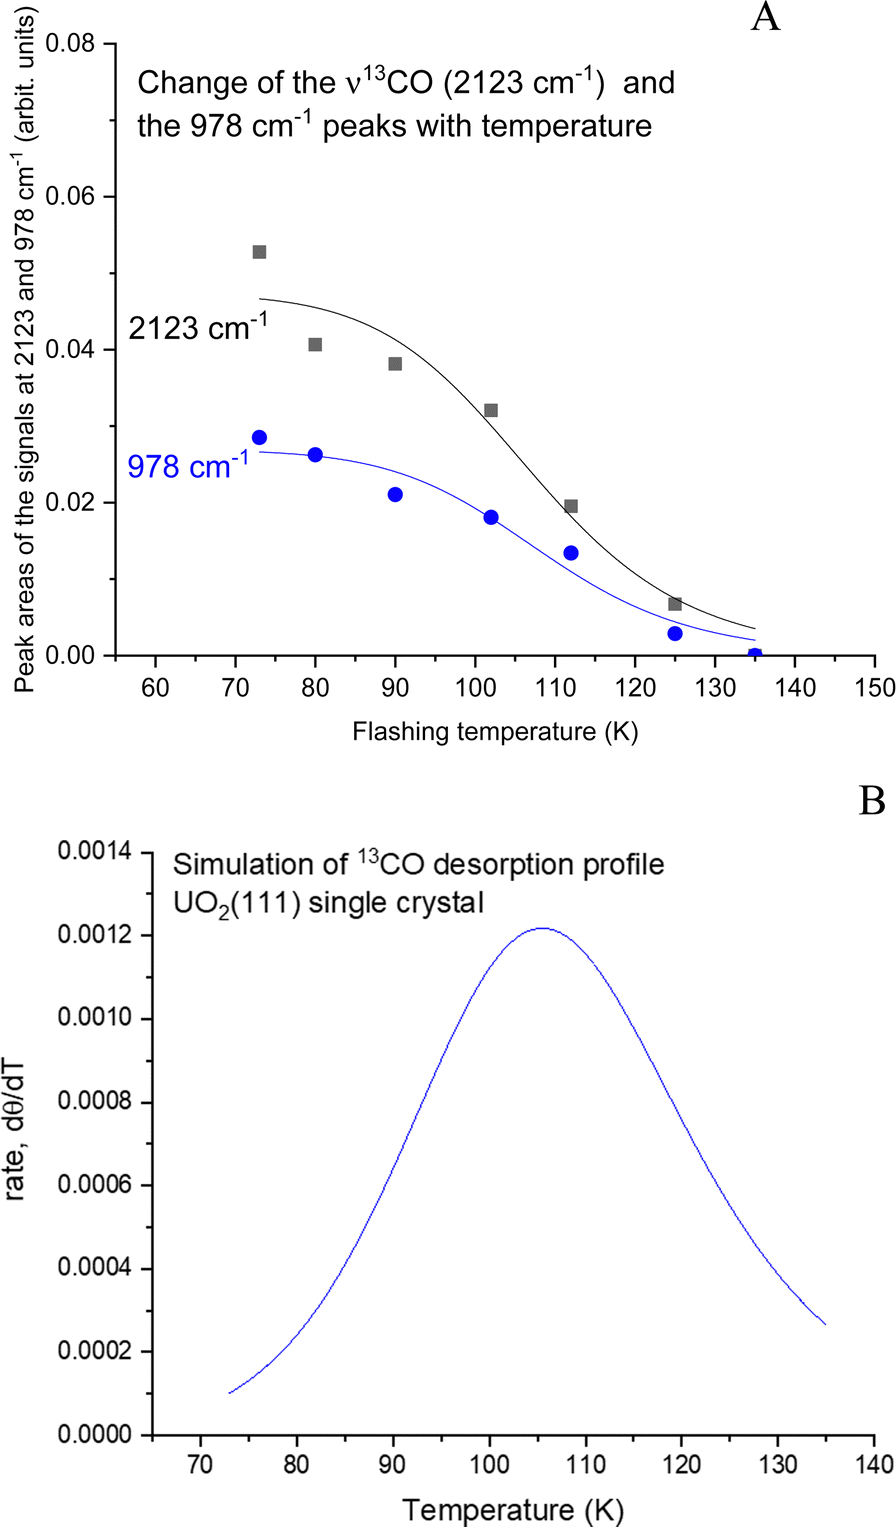 | ||
| Fig. 6 (A) Changes in the peak areas of the signals at 2123 and 978 cm−1 with temperature. The peak area of the signal at 978 cm−1 is the sum of both the positive and negative peaks. The fitting is a Langmuir-type function (Y = 1/(a + bxc−1)) with a, b, and c being constants. (B) Derivative of the fitted function in (A) representing the desorption rate of CO from UO2(111) single crystal. The maximum temperature of 105 K gives a desorption energy of 26–28 kJ mol−1 (270–290 meV). | ||
In the following, we present the DFT results regarding the stretching vibration frequency of the 12CO molecule adsorbed on UO2(111). Specifically, we compare the shift of this frequency relative to the frequency of the isolated molecule in the gas phase. For the gas-phase calculation, the molecule is simulated in a large orthorhombic box of 8.1 Å × 8.0 Å × 8.2 Å. Experimentally, in this work, the frequency was determined to be 2160 cm−1 for the adsorbed molecule, presenting a +17 cm−1 blue shift with respect to that of gas phase CO. Table 1 shows the computational results, and Fig. 7 depicts the corresponding charge density difference of the adsorbed CO system with respect to the separate components, namely, the clean UO2(111) surface and the CO isolated molecule, obtained using the DFT+U and HSE06 hybrid methods.
 | ||
| Fig. 7 Charge density difference calculated for all cases listed in Table 1. Yellow (light blue) isosurfaces correspond to positive (negative) differences. The isosurface value used in all cases is 0.0034 e bohr−3. Brown spheres: carbon atom; red spheres: oxygen atom. Note the absence of charge accumulation around the carbon atom in the HSE-NCL and HSE-NCL-SOC cases. | ||
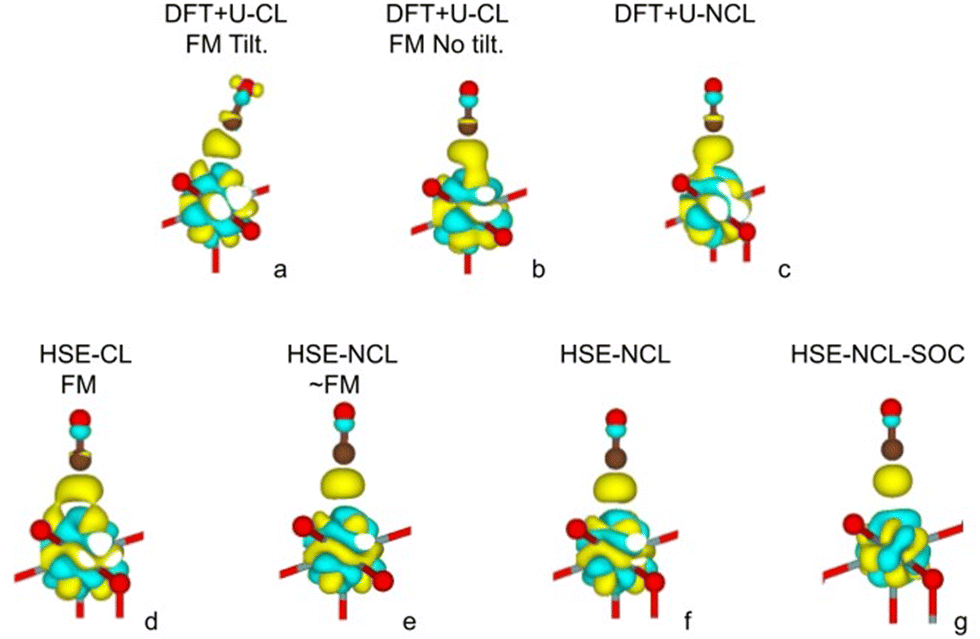
The more energetically stable configuration obtained with DFT+U in the collinear magnetic formalism consists of a tilted adsorbed CO molecule on top of a surface U4+ cation (see Fig. 7a), resulting in a large frequency redshift of −11 cm−1 (see DFT+U Tilt case in Table 1). Another nearly degenerate configuration (higher in energy by 11 meV) is observed, which is not tilted (Fig. 7b). In this case, the shift with respect to the CO gas phase is smaller (−3 cm−1) but still red-shifted (see DFT+U case in Table 1). Previous research has highlighted the challenge of accurately describing the metal–oxide CO-bound system within the DFT+U framework compared to the hybrid HSE06 method, as demonstrated in the case of CO adsorbed on CeO2.6 Specifically, the failure of the DFT+U method to provide the correct frequency shift for CO adsorbed on CeO2 surfaces was addressed, attributing it, among other factors, to the predicted distance between the metal cation and the carbon atom of CO, d(Ce–C). Within DFT+U, this distance is underestimated, leading to stronger σ-donation and π-backdonation type interactions between the molecule and the surface. As a result of the former, a shortening of the C–O bond is expected due to bond depopulation, whereas as result of the latter, a lengthening due to bond population. The overall change in the C–O bond upon adsorption, ΔdCO, is the result of synergistic charge transfer effects, resulting in ΔdCO > 0 with DFT+U. Consequently, the frequency shift for CO adsorbed on CeO2 is not correctly predicted with DFT+U. Moreover, it has also been shown that HSE06 provides a good agreement with the experimental frequency of adsorbed CO on CeO2. In this case, the calculated d(Ce–C) distances are longer than those obtained with DFT+U and ΔdCO < 0, resulting in blue-shifted frequencies upon adsorption.
Similar conclusions can be stated for the uranium system regarding the comparison between DFT+U and HSE06, where substantial spurious σ-donation is obtained for the DFT+U calculations (see Fig. 7a, b, and Fig. S2, ESI†). However, the more complex electronic structure in uranium demands a deeper analysis that includes the non-collinear formalism for the magnetic moments and relativistic effects. For the perpendicular CO adsorbed on UO2(111) using DFT+U, we compared the collinear ferromagnetic (CL-FM) state to the non-collinear (NCL) state and observed that the frequency shift improves slightly if non-collinearity is considered (Table 1). However, it still presents a red shift of 1 cm−1. We recall that within the DFT+U method, only local electron–electron interaction corrections of the 5f U states are considered, while the rest of the orbitals, including those of the CO molecule, are treated at the PBE level.
When analyzing the HSE06 calculations for the collinear formalism, it can be seen that the frequency is now blue-shifted, similar to the experimentally observed shift of +17 cm−1, but with a much smaller margin of +3 cm−1 (see HSE CL-FM case in Table 1). The improved treatment of the self-interaction within HSE06 (for both the CO molecule and the substrate) is not sufficient, as it is for CeO2, to accurately describe the adsorption process on the uranium system. For uranium a complete description of the directional magnetic degrees of freedom is necessary. Indeed, within the non-collinear formalism, the frequency shift result improves considerably to around +11 cm−1 (see HSE NCL ∼ FM and NCL cases in Table 1). In the collinear formalism, more allowed hybridization channels induce an over-delocalization of the 5f wave function. This is evident when comparing the charge density cloud around the U ion in Fig. 7d and e. The more delocalized wave function (in the CL method) presents weaker electron–electron interactions, resulting in a smaller energy band gap (see the density of states in Fig. 8a compared to Fig. 8b and c). Moreover, in the CL-FM case, the CO molecule is closer to the surface than in the NCL cases and the ΔdCO is longer than in the NCL cases (see Table 1). This closer proximity leads to stronger σ-donation and π-backdonation interactions, which further intensifies the charge transfer between the CO molecule and the uranium surface, thereby affecting the bond length, adsorption energy, and frequency shift observed in the adsorption process (see Table 1 and Fig. 7d–f).
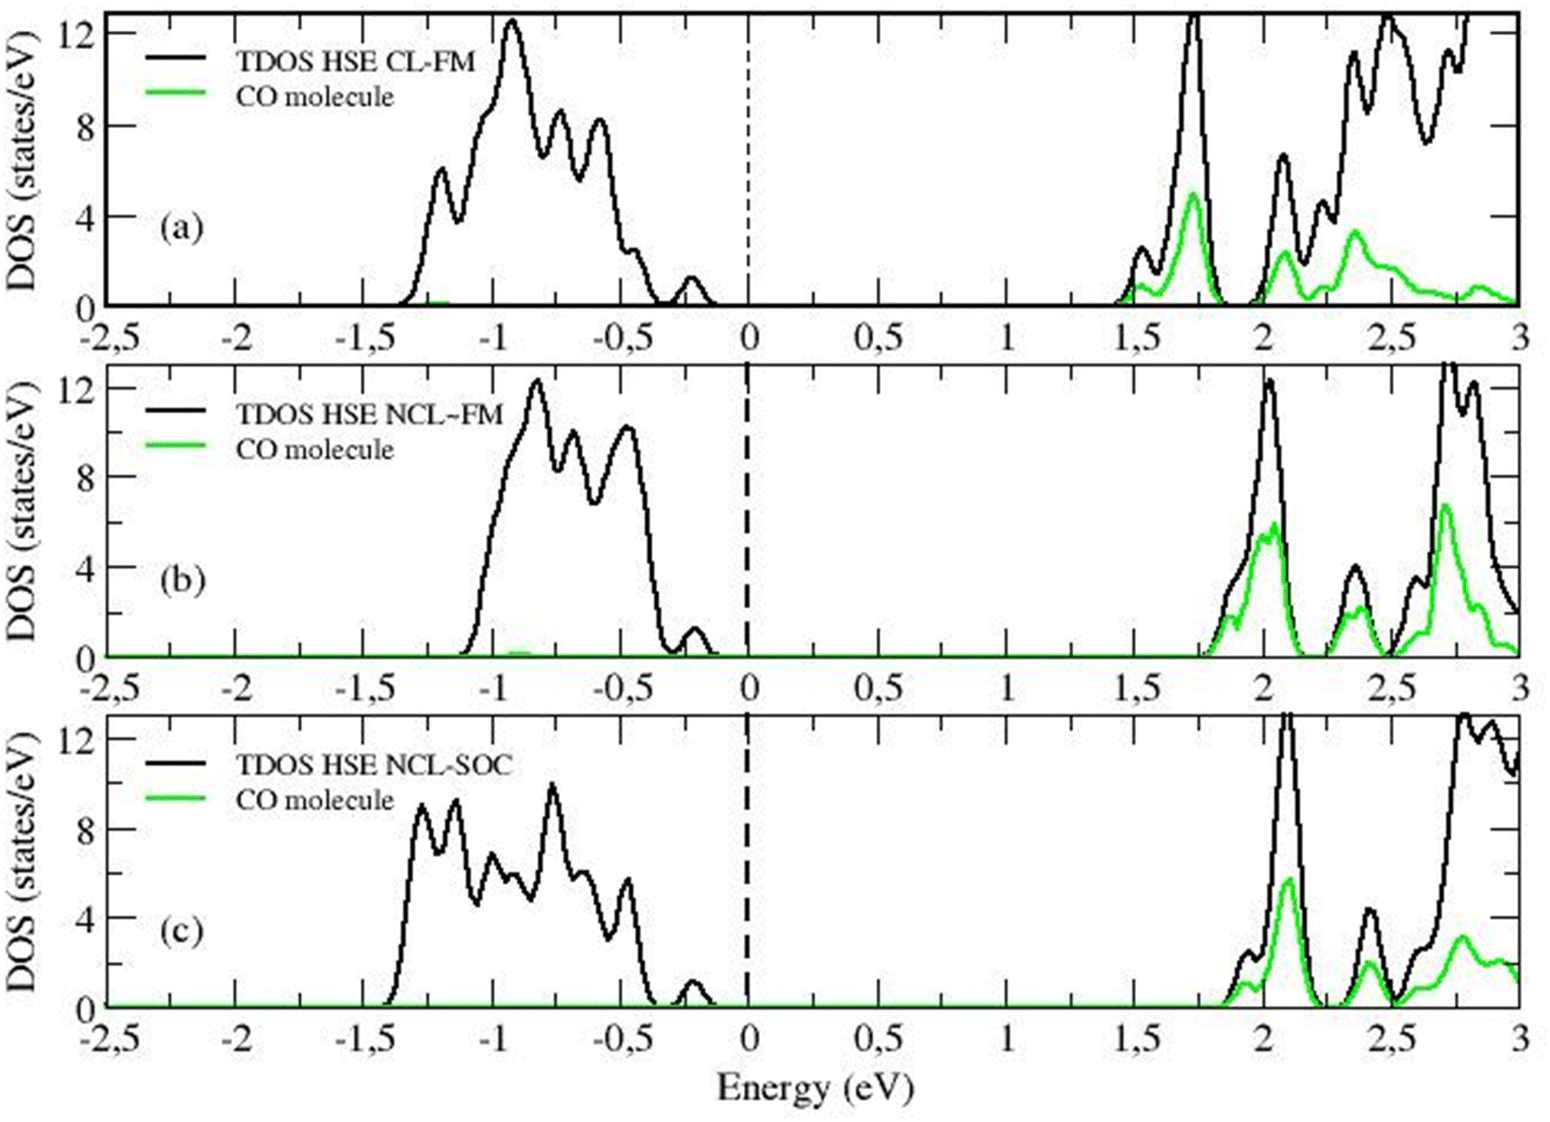 | ||
| Fig. 8 The total density of state (TDOS, black line) of the CO adsorbed-UO2(111) system as computed by HSE06 together with the projected density of state on the molecular CO orbitals (green). (a) Collinear FM (HSE CL-FM) case, (b) non-collinear nearly FM (HSE NCL ∼ FM) case, and (c) non-collinear with spin–orbit coupling (HSE NCL-SOC) case. | ||
It is noteworthy that the specific magnetic arrangement of the U ions has minimal impact on the CO stretching frequency, as evidenced by comparing the HSE NCL ∼ FM and NCL cases in Table 1, Fig. 9 and Fig. S6 (ESI†). This finding holds particular relevance given that experiments are conducted at T > 70 K, a range where the UO2 system displays paramagnetic behavior. The observed weak sensitivity to the magnetic order in our calculations provides confidence in extrapolating the 0 K DFT results to the paramagnetic phase.
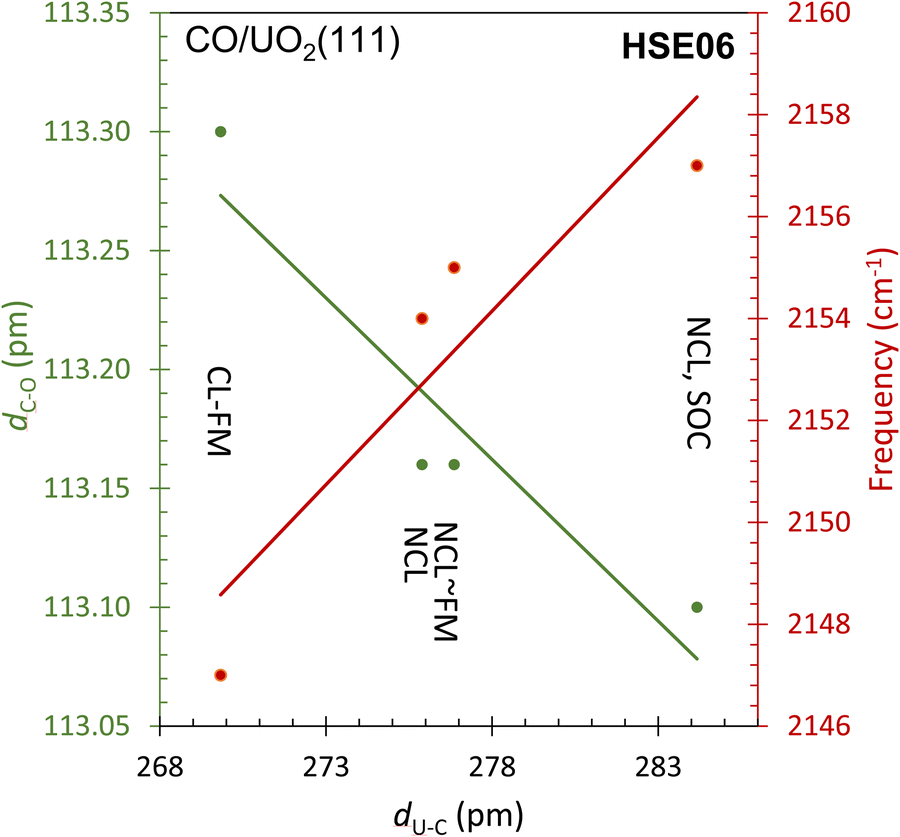 | ||
| Fig. 9 A plot of the C to O bond distance (dC–O) (left y-axis) and its frequency (right y-axis) as a function of the bond distance with the surface (dU–C) as computed by HSE06 using the indicated methods. CL-FM: collinear ferromagnetic; NCL: non-collinear; SOC: spin–orbit coupling. The experimental νCO frequency is equal to 2160 cm−1. | ||
Finally, an even better agreement with the experimental CO stretching frequency is obtained within HSE06 considering both the non-collinear formalism to describe the local magnetic moment of uranium ions and the spin–orbit coupling. With the spin–orbit coupling activated, the 5f wave function contracts, the electronic cloud shrinks with respect to all other cases (see Fig. 7g). Consequently, the molecule moves further away from the surface, and its bond length shortens (see Table 1). At this level of theory, the adsorption energy is found to be equal to 302 meV, in agreement with experiment, with U–C distance measuring 284 pm and the C–O distance 113 pm (Table 1). The ν12CO frequency is calculated to be 2157 cm−1, which closely approaches the experimental value of 2160 cm−1. Fig. 9 summarizes the data, illustrating how the inclusion of non-collinearity and spin–orbit coupling within HSE has markedly enhanced predictive accuracy. The refinements lead to an elongated C–U bond distance and a shortened C–O bond, ultimately resulting in a more precise prediction of the νCO stretch, which aligns closely with experimental findings.
Returning to the experimental finding and focusing on the feature at 978 cm−1 the following observations emerge. First, the feature increases with exposure to CO and then, like that of νCO peak, remains unchanged at 73 K upon reaching surface saturation (Fig. 3). Second, the feature does not shift with the CO isotope, maintaining its position at 978 cm−1 for both 13CO and 12CO adsorption (Fig. 2 and 3). Third, the frequency of this feature remains constant even when the surface is heated to higher temperatures (up to 125 K), while the νCO peak shifts in frequency. It quantitively tracks, however, the decrease of the νCO peak intensity (Fig. 5A and B).
We attribute the feature with its derivative-like line shape to the excitation of an asymmetric stretch of substrate U–O–U units. Upon adsorption of CO, this vibration undergoes a slight shift, resulting in the appearance of a derivative-like feature in the difference spectra (Fig. 2–5 and Fig. S7, ESI†).
Vibration data of solid UO2 and clusters are available.45,46 In particular, changes in the asymmetric stretch (the symmetric stretch is IR inactive) of O–U–O of UO2 have been studied before.47 The interaction of CO with UO2 molecules has been studied in the gas phase by infrared spectroscopy and computational methods.48,49 In addition to νCO, a peak at 900–1000 cm−1, depending on the coordination number of the uranium cation (939 cm−1 for UO2(CO)7, and 982 cm−1 for UO4(CO)6), has been observed and attributed to the asymmetric stretch of the O–U–O bond. This peak has also been observed at 1015 cm−1 for UO4Ar2.50 Changes in the vibrational modes of the inorganic solid upon molecular adsorption are not uncommon. CO adsorption-induced surface relaxation is a well-known phenomenon.51 However, subtle changes also occur upon adsorption and have been particularly noted on zeolites,52 upon partial substitution of Si4+ by, for example, Ti4+ cations, the latter act as isolated centers. When isolated Ti4+ cations sites are embedded in the silicalite lattice in a perfect tetrahedral environment,53 a band at 960 cm−1 ascribed to the asymmetric stretching vibration of the [SiO4] units is perturbed and shifts.
DFT calculations of a 1 × 1 UO2(111) slab with 1 ML of extra O, performed within the HSE-SOC NCL formalism, indicate that there is an O–U vibration close to 1000 cm−1 (see Fig. S2b, ESI†). This system is energetically and dynamically stable. The adsorption energy of the extra oxygen is −0.813 eV. The bond length between the extra oxygen and the surface U ion shortens to 1.773 Å (compared to the bulk U–O bond length of 2.367 Å). The asymmetric vibration of this surface O–U pair is found to be 1005 cm−1. To further probe into this and see if indeed the presence of CO affects this asymmetric vibrational mode we have modeled different O coverages (θ = 1/3 ML, 2/3 ML, and 1 ML) using a √3 × √3 slab composed of three O–U–O tri-layers, with 1, 2, 3 O atoms adsorbed on the surface U atoms (Fig. S8, ESI†). These calculations were conducted with DFT+U in the FM collinear configuration. From Fig. S8 (ESI†), it can be observed that the value of the asymmetric vibrational frequencies νUO of the surface U and the adsorbed O atoms changes with the level of O coverage. When comparing calculations with the same O coverage, it can be noted that the presence of adsorbed CO gives rise to a negative shift in the νUO, a fact that could explain the derivative-like shape of the 978 cm−1 feature experimentally observed.
Conclusions
The challenges inherent in studying the uranium oxide system were addressed by employing a systematic approach to its complexity. Employing a single crystal for surface reaction studies ensured the preservation of stoichiometry or near stoichiometry and allowed the use of polarized infrared spectroscopy (IRRAS). Experimental findings were validated by state-of-the-art theoretical models that meticulously disentangled magnetic and relativistic effects on bonding. The IR band at 2160 cm−1 attributed to ν12CO adsorbed on UO2(111) single crystal, was further explained using DFT methods across different theoretical frameworks. This comprehensive analysis underscored the importance of accounting for electron–electron interactions, the directional degrees of freedom of the U magnetic moments, and relativistic effects in the adsorption process. Precisely, to accurately reproduce the variations in the vibration frequency of the CO molecule to within a few cm−1, it was necessary to consider a self-interaction corrected functional as the HSE06 hybrid functional, as well as to account for the non-collinearity of the uranium magnetic moments and spin–orbit coupling. These factors collectively mitigated erroneous charge donation and back-donation, thereby accurately reflecting the adsorption process and the vibrational frequency. Furthermore, the appearance of a band at 978 cm−1 attributed to O–U–O asymmetric stretch, akin to gas phase clusters of CO–UO2 IR results, suggests a potential ligand effect in the presence of an adsorbed oxygen atom.Data availability
All data are available upon request made to the corresponding authors.Conflicts of interest
There are no conflicts to declare.Acknowledgements
The authors thank Dr Nils Schewe for his help during polishing the UO2(111) single crystal and for his contribution in the collection of the IRRAS of 12CO/UO2. The authors also thank Dr Peter Weidler for acquiring XRD patterns of the UO2(111) single crystal. MAB, SDN, GM, AMLL, and VV thank the financial support from PICT 2019/02129. M. V. G. P. thanks the support of the Grant PID2021-128915NB-I00 funded by MCIN/AEI/10.13039/501100011033 and by “ERDF A way of making Europe”. Computer time provided by the RES (Red Española de Supercomputación) resources at Mare Nostrum 4 and 5 (BSC, Barcelona) is acknowledged. This work is part of the Strategic Partnership UNSAM-KIT (SPUK).References
- A. Föhlisch, M. Nyberg, J. Hasselström, O. Karis, L. G. M. Pettersson and A. Nilsson, How Carbon Monoxide Adsorbs in Different Sites, Phys. Rev. Lett., 2000, 85, 3309–3312 CrossRef PubMed.
- S. Mahajan and S. Jagtap, Metal-oxide semiconductors for carbon monoxide (CO) gas sensing: a review, Appl. Mater. Today, 2020, 18, 100483 CrossRef.
- G. Blyholder, Infrared Spectra and Bonding of CO Adsorbed on Fe, Chem. Phys., 1966, 44, 3134–3136 Search PubMed.
- J. M. MacLaren, D. D. Vvedensky, J. B. Pendry and R. W. Joyner, Catalytic Implications of Local Electronic Interactions between Carbon Monoxide and Coadsorbed Promoters on Nickel Surfaces, J. Chem. Soc., Faraday Trans. 1, 1987, 83, 1945–1962 RSC.
- J. Scaranto and S. Giorgianni, DFT calculations of carbon monoxide adsorbed on anatase TiO2(101) and (001) surfaces: correlation between the binding energy and the CO stretching frequency, Mol. Simul., 2013, 39, 245–249 CrossRef.
- P. G. Lustemberg, P. N. Plessow, Y. Wang, C. Yang, A. Nefedov, F. Studt, C. Wöll and M. V. Ganduglia-Pirovano, Vibrational Frequencies of Cerium-Oxide-Bound CO: A Challenge for Conventional DFT Methods, Phys. Rev. Lett., 2020, 125, 256101 CrossRef PubMed.
- A. Soon, T. Söhnel and H. Idriss, Plane-wave pseudopotential density functional theory periodic slab calculations of CO adsorption on Cu2O(111) surface, Surf. Sci., 2005, 579, 131–140 CrossRef.
- T. J. Tague, Jr., L. Andrews and R. D. Hunt, Matrix Infrared Spectra of the Products of Uranium-Atom Reactions with Carbon Monoxide and Carbon Dioxide, J. Phys. Chem., 1993, 97, 10920–10924 CrossRef.
- F. Li, J. Qin, X. Fu, Y. Zhou, B. Su, M. Shuai and Z. Pu, CO Oxidation to CO2 on Uranium Dioxide Molecules through Intermediate O2U(η1-CO), J. Phys. Chem. A, 2023, 127, 5833–5840 CrossRef PubMed.
- J. G. Brennan, R. A. Andersen and J. L. Robbins, Preparation of the First Molecula rCarbon Monoxide Complex of Uranium, (Me3SiC5H4)3UCO, J. Am. Chem. Soc., 1986, 108, 335–336 CrossRef.
- J. Parry, E. Carmona, S. Coles and M. Hursthouse, Synthesis and Single Crystal X-Ray Diffraction Study on the First Isolable Carbonyl Complex of an Actinide, (C5Me4H)3U(CO), J. Am. Chem. Soc., 1995, 117, 2649–2650 CrossRef.
- D. R. Hartline and K. Meyer, From Chemical Curiosities and Trophy Molecules to Uranium-Based Catalysis: Developments for Uranium Catalysis as a New Facet in Molecular Uranium Chemistry, J. Am. Chem. Soc. Au, 2021, 1, 698–709 CAS.
- S. D. Senanayake, A. Soon, A. Kohlmeyer, T. Söhnel and H. Idriss, Carbon monoxide reaction with single crystal surfaces: a theoretical and experimental study, J. Vac. Sci. Technol., A, 2005, 23, 1078–1084 CrossRef CAS.
- K. Tatsumi, A. Nakamura, P. Hofmann, R. Hoffmann, K. G. Moloy and T. J. Marks, Double Carbonylation of Actinide Bis(cyclopentadienyl) Complexes. Experimental and Theoretical Aspects, J. Am. Chem. Soc., 1986, 108, 4467–4476 CrossRef CAS.
- O. T. Summerscales, F. Geoffrey, N. Cloke, P. B. Hitchcock, J. C. Green and N. Hazar, Reductive Cyclotrimerization of Carbon Monoxide to the Deltate Dianion by an Organometallic Uranium Complex, Science, 2006, 829(331), 829 CrossRef.
- U. Rosenthal, Carbon Monoxide Coupling Reactions: A New Concept for the Formation of Hexahydroxybenzene, Chem. – Eur. J., 2020, 26, 14507–14511 CrossRef CAS.
- D.-H. Chen, N. Vankova, G. Jha, X. Yu, Y. Wang, L. Lin, F. Kirschhöfer, R. Greifenstein, E. Redel, T. Heine and C. Wöll, Ultrastrong Electron-Phonon Coupling in Uranium–Organic Frameworks Leading to Inverse Luminescence Temperature Dependence, Angew. Chem., Int. Ed., 2024, 63, e20231855 Search PubMed.
- Y. Hinatsu and T. Fujino, Studies on magnetic properties of UO2–CeO2 solid solutions. II. Effect of oxygen nonstoichiometry on magnetic susceptibilities of solid solutions, J. Solid State Chem., 1988, 76, 124–130 CrossRef CAS.
- E. Groppo, S. Rojas-Buzo and S. Bordiga, The Role of In Situ/Operando IR Spectroscopy in Unraveling Adsorbate-Induced Structural Changes in Heterogeneous Catalysis, Chem. Rev., 2023, 123, 12135–12169 CrossRef CAS PubMed.
- Y. Tong, J. Wirth, H. Kirsch, M. Wolf, P. Saalfrank and R. K. Campen, Optically probing Al–O and O–H vibrations to characterize water adsorption and surface reconstruction on α-alumina: an experimental and theoretical study, J. Chem. Phys., 2015, 142, 054704 CrossRef PubMed.
- K. N. Kudin, G. E. Scuseria and Ri. L. Martin, Hybrid Density-Functional Theory and the Insulating Gap of UO2, Phys. Rev. Lett., 2002, 89(1–4), 266402 CrossRef.
- P. Santini, R. Leímanski and P. Erdos, Magnetism of actinide compounds, Adv. Phys., 1999, 48, 537–653 CrossRef.
- S. B. Wilkins, R. Caciuffo, C. Detlefs, J. Rebizant, E. Colineau, F. Wastin and G. H. Lander, Direct observation of electric-quadrupolar order in UO2, Phys. Rev. B: Condens. Matter Mater. Phys., 2006, 73, 060406(R) CrossRef.
- R. Laskowski, G. K. H. Madsen, P. Blaha and K. Schwarz, Magnetic structure and electric-field gradients of uranium dioxide: an ab initio study, Phys. Rev. B: Condens. Matter Mater. Phys., 2004, 69, 140408(R) CrossRef.
- B. C. Fraxer, G. Shirane and D. E. Cox, Neutron-Diffraction Study of Antiferromagnetism in UO2, Phys. Rev., 1965, 140, 1448–1452 CrossRef.
- R. Masel, Principles of adsorption and reaction on solid surfaces, Wiley, Hoboken, NJ, USA, 1996, ch. 7 Search PubMed.
- G. Kresse and D. Joubert, From ultrasoft pseudopotentials to the projector augmented-wave method, Phys. Rev. B: Condens. Matter Mater. Phys., 1999, 59, 1758–1775 CrossRef.
- G. Kresse and J. Furthmüller, Efficient iterative schemes for ab initio total-energy calculations using a plane-wave basis set, Phys. Rev. B: Condens. Matter Mater. Phys., 1996, 54, 11186 CrossRef.
- J. P. Perdew, K. Burke and M. Ernzerhof, Generalized Gradient Approximation Made Simple, Phys. Rev. Lett., 1996, 77, 3865–3868 CrossRef.
- S. L. Dudarev, G. A. Botton, S. Y. Savrasov, C. J. Humphreys and A. P. Sutton, Electron-energy-loss spectra and the structural stability of nickel oxide: An LSDA+U study, Phys. Rev. B: Condens. Matter Mater. Phys., 1998, 57, 1505–1509 CrossRef.
- A. V. Krukau, O. A. Vydrov, A. F. Izmaylov and G. E. Scuseria, Influence of the exchange screening parameter on the performance of screened hybrid functionals, J. Chem. Phys., 2006, 125, 224106 CrossRef PubMed.
- J. Schoenes, Electronic transitions, crystal field effects and phonons in UO2, Phys. Rep., 1980, 63, 301–336 CrossRef.
- K. Momma and F. Izumi, VESTA 3 for three-dimensional visualization of crystal, volumetric and morphology data, J. Appl. Crystallogr., 2011, 44, 1272–1276 CrossRef.
- V. Wang, N. Xu, J.-C. Liu, G. Tang and W.-T. Geng, VASPKIT: a user-friendly interface facilitating high-throughput computing and analysis using VASP code, Comput. Phys. Commun., 2021, 267, 108033 CrossRef.
- S. Grimme, S. Ehrlich and L. Goerigk, Effect of the damping function in dispersion corrected density functional theory, J. Comput. Chem., 2011, 32, 1456–1465 CrossRef PubMed.
- D. Hobbs, G. Kresse and J. Hafner, Fully unconstrained noncollinear magnetism within the projector augmented-wave method, Phys. Rev. B: Condens. Matter Mater. Phys., 2000, 62, 11556–11570 CrossRef.
- S. Steiner, S. Khmelevskyi, M. Marsmann and G. Kresse, Calculation of the magnetic anisotropy with projected-augmented-wave methodology and the case study of disordered Fe1−xCox alloys, Phys. Rev. B, 2016, 93(1–6), 224425 CrossRef.
- S. V. Chong, T. R. Griffiths and H. Idriss, Ethanol reactions over the UO2(111) single crystal: effect of the Madelung potential on the reaction selectivity, Surf. Sci., 2000, 444, 187–198 CrossRef.
- G. El Jamal, T. Gouder, R. Eloirdi, H. Idriss and M. Jonson, UV Photoelectron Spectroscopic study of UO2, U2O5 and UO3 exposed to H2O under Ultra High Vacuum Conditions. Estimating the Radical Character of Surface Bound Hydroxyl Groups, J. Phys. Chem. C, 2023, 127(29), 14222–14231 CrossRef.
- S.-W. Yu and J. G. Tobin, Confirmation of sample quality: X-ray and ultraviolet photoelectron spectroscopies of uranium dioxide, J. Vac. Sci. Technol., A, 2011, 29, 021008 CrossRef.
- G. C. Allen, I. R. Trickle and P. M. Tucker, Surface characterization of uranium metal and uranium dioxide using X-ray photoelectron spectroscopy, Philos. Mag. B, 1981, 43, 689–703 Search PubMed.
- B. Zerulla, M. Krstić, S. Chen, Z. Yu, D. Beutel, C. Holzer, M. Nyman, A. Nefedov, Y. Wang, T. G. Mayerhöfer, C. Wöll and C. Rockstuh, Polarization-dependent effects in vibrational absorption spectra of 2D finite-size adsorbate islands on dielectric substrates, Phys. Chem. Chem. Phys., 2024, 26, 13683–13693 RSC.
- E. N. Gribov, D. Cocina, G. Spoto, S. Bordiga, G. Ricchiardi and A. Zecchina, Vibrational and thermodynamic properties of Ar, N2, O2, H2 and CO adsorbed and condensed into (H,Na)-Y zeolite cages as studied by variable temperature IR spectroscopy, Phys. Chem. Chem. Phys., 2006, 8, 1186–1196 RSC.
- H. J. Fraser, M. P. Collings, J. W. Dever and M. R. S. McCoustra, Using laboratory studies of CO–H2O ices to understand the non-detection of a 2152 cm−1 (4.647 μm) band in the spectra of interstellar ices, Mon. Not. R. Astron. Soc., 2004, 353, 59–68 CrossRef.
- S. Abramowitz and N. Acquista, The Infrared Spectra of Matrix Isolated Uranium Oxide Species, J. Res. Natl. Bur. Stand., Sect. A, 1974, 78A, 421–445 CrossRef.
- S. Knight, R. Korlacki, C. Dugan, J. C. Petrosky, A. Mock, P. A. Dowben, J. M. Mann, M. M. Kimani and M. Schubert, Infrared-active phonon modes in single-crystal thorium dioxide and uranium dioxide, J. Appl. Phys., 2020, 127, 125103 CrossRef.
- M. Zhou, L. Andrews, N. Ismail and C. Marsden, Infrared Spectra of UO2, UO2+, and UO2− in Solid Neon, J. Phys. Chem. A, 2000, 104, 5495–5502 CrossRef.
- T. J. Tague, Jr., L. Andrews and R. D. Hunt, Matrix Infrared Spectra of the Products of Uranium-Atom Reactions with Carbon Monoxide and Carbon Dioxide, J. Phys. Chem., 1993, 97, 10920–10924 CrossRef.
- A. M. Ricks, L. Gagliardi and M. A. Duncan, Infrared Spectroscopy of Extreme Coordination: The Carbonyls of U+ and UO2+, J. Am. Chem. Soc., 2010, 132, 15905–15907 CrossRef PubMed.
- A. M. Ricks, L. Gagliardi and M. A. Duncan, Uranium Oxo and Superoxo Cations Revealed Using Infrared Spectroscopy in the Gas Phase, J. Phys. Chem. Lett., 2011, 2, 1662–1666 CrossRef.
- M. D. Strømsheim, I.-H. Svenum, M. H. Farstad, C. J. Kees-Jan Weststrate, A. Borg and H. J. Venvik, CO-Induced Surface Reconstruction of the Co(11–20) Surface. A Combined Theoretical and Experimental Investigation, J. Phys. Chem. C, 2020, 124, 28488–28499 CrossRef.
- G. Ricchiardi, A. Damin, S. Bordiga, C. Lamberti, G. Spanò, F. Rivetti and A. Zecchina, Vibrational Structure of Titanium Silicate Catalysts. A Spectroscopic and Theoretical Study, J. Am. Chem. Soc., 2001, 123, 11409–11419 CrossRef PubMed.
- S. Bordiga, A. Damin, F. Bonino, A. Zecchina, G. Spanò, F. Rivetti, V. Bolis, C. Prestipino and C. Lamberti, Effect of Interaction with H2O and NH3 on the Vibrational, Electronic, and Energetic Peculiarities of Ti(IV) Centers TS-1 Catalysts: A Spectroscopic and Computational Study, J. Phys. Chem. B, 2002, 106, 9892–9905 CrossRef.
Footnotes |
| † Electronic supplementary information (ESI) available. See DOI: https://doi.org/10.1039/d4cp03096f |
| ‡ Authors contributed equally to this work. |
| This journal is © the Owner Societies 2025 |