 Open Access Article
Integrating density functional theory with machine learning for enhanced band gap prediction in metal oxides†
Chidozie
Ezeakunne
 a,
Bipin
Lamichhane
 b and
Shyam
Kattel
 *a
*a
aDepartment of Physics, University of Central Florida, Orlando, FL 32816, USA. E-mail: shyam.kattel@ucf.edu
bDepartment of Physics, Florida A&M University, Tallahassee, FL 32307, USA
First published on 14th February 2025
Abstract
In this study, we used a combination of density functional theory with Hubbard U correction (DFT+U) and machine learning (ML) to accurately predict the band gaps and lattice parameters of metal oxides: TiO2 (rutile and anatase), cubic ZnO, cubic ZnO2, cubic CeO2, and cubic ZrO2. Our results show that including Up values for oxygen 2p orbitals alongside Ud/f for metal 3d or 4f orbitals significantly enhances the accuracy of these predictions. Through extensive DFT+U calculations, we identify optimal (Up, Ud/f) integer pairs that closely reproduce experimentally measured band gaps and lattice parameters for each oxide: (8 eV, 8 eV) for rutile TiO2; (3 eV, 6 eV) for anatase TiO2; (6 eV, 12 eV) for c-ZnO; (10 eV, 10 eV) for c-ZnO2; (9 eV, 5 eV) for c-ZrO2; and (7 eV, 12 eV) for c-CeO2. Our ML analysis showed that simple supervised ML models can closely reproduce these DFT+U results at a fraction of the computational cost and generalize well to related polymorphs. Our approach builds on existing high-throughput DFT+U frameworks by providing fast pre-DFT estimates of structural properties and band gaps. Since this work does not aim to improve the underlying DFT+U method, the ML model shares its limitations. We also note that the reported values of Up strongly depend on the choice of correlated orbitals, and caution is recommended with a different choice of correlated orbitals.
1. Introduction
Metal oxide-based materials are commonly used in applications ranging from electronics, coating, energy storage, sensors, biomedical applications, environmental remediation, and photonics to thermo/electro/photo-catalysis.1–9 The advancement of technologies that depend on metal oxide-based materials can be accelerated by developing quicker yet accurate methods to characterize and predict the properties of these materials. First-principles density functional theory (DFT) calculations are at the forefront of the currently available accurate computational modeling methods to study material properties.10–14 However, standard DFT calculations fail to correctly predict the electronic structure (band gap) of metal oxides due to delocalization or self-interaction error.15–17 Thus, alternative approaches are necessary to reliably predict the band gap of these strongly correlated systems, such as metal oxides. DFT calculations employing recently developed hybrid functionals with improved approximations to the exchange and correlation (XC) energy component of the total energy of a system of electrons are appealing in this regard. However, these calculations are orders of magnitude computationally intensive compared to standard DFT calculations.18,19 In contrast, Hubbard U, also known as the DFT+U approach, is a computationally efficient scheme in which an onsite Coulomb interaction term U is added in standard DFT to run DFT+U calculations.20–23 This method has been shown to produce band gaps close to experimental values in many strongly correlated materials and is widely used to study metal oxide-based materials.24–28However, determining the appropriate value of U in the DFT+U approach is not trivial and requires an extensive benchmarking of the calculated band gap with the experimental value. In general, the Hubbard U correction is only applied to 3d and 4f orbitals of metals in metal oxides.25,29,30 This is reasonable because of the inability of DFT to treat 3d and 4f valence orbitals strictly as localized orbitals. Interestingly, recent studies have shown that the U parameter for the O 2p orbital of oxygen in metal oxides is beneficial for predicting the lattice parameters and band gap correctly. For example, Thoa et al.31 have shown that for rutile TiO2, an optimal combination of Up (10 eV) and Ud (8 eV) significantly enhances the accuracy of predicted properties, minimizing the deviations in lattice constants and band gap between DFT+U and experimental values. Similarly, Plata et al.29 demonstrated in their study on CeO2 that applying Hubbard U corrections to both Ce 4f and O 2p electrons leads to substantial improvements in the predictions of lattice parameters, band gaps, and formation energies. Gebauer et al.32 extended these insights to ZrO2, where the judicious selection of Up and Ud values resulted in band gap predictions that closely matched experimental results. Additionally, May & Kolpak33 illustrate the importance of incorporating Up values for oxygen 2p orbitals alongside Ud/f for metal orbitals in DFT+U calculations, significantly enhancing the accuracy of predicted crystal structures and band gaps for transition and rare metal oxides such as rutile and anatase TiO2, ZnO, and CeO2.
Even though the DFT+U approach has been widely used to study metal oxides’ bulk and surface properties, a systematic, coherent, and extensive study aiming to unravel the effect of Up and Ud/f parameters on the prediction of lattice parameters and band gap is limited. In this current study, we employed the DFT+U approach, integrating the DFT+U results with machine learning (ML) methods to investigate the influence of Up, Ud/f parameters on the prediction of crystal structure (lattice parameters) and band gap of five commonly used metal oxides system in heterogeneous catalysis community,34 namely, TiO2 (rutile and anatase), c-ZrO2, c-ZnO, c-ZnO2 and c-CeO2. In general, the results show that including Up in addition to Ud/f values in DFT+U calculations yields improved prediction in both lattice parameters and band gap. Furthermore, the results obtained using the ML scheme show that the regression algorithms can be used to accurately predict the band gap of the metal oxides used in this study. Thus, our combined DFT+U+ML study extensively benchmarks Up and Ud/f values on lattice parameters and band gap prediction of the Hubbard U approach on widely used metal oxides.
2. Computational methods
2.1. Review of major methods to compute the Hubbard U parameter
The computation of the Hubbard U parameter is foundational in addressing the limitations of standard density functional theory (DFT) approaches, especially for materials with strongly correlated electrons. The Hubbard U introduces a corrective term that better accounts for electron–electron interactions inadequately described by conventional DFT exchange–correlation (XC) functionals. Over the years, different methods have been proposed to compute U ab initio. A few of the most widely implemented are discussed below:2.2. Linear response method
The linear response approach, pioneered by Cococcioni and de Gironcoli, computes U by introducing a perturbative external potential and measuring the resulting change in electronic occupancy.35–37 This method excels in its direct connection to the system's physical properties, linking U to the susceptibility of the electron density to external perturbations. The calculated U value aims to eliminate the unphysical curvature in the total energy versus electron number plot, which is characteristic of approximate DFT methods like LDA and GGA. The strength of this method lies in its ability to tailor U specifically to the material's electronic structure, making it dynamically consistent with the physical system under study. However, the requirement for supercell calculations to mitigate periodic interactions can be computationally demanding.2.3. Constrained random phase approximation (cRPA)
Developed by Aryasetiawan and others,38 the cRPA method is designed to calculate the effective Hubbard U by distinguishing screening effects of localized (correlated) electrons from itinerant (delocalized) ones. This approach prevents the double counting of screening contributions, ensuring that the interactions calculated reflect only those intrinsic to the correlated electron states. This specificity is crucial for accurately modeling electron interactions in materials with strong electronic correlations.2.4. Constrained LDA (cLDA)
The cLDA method involves fixing the occupation numbers of specific orbitals and observing the resulting energy differences.39–43 This technique provides a straightforward way to estimate U by directly measuring the energy cost of localized electron interactions under constrained conditions. While simpler and potentially less computationally intensive than other methods, its accuracy can be limited by the somewhat artificial nature of the imposed constraints and the sensitivity to the choice of which electrons are constrained.2.5. Agapito–Curtarolo–Buongiorno Nardelli (ACBN0)
Drawing inspiration from the work of Mosey and Carter,44 ACBN0 method named after the authors,45 employs a Hartree–Fock-like calculation to determine U values between Hubbard orbitals explicitly. It uniquely adjusts the interaction strength by renormalizing the occupations of Kohn–Sham orbitals based on their projectability onto the Hubbard basis, effectively reducing U for less localized states. ACBN0 allows for determining site-specific U values within a single self-consistent field (SCF) calculation, though it is typically employed as a post-processing step in current implementations.462.6. Our methodology
Our methodology is different from traditional first-principles methods. By integrating Hubbard U values with machine learning (ML) methods, we utilize U not just as a corrective measure but also as a predictive tool, allowing us to first explore U's corrective capabilities and extract their effects on bulk material properties while leveraging ML models’ pattern recognition and generalization capabilities.We leverage a hybrid approach that integrates DFT calculations with an effective Hubbard U correction (DFT+U)21 and simple supervised ML models to predict band gap and lattice parameters for a given Up, Ud/f values for a range of commonly used oxides in heterogeneous catalysis. The DFT+U calculations were carried out using the Vienna Ab initio Simulation Package (VASP) code version 5.4.4 included in MedeA®,47–51 employing the generalized gradient approximation (GGA) with both Perdew–Burke–Ernzerhof (PBE) and revised PBE (rPBE) functionals.52,53 For both PBE and rPBE, we used is the PBE PAW potentials based on the projector-augmented-wave (PAW) method, which is provided by VASP.51,54
The study investigates six primary unique metal oxides with their respective Materials Project ID:55 rutile and anatase titanium dioxide (TiO2; mp-2657 and mp-390), each with its unique tetragonal structure; cubic zinc oxide (c-ZnO; mp-1986); zinc peroxide (c-ZnO2; mp-8484) with a pyrite-like, also cubic configuration; and zirconium dioxide (c-ZrO2; mp-1565) and cerium dioxide (c-CeO2; mp-20194), both in a cubic fluorite structure. We also conducted DFT+U calculations on additional secondary metal oxides (Table S36, ESI†) to evaluate the transferability of the learned feature weights to a closely related metal oxide.
A key aspect of our computational methodology involved applying the Hubbard U parameters – we applied the Ud parameter to the d orbitals of titanium (Ti), zinc (Zn), zirconium (Zr), manganese (Mn), hafnium (Hf), and nickel (Ni). In contrast, the Uf parameter was designated for the f orbitals of cerium (Ce).29 In addition to Ud/f parameters, we uniformly applied the Up parameter to the oxygen (O) p orbitals across all oxide systems in this study.
The computational setup for structure optimization and band structure calculations was consistent across all oxide systems. We made minor adjustments to the KPOINTS, aligning them with similar, converged values found in the Materials Project repository,56,57 for each metal oxide in this study. The energy cutoff for the plane wave basis set (ENCUT) was 520 eV for all metal oxides ensuring compatibility with Materials Project while still being more than double the recommended value referenced in the pseudopotentials. To verify the converged values, we conducted a convergence test for the metal oxide with the smallest KPOINTS utilized (c-ZnO), and the results (Fig. S1 and S2, ESI†) confirm convergence.
Our VASP input parameters included a ‘normal’ precision setting for structure optimizations, with the stress tensor fully optimized (ISIF = 3). We set the electronic minimization parameters with a total energy convergence criterion (EDIFF) of 1.0 × 10⁻⁶ and a force convergence criterion (EDIFFG) of 0.01. Additional settings included spin polarization (ISPIN = 2) and the LDA+U parameters (LDAU, LDAUTYPE, LDAUL, LDAUU, LDAUJ). The Up values initially span from 0.00 eV to 10.00 eV in integer steps of 1 eV, and the Ud/f values range from 2.00 eV to 10.00 eV, also in integer steps of 1 eV, with a U of 0.00 eV generally representing a particular case where no U correction was applied to the orbital of interest. The U values remain consistent with the structure optimization calculation, allowing for an extensive evaluation of their impact on the metal oxides’ electronic structures (band gap) and lattice parameters (a, b, c).
To complement the DFT+U analysis, we employed a variety of supervised ML regressors, including linear regression (LR), random forest regression (RFR), gradient boosting regression (GBR), XGBoost regression (XGBR), and Gaussian process regression (GPR). Additionally, we utilized a second-order polynomial regression (PR) model, which includes polynomial combinations of the features to capture the non-linear relationships between the Up and Ud/f parameters and the band gaps and lattice constants for each primary metal oxide in this study. Our preliminary data analysis informed this decision, indicating a non-linear correlation between these U variables and the target band gap and lattice constants.58–60 Model training incorporated a K-fold cross-validation approach (with K = 5) over leave-one-out cross-validation to simulate training on fewer data than obtained (∼80%). This method meticulously divided the dataset, using a different fold as the test set in each iteration, and the remaining folds in each iteration comprised the training set, thus providing a comprehensive assessment of model performance across the entire dataset and mitigating overfitting risks.58–60 Following the initial training and evaluation phase, we conducted a comprehensive retraining of the regressors using the dataset of the initial range of U values per metal oxide. Subsequently, to assess the models’ extrapolation predictive accuracy, we evaluated the newly trained models on ten newly generated random integer pairs of Up and Ud/f values, which extended beyond the initially defined range for U parameters (Table S4, ESI†). Models’ performance was evaluated using commonly used metrics such as mean squared error (MSE), root mean squared error (RMSE), mean absolute error (MAE), and coefficient of determination (R2).61–65
After extensive benchmarking to identify the best-performing regressor for interpolation and extrapolation scenarios in predicting band gap and lattice parameters for each primary metal oxide. We retrained the model a third time, including the extrapolation data, using only this best-performing regressor. We equally extracted the learned model weights/coefficients. This approach aimed to create a more accurate model capable of extending beyond our initial range of U values. Using this newly trained model, we applied Bayesian optimization minimization using a Gaussian process.66,67 We defined the objective loss function to minimize the weighted mean absolute percentage error (WMAPE).68 This loss function normalizes the differences in units and scales between the band gap and lattice constants. We included weights to emphasize the predictions for both material properties (band gap and lattice constants) in this study – (1, 1, 1, 1) to represent equal contributions from both band gap and lattice parameters and (1, 0, 0, 0) to focus solely on the band gap. Using this technique, we identified the optimal combination of Up and Ud/f values to a higher precision. We investigated two constraints as before:
(a) Both Up and Ud/f were allowed to vary, starting from 0.01 eV.
(b) Up was fixed at zero, with only Ud/f varying, starting from 0.01 eV.
The optimal U values were obtained, and DFT+U calculations were performed for validation. For each scenario, we calculated the percentage differences from experimental values. This allowed for a comparative assessment of the impact of fixing Up to zero on the accuracy of the DFT+U band gap and lattice parameters.
Finally, we incorporated the entire dataset to build a comprehensive model capable of predicting the band gap and lattice constants of the metal oxides in this study. These models aim to achieve good agreement with the DFT+U calculated values using fundamental properties of the constituent elements of each metal oxide that are readily accessible (Table S33, ESI†).69 We also extracted the learned weights for the features used in training the models. Additionally, we assessed the applicability of these models in predicting the band gap and lattice constants of closely related metal oxides not considered in this study. A more detailed computational methodology and the data, scripts, and additional resources used in this study are accessible on our GitHub page: https://github.com/dozieeze/DFT-Hub-U-ML-Predictor.
Our methodology and scripts provide a flexible method for researchers to incorporate multiple pre-identified properties of materials beyond those used in this study. Researchers can predict optimal U values that balance the DFT+U errors in predicting the predefined material properties compared to experimental values. Users can assign weights to each property and utilize a few DFT+U calculations with non-converged U values. Consequently, the methodology and scripts are not restricted to the computational configurations or the DFT code used in this study and can be adapted to non-DFT schemes, enhancing their robustness and versatility. It is, however, crucial to recognize that the optimal U values we derive are not ab initio and may be property-specific; caution must be taken in interpreting the physical significance of the derived U parameters.
3. Results and discussion
Below, we first present our DFT+U calculations alongside ML regression for each oxide system on an individual basis (Sections 3.1–3.5). This step-by-step approach illustrates how different pairs of Up and Ud/f influence each material's band gap and lattice parameters. We further expand our perspective in Section 3.6, demonstrating how these ML models can be generalized to other metal oxides, thereby providing a more comprehensive predictive framework.We integrated the DFT+U approach with the ML method to accurately predict the band gap and lattice parameters of our primary metal oxides – TiO2, ZnO, ZnO2, ZrO2, and CeO2. The DFT+U calculations employed two commonly used exchange and correlation functionals: PBE and rPBE. In the following discussion, we primarily focus on the results obtained with the rPBE method. The results for PBE, which demonstrate a trend like that of the rPBE method, are provided in the ESI.† The results obtained using the rPBE functional were chosen to demonstrate the feasibility of our approach since the rPBE method has been shown to reproduce experimental trends of catalytic activity and selectivity in metal oxide-based catalysts.70 The DFT+U calculations were performed to compute metal oxides’ lattice parameters and band gap with a range of Up and Ud/f values. Subsequently, we developed regression models to predict the target variables using the data obtained from DFT+U calculations. Up and Ud/f represent the features in our simplest models, and band gaps and lattice constants a, b, and c represent the target variables.
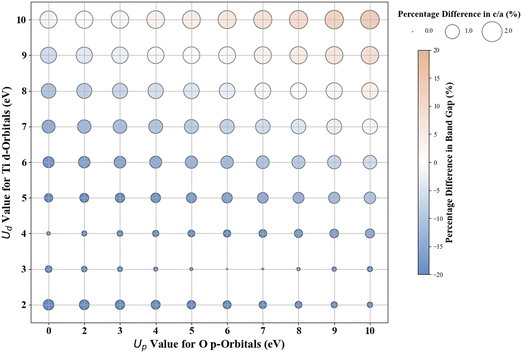
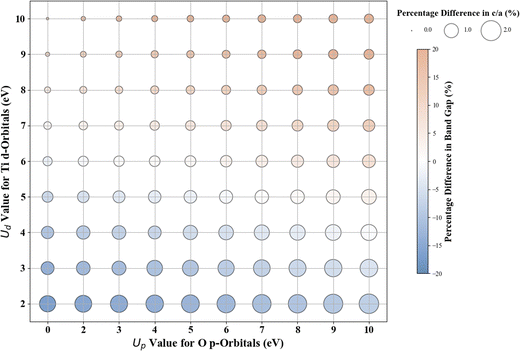
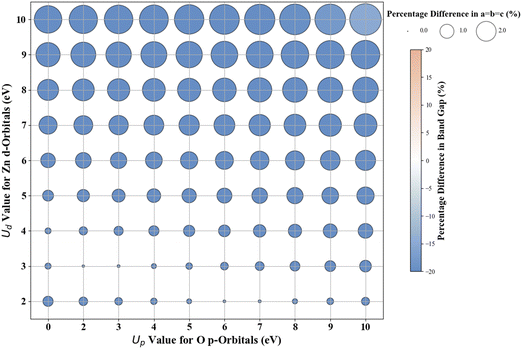
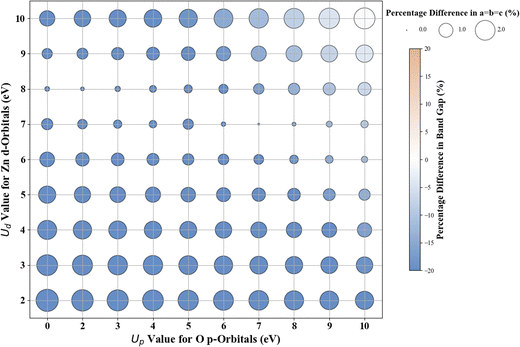
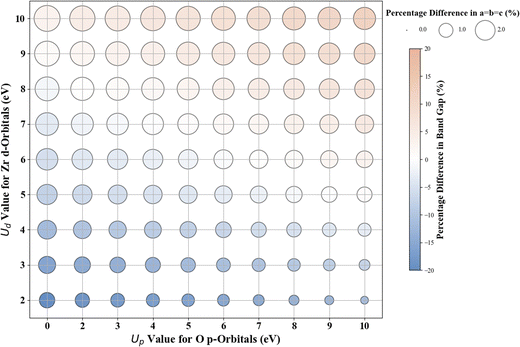
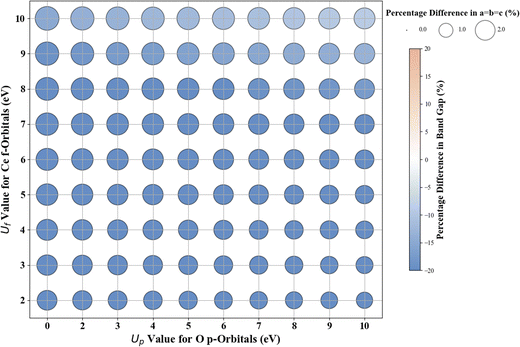
Scatter plots were constructed to discuss the DFT+U results. The color of the circles indicates the percentage difference between the DFT+U calculated and experimental values of band gaps. In contrast, the size of the circle represents the percentage difference between the DFT+U calculated and experimental values of the lattice parameters. A darker blue color signifies a negative percentage difference, corresponding to an underestimated band gap (compared to experimental values). Conversely, a darker brown signifies a positive percentage difference, indicating an overestimated band gap (smaller than the experimental values). A white color indicates a zero-percentage difference between the experimental and DFT+U values. We restricted the shade range of brown and blue color to show deviations in the DFT+U calculated band gap value to ±20%; this limitation was imposed to ensure consistency across the plots for the various oxides under investigation and to concentrate primarily on more minor deviations as a deviation more than 20% in the calculated band gap from the experimental band gap is indeed a significant deviation from experiments that it is unlikely to be remedied by DFT+U. For metal oxides with a cubic bulk phase (a = b = c), the size of the circles represents the percentage difference in lattice constant (a) between DFT+U and experiments. For rutile and anatase TiO2 with tetragonal bulk structures (lattice constant a = b ≠ c), the size of the circles represents the percentage difference in lattice constant ratio (c/a) between DFT+U and experiments.
3.1. Rutile and anatase TiO2
The experimentally measured band gap of rutile TiO2 is ∼3.030 eV, and its lattice constants are a = b = 4.594 Å and c = 2.962 Å.71,72 Our calculations show that the standard DFT predicts a band gap of 1.838 eV and lattice constants of a = b = 4.689 Å and c = 2.983 Å. Therefore, it is evident that the standard DFT underestimates the band gap of rutile TiO2. Thus, a Hubbard U correction is necessary to predict the band gap accurately. Fig. 1 shows the % difference between the DFT+U calculated and the experimental band gap of rutile TiO2. Without introducing the Up values, we find that Ud = 10 eV results in the best band gap prediction of 2.972 eV with a |2|% deviation from the experimental result. This prediction is consistent with the results from similar previous DFT+U calculations.31 Interestingly, we obtain a more accurate band gap prediction when introducing Up values for the O 2p orbital and Ud values for the Ti 3d orbital. The optimal (Up, Ud) integer pairs are predicted to be (8 eV, 8 eV) and (5 eV, 9 eV), both of which have a similarly estimated band gap of 3.037 eV (Fig. S3, ESI†), which deviates by a negligible 0.2% from the experimental value.Without Up, our results show that the Ud = 10 eV produces the best result for c/a. The % difference between our DFT+U calculated c/a and the experimental values for Ud = 10 eV is 1.5%. Using the (Up, Ud) integer pairs of (8 eV, 8 eV) and (5 eV, 9 eV) predicted the band gaps close to the experimental values. The % differences between computed c/a, and the experimental values for those pairs are 1.3% and 1.4%, respectively. Considering the above-discussed three (Up, Ud) integer pairs, the (8 eV, 8 eV) pair results in the minimum error in both the band gap and lattice constants. Thus, our extensive DFT+U calculations suggest that the (Up, Ud) integer pair of (8 eV, 8 eV) is a reasonable choice of U values to accurately predict both the lattice parameters and band gap of rutile TiO2.
In the case of anatase TiO2, our standard DFT calculations result in a band gap of 2.486 eV and lattice constants of a = b = 3.829 Å and c = 9.802 Å. The standard DFT predicted band gap (2.486 eV) is smaller than the experimental band gap (∼3.200 eV).14 Simultaneously, the lattice parameters are slightly overestimated compared to experimental values (a = b = 3.785 Å and c = 9.512 Å), consistent with previous DFT results.73–76Fig. 2 shows the deviation between the DFT+U calculated and experimental band gap values and lattice constants (c/a ratio in this case). Without the Up, among all integer Ud values, Ud = 7 eV produces a band gap of 3.243 eV, close to the experimental value with just a 1.3% difference between the predicted and the experimentally measured band gap. Similar to rutile TiO2, we obtain more accurate band gap predictions when introducing Up in addition to Ud. Fig. 2 shows that the (Up, Ud) integer pairs of (7 eV, 5 eV) and (3 eV, 6 eV) have a calculated band gap of 3.201 eV (% difference of 0.0%; Fig. S17, ESI†) and % difference in c/a of 0.9% and 0.5% respectively. Considering the deviation in both band gap and lattice parameters, our results predicted that the (Up, Ud) integer pair of (3 eV, 6 eV) represents the optimal integer Up and Ud values, which results in a band gap of 3.201 eV and lattice constants a = b = 3.897 Å, c = 9.846 Å.
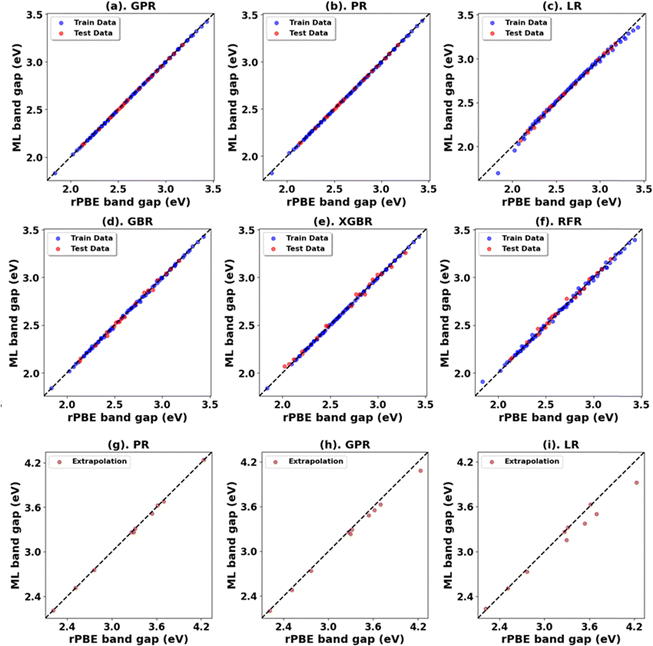
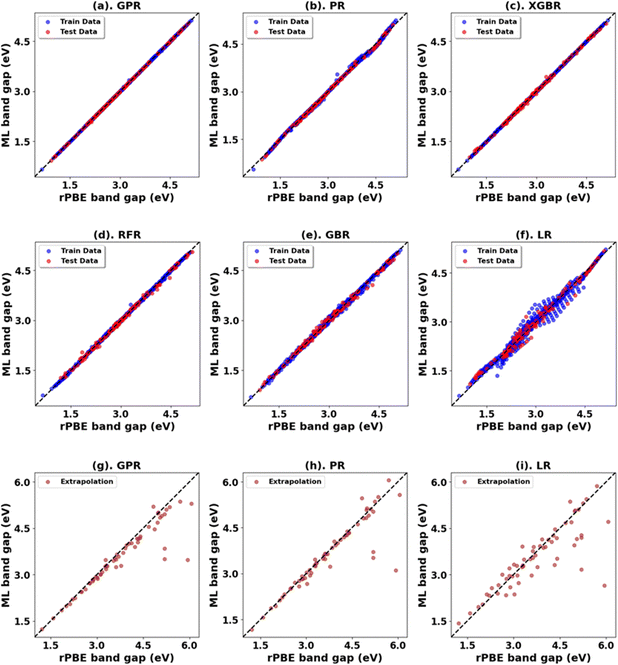
Fig. 3, 4 and Tables 1, 3 (Fig. S7, S9, S21, S23, and Tables S1, S2, S7, S8, ESI†) showcase the result of our supervised ML models to predict the band gap and lattice constants of rutile and anatase TiO2. An asterisk (*) indicates the best model for the initial range of U values. Although GPR performs best, slightly better than PR in the initial range of U values, PR performs better in new unseen data outside our initial range (extrapolation), suggesting that the PR model can be used to accurately predict the band gap and lattice constant of TiO2, representing a robust and much faster computational approach (compared to traditional DFT+U calculations) to predict the band gap and lattice constants for any combination of Up and Ud.
| Oxide | Model | Initial range | Extrapolation | ||||||
|---|---|---|---|---|---|---|---|---|---|
| MSE (eV2) | RMSE (eV) | MAE (eV) | R 2 | MSE (eV2) | RMSE (eV) | MAE (eV) | R 2 | ||
| Rutile TiO2 | PR | 0.00 | 0.00 | 0.00 | 1.00 | 0.00 | 0.02 | 0.01 | 1.00 |
| *GPR | 0.00 | 0.00 | 0.00 | 1.00 | 0.00 | 0.06 | 0.05 | 0.99 | |
| LR | 0.00 | 0.03 | 0.02 | 0.99 | 0.02 | 0.13 | 0.09 | 0.94 | |
| GBR | 0.00 | 0.03 | 0.02 | 0.99 | 0.15 | 0.38 | 0.31 | 0.55 | |
| XGBR | 0.00 | 0.04 | 0.03 | 0.99 | 0.15 | 0.38 | 0.32 | 0.55 | |
| RFR | 0.00 | 0.04 | 0.03 | 0.98 | 0.16 | 0.39 | 0.32 | 0.52 | |
Using the minimization technique discussed in our methodology to optimize U with a higher precision of ∼0.01 eV, we obtained the results shown in Tables 2 and 4. When weight is applied only to the band gap, we quickly notice that the optimized U values vary greatly depending on the random initial conditions. This suggests that multiple pairs of U values can accurately predict the band gap, albeit with varying deviations in lattice constants from experimental data. The higher the precision, the greater the number of possible pairs. This phenomenon is not observed when Up is fixed at 0.00 eV. Applying equal weight to the band gap and lattice constants introduces constraints, leading to U pairs that minimize deviations from both experimental band gaps and lattice constants. Under this constraint, we observe a much larger converged Up value.
| Oxide | Weights [Eg, a, b, c] | Converged Up![[thin space (1/6-em)]](https://www.rsc.org/images/entities/char_2009.gif) : :![[thin space (1/6-em)]](https://www.rsc.org/images/entities/char_2009.gif) Ud (eV) Ud (eV) |
rPBE Eg (eV) | rPBE [a = b, c] (Å) | % Difference Eg | % Difference [a = b, c] |
|---|---|---|---|---|---|---|
| Rutile TiO2 | 1, 0, 0, 0 | 0.00![[thin space (1/6-em)]](https://www.rsc.org/images/entities/char_2009.gif) : :![[thin space (1/6-em)]](https://www.rsc.org/images/entities/char_2009.gif) 10.52 10.52 |
3.039 | 4.7499, 3.1108 | 0.3 | 3.4, 5.0 |
| 1, 0, 0, 0 | 13.20![[thin space (1/6-em)]](https://www.rsc.org/images/entities/char_2009.gif) : :![[thin space (1/6-em)]](https://www.rsc.org/images/entities/char_2009.gif) 6.08 6.08 |
3.038 | 4.6585, 3.0355 | 0.3 | 1.4, 2.5 | |
| 1, 1, 1, 1 | 20.89![[thin space (1/6-em)]](https://www.rsc.org/images/entities/char_2009.gif) : :![[thin space (1/6-em)]](https://www.rsc.org/images/entities/char_2009.gif) 3.13 3.13 |
3.067 | 4.5909, 2.9806 | 1.2 | −0.0, 0.7 |
| Oxide | Model | Initial range | Extrapolation | ||||||
|---|---|---|---|---|---|---|---|---|---|
| MSE (eV2) | RMSE (eV) | MAE (eV) | R 2 | MSE (eV2) | RMSE (eV) | MAE (eV) | R 2 | ||
| Anatase TiO2 | PR | 0.00 | 0.00 | 0.00 | 1.00 | 0.00 | 0.03 | 0.02 | 1.00 |
| *GPR | 0.00 | 0.00 | 0.00 | 1.00 | 0.00 | 0.07 | 0.05 | 0.99 | |
| LR | 0.00 | 0.03 | 0.02 | 0.99 | 0.02 | 0.13 | 0.09 | 0.95 | |
| GBR | 0.00 | 0.03 | 0.02 | 0.99 | 0.15 | 0.39 | 0.30 | 0.56 | |
| XGBR | 0.00 | 0.03 | 0.02 | 0.99 | 0.15 | 0.39 | 0.32 | 0.55 | |
| RFR | 0.00 | 0.04 | 0.03 | 0.99 | 0.16 | 0.40 | 0.31 | 0.53 | |
| Oxide | Weights [Eg, a, b, c] | Converged Up![[thin space (1/6-em)]](https://www.rsc.org/images/entities/char_2009.gif) : :![[thin space (1/6-em)]](https://www.rsc.org/images/entities/char_2009.gif) Ud (eV) Ud (eV) |
rPBE Eg (eV) | rPBE [a = b, c] (Å) | % Difference Eg | % Difference [a = b, c] |
|---|---|---|---|---|---|---|
| Anatase TiO2 | 1, 0, 0, 0 | 0.00![[thin space (1/6-em)]](https://www.rsc.org/images/entities/char_2009.gif) : :![[thin space (1/6-em)]](https://www.rsc.org/images/entities/char_2009.gif) 6.72 6.72 |
3.206 | 3.9152, 9.8709 | 0.2 | 3.4, 3.7 |
| 1, 0, 0, 0 | 11.43![[thin space (1/6-em)]](https://www.rsc.org/images/entities/char_2009.gif) : :![[thin space (1/6-em)]](https://www.rsc.org/images/entities/char_2009.gif) 3.72 3.72 |
3.194 | 3.8350, 9.7753 | 0.2 | 1.3, 2.8 | |
| 1, 1, 1, 1 | 17.04![[thin space (1/6-em)]](https://www.rsc.org/images/entities/char_2009.gif) : :![[thin space (1/6-em)]](https://www.rsc.org/images/entities/char_2009.gif) 1.98 1.98 |
3.195 | 3.7848, 9.7221 | 0.2 | 0.0, 2.2 |
3.2. Cubic ZnO
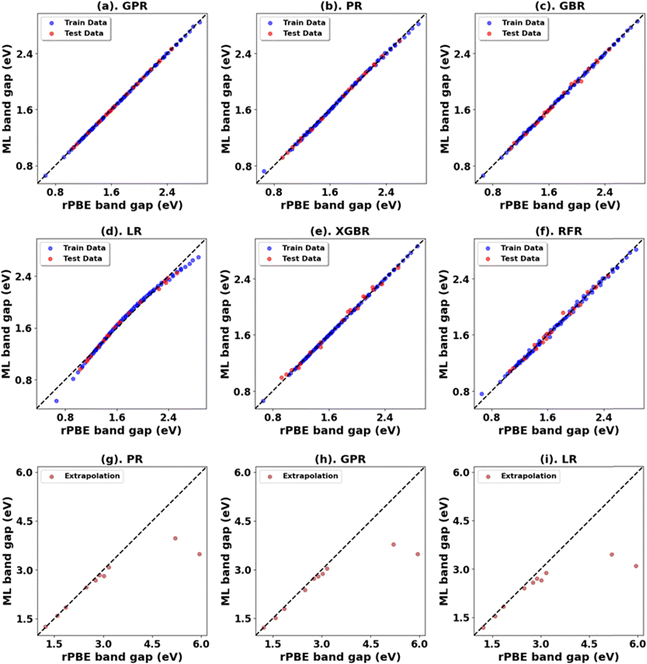
Fig. 5 presents the Hubbard U parameter optimization for band gap and lattice constant predictions in c-ZnO. Experimental measurements have predicted the band gap of c-ZnO to be ∼3.370 eV, with lattice constants (a = b = c) of 4.630 Å.77 Standard DFT calculations underestimate the band gap at 0.615 eV and predict lattice constants close to experimental values at a = b = c = 4.629 Å. Without Up, the closest prediction to the experimental band gap comes from a Ud value of 10 eV, resulting in a band gap of 2.250 eV, a |33.2|% deviation from the experimental value. Introducing Up allows for a more accurate band gap prediction; for example, the (Up, Ud) integer pair of (10 eV, 10 eV) yields a band gap of 2.864 eV, a |15|% deviation from the experimental value, also predicting the lattice constant (a = b = c) to be 4.394 Å, a |5.1|% deviation to experiments.The ML analysis depicted in Fig. 6 and Table 5 reveals that PR is the superior model for predicting the band gap of c-ZnO using Up and Ud as features. However, it exhibits significantly higher error rates and a poorer fit than rutile and anatase TiO2. The analysis of predictions outside the initial training and test sets suggests that while a quadratic trend may be closely followed within the original range of Up and Ud values, deviations occur with larger Up and Ud values, leading to less favorable predictions in the band gap and lattice constants.
| Oxide | Model | Initial range | Extrapolation | ||||||
|---|---|---|---|---|---|---|---|---|---|
| MSE (eV2) | RMSE (eV) | MAE (eV) | R 2 | MSE (eV2) | RMSE (eV) | MAE (eV) | R 2 | ||
| c-ZnO | PR | 0.00 | 0.02 | 0.01 | 1.00 | 0.75 | 0.87 | 0.41 | 0.63 |
| *GPR | 0.00 | 0.01 | 0.00 | 1.00 | 0.80 | 0.90 | 0.45 | 0.60 | |
| LR | 0.00 | 0.05 | 0.04 | 0.99 | 1.14 | 1.07 | 0.58 | 0.44 | |
| GBR | 0.00 | 0.04 | 0.03 | 0.99 | 2.00 | 1.41 | 0.84 | 0.02 | |
| XGBR | 0.00 | 0.05 | 0.04 | 0.99 | 2.00 | 1.41 | 0.86 | 0.02 | |
| RFR | 0.00 | 0.06 | 0.05 | 0.98 | 2.02 | 1.42 | 0.86 | 0.01 | |
Given the difficulties in accurately predicting the band gap of c-ZnO with the initial range of integer Up and Ud values, which spanned from 0 eV to 10 eV for Up and 2 eV to 10 eV for Ud – we utilized the PR model, to optimize U to integer precision. When setting Up to zero, the (Up, Ud) integer pair of (0 eV, 13 eV) resulted in a lattice constant of 4.259 Å and a band gap of 3.396 eV, showing deviations from experimental results of approximately |8.0|% and 0.8%, respectively. With the inclusion of a non-zero Up, the (6 eV, 12 eV) pair led to a lattice constant of 4.302 Å and a band gap of 3.314 eV (Fig. S36, ESI†), indicating deviations from experimental values of approximately |7.1|% for the lattice constants and |1.7|% for the band gap. Our analysis and calculations suggest that an (Up, Ud) integer pair of (6 eV, 12 eV) is a judicious choice for accurately predicting both the lattice parameters and the band gap of c- ZnO.
Utilizing the U values optimized to ∼0.01 eV obtained from the minimization (Table 6), we get better results in the predictions of the band gap and lattice constants, albeit with much more deviations from experiments than in rutile and anatase TiO2, possibly due to less favorable predictions from the underlining PR model used in the optimization. Larger Up values are also noticed in cases with equal weights.
| Oxide | Weights [Eg, a, b, c] | Converged Up![[thin space (1/6-em)]](https://www.rsc.org/images/entities/char_2009.gif) : :![[thin space (1/6-em)]](https://www.rsc.org/images/entities/char_2009.gif) Ud (eV) Ud (eV) |
rPBE Eg (eV) | rPBE [a = b, c] (Å) | % Difference Eg | % Difference [a = b, c] |
|---|---|---|---|---|---|---|
| c-ZnO | 1, 0, 0, 0 | 0.00![[thin space (1/6-em)]](https://www.rsc.org/images/entities/char_2009.gif) : :![[thin space (1/6-em)]](https://www.rsc.org/images/entities/char_2009.gif) 11.97 11.97 |
2.878 | 4.2520 | 14.6 | −8.2 |
| 1, 0, 0, 0 | 6.97![[thin space (1/6-em)]](https://www.rsc.org/images/entities/char_2009.gif) : :![[thin space (1/6-em)]](https://www.rsc.org/images/entities/char_2009.gif) 11.32 11.32 |
3.091 | 4.3426 | 8.3 | −6.2 | |
| 1, 1, 1, 1 | 25.82![[thin space (1/6-em)]](https://www.rsc.org/images/entities/char_2009.gif) : :![[thin space (1/6-em)]](https://www.rsc.org/images/entities/char_2009.gif) 5.86 5.86 |
3.202 | 4.4250 | 5.0 | −4.4 |
3.3. Cubic ZnO2
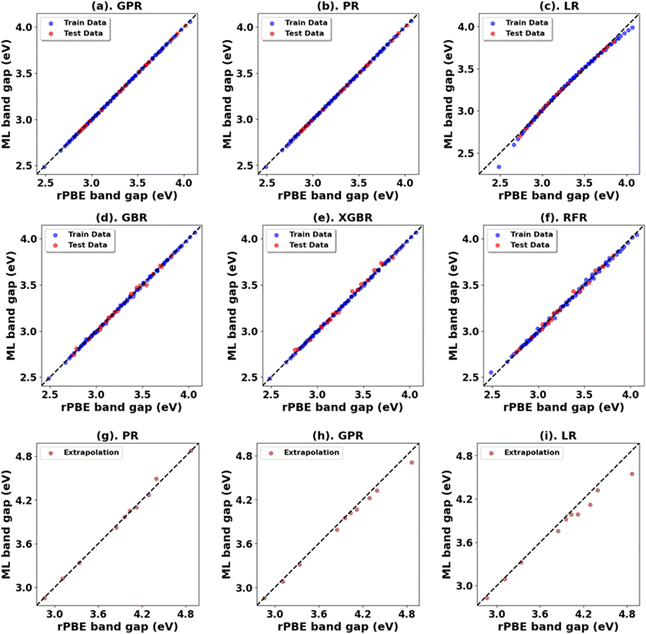
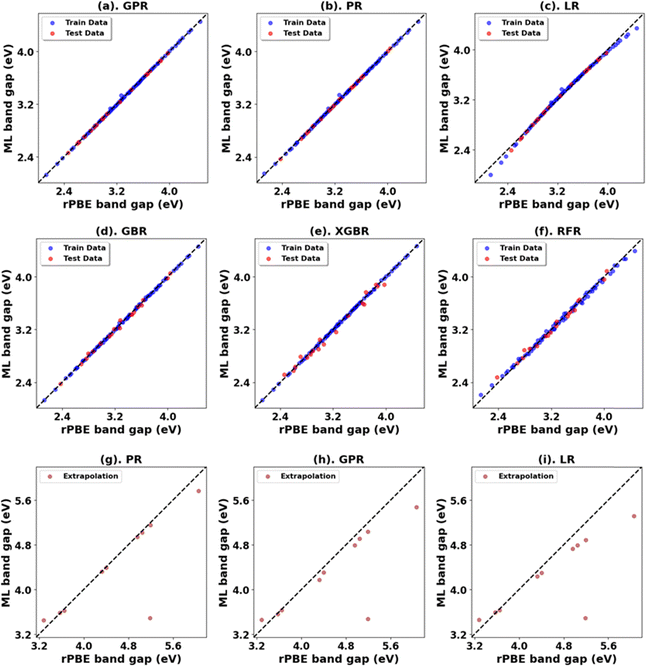
Similar to other oxide systems, DFT+U and ML schemes were employed to select Up and Ud values for c-ZnO2 to predict the band gap and lattice parameters close to the experimental values. The results obtained from our Hubbard U parameter optimization for band gap and lattice constant predictions are shown in Fig. 7. Consistent with the previous DFT predictions, it is noted that standard DFT significantly underestimates the band gap (2.130 eV vs. an experimental value of ∼4.500 eV) and slightly overestimates the lattice constant (5.020 Å vs. the experimental lattice constants of 4.871 Å).78–80 The closest band gap prediction to experimental results, with an Up of zero, is achieved for Ud = 10 eV, yielding a band gap of 2.981 eV (|33.8|% error) but with a % difference in lattice parameter of |1.22|% from experimental values at 4.811 Å. Incorporating Up, the (Up, Ud) integer pair of (10 eV, 10 eV) narrows the error to |0.8|% with a band gap of 4.464 eV (Fig. S46, ESI†), albeit with a |2.3|% deviation in lattice constants at 4.761 Å. Thus, our calculations suggest that the (Up, Ud) integer pair of (10 eV, 10 eV) is a reasonable choice of (Up, Ud) values for accurately predicting the band gap and lattice parameters of c-ZnO2.The ML analysis is shown in Fig. 8 and Table 7. PR stands out as the better model, albeit with a less favorable prediction outside our initial range of data, similar to the result in c-ZnO. We refined the band gap prediction for c-ZnO2 employing a technique like the one used for c-ZnO. With Up set to zero, the (Up, Ud) integer pair of (0 eV, 13 eV) provided predictions that closely matched experimental values, yielding a band gap of 3.381 eV and a lattice constant of 4.635 Å. Nevertheless, these results showed deviations from experimental measurements, with |24.9|% for the band gap and |4.9|% for the lattice constant. Based on our calculations, the (Up, Ud) integer pair of (10 eV, 10 eV) emerges as a sensible choice for U, enabling accurate predictions of both the lattice parameters and the band gap of c-ZnO2. Optimizing the U values to a higher precision, we get better DFT+U predictions in line with experiments (Table 8).
| Oxide | Model | Initial range | Extrapolation | ||||||
|---|---|---|---|---|---|---|---|---|---|
| MSE (eV2) | RMSE (eV) | MAE (eV) | R 2 | MSE (eV2) | RMSE (eV) | MAE (eV) | R 2 | ||
| c-ZnO2 | PR | 0.00 | 0.01 | 0.01 | 1.00 | 0.30 | 0.55 | 0.23 | 0.57 |
| *GPR | 0.00 | 0.01 | 0.01 | 1.00 | 0.34 | 0.58 | 0.32 | 0.51 | |
| LR | 0.00 | 0.04 | 0.03 | 0.99 | 0.37 | 0.61 | 0.36 | 0.47 | |
| GBR | 0.00 | 0.04 | 0.03 | 0.99 | 1.03 | 1.01 | 0.78 | −0.48 | |
| XGBR | 0.00 | 0.06 | 0.06 | 0.98 | 1.03 | 1.02 | 0.79 | −0.48 | |
| RFR | 0.01 | 0.07 | 0.06 | 0.98 | 1.07 | 1.03 | 0.80 | −0.53 | |
| Oxide | Weights [Eg, a, b, c] | Converged Up![[thin space (1/6-em)]](https://www.rsc.org/images/entities/char_2009.gif) : :![[thin space (1/6-em)]](https://www.rsc.org/images/entities/char_2009.gif) Ud (eV) Ud (eV) |
rPBE Eg (eV) | rPBE [a = b, c] (Å) | % Difference Eg | % Difference [a = b, c] |
|---|---|---|---|---|---|---|
| c-ZnO2 | 1, 0, 0, 0 | 0.00![[thin space (1/6-em)]](https://www.rsc.org/images/entities/char_2009.gif) : :![[thin space (1/6-em)]](https://www.rsc.org/images/entities/char_2009.gif) 15.30 15.30 |
5.049 | 4.1441 | 12.2 | −14.9 |
| 1, 0, 0, 0 | 9.75![[thin space (1/6-em)]](https://www.rsc.org/images/entities/char_2009.gif) : :![[thin space (1/6-em)]](https://www.rsc.org/images/entities/char_2009.gif) 10.15 10.15 |
4.443 | 4.7558 | 1.3 | −2.4 | |
| 1, 1, 1, 1 | 13.63![[thin space (1/6-em)]](https://www.rsc.org/images/entities/char_2009.gif) : :![[thin space (1/6-em)]](https://www.rsc.org/images/entities/char_2009.gif) 5.88 5.88 |
4.567 | 4.8677 | 1.0 | −0.1 |
3.4. Cubic ZrO2
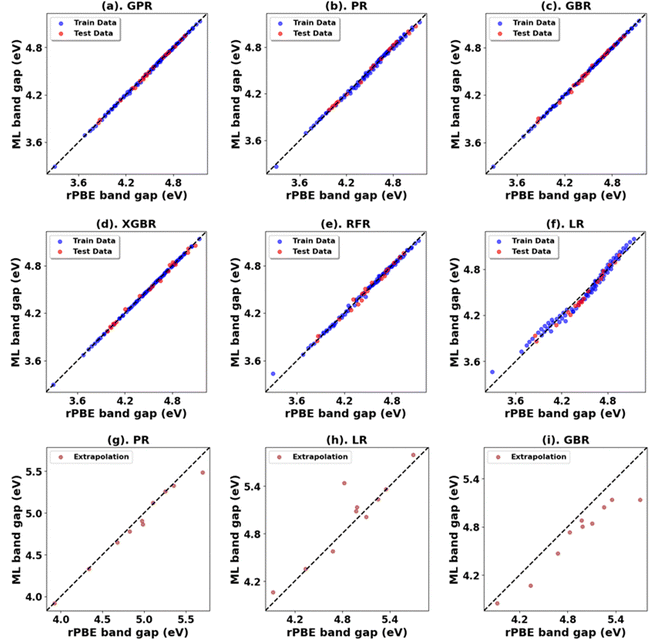
The results for Hubbard U parameter optimization for band gap and lattice constant predictions in c-ZrO2 are presented in Fig. 9. As expected, standard DFT underestimates the band gap at 3.295 eV compared to the experimental value of ∼4.600 eV. It slightly overestimates lattice constants at 5.152 Å when compared to the experimental lattice constant of 5.119 Å.32,81,82 Our calculations show that the Ud value of 9 eV, with an Up of zero, predicts a band gap of 4.638 eV and a lattice constant of 5.282 eV, with the band gap matching closely with the experimental band gap with a small error of 0.8%, with lattice constant deviation of 3.2% from the experimental value. Introducing a non-zero Up value, the (Up, Ud) integer pair of (9 eV, 5 eV) yields a band gap prediction of 4.589 eV (Fig. S56, ESI†) with a |0.2|% deviation and lattice constant of 5.184 Å with a |1.26|% deviation from the experimental values. Hence, our calculations illustrate that the (Up, Ud) integer pair of (9 eV, 5 eV) values are the optimal values of Up and Ud to predict the band gap and lattice constant of c-ZrO2 with reasonable accuracy. These results are consistent with findings in a recent report by Gebauer.32The performance of our ML models in accurately predicting the band gap and lattice constants of c-ZrO2 is summarized in Fig. 10, and Table 9 (Fig. S54 and Table S23, ESI†). PR remains the best choice model for predictions. Unlike c-ZnO and c-ZnO2, where more significant Up and Ud values led to prediction challenges, c-ZrO2 maintains predictive accuracy even at higher Ud and Up values, like rutile and anatase TiO2. This improves the accuracy of the optimized high-precision U values to produce results close to experiments, as shown in Table 10.
| Oxide | Model | Initial range | Extrapolation | ||||||
|---|---|---|---|---|---|---|---|---|---|
| MSE (eV2) | RMSE (eV) | MAE (eV) | R 2 | MSE (eV2) | RMSE (eV) | MAE (eV) | R 2 | ||
| c-ZrO2 | PR | 0.00 | 0.02 | 0.02 | 1.00 | 0.01 | 0.08 | 0.05 | 0.97 |
| LR | 0.00 | 0.06 | 0.05 | 0.97 | 0.05 | 0.22 | 0.14 | 0.80 | |
| *GBR | 0.00 | 0.04 | 0.02 | 0.99 | 0.06 | 0.25 | 0.22 | 0.73 | |
| RFR | 0.00 | 0.05 | 0.04 | 0.98 | 0.08 | 0.28 | 0.24 | 0.67 | |
| XGBR | 0.00 | 0.05 | 0.03 | 0.98 | 0.08 | 0.28 | 0.25 | 0.67 | |
| GPR | 0.00 | 0.02 | 0.01 | 1.00 | 0.11 | 0.33 | 0.25 | 0.54 | |
| Oxide | Weights [Eg, a, b, c] | Converged Up![[thin space (1/6-em)]](https://www.rsc.org/images/entities/char_2009.gif) : :![[thin space (1/6-em)]](https://www.rsc.org/images/entities/char_2009.gif) Ud (eV) Ud (eV) |
rPBE Eg (eV) | rPBE [a = b, c] (Å) | % Difference Eg | % Difference [a = b, c] |
|---|---|---|---|---|---|---|
| c-ZrO2 | 1, 0, 0, 0 | 0.00![[thin space (1/6-em)]](https://www.rsc.org/images/entities/char_2009.gif) : :![[thin space (1/6-em)]](https://www.rsc.org/images/entities/char_2009.gif) 8.40 8.40 |
4.582 | 5.2733 | −0.4 | 3.0 |
| 1, 0, 0, 0 | 4.45![[thin space (1/6-em)]](https://www.rsc.org/images/entities/char_2009.gif) : :![[thin space (1/6-em)]](https://www.rsc.org/images/entities/char_2009.gif) 6.86 6.86 |
4.592 | 5.2326 | −0.3 | 2.2 | |
| 1, 1, 1, 1 | 15.80![[thin space (1/6-em)]](https://www.rsc.org/images/entities/char_2009.gif) : :![[thin space (1/6-em)]](https://www.rsc.org/images/entities/char_2009.gif) 3.15 3.15 |
4.617 | 5.1180 | 0.4 | −0.0 |
3.5. Cubic CeO2
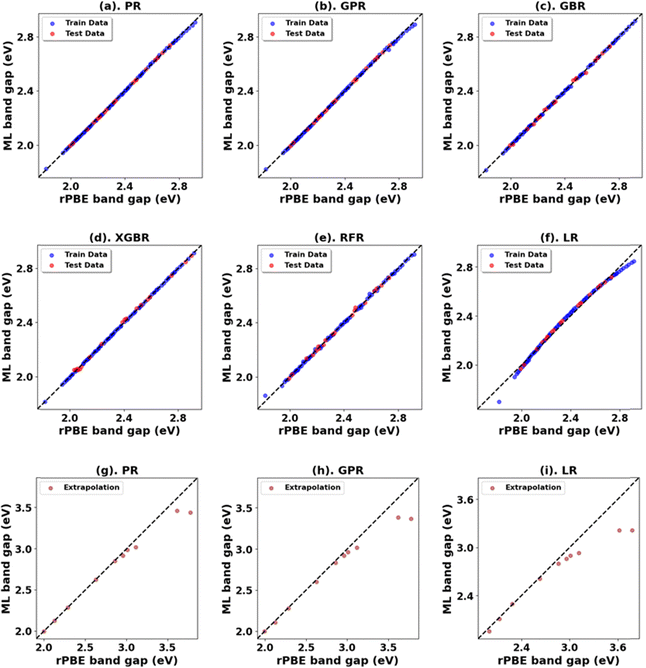
Hubbard U parameter optimization for c-CeO2, as demonstrated in Fig. 11, highlights the limitations of standard DFT by showcasing an underestimated band gap of 1.816 eV, compared to the experimental band gap of ∼3.200 eV, and an overestimated lattice constant of 5.506 Å against the experimental measure of 5.411 Å.83,84 Setting Uf to 10 eV while keeping Up at zero, the % difference between the computed (2.724 eV) and experimental values of the band gap is |14.9|, and the % difference in lattice constant is 2.9% at 5.568 Å. The introduction of a non-zero Up value; specifically the (Up, Uf) integer pair of (10 eV, 10 eV), reduces the deviation in band gap (2.917 eV) prediction to |8.8|% compared to the experimental value and deviation in lattice constant (5.533 Å) to 2.2% compared to the experimentally measured value.For the ML analysis, as shown in Table 11, PR remains the preferred prediction model. Employing a strategy like in c-ZnO2/c-ZnO, the (Up, Uf) integer pair of (0 eV, 13 eV), with Up, set to zero, was notable for yielding a band gap of 3.286 eV and a lattice constant of 5.584 Å, exhibiting deviations from experimental values of |2.7|% and |3.2|%, respectively. Additionally, when employing a non-zero Up, the (7 eV, 12 eV) integer pair closely approximated the experimental band gap with a predicted value of 3.209 eV (Fig. S66, ESI†), deviating by only |0.3|% from experimental data alongside a lattice constant deviation of |2.4|% at 5.543 Å. Therefore, the (Up, Uf) integer pair of (7 eV, 12 eV) emerges as the best choice for the U parameters, enabling accurate predictions of the band gap of c-CeO2 with minimal deviations in lattice constants from experiments. The optimized high-precision U values in Table 12 enhance the predictions; however, applying equal weights to both the band gap and lattice constants results in an unusually large Up value, causing the subsequent validating DFT+U calculation to fail in performing structure optimizations (Fig. 12).
| Oxide | Model | Initial range | Extrapolation | ||||||
|---|---|---|---|---|---|---|---|---|---|
| MSE (eV2) | RMSE (eV) | MAE (eV) | R 2 | MSE (eV2) | RMSE (eV) | MAE (eV) | R 2 | ||
| c-CeO2 | *PR | 0.00 | 0.00 | 0.00 | 1.00 | 0.01 | 0.12 | 0.06 | 0.95 |
| GPR | 0.00 | 0.01 | 0.00 | 1.00 | 0.02 | 0.15 | 0.09 | 0.93 | |
| LR | 0.00 | 0.03 | 0.02 | 0.99 | 0.05 | 0.23 | 0.15 | 0.83 | |
| GBR | 0.00 | 0.01 | 0.01 | 1.00 | 0.18 | 0.42 | 0.27 | 0.44 | |
| RFR | 0.00 | 0.02 | 0.01 | 0.99 | 0.18 | 0.42 | 0.28 | 0.43 | |
| XGBR | 0.00 | 0.02 | 0.01 | 0.99 | 0.18 | 0.42 | 0.28 | 0.43 | |
| Oxide | Weights [Eg, a, b, c] | Converged Up![[thin space (1/6-em)]](https://www.rsc.org/images/entities/char_2009.gif) : :![[thin space (1/6-em)]](https://www.rsc.org/images/entities/char_2009.gif) Uf (eV) Uf (eV) |
rPBE Eg (eV) | rPBE [a = b, c] (Å) | % Difference Eg | % Difference [a = b, c] |
|---|---|---|---|---|---|---|
| c-CeO2 | 1, 0, 0, 0 | 0.00![[thin space (1/6-em)]](https://www.rsc.org/images/entities/char_2009.gif) : :![[thin space (1/6-em)]](https://www.rsc.org/images/entities/char_2009.gif) 12.62 12.62 |
3.205 | 5.5816 | 0.2 | 3.1 |
| 1, 0, 0, 0 | 7.61![[thin space (1/6-em)]](https://www.rsc.org/images/entities/char_2009.gif) : :![[thin space (1/6-em)]](https://www.rsc.org/images/entities/char_2009.gif) 11.90 11.90 |
3.202 | 5.5521 | 0.1 | 2.6 | |
| 1, 1, 1, 1 | 31.44![[thin space (1/6-em)]](https://www.rsc.org/images/entities/char_2009.gif) : :![[thin space (1/6-em)]](https://www.rsc.org/images/entities/char_2009.gif) 7.89 7.89 |
N/A | N/A | N/A | N/A |
3.6. Further analysis
We trained the ML model on all the DFT+U calculations obtained for the six primary oxides in this study. The results in Table 13 and Fig. 13 (Fig. S71, S72, and Tables S34, S35, ESI†) show that the GPR is the preferred prediction model when predicting the rPBE band gap and lattice parameters across the six primary metal oxides. Fig. S73–S75 (ESI†) show the feature importance of the model based on the features (Table S33, ESI†) used in training the model to predict bulk properties.| Oxides | Model | Initial range | Extrapolation | ||||||
|---|---|---|---|---|---|---|---|---|---|
| MSE (eV2) | RMSE (eV) | MAE (eV) | R 2 | MSE (eV2) | RMSE (eV) | MAE (eV) | R 2 | ||
| All six (6) primary metal oxides in this study | *GPR | 0.00 | 0.01 | 0.00 | 1.00 | 0.21 | 0.46 | 0.22 | 0.83 |
| PR | 0.00 | 0.04 | 0.02 | 1.00 | 0.24 | 0.49 | 0.19 | 0.81 | |
| LR | 0.02 | 0.14 | 0.10 | 0.98 | 0.43 | 0.65 | 0.37 | 0.66 | |
| XGBR | 0.00 | 0.04 | 0.03 | 1.00 | 0.60 | 0.77 | 0.47 | 0.53 | |
| RFR | 0.00 | 0.06 | 0.04 | 1.00 | 0.61 | 0.78 | 0.47 | 0.52 | |
| GBR | 0.01 | 0.07 | 0.05 | 0.99 | 0.62 | 0.78 | 0.47 | 0.52 | |
Expanding the dataset to 38 oxides, we validated the retrained models on three unseen systems: monoclinic-ZrO2 (mp-2858), orthorhombic-TiO2 (mp-1840), and tetragonal-WO3 (mp-2235359). The RFR model performed best (Fig. 14 and Table 14) for band gap predictions, demonstrating strong generalization across varying crystal structures. Using the expanded dataset, the RFR model also predicted both band gaps and lattice parameters (a, b, c) with high accuracy across all 38 metal oxides (Fig. S76–S79, ESI,†Fig. 15 and Table 15).
 | ||
| Fig. 14 (a)–(c) Top three ML models for band gap prediction of test metal oxides using elemental, structural, and chemical descriptors. | ||
| Test oxides | Model | Evaluation (test) | |||
|---|---|---|---|---|---|
| MSE (eV2) | RMSE (eV) | MAE (eV) | R 2 | ||
| m-ZrO2 | RFR | 0.02 | 0.15 | 0.12 | 0.99 |
| o-TiO2 | DTR | 0.03 | 0.16 | 0.11 | 0.98 |
| t-WO3 | GPR | 0.03 | 0.17 | 0.14 | 0.98 |
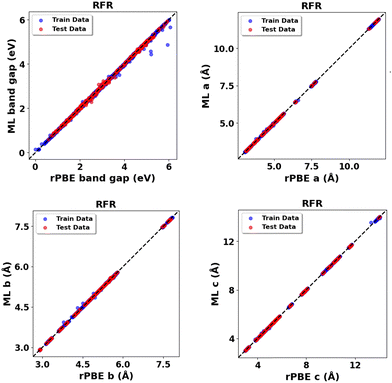 | ||
| Fig. 15 RFR predictions vs. rPBE calculated bulk properties across all thirty-eight (38) metal oxides: band gap (Eg) and lattice parameters (a, b, c). | ||
| Bulk properties | Data (average) | MSE | RMSE | MAE | R 2 |
|---|---|---|---|---|---|
| E g (eV) | Train | 0.00 eV2 | 0.03 eV | 0.01 eV | 1.00 |
| Test | 0.01 eV2 | 0.07 eV | 0.03 eV | 1.00 | |
| a (Å) | Train | 0.00 Å2 | 0.01 Å | 0.00 Å | 1.00 |
| Test | 0.00 Å2 | 0.01 Å | 0.00 Å | 1.00 | |
| b (Å) | Train | 0.00 Å2 | 0.01 Å | 0.00 Å | 1.00 |
| Test | 0.00 Å2 | 0.02 Å | 0.00 Å | 1.00 | |
| c (Å) | Train | 0.00 Å2 | 0.01 Å | 0.00 Å | 1.00 |
| Test | 0.00 Å2 | 0.02 Å | 0.00 Å | 1.00 |
These results highlight the potential of increasing data diversity to improve model performance, while showcasing the utility of simple supervised machine learning models for property predictions and parameter optimization in metal oxides. Building on this, our findings demonstrate that achieving bandgap and lattice parameters closer to experimental values is possible when using both Up and Ud/f, compared to the treatment of Ud/f alone. Higher values of Ud/f tend to lead to larger lattice parameters that deviate from experimental values, consistent with previous studies.31 However, for most oxides reported here, optimizing to an accurate description of the lattice parameter with U values less than 0.01 eV favors an unphysically high Up value. This trend arises because increasing Up, regardless of the Ud/f value, decreases the lattice parameter, this behavior may reflect context-specific limitations of the orbital truncation scheme used by VASP.85
One possible explanation relates to the choice of correlated orbitals used by the DFT+U scheme in treating oxygen p-orbitals. As noted by Geneste et al.,86 the DFT+U approach implemented in VASP employs a scheme analogous to renormalized truncated atomic orbitals, which can potentially produce spurious results for lattice parameters (and volume) when Up is applied to oxygen p-orbitals, as opposed to Ud/f for the metal's d or f orbitals. Studies27,85–87 suggest that alternative orbital definitions, such as Wannier orbitals, may yield structural properties more aligned with physical expectations. Resolving this potential intrinsic limitation is significant but falls outside the scope of this study; we emphasize that the physically meaningful choice of correlated orbitals – and thus the resulting Hubbard U parameters, particularly Up for O 2p orbitals – is strongly tied to the definition of the correlated orbitals in VASP. Accordingly, these values may not be universally transferrable or physically meaningful within different implementations or codes, and we advise careful consideration of such context-specific factors when applying or interpreting them. Our developed ML framework and scripts are designed to operate independently of any specific DFT+U implementation. However, because of its extensive use and compatibility with the body of existing literature, our data and findings are consistent with VASP. Future research could expand this framework to include different orbital definitions, like Wannier orbitals, to improve physical accuracy while preserving the flexibility and effectiveness shown here.
4. Conclusions
A combined DFT+U and ML approach is employed to closely predict the experimental band gap and lattice parameters of TiO2 (rutile and anatase), c-ZnO, c-ZnO2, c-CeO2, and c-ZrO2. In general, we find that including Up values for O 2p orbitals, in addition to the Ud/f values of 3d and 4f metal orbitals, improves the prediction of DFT calculations. Our extensive DFT+U calculations predict (Up, Ud/f) integer pairs of (8 eV, 8 eV), (3 eV, 6 eV), (6 eV, 12 eV), (10 eV, 10 eV), (9 eV, 5 eV), and (7 eV, 12 eV) as optimal U values for rutile TiO2, anatase TiO2, c-ZnO, c-ZnO2, c-CeO2, and c-ZrO2, respectively. The resulting % difference in band gap (and lattice constants) using such (Up, Ud/f) pairs are 0.2% (1.3%), 0.0% (0.5%), |1.7|% (|7.1|%), |0.8|% (|2.3|%), |0.2|% (|1.26|%), and |0.3|% (|2.4|%) for rutile TiO2, anatase TiO2, c-ZnO, c-ZnO2, c-CeO2, and c-ZrO2, respectively as shown in Table 16.| Oxide | Calculation method | U p (eV) | U d/f (eV) | a = b (Å) | c (Å) | E g (eV) | % Deviation from exp. Eg | % Deviation from exp. a = b | % Deviation from exp. c |
|---|---|---|---|---|---|---|---|---|---|
| Rutile TiO2 | GGA–PBE | 0 | 0 | 4.646 | 2.968 | 1.826 | −39.7 | 1.1 | 0.2 |
| GGA–PBE+U | 0 | 10 | 4.708 | 3.089 | 2.974 | −1.9 | 2.5 | 4.3 | |
| GGA–PBE+U | 8 | 8 | 4.661 | 3.052 | 3.027 | −0.1 | 1.5 | 3.1 | |
| GGA–rPBE | 0 | 0 | 4.689 | 2.983 | 1.838 | −39.3 | 2.1 | 0.7 | |
| GGA–rPBE+U | 0 | 10 | 4.746 | 3.106 | 2.972 | −1.9 | 3.3 | 4.9 | |
| GGA–rPBE+U | 8 | 8 | 4.699 | 3.069 | 3.037 | 0.2 | 2.3 | 3.6 | |
| Anatase TiO2 | GGA–PBE | 0 | 0 | 3.804 | 9.702 | 2.496 | −22.0 | 0.5 | 2.0 |
| GGA–PBE+U | 0 | 7 | 3.893 | 9.789 | 3.249 | 1.5 | 2.9 | 2.9 | |
| GGA–PBE+U | 3 | 6 | 3.873 | 9.740 | 3.199 | −0.0 | 2.3 | 2.3 | |
| GGA–rPBE | 0 | 0 | 3.829 | 9.802 | 2.486 | −22.3 | 1.2 | 3.1 | |
| GGA–rPBE+U | 0 | 7 | 3.918 | 9.876 | 3.243 | 1.3 | 3.5 | 3.8 | |
| GGA–rPBE+U | 3 | 6 | 3.900 | 9.846 | 3.201 | 0.0 | 2.9 | 3.5 | |
| c-ZnO | GGA–PBE | 0 | 0 | 4.629 | 4.629 | 0.615 | −81.8 | 0.0 | 0.0 |
| GGA–PBE+U | 0 | 13 | 4.172 | 4.172 | 3.663 | 8.7 | −9.9 | −9.9 | |
| GGA–PBE+U | 5 | 12 | 4.243 | 4.243 | 3.374 | 0.1 | −8.4 | −8.4 | |
| GGA–rPBE | 0 | 0 | 4.682 | 4.682 | 0.658 | −80.5 | 1.1 | 1.1 | |
| GGA–rPBE+U | 0 | 13 | 4.259 | 4.259 | 3.396 | 0.8 | −8.0 | −8.0 | |
| GGA–rPBE+U | 6 | 12 | 4.302 | 4.302 | 3.314 | −1.7 | −7.1 | −7.1 | |
| c-ZnO2 | GGA–PBE | 0 | 0 | 4.957 | 4.957 | 2.128 | −52.7 | 1.8 | 1.8 |
| GGA–PBE+U | 0 | 13 | 4.528 | 4.528 | 3.495 | −22.3 | −7.0 | −7.0 | |
| GGA–PBE+U | 10 | 10 | 4.684 | 4.684 | 4.511 | 0.2 | −3.8 | −3.8 | |
| GGA–rPBE | 0 | 0 | 5.020 | 5.020 | 2.13 | −52.7 | 3.1 | 3.1 | |
| GGA–rPBE+U | 0 | 13 | 4.635 | 4.635 | 3.381 | −24.9 | −4.9 | −4.9 | |
| GGA–rPBE+U | 10 | 10 | 4.761 | 4.761 | 4.464 | −0.8 | −2.3 | −2.3 | |
| c-ZrO2 | GGA–PBE | 0 | 0 | 5.118 | 5.118 | 3.307 | −28.1 | 0.0 | 0.0 |
| GGA–PBE+U | 0 | 9 | 5.249 | 5.249 | 4.589 | −0.2 | 2.5 | 2.5 | |
| GGA–PBE+U | 9 | 5 | 5.152 | 5.152 | 4.554 | −1.0 | 0.7 | 0.7 | |
| GGA–rPBE | 0 | 0 | 5.152 | 5.152 | 3.295 | −28.4 | 0.7 | 0.7 | |
| GGA–rPBE+U | 0 | 9 | 5.282 | 5.282 | 4.638 | 0.8 | 3.2 | 3.2 | |
| GGA–rPBE+U | 9 | 5 | 5.184 | 5.184 | 4.589 | −0.2 | 1.3 | 1.3 | |
| c-CeO2 | GGA–PBE | 0 | 0 | 5.464 | 5.464 | 1.871 | −41.5 | 1.0 | 1.0 |
| GGA–PBE+U | 0 | 12 | 5.543 | 5.543 | 3.172 | −0.9 | 2.4 | 2.4 | |
| GGA–PBE+U | 2 | 12 | 5.537 | 5.537 | 3.206 | 0.2 | 2.3 | 2.3 | |
| GGA–rPBE | 0 | 0 | 5.506 | 5.506 | 1.816 | −43.3 | 1.8 | 1.8 | |
| GGA–rPBE+U | 0 | 13 | 5.584 | 5.584 | 3.286 | 2.7 | 3.2 | 3.2 | |
| GGA–rPBE+U | 7 | 12 | 5.543 | 5.543 | 3.209 | 0.3 | 2.4 | 2.4 | |
In addition to explicit DFT+U calculations, we used the dataset generated by the DFT+U calculations to train supervised ML models. Of all the ML models, RFR best predicts the band gap and lattice constant of all 38 metal oxides included in this study as a function of U values. The trained model also has the potential to be applied to other closely related metal oxides not explored here. A possible improvement for future work would involve expanding the training data to include a more diverse set of metal oxides and their polymorphs as well as more chemical and structural descriptors, enhancing the models’ ability to predict the properties of new metal oxides not covered in this study. Our ML analysis showed that simple supervised ML models can closely reproduce these DFT+U results at a fraction of the computational cost and generalize well to related polymorphs. Our approach builds on existing high-throughput DFT+U frameworks by providing fast pre-DFT estimates of structural properties and band gaps. Since this work does not aim to improve the underlying DFT+U method, the ML model shares its limitations. We also note that the reported values of Up strongly depend on the choice of correlated orbitals, and caution is recommended with a different choice of correlated orbitals.
Data availability
The data supporting this article have been included as part of the ESI.†Conflicts of interest
There are no conflicts to declare.Acknowledgements
This work was supported by a National Science Foundation grant: Research Initiation Award (RIA) grant #2503612. The work was supported by the Division of Chemical Sciences, Geosciences, and Biosciences, Office of Basic Energy Sciences, US Department of Energy (DOE) as part of the Accelerate Innovations in Emerging Technologies initiative FWP 101064. This work used computational resources at the San Diego Supercomputer Center (SDSC) through allocation CHE200036 from the Advanced Cyberinfrastructure Coordination Ecosystem: Services & Support (ACCESS) program, which is supported by National Science Foundation grants #2138259, #2138286, #2138307, #2137603, and #2138296. This research used the Theory and Computation facility of the Center for Functional Nanomaterials (CFN), which is a US Department of Energy Office of Science User Facility at Brookhaven National Laboratory under Contract No. DE-SC0012704. This research used resources of the National Energy Research Scientific Computing Center (NERSC), a Department of Energy Office of Science User Facility using NERSC award BES-ERCAP27318.References
- M. S. Chavali and M. P. Nikolova, Metal Oxide Nanoparticles and Their Applications in Nanotechnology, SN Appl. Sci., 2019, 1(6), 607, DOI:10.1007/s42452-019-0592-3.
- D. Dong, S. S. Dhanabalan, P. F. M. Elango, M. Yang, S. Walia, S. Sriram and M. Bhaskaran, Emerging Applications of Metal-Oxide Thin Films for Flexible and Stretchable Electronic Devices, Appl. Phys. Rev., 2023, 10(3), 031314, DOI:10.1063/5.0151297.
- F. T. Geldasa, M. A. Kebede, M. W. Shura and F. G. Hone, Experimental and Computational Study of Metal Oxide Nanoparticles for the Photocatalytic Degradation of Organic Pollutants: A Review, RSC Adv., 2023, 13(27), 18404–18442, 10.1039/d3ra01505j.
- M. Kobayashi, A. Kinoshita, K. Saraswat, H. S. P. Wong and Y. Nishi, Fermi Level Depinning in Metal/Ge Schottky Junction for Metal Source/Drain Ge Metal-Oxide-Semiconductor Field-Effect-Transistor Application, J. Appl. Phys., 2009, 105(2), 023702, DOI:10.1063/1.3065990.
- N. H. Khdary, A. S. Alayyar, L. M. Alsarhan, S. Alshihri and M. Mokhtar, Metal Oxides as Catalyst/Supporter for CO2 Capture and Conversion, Rev. Catal., 2022, 12(3), 300, DOI:10.3390/catal12030300.
- V. Kumar, V. Sharma, H. C. Swart and S. Das, Metal Oxides for Next-Generation Optoelectronic, Photonic, and Photovoltaic Applications; Metal Oxides, Elsevier Science, 1st edn, 2023 Search PubMed.
- S. Laurent, S. Boutry and R. N. Muller, Metal Oxide Particles and Their Prospects for Applications, Iron Oxide Nanoparticles for Biomedical Applications, Elsevier, 2018, pp. 3–42 DOI:10.1016/b978-0-08-101925-2.00001-2.
- Y. Wang, B. Li, B. Zhang, S. Tian, X. Yang, H. Ye, Z. Xia and G. Zheng, Application of MOFs-Derived Mixed Metal Oxides in Energy Storage, J. Electroanal. Chem., 2020, 878, 114576, DOI:10.1016/j.jelechem.2020.114576.
- Y. Yoon, P. L. Truong, D. Lee and S. H. Ko, Metal-Oxide Nanomaterials Synthesis and Applications in Flexible and Wearable Sensors, ACS Nanosci. Au, 2022, 2(2), 64–92, DOI:10.1021/acsnanoscienceau.1c00029.
- M. Hoffmann, A. Ernst, W. Hergert, V. N. Antonov, W. A. Adeagbo, R. M. Geilhufe and H. Ben Hamed, Magnetic and Electronic Properties of Complex Oxides from First-Principles, Phys. Status Solidi B, 2020, 257(7), 1900671, DOI:10.1002/pssb.201900671.
- E. Kiely, R. Zwane, R. Fox, A. M. Reilly and S. Guerin, Density Functional Theory Predictions of the Mechanical Properties of Crystalline Materials, CrystEngComm, 2021, 23(34), 5697–5710, 10.1039/d1ce00453k.
- X. Liu, W. Tang, S. Liu, X. Chen, Y. Li, X. Hu, L. Qiao and Y. Zeng, CO Oxidation on Ni and Cu Embedded Graphdiyne as Efficient Noble Metal-Free Catalysts: A First-Principles Density-Functional Theory Investigation, Appl. Surf. Sci., 2021, 539, 148287, DOI:10.1016/j.apsusc.2020.148287.
- H. Sharifi, P. U. Arumugam and C. D. Wick, The Effect of Pt and IrO2 Interlayers on Enhancing the Adhesion of Ti/SnO2 Interface: A First Principles Density Functional Theory Study, Appl. Surf. Sci., 2023, 639, 158248, DOI:10.1016/j.apsusc.2023.158248.
- H. Tang, H. Berger, P. E. Schmid, F. Lévy and G. Burri, Photoluminescence in TiO2 Anatase Single Crystals, Solid State Commun., 1993, 87(9), 847–850, DOI:10.1016/0038-1098(93)90427-O.
- A. Seidl, A. Görling, P. Vogl, J. Majewski and M. Levy, Generalized Kohn-Sham Schemes and the Band-Gap Problem, Phys. Rev. B: Condens. Matter Mater. Phys., 1996, 53(7), 3764–3774, DOI:10.1103/PhysRevB.53.3764.
- J. P. Perdew and M. Levy, Physical Content of the Exact Kohn-Sham Orbital Energies: Band Gaps and Derivative Discontinuities, Phys. Rev. Lett., 1983, 51(20), 1884–1887, DOI:10.1103/PhysRevLett.51.1884.
- F. I. Ezema; C. D. Lokhande and R. Jose, in Chemically Deposited Nanocrystalline Metal Oxide Thin Films, ed. F. I. Ezema, C. D. Lokhande and R. Jose, Springer International Publishing, Cham, 1st edn, 2021 DOI:10.1007/978-3-030-68462-4.
- A. V. Arbuznikov, Hybrid Exchange Correlation Functionals and Potentials: Concept Elaboration, J. Struct. Chem., 2007, 48(S1), S1–S31, DOI:10.1007/s10947-007-0147-0.
- B. G. Janesko, Replacing Hybrid Density Functional Theory: Motivation and Recent Advances, Chem. Soc. Rev., 2021, 50(15), 8470–8495, 10.1039/d0cs01074j.
- V. I. Anisimov, J. Zaanen and O. K. Andersen, Band Theory and Mott Insulators: Hubbard U Instead of Stoner I, Phys. Rev. B:Condens. Matter Mater. Phys., 1991, 44(3), 943–954, DOI:10.1103/PhysRevB.44.943.
- S. Dudarev and G. Botton, Electron-Energy-Loss Spectra and the Structural Stability of Nickel Oxide: An LSDA+U Study, Phys. Rev. B: Condens. Matter Mater. Phys., 1998, 57(3), 1505–1509, DOI:10.1103/PhysRevB.57.1505.
- B. Himmetoglu, A. Floris, S. De Gironcoli and M. Cococcioni, Hubbard-Corrected DFT Energy Functionals: The LDA+U Description of Correlated Systems, Int. J. Quantum Chem., 2014, 114(1), 14–49, DOI:10.1002/qua.24521.
- D. S. Lambert and D. D. O’Regan, Use of DFT+U+J with Linear Response Parameters to Predict Non-Magnetic Oxide Band Gaps with Hybrid-Functional Accuracy, Phys. Rev. Res., 2023, 5(1), 013160, DOI:10.1103/PhysRevResearch.5.013160.
- K. Harun, N. A. Salleh, B. Deghfel, M. K. Yaakob and A. A. Mohamad, DFT+U Calculations for Electronic, Structural, and Optical Properties of ZnO Wurtzite Structure: A Review, Results Phys., 2020, 16, 102829, DOI:10.1016/j.rinp.2019.102829.
- O. K. Orhan and D. D. O’Regan, First-Principles Hubbard U and Hund's J Corrected Approximate Density Functional Theory Predicts an Accurate Fundamental Gap in Rutile and Anatase TiO2, Phys. Rev. B, 2020, 101(24), 245137, DOI:10.1103/PhysRevB.101.245137.
- E. Torres, I. CheikNjifon, T. P. Kaloni and J. Pencer, A Comparative Analysis of the Phonon Properties in UO2 Using the Boltzmann Transport Equation Coupled with DFT+U and Empirical Potentials, Comput. Mater. Sci., 2020, 177, 109594, DOI:10.1016/j.commatsci.2020.109594.
- J. B. Morée, R. Outerovitch and B. Amadon, First-Principles Calculation of the Coulomb Interaction Parameters U and J for Actinide Dioxides, Phys. Rev. B, 2021, 103(4), 045113, DOI:10.1103/PhysRevB.103.045113.
- G. C. Moore, M. K. Horton, E. Linscott, A. M. Ganose, M. Siron, D. D. O’Regan and K. A. Persson, High-Throughput Determination of Hubbard U and Hund J Values for Transition Metal Oxides via the Linear Response Formalism, Phys. Rev. Mater., 2024, 8(1), 14409, DOI:10.1103/PhysRevMaterials.8.014409.
- J. J. Plata, A. M. Márquez and J. F. Sanz, Communication: Improving the Density Functional Theory+U Description of CeO2 by Including the Contribution of the O 2p Electrons, J. Chem. Phys., 2012, 136(4), 041101, DOI:10.1063/1.3678309.
- S. A. Tolba, K. M. Gameel, B. A. Ali, H. A. Almossalami and N. K. Allam, The DFT+U: Approaches, Accuracy, and Applications, in Density Functional Calculations – Recent Progresses of Theory and Application, ed. G. Yang, InTech, 2018, pp. 3–30 DOI:10.5772/intechopen.72020.
- T. T. Thoa, H. Van Hung and N. T. M. Hue, Study on Structural and Electronic Properties of Rutile TiO2 Using DFT+U Approach, Vietnam J. Chem., 2022, 60(2), 183–189, DOI:10.1002/vjch.202100104.
- R. Gebauer, Oxygen Vacancies in Zirconia and Their Migration: The Role of Hubbard-U Parameters in Density Functional Theory, Crystals, 2023, 13(4), 574, DOI:10.3390/cryst13040574.
- K. J. May and A. M. Kolpak, Improved Description of Perovskite Oxide Crystal Structure and Electronic Properties Using Self-Consistent Hubbard U Corrections from ACBN0, Phys. Rev. B, 2020, 101(16), 165117, DOI:10.1103/PhysRevB.101.165117.
- E. S. Araújo, M. F. G. Pereira, G. M. G. da Silva, G. F. Tavares, C. Y. B. Oliveira and P. M. Faia, A Review on the Use of Metal Oxide-Based Nanocomposites for the Remediation of Organics-Contaminated Water via Photocatalysis: Fundamentals, Bibliometric Study and Recent Advances, Toxics, 2023, 11(8), 658, DOI:10.3390/toxics11080658.
- M. Cococcioni and S. de Gironcoli, Linear Response Approach to the Calculation of the Effective Interaction Parameters in the LDA+U Method, Phys. Rev. B:Condens. Matter Mater. Phys., 2005, 71(3), 035105, DOI:10.1103/PhysRevB.71.035105.
- H. J. Kulik, M. Cococcioni, D. A. Scherlis and N. Marzari, Density Functional Theory in Transition-Metal Chemistry: A Self-Consistent Hubbard U Approach, Phys. Rev. Lett., 2006, 97(10), 103001, DOI:10.1103/PHYSREVLETT.97.103001/FIGURES/3/MEDIUM.
- A. Floris, I. Timrov, B. Himmetoglu, N. Marzari, S. De Gironcoli and M. Cococcioni, Hubbard-Corrected Density Functional Perturbation Theory with Ultrasoft Pseudopotentials, Phys. Rev. B, 2020, 101(6), 064305, DOI:10.1103/PHYSREVB.101.064305/FIGURES/3/MEDIUM.
- F. Aryasetiawan, M. Imada, A. Georges, G. Kotliar, S. Biermann and A. I. Lichtenstein, Frequency-Dependent Local Interactions and Low-Energy Effective Models from Electronic Structure Calculations, Phys. Rev. B: Condens. Matter Mater. Phys., 2004, 70(19), 195104, DOI:10.1103/PhysRevB.70.195104.
- O. Gunnarsson, O. K. Andersen, O. Jepsen and J. Zaanen, Density-Functional Calculation of the Parameters in the Anderson Model: Application to Mn in CdTe, Phys. Rev. B, 1989, 39(3), 1708–1722, DOI:10.1103/PhysRevB.39.1708.
- O. Gunnarsson, Calculation of Parameters in Model Hamiltonians, Phys. Rev. B:Condens. Matter Mater. Phys., 1990, 41(1), 514–518, DOI:10.1103/PhysRevB.41.514.
- M. S. Hybertsen, M. Schlüter and N. E. Christensen, Calculation of Coulomb-Interaction Parameters for La2CuO4 Using a Constrained-Density-Functional Approach, Phys. Rev. B:Condens. Matter Mater. Phys., 1989, 39(13), 9028–9041, DOI:10.1103/PhysRevB.39.9028.
- A. K. McMahan, R. M. Martin and S. Satpathy, Calculated Effective Hamiltonian for La2CuO4 and Solution in the Impurity Anderson Approximation, Phys. Rev. B:Condens. Matter Mater. Phys., 1988, 38(10), 6650–6666, DOI:10.1103/PhysRevB.38.6650.
- V. I. Anisimov and O. Gunnarsson, Density-Functional Calculation of Effective Coulomb Interactions in Metals, Phys. Rev. B: Condens. Matter Mater. Phys., 1991, 43(10), 7570–7574, DOI:10.1103/PhysRevB.43.7570.
- N. J. Mosey and E. A. Carter, Ab Initio Evaluation of Coulomb and Exchange Parameters for DFT+U Calculations, Phys. Rev. B: Condens. Matter Mater. Phys., 2007, 76(15), 155123, DOI:10.1103/PHYSREVB.76.155123/FIGURES/10/MEDIUM.
- L. A. Agapito, S. Curtarolo and M. B. Nardelli, Reformulation of DFT+U as a Pseudohybrid Hubbard Density Functional for Accelerated Materials Discovery, Phys. Rev. X, 2015, 5(1), 011006, DOI:10.1103/PHYSREVX.5.011006/FIGURES/6/MEDIUM.
- N. Tancogne-Dejean and A. Rubio, Parameter-Free Hybrid Functional Based on an Extended Hubbard Model: DFT+U + V, Phys. Rev. B, 2019, 102(15), 155117, DOI:10.1103/PhysRevB.102.155117.
- G. Kresse and J. Hafner, Ab Initio Molecular Dynamics for Liquid Metals, Phys. Rev. B:Condens. Matter Mater. Phys., 1993, 47(1), 558–561, DOI:10.1103/PhysRevB.47.558.
- G. Kresse and J. Hafner, Ab Initio Molecular-Dynamics Simulation of the Liquid-Metalamorphous- Semiconductor Transition in Germanium, Phys. Rev. B:Condens. Matter Mater. Phys., 1994, 49(20), 14251–14269, DOI:10.1103/PhysRevB.49.14251.
- G. Kresse and J. Furthmüller, Efficiency of Ab-Initio Total Energy Calculations for Metals and Semiconductors Using a Plane-Wave Basis Set, Comput. Mater. Sci., 1996, 6(1), 15–50, DOI:10.1016/0927-0256(96)00008-0.
- G. Kresse and J. Furthmüller, Efficient Iterative Schemes for Ab Initio Total-Energy Calculations Using a Plane-Wave Basis Set, Phys. Rev. B: Condens. Matter Mater. Phys., 1996, 54(16), 11169–11186, DOI:10.1103/PhysRevB.54.11169.
- K. G. A. Joubert, From Ultrasoft Pseudopotentials to the Projector Augmented-Wave Method, Phys. Rev. B: Condens. Matter Mater. Phys., 1999, 59(3), 1758–1775 CrossRef.
- B. Hammer, L. B. Hansen and J. K. Nørskov, Improved Adsorption Energetics within Density-Functional Theory Using Revised Perdew-Burke-Ernzerhof Functionals, Phys. Rev. B: Condens. Matter Mater. Phys., 1999, 59(11), 7413–7421, DOI:10.1103/PhysRevB.59.7413.
- J. P. Perdew, K. Burke and M. Ernzerhof, Generalized Gradient Approximation Made Simple, Phys. Rev. Lett., 1996, 77(18), 3865–3868, DOI:10.1103/PhysRevLett.77.3865.
- P. E. Blöchl, Projector Augmented-Wave Method, Phys. Rev. B:Condens. Matter Mater. Phys., 1994, 50(24), 17953–17979, DOI:10.1103/PhysRevB.50.17953.
- A. Jain, S. P. Ong, G. Hautier, W. Chen, W. D. Richards, S. Dacek, S. Cholia, D. Gunter, D. Skinner, G. Ceder and K. A. Persson, Commentary: The Materials Project: A Materials Genome Approach to Accelerating Materials Innovation, APL Mater., 2013, 1(1), 011002, DOI:10.1063/1.4812323.
- A. Jain, S. P. Ong, G. Hautier, W. Chen, W. D. Richards, S. Dacek, S. Cholia, D. Gunter, D. Skinner, G. Ceder and K. A. Persson, Parameters and Convergence – Methodology The Materials Project, APL Mater., 2013, 1(1), 011002, DOI:10.1063/1.4812323/119685.
- A. Jain, S. P. Ong, G. Hautier, W. Chen, W. D. Richards, S. Dacek, S. Cholia, D. Gunter, D. Skinner, G. Ceder and K. A. Persson, Commentary: The Materials Project: A Materials Genome Approach to Accelerating Materials Innovation, APL Mater., 2013, 1(1), 11002, DOI:10.1063/1.4812323/119685.
- P. Burman, A Comparative Study of Ordinary Cross-Validation, v-Fold Cross-Validation and the Repeated Learning-Testing Methods, Biometrika, 1989, 76(3), 503–514, DOI:10.1093/biomet/76.3.503.
- S. Arlot and A. Celisse, A Survey of Cross-Validation Procedures for Model Selection, State Surv., 2010, 4, 40–79, DOI:10.1214/09-SS054.
- L. A. Yates, Z. Aandahl, S. A. Richards and B. W. Brook, Cross Validation for Model Selection: A Review with Examples from Ecology, Ecol. Monogr., 2023, 93(1), e1557, DOI:10.1002/ecm.1557.
- D. Chicco, M. J. Warrens and G. Jurman, The Coefficient of Determination R-Squared Is More Informative than SMAPE, MAE, MAPE, MSE and RMSE in Regression Analysis Evaluation, J. Comput. Sci., 2021, 7, e623, DOI:10.7717/PEERJ-CS.623.
- J. Miles, R-Squared, Adjusted R-Squared, Encyclopedia of Statistics in Behavioral Science, Wiley, 2005 DOI:10.1002/0470013192.bsa526.
- J. Miles, R Squared, Adjusted R Squared, Wiley StatsRef: Statistics Reference Online, ed. B. S. Everitt and D. C. Howell, Wiley, 2014 DOI:10.1002/9781118445112.stat06627.
- C. Sammut and G. I. Webb, Encyclopedia of Machine Learning, ed. C. Sammut and G. I. Webb, Encyclopedia of Machine Learning; Springer US, Boston, MA, 2010 DOI:10.1007/978-0-387-30164-8.
- S. Wright, Correlation and Causation, J. Agric. Res., 1921, 20(3), 557–585 Search PubMed.
- C. E. Rasmussen and C. K. I. Williams, Gaussian Processes for Machine Learning, The MIT Press, 2005 DOI:10.7551/mitpress/3206.001.0001.
- T. Head, M. Kumar, H. Nahrstaedt, G. Louppe and I. Shcherbatyi, Scikit-Optimize/Scikit-Optimize/Skopt.Gp_minimize. Zenodo, 2022 DOI:10.5281/zenodo.6451894.
- J. Wang and L. Luo, A Forecasting Method of Multi-Category Product Sales: Analysis and Application, Manag. Syst. Eng., 2023, 2(1), 2, DOI:10.1007/s44176-023-00012-9.
- WebElements, The periodic table of the elements by WebElements, https://www.webelements.com/, accessed 2024-06-20.
- K. Yang, J. Zheng, Y. Zhao and D. G. Truhlar, Tests of the RPBE, RevPBE, τ-HCTHhyb, Ωb97X-D, and MOHLYP Density Functional Approximations and 29 Others against Representative Databases for Diverse Bond Energies and Barrier Heights in Catalysis, J. Chem. Phys., 2010, 132(16), 164117, DOI:10.1063/1.3382342.
- R. S. Dubey and D. Pradeep, Experimental Study of Rutile Crystalline Phase Titania Nanoparticles via Chemical Route, Mater. Today: Proc., 2019, 18, 402–405, DOI:10.1016/j.matpr.2019.06.317.
- J. Pascual, J. Camassel and H. Mathieu, Fine Structure in the Intrinsic Absorption Edge of TiO2, Phys. Rev. B:Condens. Matter Mater. Phys., 1978, 18(10), 5606–5614, DOI:10.1103/PhysRevB.18.5606.
- U. G. Akpan and B. H. Hameed, Parameters Affecting the Photocatalytic Degradation of Dyes Using TiO2-Based Photocatalysts: A Review, J. Hazard. Mater., 2009, 170(2–3), 520–529, DOI:10.1016/J.JHAZMAT.2009.05.039.
- M. E. Arroyo-De Dompablo, A. Morales-Garca and M. Taravillo, DFTU Calculations of Crystal Lattice, Electronic Structure, and Phase Stability under Pressure of TiO2 Polymorphs, J. Chem. Phys., 2011, 135(5), 54503, DOI:10.1063/1.3617244/190719.
- Ž. Kovačič, B. Likozar and M. Huš, Electronic Properties of Rutile and Anatase TiO2 and Their Effect on CO2 Adsorption: A Comparison of First Principle Approaches, Fuel, 2022, 328, 125322, DOI:10.1016/j.fuel.2022.125322.
- S. Sudarsono, N. K. Salsabila, R. Asih, G. Yudoyono and D. Darminto, Optical Properties of Anatase TiO2: Computational and Experimental Studies, In AIP Conference Proceedings, 2023, vol. 2604, p. 070005 DOI:10.1063/5.0116780.
- F. S. Saoud, J. C. Plenet and M. Henini, Band Gap and Partial Density of States for ZnO: Under High Pressure, J. Alloys Compd., 2015, 619, 812–819, DOI:10.1016/j.jallcom.2014.08.069.
- M. Pušelj, Z. Ban and J. Morvaj, On the Peroxydes of Zinc and Cadmium, Croat. Chem. Acta, 1985, 58(3), 283–288 Search PubMed.
- W. Chen, Y. H. Lu, M. Wang, L. Kroner, H. Paul, H.-J. Fecht, J. Bednarcik, K. Stahl, Z. L. Zhang, U. Wiedwald, U. Kaiser, P. Ziemann, T. Kikegawa, C. D. Wu and J. Z. Jiang, Synthesis, Thermal Stability and Properties of ZnO2 Nanoparticles, J. Phys. Chem. C, 2009, 113(4), 1320–1324, DOI:10.1021/jp808714v.
- A. L. Companion, The Diffuse Reflectance Spectra of Zinc Oxide and Zinc Peroxide, J. Phys. Chem. Solids, 1962, 23(12), 1685–1688, DOI:10.1016/0022-3697(62)90205-6.
- C. J. Howard, R. J. Hill and B. E. Reichert, Structures of ZrO2 Polymorphs at Room Temperature by High-resolution Neutron Powder Diffraction, Acta Crystallogr., Sect. B, 1988, 44(2), 116–120, DOI:10.1107/S0108768187010279.
- D. W. McComb, Bonding and Electronic Structure in Zirconia Pseudopolymorphs Investigated by Electron Energy-Loss Spectroscopy, Phys. Rev. B: Condens. Matter Mater. Phys., 1996, 54(10), 7094–7102, DOI:10.1103/PhysRevB.54.7094.
- Z. Wang, Z. Quan and J. Lin, Remarkable Changes in the Optical Properties of CeO2 Nanocrystals Induced by Lanthanide Ions Doping, Inorg. Chem., 2007, 46(13), 5237–5242, DOI:10.1021/ic0701256.
- H. Shi, T. Hussain, R. Ahuja, T. W. Kang and W. Luo, Role of Vacancies, Light Elements and Rare-Earth Metals Doping in CeO2, Sci. Rep., 2016, 6(1), 31345, DOI:10.1038/srep31345.
- R. Outerovitch and B. Amadon, Electronic Interaction U_pp on Oxygen p Orbitals in Oxides: Role of Correlated Orbitals on the Example of UO2 and TiO2, Phys. Rev. B, 2023, 107(23), 235126, DOI:10.1103/PhysRevB.107.235126.
- G. Geneste, B. Amadon, M. Torrent and G. Dezanneau, DFT+U Study of Self-Trapping, Trapping, and Mobility of Oxygen-Type Hole Polarons in Barium Stannate, Phys. Rev. B, 2017, 96(13), 134123, DOI:10.1103/PHYSREVB.96.134123/FIGURES/13/MEDIUM.
- K. Park, M. Raman, A.-J. Olatunbosun and J. Pohlmann, Revisiting DFT+U Calculations of TiO2 and the Effect of the Local-Projection Size, AIP Adv., 2024, 14(6), 065114, DOI:10.1063/5.0211720.
Footnote |
| † Electronic supplementary information (ESI) available. See DOI: https://doi.org/10.1039/d4cp03397c |
| This journal is © the Owner Societies 2025 |

