 Open Access Article
Characterisation of the electronic ground states of BaH+ and BaD+ by high-resolution photoelectron spectroscopy
J. R.
Schmitz
and
F.
Merkt
 *
*
Institute of Molecular Physical Sciences, ETH Zurich, CH-8093 Zurich, Switzerland
First published on 3rd December 2024
Abstract
The rovibrational energy-level structures of BaH+ and BaD+ in their X+ 1Σ+ electronic ground state have been characterised by pulsed-field-ionisation zero-kinetic-energy photoelectron spectroscopy following resonance-enhanced (1 + 1′) two-photon excitation from the BaH/BaD X 2Σ+ ground state via the E 2Π1/2 (v′ = 0, 1) intermediate levels. A full set of rovibrational molecular constants for the BaH+ and BaD+ ground states has been derived for the first time and the adiabatic ionisation energies of BaH and BaD were determined to be 38![[thin space (1/6-em)]](https://www.rsc.org/images/entities/char_2009.gif) 679.96(20) and 38
679.96(20) and 38![[thin space (1/6-em)]](https://www.rsc.org/images/entities/char_2009.gif) 652.69(20) cm−1, respectively. Photoelectron spectra recorded via E-state levels of selected rovibronic parity exhibit pronounced intensity alternations of transitions to rotational states of the cations with even- and odd-valued rotational-angular-momentum quantum number N+. This observation is interpreted by invoking dominant contributions of even-
652.69(20) cm−1, respectively. Photoelectron spectra recorded via E-state levels of selected rovibronic parity exhibit pronounced intensity alternations of transitions to rotational states of the cations with even- and odd-valued rotational-angular-momentum quantum number N+. This observation is interpreted by invoking dominant contributions of even-![[small script l]](https://www.rsc.org/images/entities/char_e146.gif) photoelectron partial waves in the photoionisation of the E 2Π1/2 (v′ = 0, 1) intermediate states of barium hydride. The lowest pure-rotational transition frequencies of BaH+ and BaD+ are derived from the photoelectron spectra which may help the detection of BaH+ in the microwave and millimetre-wave ranges.
photoelectron partial waves in the photoionisation of the E 2Π1/2 (v′ = 0, 1) intermediate states of barium hydride. The lowest pure-rotational transition frequencies of BaH+ and BaD+ are derived from the photoelectron spectra which may help the detection of BaH+ in the microwave and millimetre-wave ranges.
1. Introduction
Alkaline-earth metal hydrides (MH, with M = Be, Mg, Ca, Sr, Ba, Ra) and their singly-charged cations (MH+) are important diatomic molecules. The lighter species, and in particular MgH(+) and CaH(+), are present in different astrophysical environments, notably near sunspots (see, e.g., ref. 1) and dwarf stars (see, e.g., ref. 2). CaH and BaH belong to the so far still limited category of molecules that can be laser cooled.3–5 Several of these hydrides and related molecules have been proposed as candidates for the search for physics beyond the standard model of particle physics (see, e.g. ref. 6 and 7), to measure the electron electric-dipole moment (eEDM)8 and the proton-to-electron mass ratio.9 Cold MgH+ (ref. 10) and CaH+ (ref. 11) produced by sympathetic cooling in laser-cooled ion traps have also been studied by high-resolution spectroscopy, and similar experiments on BaH+ have been proposed in the context of sources of ultracold hydrogen atoms.12MH and MH+ molecules are also interesting from an electronic-structure point of view. M and M+ have low-lying excited electronic states and, consequently, MH and MH+ have numerous low-lying electronic states associated with the different M + H and M+ + H dissociation asymptotes. Their spectra in the visible range are rich, difficult to analyse, and challenging to calculate accurately from first principles. In the past, they served as benchmark systems for calculations employing effective core potentials, the results of which can then be compared to those obtained from all-electron calculations.13–15 More recent calculations focus on electronically excited states and their multiconfigurational nature16–18 with a dedicated effort towards achieving high accuracy to assist laser-cooling applications.18–21
The electronic structure of neutral BaH has been thoroughly characterised. The first spectroscopic studies of BaH were performed by Schaafsma22 and Fredrickson et al.23 who characterised Franck–Condon-diagonal E 2ΠΩ → X 2Σ+ (v′–v′′) red emission bands. Following these studies, Watson24,25 reported several bands from the A 2Π → X 2Σ+ and B 2Σ+ → X 2Σ+ emission systems. Later work concentrated on the characterisation of higher-lying electronic states of BaH up to nearly 33![[thin space (1/6-em)]](https://www.rsc.org/images/entities/char_2009.gif) 000 cm−1 above the ground X 2Σ+ (v = 0) level,26–31 primarily under high-temperature conditions. High-resolution spectroscopic investigations have been conducted on transitions involving the ground X 2Σ+ and the first four low-lying H 2Δ, A 2Π, B 2Σ+ and E 2ΠΩ excited states.30,32–35 Rovibrational transitions in the X 2Σ+ state have also been recorded at high-resolution in multiple Ba1H isotopomers using diode laser spectroscopy36 and Fourier-transform emission spectroscopy,37 resulting in the determination of high-precision molecular constants. Ram et al.35 characterised the Franck–Condon-diagonal E 2ΠΩ–X 2Σ+ (Δv = 0) bands with v′ = v′′ = 0, 1 and 2 by Fourier-transform emission spectroscopy and were able to improve the values of the molecular constants of the E 2ΠΩ and X 2Σ+ states to their current values. In recent work at highest resolution, Zelevinsky and coworkers20,38,39 investigated the hyperfine structure of the B 2Σ+–X 2Σ+ and A 2Π1/2−X 2Σ+ band systems and determined vibrational branching ratios in order to find suitable transitions for laser-cooling applications. These investigations culminated in the demonstration of laser cooling in BaH.4
000 cm−1 above the ground X 2Σ+ (v = 0) level,26–31 primarily under high-temperature conditions. High-resolution spectroscopic investigations have been conducted on transitions involving the ground X 2Σ+ and the first four low-lying H 2Δ, A 2Π, B 2Σ+ and E 2ΠΩ excited states.30,32–35 Rovibrational transitions in the X 2Σ+ state have also been recorded at high-resolution in multiple Ba1H isotopomers using diode laser spectroscopy36 and Fourier-transform emission spectroscopy,37 resulting in the determination of high-precision molecular constants. Ram et al.35 characterised the Franck–Condon-diagonal E 2ΠΩ–X 2Σ+ (Δv = 0) bands with v′ = v′′ = 0, 1 and 2 by Fourier-transform emission spectroscopy and were able to improve the values of the molecular constants of the E 2ΠΩ and X 2Σ+ states to their current values. In recent work at highest resolution, Zelevinsky and coworkers20,38,39 investigated the hyperfine structure of the B 2Σ+–X 2Σ+ and A 2Π1/2−X 2Σ+ band systems and determined vibrational branching ratios in order to find suitable transitions for laser-cooling applications. These investigations culminated in the demonstration of laser cooling in BaH.4
In contrast to BaH, hardly any experimental information is available on BaH+ and the current knowledge of the spectroscopic properties of this cation stems from ab initio quantum-chemical investigations. Dos Santos et al.40 have predicted the adiabatic ionisation energy of BaH+, corresponding to the BaH+ X+ 1Σ+ (v+ = 0) ← BaH X 2Σ+ (v′′ = 0) ionisation threshold, to be 4.6627 eV (37![[thin space (1/6-em)]](https://www.rsc.org/images/entities/char_2009.gif) 607 cm−1). Ab initio quantum-chemical calculations have shown that the X+ 1Σ+ electronic ground state of BaH+ is correlated to the Ba+(6s) + H(1s) dissociation limit and is strongly bound, with a dissociation energy of about 20
607 cm−1). Ab initio quantum-chemical calculations have shown that the X+ 1Σ+ electronic ground state of BaH+ is correlated to the Ba+(6s) + H(1s) dissociation limit and is strongly bound, with a dissociation energy of about 20![[thin space (1/6-em)]](https://www.rsc.org/images/entities/char_2009.gif) 000 cm−1.17,41–43 Aymar et al.,44 Mejrissi et al.42 and Abu el kehr et al.43 have calculated potential-energy functions for many electronic states of BaH+ up to the Ba+(8s) + H(1s) dissociation limit, and it is possible, from the potential-energy curves they reported, to see how Rydberg character emerges in the electronically excited states as the excitation energy approaches the BaH2+ ionisation threshold.
000 cm−1.17,41–43 Aymar et al.,44 Mejrissi et al.42 and Abu el kehr et al.43 have calculated potential-energy functions for many electronic states of BaH+ up to the Ba+(8s) + H(1s) dissociation limit, and it is possible, from the potential-energy curves they reported, to see how Rydberg character emerges in the electronically excited states as the excitation energy approaches the BaH2+ ionisation threshold.
Our own interest in the heavier members of the MH/MH+ family originates from the fact that the doubly charged cations MH2+ with M = Ca, Sr and Ba are expected to be thermodynamically stable because the ionisation energy of H is larger than those of Ca+, Sr+ and Ba+.45–47 Moreover, the ionisation energies of MH+ are low so that their photoelectron spectra can be recorded with table-top laser systems. The Rydberg states of MH+ are also expected to be stable, with easily resolvable rotational structures. So far, hardly any high-resolution experimental information is available on the structure of doubly-charged molecular cations and on the Rydberg states of singly-charged cations. We hope to fill this gap in the future, following first successes in our investigation of MgAr2+.48
We report here on the first spectroscopic characterisation of the X+ 1Σ+ ground electronic states of BaH+ and BaD+ using pulsed-field-ionisation zero-kinetic-energy photoelectron (PFI-ZEKE-PE) spectroscopy in combination with the resonant (1 + 1′) two-photon excitation scheme via the E 2Π1/2 intermediate state presented in Fig. 1. This study provides the first stepping stone towards characterising the Rydberg states of BaH+ and the doubly charged BaH2+ molecule.
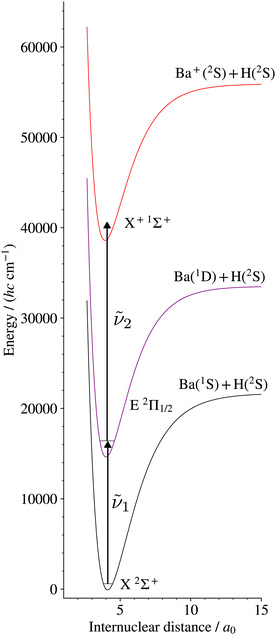 | ||
| Fig. 1 Resonant multiphoton excitation scheme used to access the X+ 1Σ+ ground state of BaH+ from the BaH X 2Σ+ ground state. The potential-energy curves are taken from ref. 18 and 44. An analogous excitation scheme was used in BaD to access the BaD+ ground state. | ||
PFI-ZEKE-PE spectroscopy is a powerful tool for the characterisation of the structure of gas-phase cations:49–51 it enables spectral resolution sufficient to fully resolve the rotational structure in the photoelectron spectra of diatomic molecules and, unlike pure-rotational and vibrational spectroscopy, it provides access to a very broad range of rovibronic states of the cation. It also reveals the dynamics of the photoionisation process and offers the possibility to prepare molecular ions in specific quantum states. These advantages represent key aspects of our long-term approach to studying singly and doubly charged molecular cations.
2. Experimental setup and procedure
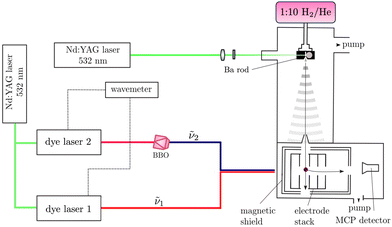
The experimental setup used for this work is shown schematically in Fig. 2. It has been previously described in ref. 52–56 and only the main aspects are repeated here. BaH and BaD were produced in the gas phase by coupling laser-ablation and supersonic-expansion techniques. The frequency-doubled output of a pulsed Nd:YAG laser (wavelength 532 nm, repetition rate 25 Hz, pulse length ≈ 8 ns) was used to ablate barium (Ba) atoms off a rotating Ba rod. BaH or BaD molecules were generated by expanding the vaporised Ba in a H2/He (1![[thin space (1/6-em)]](https://www.rsc.org/images/entities/char_2009.gif) :
:![[thin space (1/6-em)]](https://www.rsc.org/images/entities/char_2009.gif) 10) and a D2/He (1
10) and a D2/He (1![[thin space (1/6-em)]](https://www.rsc.org/images/entities/char_2009.gif) :
:![[thin space (1/6-em)]](https://www.rsc.org/images/entities/char_2009.gif) 10) supersonic jet, respectively, using a pulsed valve. Approximately 25 cm downstream from the valve orifice, the supersonic expansion passed through a 3-mm-diameter skimmer serving the purpose of reducing the transverse velocity of the molecular jet. A small (≤50 V) electric potential was applied to the skimmer to prevent ions created in the ablation process from reaching the photoexcitation chamber. After passing through the skimmer, the beam entered a resistively coupled 5.8-cm-long cylindrical electrode stack consisting of five equally spaced electrodes inside the magnetically shielded photoexcitation chamber. This electrode stack served the purpose of applying electric-field pulses to field ionise high Rydberg states produced by photoexcitation and extract the electrons, or ions, for detection.
10) supersonic jet, respectively, using a pulsed valve. Approximately 25 cm downstream from the valve orifice, the supersonic expansion passed through a 3-mm-diameter skimmer serving the purpose of reducing the transverse velocity of the molecular jet. A small (≤50 V) electric potential was applied to the skimmer to prevent ions created in the ablation process from reaching the photoexcitation chamber. After passing through the skimmer, the beam entered a resistively coupled 5.8-cm-long cylindrical electrode stack consisting of five equally spaced electrodes inside the magnetically shielded photoexcitation chamber. This electrode stack served the purpose of applying electric-field pulses to field ionise high Rydberg states produced by photoexcitation and extract the electrons, or ions, for detection.
To access the low-lying states of BaH+ and BaD+, BaH and BaD were photoexcited from the ground X 2Σ+ (v′′ = 0) state in a two-colour, two-photon process via the intermediate E 2Π1/2 (v′ = 1, 0) states, which were accessed using the output of a Nd:YAG-pumped dye laser of wavenumber ṽ1. These intermediate states were specifically selected for the large Franck–Condon factors and the large electric-dipole transition moments from the X 2Σ+ (v′′ = 0) state. To avoid saturation and line broadening, the energy of the photoexcitation pulse was reduced to below 20 μJ. To either ionise BaH/BaD in (1 + 1′) resonance-enhanced two-photon ionisation (R2PI) experiments or to excite BaD/BaH to high-lying Rydberg states in the PFI-ZEKE-PE measurements, the output of a second Nd:YAG-pumped dye laser of frequency ν2 was employed, which was frequency-doubled (pulse length ∼8 ns, bandwidth ≈ 0.15 cm−1) using a beta-barium-borate (BBO) crystal. The pulsed laser beams (ṽ1 and ṽ2) were spatially overlapped before entering the photoexcitation chamber, where they crossed the molecular beam at right angles. The fundamental wavenumbers of both dye lasers were calibrated using a wavemeter with a specified accuracy of 0.02 cm−1. The pulses from the second laser were delayed by ∼5 ns with respect to those of the first laser to minimise contributions to the ion signal from nonresonant ionisation processes.
In the (1 + 1′) R2PI measurements, a pulsed electric field of +172 V cm−1 was applied across the electrode stack to extract the BaH+/BaD+ cations for mass-selective detection at a microchannel-plate (MCP) detector located at the end of a 15-cm-long linear time-of-flight (TOF) mass spectrometer. (1 + 1′) R2PI spectra were measured by monitoring the BaH+ or BaD+ ion signal as a function of the wavenumber ṽ1 of the first laser. 134BaH+, 135BaH+, 136BaH+, 137BaH+ and 138BaH+, with 0.02417(18), 0.06592(12), 0.07854(24), 0.11232(24), and 0.71698(42) natural abundances,57 respectively, were resolved in the TOF spectra and their (1 + 1′) R2PI spectra recorded separately. Only the 138BaH (and 138BaD) (1 + 1′) R2PI spectra were analysed because the ABaH+ (ABaD+) ion times of flight overlapped with those of A+1Ba+ (A+2Ba+) ions (the superscripts A, A + 1, and A + 2 give the mass number of the Ba isotopes). Moreover, the reduced-mass change between different isotopomers of BaH+ (BaD+) is too small for a noticeable wavenumber shift between the corresponding R2PI spectra to be observable at the spectral resolution of our measurements.
To record PFI-ZEKE-PE spectra, electric-field pulse sequences were applied to the electrode stack, consisting of a first pulse of positive polarity to sweep prompt electrons out of the photoexcitation volume, followed by multiple pulses of negative polarity to field ionise high Rydberg states lying just below the ionisation thresholds. A sequence of seven electric-field pulses [(+0.09, −0.09, −0.17, −0.26, −0.34, −0.43, −1.72) V cm−1] was employed to record high-resolution PFI-ZEKE-PE spectra following the procedure outlined in ref. 58 and 59. The photoelectrons released by the successive negative pulses of this sequence were extracted down the TOF tube and detected at the MCP detector in separate time-of-flight windows. Spectra were measured by monitoring the field-ionisation signals induced by each of the negative-field pulses of the sequence as a function of the wavenumber ṽ2 of the second laser. The shifts of the ionisation thresholds induced by the electric-field pulses were determined from PFI-ZEKE-PE spectra of the Ba(6s6p) 1P1 → Ba+(6s) 2S1/2 photoionising transition recorded with the same electric-field pulse sequence. The differences between the observed line positions and the precisely known field-free ionisation threshold of Ba60,61 were then used to correct for the field-induced shifts, resulting in an expected absolute accuracy of better than 0.2 cm−1 in the determination of the ionisation thresholds of BaH and BaD.
3. Results
3.1. (1 + 1′) R2PI spectra of the E 2Π1/2 (v′ = 0, 1) ← X 2Σ+ (v′′ = 0) transitions of BaH and BaD
In order to confirm the production of BaH/BaD as well as to characterise the rotational temperature of the BaH/BaD samples in the gas expansion, (1 + 1′) R2PI spectra of the E 2Π1/2 (v′ = 1, 0)–X 2Σ+ (v′′ = 0) bands were recorded. These bands were chosen because their rotational structure had been previously characterised at high-resolution by Ram et al. for BaH35 and by Bernard et al. for BaD.33 The E 2ΠΩ state also offered the advantage of having good Franck–Condon factors to the low-lying vibrational levels of the ionic X+ 1Σ+ ground state, allowing efficient ionisation.The (1 + 1′) R2PI spectra for 134–138BaH+ and 134–138BaD+ were recorded after fixing the wavenumber ṽ2 of the ionisation laser to 26![[thin space (1/6-em)]](https://www.rsc.org/images/entities/char_2009.gif) 878.72 cm−1 and 25
878.72 cm−1 and 25![[thin space (1/6-em)]](https://www.rsc.org/images/entities/char_2009.gif) 400.00 cm−1, respectively, well above the adiabatic ionisation thresholds of BaH and BaD, respectively. Attempts to record the R2PI spectra of bands involving higher vibrational levels of the E 2Π1/2 and X 2Σ+ states proved unsuccessful, reflecting the efficient cooling of the vibrational motion of BaH and BaD in the gas expansions and the diagonal nature of the E 2Π1/2 (v′)–X 2Σ+ (v′′) transitions.
400.00 cm−1, respectively, well above the adiabatic ionisation thresholds of BaH and BaD, respectively. Attempts to record the R2PI spectra of bands involving higher vibrational levels of the E 2Π1/2 and X 2Σ+ states proved unsuccessful, reflecting the efficient cooling of the vibrational motion of BaH and BaD in the gas expansions and the diagonal nature of the E 2Π1/2 (v′)–X 2Σ+ (v′′) transitions.
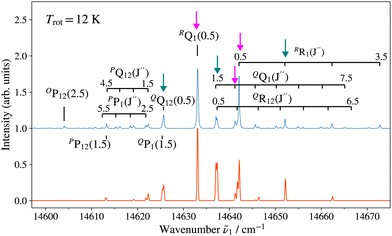
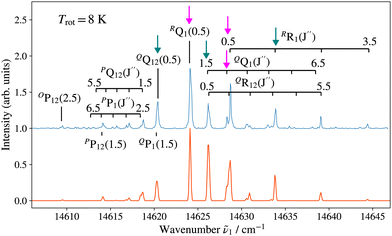
Fig. 3 and 4 show as examples the R2PI spectrum of the E 2Π1/2 (v′ = 0)–X 2Σ+ (v′′ = 0) bands of 138BaH and 138BaD, respectively. The rotational structures of the BaH and BaD E 2Π1/2 (v′ = 1, 0)–X 2Σ+ (v′′ = 0) bands were analysed by fitting the molecular constants of effective Hamiltonians for 2Σ+ and 2Π states62,63 to the observed rovibronic line positions. In this analysis, the E 2Π1/2 state was treated as being intermediate between Hund's case (a) and (b) angular-momentum coupling cases while the X 2Σ+ state was treated in pure Hund's case (b). To obtain the spectra displayed in orange colour in Fig. 3 and 4, the calculated stick spectra were convoluted with a Gaussian lineshape function with a full width at half maximum of 0.25 cm−1. Rotational lines are labelled using the notation ΔNΔJF1(F2)(J′′), where ΔN = N′ − N′′, and F1 and F2 designate the spin–orbit (spin-rotational) components. In the X 2Σ+ state, the F1 and F2 labels refer to the spin-rotational components with J = N + 1/2 and J = N − 1/2, respectively.64 The 2Π1/2 and 2Π3/2 spin–orbit components of the E intermediate state are well separated and the rotational levels of the E 2Π1/2 (2Π3/2) state are F1(F2) levels, as expected for a 2Π state with a positive spin–orbit-coupling constant in Hund's case (a) coupling. Accordingly, we use the subscripts “12” and “1” to label transitions that originate in X 2Σ+F2 and F1 levels, respectively. The experimental spectra are best reproduced with rotational temperatures Trot of 12 K in the case of BaH and 8 K in the case of BaD, indicating a more efficient cooling of the rotational motion in BaD.
Table 1 lists the rotational  and lambda-doubling
  constants obtained in the least-squares fit of the rotational structure of the E 2Π1/2 (v′ = 1, 0)–X 2Σ+ (v′′ = 0) bands of 138BaH and 138BaD. It also provides the term values of the E 2Π1/2 (v′, N′ = 1, J′ = 0.5) rotational levels, corresponding to the position of the RQ1(0.5) lines. The numbers in parentheses represent one standard deviation in units of the last digit. Overall, the results of our analysis are consistent with, though less precise than, the earlier results reported in ref. 33 and 35 with maximal deviations of about two standard deviations, i.e., about 0.006 cm−1. The rotational and lambda-doubling constants of the BaD E 2Π1/2 (v′ = 1) level are reported here for the first time.
 and
and  of X 2Σ+ 138BaH and 138BaD were fixed to the values reported by Ram et al.35 and Birk et al.,65 respectively. All values in cm−1
| Ev′/(hc) (N′ = 1, J′ = 0.5) | Ref. | |||
|---|---|---|---|---|
| a Transitions end on the e-parity component of the E 2Π1/2 (v′, N′ = 1, J′ = 0.5) level.35 | ||||
| BaH | ||||
| E 2Π1/2 (v′ = 0) | 14![[thin space (1/6-em)]](https://www.rsc.org/images/entities/char_2009.gif) 633.07(3) 633.07(3) |
3.480(3) | 0.870(3) | This work |
14![[thin space (1/6-em)]](https://www.rsc.org/images/entities/char_2009.gif) 633.0983a 633.0983a |
3.4868233(40) | 0.872460(93) | 35 | |
| 3.48490(11) | 0.87218(35) | 33 | ||
| E 2Π1/2 (v′ = 1) | 15![[thin space (1/6-em)]](https://www.rsc.org/images/entities/char_2009.gif) 819.42(3) 819.42(3) |
3.407(3) | 0.882(3) | This work |
15![[thin space (1/6-em)]](https://www.rsc.org/images/entities/char_2009.gif) 819.4909a 819.4909a |
3.414457(14) | 0.88520(24) | 35 | |
| BaD | ||||
| E 2Π1/2 (v′ = 0) | 14![[thin space (1/6-em)]](https://www.rsc.org/images/entities/char_2009.gif) 624.13(3) 624.13(3) |
1.763(3) | 0.433(3) | This work |
| 1.763230(33) | 0.43251(29) | 33 | ||
| E 2Π1/2 (v′ = 1) | 15![[thin space (1/6-em)]](https://www.rsc.org/images/entities/char_2009.gif) 474.53(3) 474.53(3) |
1.730(3) | 0.460(3) | This work |
3.2. PFI-ZEKE-PE spectra and characterisation of the X+ 1Σ+ ground state of BaH+ and BaD+
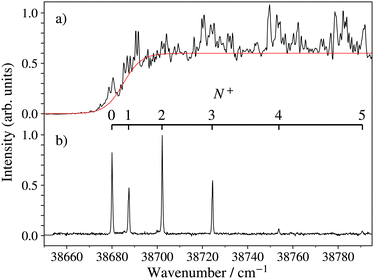
The photoionisation and PFI-ZEKE photoelectron spectra of 138BaH in the vicinity of the 138BaH+ (v+ = 0) ionisation threshold recorded from the intermediate E 2Π1/2 (v′ = 0, N′ = 1, J′ = 1.5, −) level of BaH are compared in Fig. 5. The photoionisation signal (Fig. 5a) gradually rises from a value of zero below ≈36![[thin space (1/6-em)]](https://www.rsc.org/images/entities/char_2009.gif) 670 cm−1 to an approximately constant value above 36
670 cm−1 to an approximately constant value above 36![[thin space (1/6-em)]](https://www.rsc.org/images/entities/char_2009.gif) 725 cm−1 (full red line), reflecting contributions from successive ionisation continua associated with X+ (v+ = 0, N+) states of increasing rotational quantum number N+. It also exhibits sharp structures originating from the autoionisation of Rydberg states belonging to series converging on higher-lying rovibrational levels of BaH+.
725 cm−1 (full red line), reflecting contributions from successive ionisation continua associated with X+ (v+ = 0, N+) states of increasing rotational quantum number N+. It also exhibits sharp structures originating from the autoionisation of Rydberg states belonging to series converging on higher-lying rovibrational levels of BaH+.
The BaH+ rotational structure is fully resolved in the PFI-ZEKE-PE spectrum, as indicated by the assignment bar in Fig. 5b. Consequently, the adiabatic ionisation threshold EI/(hc) of 138BaH, corresponding to the energy difference between the X+ 1Σ+ (v+ = 0, N+ = 0) and X 2Σ+ (v′′ = 0, N′′ = 0, J′′ = 0.5) ground states can be determined to be 38![[thin space (1/6-em)]](https://www.rsc.org/images/entities/char_2009.gif) 679.96(20) cm−1, the 0.2 cm−1 uncertainty originating primarily from the correction of the field-induced shift of the ionisation thresholds.
679.96(20) cm−1, the 0.2 cm−1 uncertainty originating primarily from the correction of the field-induced shift of the ionisation thresholds.
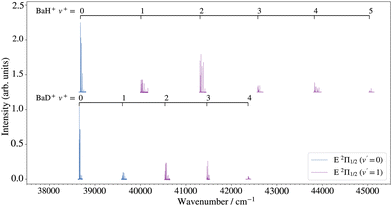
An overview of the rovibrational level structure of the X+ 1Σ+ electronic ground states of BaH+ and BaD+ as measured by PFI-ZEKE-PE spectroscopy following (1 + 1′) two-photon excitation is presented in Fig. 6. The wavenumber scale in the figure is relative to the X 2Σ+ (v′′ = 0, N′′ = 0, J′′ = 0.5) ground states of BaH and BaD. The PFI-ZEKE-PE spectra display regular progressions of vibrational levels with v+ = 0–5 for BaH+ and v+ = 0–4 for BaD+. To observe these levels, it was necessary to use both the E 2Π1/2 (v′ = 0 and 1) intermediate levels, as indicated by the legend and the colour code in the figure (see also the second column of Table 2). Consequently, the relative intensities of the different bands cannot be directly compared.
| v + | E v + /(hc)a; (N+ = 0) | ṽ calc − ṽexp | T v + | B v + | |
|---|---|---|---|---|---|
| a The uncertainties correspond to one standard deviation and do not include a 0.2 cm−1 systematic uncertainty arising from the compensation of the field-induced shift of the ionisation thresholds. | |||||
| BaH+ | |||||
| 0 | E 2Π1/2 (0) | 38![[thin space (1/6-em)]](https://www.rsc.org/images/entities/char_2009.gif) 679.96(3) 679.96(3) |
0.006 | 0.0 | 3.6835(18) |
| 1 | E 2Π1/2 (1) | 40![[thin space (1/6-em)]](https://www.rsc.org/images/entities/char_2009.gif) 010.55(4) 010.55(4) |
−0.025 | 1330.59(5) | 3.6255(18) |
| 2 | E 2Π1/2 (1) | 41![[thin space (1/6-em)]](https://www.rsc.org/images/entities/char_2009.gif) 311.81(3) 311.81(3) |
0.036 | 2631.85(4) | 3.5650(16) |
| 3 | E 2Π1/2 (1) | 42![[thin space (1/6-em)]](https://www.rsc.org/images/entities/char_2009.gif) 583.25(3) 583.25(3) |
−0.022 | 3903.29(4) | 3.4973(15) |
| 4 | E 2Π1/2 (1) | 43![[thin space (1/6-em)]](https://www.rsc.org/images/entities/char_2009.gif) 824.72(3) 824.72(3) |
0.004 | 5144.76(4) | 3.4332(16) |
| 5 | E 2Π1/2 (1) | 45![[thin space (1/6-em)]](https://www.rsc.org/images/entities/char_2009.gif) 035.61(4) 035.61(4) |
0.001 | 6355.65(5) | 3.3647(23) |
| BaD+ | |||||
| 0 | E 2Π1/2 (0) | 38![[thin space (1/6-em)]](https://www.rsc.org/images/entities/char_2009.gif) 652.69(3) 652.69(3) |
−0.002 | 0.0 | 1.8645(4) |
| 1 | E 2Π1/2 (0) | 39![[thin space (1/6-em)]](https://www.rsc.org/images/entities/char_2009.gif) 603.59(3) 603.59(3) |
−0.013 | 950.90(4) | 1.8462(13) |
| 2 | E 2Π1/2 (1) | 40![[thin space (1/6-em)]](https://www.rsc.org/images/entities/char_2009.gif) 539.696(22) 539.696(22) |
0.048 | 1887.01(4) | 1.8195(8) |
| 3 | E 2Π1/2 (1) | 41![[thin space (1/6-em)]](https://www.rsc.org/images/entities/char_2009.gif) 461.09(3) 461.09(3) |
−0.051 | 2808.40(4) | 1.7971(16) |
| 4 | E 2Π1/2 (1) | 42![[thin space (1/6-em)]](https://www.rsc.org/images/entities/char_2009.gif) 367.46(4) 367.46(4) |
0.018 | 3714.77(5) | 1.784(3) |
To confirm the vibrational assignment of the PFI-ZEKE-PE spectra, a standard isotopic-shift analysis66 was performed. The isotopic shifts expected for the lowest five observed vibrational levels of the X+ 1Σ+ state were determined using the vibrational constants of the BaH X 2Σ+ and BaH+ X+ 1Σ+ states reported by Ram et al.35 and in the present work, respectively. They are displayed in Fig. 7 as dashed and thick lines, corresponding to vibrational assignments of v+ = 0–4 and v+ = 1–5 for the observed bands, respectively. The experimentally observed isotopic shifts (blue dots in Fig. 7) enable the unambiguous assignment of the lowest observed levels to the v+ = 0 ground levels of BaH+ and BaD+, which is consistent with the onset of the photoionisation signal (see Fig. 5a).
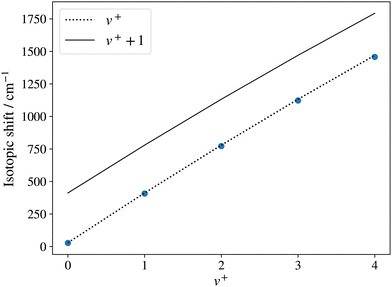 | ||
| Fig. 7 Isotopic shift of the v+ = 0–4 levels of 138BaD+ with respect to those of 138BaH+ determined from PFI-ZEKE-PE spectra of the X+ 1Σ+ (v+) ← E 2Π1/2 (v′ = 1, 0) photoionising transitions. The dotted and full lines are the predictions for the cases where the lowest observed level corresponds to v+ = 0 and v+ = 1, respectively. The shifts were calculated from the molecular constants reported by Ram et al.35 for the BaH X 2Σ+ state and those determined in the present work for the BaH+ X+ 1Σ+ state. | ||
Table 2 lists, in the third column, the positions of the field-free X+(v+, N+ = 0) ionisation thresholds of BaH and BaD relative to the respective X (v′′ = 0, N′′ = 0) neutral ground states derived from the PFI-ZEKE photoelectron spectra. The uncertainties in these thresholds are purely statistical and do not include a systematic contribution of 0.2 cm−1 originating from the uncertainty in the determination of the shifts of the ionisation thresholds induced by the pulsed electric fields (see Section 2). These shifts are expected to be the same for all ionisation thresholds and, therefore, the systematic uncertainties cancel out when determining the vibrational term values Tv+ given in the fifth column. The adiabatic ionisation wavenumbers of 138BaH and 138BaD, corresponding to the X+ 1Σ+ (v+ = 0, N+ = 0) ← X 2Σ+ (v′′ = 0, N′′ = 0) ionising transition, are thus 38![[thin space (1/6-em)]](https://www.rsc.org/images/entities/char_2009.gif) 679.96(20) cm−1 [4.79570(3) eV] and 38
679.96(20) cm−1 [4.79570(3) eV] and 38![[thin space (1/6-em)]](https://www.rsc.org/images/entities/char_2009.gif) 652.69(20) cm−1 [4.79232(3) eV], respectively. The value for BaH lies ≈1070 cm−1 above the value of 37
652.69(20) cm−1 [4.79232(3) eV], respectively. The value for BaH lies ≈1070 cm−1 above the value of 37![[thin space (1/6-em)]](https://www.rsc.org/images/entities/char_2009.gif) 607 cm−1 predicted by dos Santos et al.40Table 2 also gives, in the fourth column, the ionic vibrational term values and, in the fifth column, the residuals (ṽcalc – ṽexp) obtained in a least-squares fit of the harmonic (ωe) and anharmonic (ωexe, ωeye) vibrational constants. The fitted values of these constants are listed in Table 3 below.
607 cm−1 predicted by dos Santos et al.40Table 2 also gives, in the fourth column, the ionic vibrational term values and, in the fifth column, the residuals (ṽcalc – ṽexp) obtained in a least-squares fit of the harmonic (ωe) and anharmonic (ωexe, ωeye) vibrational constants. The fitted values of these constants are listed in Table 3 below.
| T 0/(hc) | ω e | ω e x e | ω e y e | B e | α e | γ e | r e (Å) | Ref. | |
|---|---|---|---|---|---|---|---|---|---|
| a With respect to the X 2Σ+ (v′′ = 0, N′′ = 0) ground states of 138BaH/138BaD. The uncertainty does not include a systematic contribution of 0.2 cm−1 originating from the correction of the field-induced shift of the ionisation thresholds. b Molecular constants of 138BaH as reported in ref. 17 and 41 multiplied by the reduced mass ratio (μBaH/μBaD)i/2+j, where i and j represent the exponents of v+ + 1/2 and N+(N+ + 1) in the corresponding terms of the standard expressions for the rovibrational term values,66 respectively. | |||||||||
| BaH+ X+ 1Σ+ | 38![[thin space (1/6-em)]](https://www.rsc.org/images/entities/char_2009.gif) 679.96(3)a 679.96(3)a |
1359.65(10) | 14.43(4) | −0.058(4) | 3.7128(21) | 0.0568(16) | −0.0012(3) | 2.1273(8) | This work |
37![[thin space (1/6-em)]](https://www.rsc.org/images/entities/char_2009.gif) 607 607 |
1394 | 2.089 | 40 | ||||||
| 1352.7 | 3.711 | 0.060 | 2.139 | 41 | |||||
| 1370 | 15 | 3.623 | 0.067 | 2.156 | 17 | ||||
| BaD+ X+ 1Σ+ | 38![[thin space (1/6-em)]](https://www.rsc.org/images/entities/char_2009.gif) 652.69(3)a 652.69(3)a |
965.84(7) | 7.429(13) | 1.875(4) | 0.0210(13) | 2.1284(20) | This work | ||
| 960 | 1.870 | 0.021 | 2.139 | 41 | |||||
| 973 | 7.6 | 1.827 | 0.024 | 2.156 | 17 | ||||
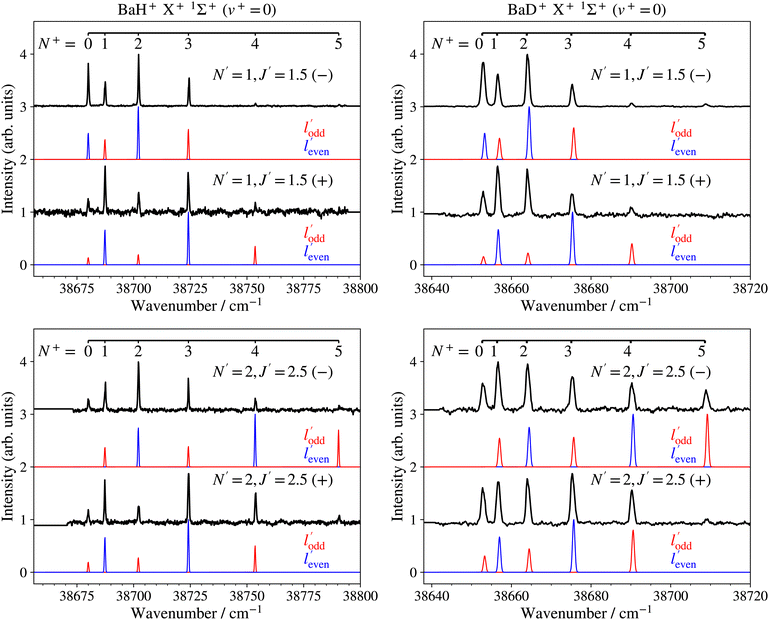
The PFI-ZEKE photoelectron spectra recorded from selected rotational levels [N′, J′, (−/+)] of the intermediate E 2Π1/2 (v′ = 0, 1) states are rotationally fully resolved and the left- and right-hand-side panels of Fig. 8 show, as representative examples, the spectra of the X+ 1Σ+ (v+ = 0, N+) ← E 2Π1/2 [v′ = 0, J′ = 1.5, 2.5, (−/+)] ionising transitions of BaH and BaD, respectively.
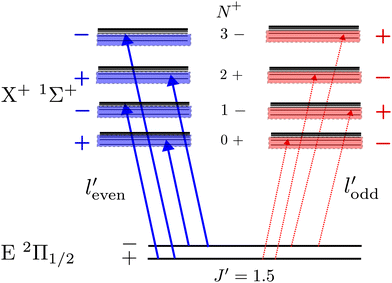
A striking feature of these PFI-ZEKE PE spectra is the intensity alternation of transitions to successive rotational levels (N+) of the cations. Transitions to BaH+/BaD+ levels of even (odd) N+ values are found to be dominant when ionisation occurs from rotational levels of the intermediate state of positive (negative) parity, as illustrated schematically in Fig. 9 for the BaH X+ 1Σ+ (v+, N+) ← E 2Π1/2 (v′, J′ = 1.5) ionising transitions.
Single-photon excitation is accompanied by a change of the rovibronic parity  . In a photoionisation transition, the parity of the final state is a product of the rovibronic parity of the ionised molecule [here, pion = (−1)N+] and the parity of the photoelectron partial wave (−1)
![[small script l]](https://www.rsc.org/images/entities/char_e146.gif) ′. Consequently, the rovibrational parity selection rule for a transition from a rovibronic state of the parent neutral molecule with parity pneutral can be expressed as (ref. 67)
′. Consequently, the rovibrational parity selection rule for a transition from a rovibronic state of the parent neutral molecule with parity pneutral can be expressed as (ref. 67)
pion = (−1)![[small script l]](https://www.rsc.org/images/entities/char_e146.gif) ′+1pneutral. ′+1pneutral. | (1) |
The experimentally observed intensity alternations indicate a preponderance of transitions connecting rovibronic levels of opposite parity, i.e., associated with the emission of even-![[small script l]](https://www.rsc.org/images/entities/char_e146.gif) ′ photoelectron partial waves or, in the case of the high Rydberg states detected by PFI-ZEKE-PE spectroscopy, of Rydberg states accessed optically through their even-
′ photoelectron partial waves or, in the case of the high Rydberg states detected by PFI-ZEKE-PE spectroscopy, of Rydberg states accessed optically through their even-![[small script l]](https://www.rsc.org/images/entities/char_e146.gif) ′ character. In a simple “orbital-ionisation” model,68–70 this preponderance can be interpreted as a dominant odd-
′ character. In a simple “orbital-ionisation” model,68–70 this preponderance can be interpreted as a dominant odd-![[small script l]](https://www.rsc.org/images/entities/char_e146.gif) character of the molecular orbital of the E 2Π1/2-state principal electronic configuration out of which the electron is ejected.
character of the molecular orbital of the E 2Π1/2-state principal electronic configuration out of which the electron is ejected.
In this model, the relative photoionisation cross section is expressed as a superposition of contributions from different orbital-angular-momentum (![[small script l]](https://www.rsc.org/images/entities/char_e146.gif) ) components in a single-centre expansion of the outermost valence orbital of the intermediate state68,70
) components in a single-centre expansion of the outermost valence orbital of the intermediate state68,70
 | (2) |
In eqn (2), λ corresponds to the projection of  on the molecular axis and C
![[small script l]](https://www.rsc.org/images/entities/char_e146.gif) are adjustable coefficients, as explained in ref. 71. The geometric factor
are adjustable coefficients, as explained in ref. 71. The geometric factor
 | (3) |
![[small script l]](https://www.rsc.org/images/entities/char_e146.gif) ) for ionisation to individual N+ levels of the ion from rotational levels of the intermediate E 2Π1/2 state of specific parity.
) for ionisation to individual N+ levels of the ion from rotational levels of the intermediate E 2Π1/2 state of specific parity.
Satisfactory agreement with the measured intensities could be reached by retaining only single-centre expansion components of low ![[small script l]](https://www.rsc.org/images/entities/char_e146.gif) values, and the model calculations presented in blue and red in Fig. 8 assume, for simplicity, that only
values, and the model calculations presented in blue and red in Fig. 8 assume, for simplicity, that only ![[small script l]](https://www.rsc.org/images/entities/char_e146.gif) = 1 and
= 1 and ![[small script l]](https://www.rsc.org/images/entities/char_e146.gif) = 2 are needed to generate the even- and odd-
= 2 are needed to generate the even- and odd-![[small script l]](https://www.rsc.org/images/entities/char_e146.gif) ′ partial waves, in a ratio of 1
′ partial waves, in a ratio of 1![[thin space (1/6-em)]](https://www.rsc.org/images/entities/char_2009.gif) :
:![[thin space (1/6-em)]](https://www.rsc.org/images/entities/char_2009.gif) 0.55. While the calculations account for the main trends of the observed intensity distributions, discrepancies remain. In particular, transitions with negative values of N+–J′ are typically stronger than those of the corresponding positive N+–J′ values. This behaviour is observed in many other molecules and can be attributed to rotational channel interactions, as explained in detail in ref. 71. Moreover, transitions to the N+ = 5, − ionic level associated with odd-
0.55. While the calculations account for the main trends of the observed intensity distributions, discrepancies remain. In particular, transitions with negative values of N+–J′ are typically stronger than those of the corresponding positive N+–J′ values. This behaviour is observed in many other molecules and can be attributed to rotational channel interactions, as explained in detail in ref. 71. Moreover, transitions to the N+ = 5, − ionic level associated with odd-![[small script l]](https://www.rsc.org/images/entities/char_e146.gif) ′ partial waves in the spectra recorded from the J′ = 2.5, − levels of both BaH and BaD (bottom panels of Fig. 8) are weaker than predicted by the calculations (see red traces). This observation may reflect a mixing of 2Π1/2 and 2Σ1/2+ character in the E 2Π1/2 state induced by the spin–orbit interaction,64 which would allow an
′ partial waves in the spectra recorded from the J′ = 2.5, − levels of both BaH and BaD (bottom panels of Fig. 8) are weaker than predicted by the calculations (see red traces). This observation may reflect a mixing of 2Π1/2 and 2Σ1/2+ character in the E 2Π1/2 state induced by the spin–orbit interaction,64 which would allow an ![[small script l]](https://www.rsc.org/images/entities/char_e146.gif) = 0 contribution in the single-centre expansion of the molecular-orbital and enhance the relative intensity of the transition to the N+ = 1 and 3 levels compared to that to the N+ = 5 level in the calculated spectrum. Alternatively, the intensity of these transitions could be reduced by destructive partial-wave interferences, which are not treated in the model.
= 0 contribution in the single-centre expansion of the molecular-orbital and enhance the relative intensity of the transition to the N+ = 1 and 3 levels compared to that to the N+ = 5 level in the calculated spectrum. Alternatively, the intensity of these transitions could be reduced by destructive partial-wave interferences, which are not treated in the model.
The rotational constants of the X+ 1Σ+ (v+) levels were determined from the experimental line positions in a least-squares fit based on a Hund's case (b) energy expression.66 Their values are listed in the fifth column of Table 2. Because we only observed rotational levels with N+ ≤ 5, the experimental term values could be accounted for within the experimental uncertainties (weighted RMS deviations of 0.265 (BaH) and 0.254 (BaD)) without considering centrifugal distortion effects.
Table 3 presents the equilibrium molecular constants ωe, ωexe, ωeye, Be, αe, and γe of the X+ 1Σ+ ground states of BaH+ and BaD+ extracted from analyses based on the standard power-series expansions in v+ + 1/2 and N+(N+ + 1).66 To reach a satisfactory description of the rovibrational structure, it was necessary to include anharmonicity terms up to the third order (ωeye) in BaH+ and second order (ωexe) in BaD+, as well as up to second-order corrections to the rotational constant [Bv = Be − αe(v + 1/2) + γe(v + 1/2)2]. The molecular equilibrium constants in Table 3 for BaH+ are in best agreement with the ab initio calculations by Allouche et al.17 and Abe et al.41 In the case of BaD+, we compare the molecular constants derived from the PFI-ZEKE-PE spectra with values derived from the 138BaH+ molecular constants reported in ref. 17 and 41 using the appropriate scaling with the reduced-mass ratio, i.e., (μBaH/μBaD)i/2+j, where i and j are the exponents of v+ + 1/2 and N+(N+ + 1) in the corresponding terms of the standard expressions for the rovibrational term values,66 respectively. These values are reported in Table 3 and are in good agreement with the values extracted from our spectra.
4. Conclusions
We have presented an experimental investigation of the rovibronic photoionisation dynamics of BaH and BaD and of the rovibrational structures of the X+ 1Σ+ ground electronic states of BaH+ and BaD+. From the fully resolved rotational structure of photoelectron spectra of BaH and BaD recorded following resonant (1 + 1′) two-photon excitation from the ground neutral state via selected rovibrational levels of the intermediate E 2Π1/2 state, we could derive rovibrational molecular constants for the X+ 1Σ+ ground electronic states of BaH+ and BaD+ and determine precise values of the adiabatic ionisation energies of BaH and BaD, as summarised in Tables 2 and 3.The rotational intensity distributions in the photoelectron spectra recorded from E 2Π1/2-state rotational levels of selected parity exhibit marked intensity differences between transitions to ionic rotational levels of even and odd values of the rotational quantum number N+, revealing dominant contributions from even-![[small script l]](https://www.rsc.org/images/entities/char_e146.gif) ′ photoelectron partial waves. These observations were interpreted in terms of mixed configurations of the E 2Π1/2 state in the realm of a simple single-centre orbital-ionisation model, revealing overall satisfactory agreement, but also pronounced discrepancies for transitions associated with odd-
′ photoelectron partial waves. These observations were interpreted in terms of mixed configurations of the E 2Π1/2 state in the realm of a simple single-centre orbital-ionisation model, revealing overall satisfactory agreement, but also pronounced discrepancies for transitions associated with odd-![[small script l]](https://www.rsc.org/images/entities/char_e146.gif) ′ partial waves and angular-momentum transfer N+–J′ of + 2.5. These discrepancies call for a more refined treatment of the rovibrational photoionisation dynamics of BaH and BaD.
′ partial waves and angular-momentum transfer N+–J′ of + 2.5. These discrepancies call for a more refined treatment of the rovibrational photoionisation dynamics of BaH and BaD.
Pure rotational transitions have not been observed yet in BaH+ and BaD+ but would be needed for a more precise characterisation of their structure and for radio-astronomical searches for these ions, in particular near sunspots where the parent neutral molecules have been predicted to occur but have not been detected yet despite recent efforts.72Table 4 lists the transition frequencies of the lowest pure-rotational transitions of BaH+ and BaD+ derived from the analysis of the PFI-ZEKE photoelectron spectra, which may be helpful for future laboratory measurements and astrophysical searches.
| (J′–J′′) | ν (GHz) | |
|---|---|---|
| BaH+ | (1–0) | 220.86(11) |
| (2–1) | 441.71(11) | |
| (3–2) | 662.57(11) | |
| BaD+ | (1–0) | 111.79(3) |
| (2–1) | 223.59(3) | |
| (3–2) | 335.38(3) | |
Data availability
All data are presented in the article. They can be obtained from the authors upon reasonable request.Conflicts of interest
There are no conflicts of interest to declare.Acknowledgements
We thank Josef A. Agner and Hansjürg Schmutz for their technical assistance and Carla Kreis for discussions. This work is supported financially by the Swiss National Science Foundation (grant No. 200020B-200478).References
- H. Wöhl, Sol. Phys., 1971, 16, 362–372 CrossRef.
- J. D. Kirkpatrick, Annu. Rev. Astron. Astrophys., 2005, 43, 195–245 CrossRef CAS.
- H.-I. Lu, J. Rasmussen, M. J. Wright, D. Patterson and J. M. Doyle, Phys. Chem. Chem. Phys., 2011, 13, 18986–18990 RSC.
- R. L. McNally, I. Kozyryev, S. Vazquez-Carson, K. Wenz, T. Wang and T. Zelevinsky, New J. Phys., 2020, 22, 083047 CrossRef CAS.
- S. Vázquez-Carson, Q. Sun, J. Dai, D. Mitra and T. Zelevinsky, New J. Phys., 2022, 24, 083006 CrossRef.
- K. Gaul, S. Marquardt, T. Isaev and R. Berger, Phys. Rev. A, 2019, 99, 032509 CrossRef CAS.
- D. Segal, V. Lorent, R. Dubessy and B. Darquié, J. Mod. Opt., 2018, 65, 490–500 CrossRef.
- N. M. Fazil, V. S. Prasannaa, K. V. P. Latha, M. Abe and B. P. Das, Phys. Rev. A, 2019, 99, 052502 CrossRef CAS.
- M. Kajita and Y. Moriwaki, J. Phys. B: At., Mol. Opt. Phys., 2009, 42, 154022 CrossRef.
- K. Højbjerre, A. K. Hansen, P. S. Skyt, P. F. Staanum and M. Drewsen, New J. Phys., 2009, 11, 055026 CrossRef.
- A. T. Calvin, S. Janardan, J. Condoluci, R. Rugango, E. Pretzsch, G. Shu and K. R. Brown, J. Phys. Chem. A, 2018, 122, 3177–3181 CrossRef CAS PubMed.
- S. A. Jones, New J. Phys., 2022, 24, 023016 CrossRef CAS.
- P. Fuentealba and O. Reyes, Mol. Phys., 1987, 62, 1291–1296 CrossRef CAS.
- W. Müller, J. Flesch and W. Meyer, J. Chem. Phys., 1984, 80, 3297–3310 CrossRef.
- M. Kaupp, P. V. R. Schleyer, H. Stoll and H. Preuss, J. Chem. Phys., 1991, 94, 1360–1366 CrossRef CAS.
- A. R. Allouche, G. Nicolas, J. C. Barthelat and F. Spiegelmann, J. Chem. Phys., 1992, 96, 7646–7655 CrossRef CAS.
- A. R. Allouche, F. Spiegelmann and M. Aubert-Frécon, Chem. Phys. Lett., 1993, 204, 343–349 CrossRef CAS.
- K. Moore, B. M. McLaughlin and I. C. Lane, J. Chem. Phys., 2016, 144, 144314 CrossRef PubMed.
- Y. Gao and T. Gao, Phys. Rev. A: At., Mol., Opt. Phys., 2014, 90, 052506 CrossRef.
- G. Z. Iwata, R. L. McNally and T. Zelevinsky, Phys. Rev. A, 2017, 96, 022509 CrossRef.
- K. Moore and I. C. Lane, J. Quant. Spectrosc. Radiat. Transfer, 2018, 211, 96–106 CrossRef CAS.
- A. Schaafsma, Z. Phys., 1932, 74, 254–266 CrossRef CAS.
- W. R. Fredrickson and W. W. Watson, Phys. Rev., 1932, 39, 753–764 CrossRef CAS.
- W. W. Watson, Phys. Rev., 1933, 43, 9–11 CrossRef CAS.
- W. W. Watson, Phys. Rev., 1935, 47, 213–214 CrossRef CAS.
- B. Grundström, Z. Phys., 1936, 99, 595–606 CrossRef.
- M. Aslam Khan, J. Phys. B: At. Mol. Phys., 1968, 1, 985 CrossRef.
- M. Aslam Baig, M. Rafi and M. Aslam Khan, Il Nuovo Cimento B, 1977, 40, 365–370 CrossRef.
- M. Rafi, S. Ahmed, M. Aslam Khan and M. Aslam Baig, Z. Phys. A, 1985, 320, 369–373 CrossRef CAS.
- G. Fabre, A. E. Hachimi, R. Stringat, C. Effantin, A. Bernard, J. D'Incan and J. Verges, J. Phys. B: At. Mol. Opt. Phys., 1987, 20, 1933 CrossRef CAS.
- M. Rafi, A. Al-Ghamdi, K. Ahmed and I. Khan, Phys. Lett. A, 1994, 189, 304–306 CrossRef CAS.
- O. Appelblad, L.-E. Berg, L. Klynning and J. W. C. Johns, Phys. Scr., 1985, 31, 69 CrossRef CAS.
- A. Bernard, C. Effantin, J. D’Incan, G. Fabre, R. Stringat and R. Barrow, Mol. Phys., 1989, 67, 1–18 CrossRef CAS.
- R. F. Barrow, B. J. Howard, A. Bernard and C. Effantin, Mol. Phys., 1991, 72, 971–976 CrossRef CAS.
- R. S. Ram and P. F. Bernath, J. Mol. Spectrosc., 2013, 283, 18–21 CrossRef CAS.
- U. Magg, H. Birk and H. Jones, Chem. Phys. Lett., 1988, 149, 321–325 CrossRef CAS.
- H. G. H. Kaley, A. Walker and P. F. Bernath, Mol. Phys., 1993, 78, 577–589 CrossRef.
- M. G. Tarallo, G. Z. Iwata and T. Zelevinsky, Phys. Rev. A, 2016, 93, 032509 CrossRef.
- K. Moore, I. C. Lane, R. L. McNally and T. Zelevinsky, Phys. Rev. A, 2019, 100, 022506 CrossRef CAS.
- L. G. dos Santos and F. R. Ornellas, Chem. Phys., 2019, 520, 32–39 CrossRef.
- M. Abe, M. Kajita, M. Hada and Y. Moriwaki, J. Phys. B: At., Mol. Opt. Phys., 2010, 43, 245102 CrossRef.
- L. Mejrissi, H. Habli, H. Ghalla, B. Oujia and F. X. Gadéa, J. Phys. Chem. A, 2013, 117, 5503–5517 CrossRef CAS PubMed.
- N. Abu el kher, I. Zeid, N. El-Kork and M. Korek, J. Comput. Sci., 2021, 51, 101264 CrossRef.
- M. Aymar and O. Dulieu, J. Phys. B: At., Mol. Opt. Phys., 2012, 45, 215103 CrossRef.
- S. Falcinelli, F. Fernández-Alonso, K. S. Kalogerakis and R. N. Zare, Mol. Phys., 1996, 88, 663–672 CrossRef CAS.
- D. Schröder and H. Schwarz, J. Phys. Chem. A, 1999, 103, 7385–7394 CrossRef.
- S. Falcinelli and M. Rosi, Molecules, 2020, 25, 4157 CrossRef CAS.
- D. Wehrli, M. Génévriez and F. Merkt, Phys. Chem. Chem. Phys., 2021, 23, 10978–10987 RSC.
- G. Reiser, W. Habenicht, K. Müller-Dethlefs and E. W. Schlag, Chem. Phys. Lett., 1988, 152, 119–123 CrossRef CAS.
- K. Müller-Dethlefs and E. W. Schlag, Ann. Rev. Phys. Chem., 1991, 42, 109–136 CrossRef.
- F. Merkt, S. Willitsch and U. Hollenstein, in Handbook of High-Resolution Spectroscopy, ed. M. Quack, F. Merkt, John Wiley & Sons, Chichester, 2011, vol. 3, pp. 1617–1654 Search PubMed.
- C. Kreis, M. Holdener, M. Génévriez and F. Merkt, Mol. Phys., 2023, 121, e2152746 CrossRef.
- M. Génévriez, D. Wehrli and F. Merkt, Mol. Phys., 2020, 118, e1703051 CrossRef.
- D. Wehrli, M. Génévriez, C. Kreis, J. A. Agner and F. Merkt, J. Phys. Chem. A, 2020, 124, 379–385 CrossRef CAS.
- M. Génévriez, D. Wehrli, J. A. Agner and F. Merkt, Int. J. Mass Spectrom., 2019, 435, 209–216 CrossRef.
- C. Kreis, J. R. Schmitz and F. Merkt, Phys. Chem. Chem. Phys., 2024, 26, 19359–19368 RSC.
- M. Berglund and M. E. Wieser, Pure Appl. Chem., 2011, 83, 397–410 CrossRef CAS.
- S. Mollet and F. Merkt, J. Chem. Phys., 2013, 139, 034302 CrossRef PubMed.
- J. R. Schmitz, U. Hollenstein and F. Merkt, Mol. Phys., 2023, 121, e2232888 CrossRef.
- B. H. Post, W. Vassen, W. Hogervorst, M. Aymar and O. Robaux, J. Phys. B: At. Mol. Phys., 1985, 18, 187 CrossRef CAS.
- H. Karlsson and U. Litzén, Phys. Scr., 1999, 60, 321 CrossRef CAS.
- J. M. Brown and A. J. Merer, J. Mol. Spectrosc., 1979, 74, 488–494 CrossRef CAS.
- R. N. Zare, Angular momentum: Understanding spatial aspects in chemistry and physics, John Wiley & Sons, New York, 1988 Search PubMed.
- H. Lefebvre-Brion and R. W. Field, The Spectra and Dynamics of Diatomic Molecules, Elsevier, Amsterdam, 2004 Search PubMed.
- H. Birk, R. Urban, P. Polomsky and H. Jones, J. Chem. Phys., 1991, 94, 5435–5442 CrossRef CAS.
- G. Herzberg, Molecular Spectra and Molecular Structure. Spectra of Diatomic Molecules, Krieger, Malabar, 1989, vol. 1 Search PubMed.
- R. Signorell and F. Merkt, J. Chem. Phys., 1998, 109, 9762–9771 CrossRef CAS.
- A. D. Buckingham, B. J. Orr and J. M. Sichel, Philos. Trans. R. Soc. London, 1970, 268, 147–157 CrossRef CAS.
- J. M. Sichel, Mol. Phys., 1970, 18, 95–100 CrossRef CAS.
- S. Willitsch and F. Merkt, Int. J. Mass Spectrom., 2005, 245, 14–25 CrossRef CAS.
- F. Merkt and T. P. Softley, Int. Rev. Phys. Chem., 1993, 12, 205–239 Search PubMed.
- B. Karthikeyan, G. Shanmugapriya, N. Rajamanickam and S. Bagare, New Astron., 2020, 78, 101366 CrossRef CAS.
| This journal is © the Owner Societies 2025 |

