
 Open Access Article
 This Open Access Article is licensed under a
 Creative Commons Attribution 3.0 Unported Licence
Characterization of high Zr/Ce ratio Ba(Zr,Ce,Y)O3−δ proton conductors: investigating the impact of Y on the properties of materials†
Yuan
Zeng
 *ab,
Moritz
Kindelmann
ac,
Kwati
Leonard
d,
Laura-Alena
Schäfer
ab,
Kai
Yao
a,
Jürgen
Malzbender
e,
Michael
Müller
e,
Olivier
Guillon
abf,
Mariya E.
Ivanova
a and
Norbert H.
Menzler
ab
*ab,
Moritz
Kindelmann
ac,
Kwati
Leonard
d,
Laura-Alena
Schäfer
ab,
Kai
Yao
a,
Jürgen
Malzbender
e,
Michael
Müller
e,
Olivier
Guillon
abf,
Mariya E.
Ivanova
a and
Norbert H.
Menzler
ab
aForschungszentrum Jülich GmbH, Institute of Energy Materials and Devices IMD-2: Materials Synthesis and Processing, 52425 Jülich, Germany. E-mail: y.zeng@fz-juelich.de
bDepartment of Ceramics and Refractory Materials, Institute of Mineral Engineering, RWTH Aachen University, 52064 Aachen, Germany
cForschungszentrum Jülich GmbH, Ernst Ruska-Centre for Microscopy and Spectroscopy with Electrons (ER-C), 52425 Jülich, Germany
dInternational Institute for Carbon Neutral Energy Research (WPI-I2CNER), Kyushu University, 744 Motooka, Nishiku, Fukuoka 819-0395, Japan
eForschungszentrum Jülich GmbH, Institute of Energy Materials and Devices IMD-1: Microstructure and properties of Materials, 52425 Jülich, Germany
fJülich-Aachen Research Alliance: JARA-Energy, 52425 Jülich, Germany
First published on 3rd December 2024
Abstract
Acceptor-substituted Ba(Zr,Ce)O3 proton conducting oxides have attracted significant attention due to their excellent proton conductivity at intermediate temperatures (400–600 °C). A high Zr/Ce ratio is crucial for maintaining stability in humid or other harsh atmospheres. Herein, a systematic study was conducted on the phase composition, microstructure, and the resulting hydration ability and electrochemical performance of high Zr/Ce ratio Ba(Zr,Ce)O3 solid solutions with different Y substitution levels (10 at% to 30 at%). In this substitution range, no apparent secondary phase can be found from XRD, leading to a continuous increase in hydration content. A Y-rich phase was observed in SEM for compositions with high levels of Y substitution. The impact of Y on proton conduction was examined using EIS, with particular attention on elucidating the effects of varying amounts of Y on bulk proton conduction. The increase of proton conductivity was primarily due to the increased charge carrier (proton) concentration caused by Y substitution. Different concentrations of Y have little effect on proton mobility, indicating a compromise between different mechanisms such as the Y trapping effect and the nano-percolation effect. Grain boundary proton conduction was discussed combining the TEM-EDS results to explain the space charge layer effect. Mechanical properties and thermo-chemical stability were also considered to pave the way for real applications.
Introduction
Proton-conducting ceramics have become highly attractive materials as potential candidates for use in a variety of energy conversion and storage devices, including protonic ceramic fuel and electrolysis cells, co-conversion of CO2 and H2 and electrochemical pumps for H2 compression, due to their promising levels of proton conductivity at relatively intermediate temperatures (400–600 °C).1–3 Despite intensive research on multitude proton-conducting ceramic materials, acceptor-substituted BaZrO3 and BaCeO3 (e.g., doped with Y2O3) remain amongst the most promising candidates.4,5 While acceptor-substituted BaCeO3 displays high proton conductivity, its practical application is hindered by its low chemical stability in H2O, CO2, and other similar atmospheres.6–8 On the other hand, acceptor-substituted BaZrO3 exhibits excellent chemical stability, but its high grain boundary resistance along with the high sintering temperature restricts its large-scale application. Preparing Ba(Zr,Ce)O3 solid solutions with the appropriate Zr/Ce ratio at the B-site in the perovskite crystal structure is a compromise strategy. For example, Kim et al.9 reported that a 20 mol% substitution of Ce can effectively reduce the grain boundary resistance of Y-substituted BaZrO3 and achieve relatively good total conductivity. Additionally, Zhong et al.10 and Fabbri et al.11 suggested that with a Ce content lower than 20 mol%, the material exhibited good stability in H2O and CO2 environments. In the studies of Haile12 and Liu13et al., it is claimed that when the Ce content is above 40%, or even 70%, the material can maintain high-temperature stability in CO2 and H2O environments.Acceptor substitution is another crucial factor directly related to hydration properties and proton conductivity.14 The substitution of Zr or Ce with acceptor elements creates oxygen vacancies, which will be hydrated in a humid atmosphere to form proton defects that act as charge carriers. Protons can hop from one oxygen site to a neighbouring one to achieve electrical conduction according to the Grotthuss mechanism.15,16 In this process, the proton concentration and the ability of protons to migrate within the host material influence the final proton conductivity. These two aspects are directly affected by the type and concentration of the acceptor elements. Yttrium is currently the most popular among various trivalent acceptor elements. Compared to many trivalent lanthanide elements, Y substitutes very little at the A-site of the perovskite structure ABO3 in Ba(Zr,Ce)O3,17 allowing Y substitution to achieve the theoretical oxygen vacancy concentration and reach nearly the theoretical saturation hydration concentration in a humid atmosphere. Additionally, the hydration enthalpy and entropy determine the hydration capability of Ba(Zr,Ce)O3 at different temperatures. Kreuer et al.'s18 research shows that BaZrO3 doped with varying amounts of Y has almost constant hydration enthalpy and entropy, allowing Y-doped Ba(Zr,Ce)O3 to maintain a certain proton concentration even at relatively high temperatures, which is important in high-temperature electrochemical device applications. In their work, they also show that Y has the highest proton mobility compared to other dopants such as Gd, Sc and In. Although Sc substitution exhibits similar hydration capability to Y substitution, it has the lowest proton mobility. Because of the excellent hydration capability and high proton mobility demonstrated by Y substitution, almost all reports indicate that Y is one of the best acceptor elements regarding the proton conductivity among the other trivalent elements.19,20 Han et al.17 compared 14 dopants in the BaZrO3 system, including Sc, Y, In, Pr, Nd, Sm, Eu, Gd, Tb, Dy, Ho, Er, Tm, and Yb, and concluded that only materials substituted with Tm and Ho exhibited conductivities comparable to the one with Y.
As aforementioned, the Zr/Ce ratio in Ba(Zr,Ce)O3 greatly influences its conductivity and stability. More than that, the crystal structure will transit from the more symmetrical cubic perovskite structure with high Zr content to structures with higher distortion such as pseudo cubic or orthorhombic perovskites with high Ce content.21,22 Acceptors may exhibit different behaviours under different chemical environments and crystal structure backgrounds influenced by the Zr/Ce ratio. Therefore, it is of great interest to investigate the effect of Y substitution on the hydration capability and proton mobility in high Zr/Ce ratio Ba(Zr,Ce)O3, especially considering the importance of such materials for multiple applications where high stability and durability are essentially required. Due to the high refractory properties resulting from the high Zr content, a sintering aid should be added to reduce the sintering temperature. After screening 16 elements, Nikodemski et al.23 found that NiO, CuO and CoO sintering aids have led to the best sintering effects. Currently, NiO is the most popular sintering aid, and it is also the primary component in the fuel electrode for fuel and electrolysis cells, making it a good choice of sintering additives. The work of Uda24et al. shows that adding 2 wt% NiO negatively affects hydration, which drastically reduces proton conductivity. However, Huang et al.25,26 showed that adding 0.5 wt% of NiO had good sintering aid effects without significantly affecting conductivity.
In this work, 20 mol% of Ce was introduced into the lattice of BaZrO3 to maintain certain stability, and also counteract with the low grain boundary conductivity. And 0.5 wt% of NiO was applied as a sintering aid. The substituent Y2O3 varies within the range of 10–30 mol%, in order to study the influence of Y on phase formation, microstructure, and electrical performance. The proton conductivity contributed by bulk and grain boundary is discussed separately to explore the effect of Y. In addition, mechanical performance and thermal-chemical stability are also taken into consideration to evaluate the suitability of this material for electrochemical devices.
Experimental section
Sample preparation
BaZr0.8−xCe0.2YxO3−δ, where x = 0.10, 0.15, 0.20, 0.25, 0.30, denoted as BZCY–Y10, BZCY–Y15, BZCY–Y20, BZCY–Y25, BZCY–Y30, respectively, were prepared using a conventional solid-state reaction method combined with high temperature sintering. The raw powders BaCO3, ZrO2, CeO2, and Y2O3 (Sigma-Aldrich, purity grade of 99%) were weighed according to the stoichiometry and mixed in ethanol in a tumbler mixer for 24 h, followed by drying in a drying cabinet at 80 °C for 24 h. The mass ratio of powder, milling balls and ethanol is 1![[thin space (1/6-em)]](https://www.rsc.org/images/entities/char_2009.gif) :2:3. The powders were collected and calcined at 1300 °C for 10 h. The pre-calcined powders were collected and 0.5 wt% of NiO powder was added, and then the milling and drying processes were repeated. Finally, the powders were sieved using a 100 μm mesh sieve to get the final powder. For the preparation of pellets, the powders were filled in a 13 mm die and uniaxially pressed at 4 kN, and then pressed by cold isostatic pressing at 3000 MPa for 2 min. Then the pellets were embedded in sacrificial powder, placed in an Al2O3 crucible, and then sintered in air at 1500 °C for 10 h with 5 K min−1 heating rate and natural cooling rate.
:2:3. The powders were collected and calcined at 1300 °C for 10 h. The pre-calcined powders were collected and 0.5 wt% of NiO powder was added, and then the milling and drying processes were repeated. Finally, the powders were sieved using a 100 μm mesh sieve to get the final powder. For the preparation of pellets, the powders were filled in a 13 mm die and uniaxially pressed at 4 kN, and then pressed by cold isostatic pressing at 3000 MPa for 2 min. Then the pellets were embedded in sacrificial powder, placed in an Al2O3 crucible, and then sintered in air at 1500 °C for 10 h with 5 K min−1 heating rate and natural cooling rate.
Material characterization
To examine the phase composition of the sintered samples, sintered ceramics were ground into powders and analyzed using Bruker D4 Endeavour (Cu-Kα-radiation). The 2θ range for the XRD patterns used for Rietveld refinement was 10–120°. GSAS software27 was used for XRD result refinement. The refined unit cell volume was used for calculating the theoretical density, and the relative density of the sintered ceramics was calculated based on the actual density measured by the Archimedes method under n-propanol. The surface microstructure and element distribution of polished samples were observed using a scanning electron microscope (SEM, ZEISS ULTRA 55, Carl Zeiss NTS GmbH, Germany) equipped with energy dispersive spectroscopy (EDS, Oxford Instruments, UK). The analysis of grain size is achieved through the linear intercept method. Multiple intercept lines are drawn on SEM images, and the number of grains intersected by each line is counted to determine the average grain size along that line. Finally, the grain sizes along each intercept line are statistically summarized to obtain the overall average grain size. Samples for scanning transmission electron microscopy (STEM) were prepared using a conventional dimpling route to achieve a large area of electron transparent materials, facilitating the search for suitable grain boundaries for high resolution analysis. Bulk samples were first metallographically ground and polished to a thickness of 100 μm, followed by dimple grinding to a minimal thickness of 10 to 15 μm using a dimple grinder (Gatan Inc., USA). Afterwards the final hole was milled and thinned using an Ar ion milling device (PIPS II, Gatan Inc., USA) with a final Ar energy of 500 eV. STEM imaging and spectroscopy were done using a probe Cs-corrected Hitachi HF5000 microscope (Hitachi High-Technologies, Japan) at 200 keV equipped with an Oxford Instruments Ultrim TLE EDS detector. EDS data analysis and curation were performed using Aztec (Oxford Instruments, UK).The temperature dependence of proton concentration of the materials was evaluated by thermogravimetric analysis (TGA Netzsch STA449F3 Jupiter). The sintered pellets were ground into powder and sieved to obtain particles with a size ranging from 200 to 300 μm. The powder is initially heated to 1200 °C in dry N2 for 1 hour to achieve complete dehydration. Subsequently, the atmosphere is switched to a water-saturated nitrogen–argon mixture (1.9 vol% H2O–10% vol. N2–Ar) with a flow rate of 10 mL min−1 of dry protective gas through a balance and 50 mL min−1 of gas saturated with water in a bubbler at 17 °C. During the cooling process, the powder is stabilized for two hours at each 100 °C decrement. The mass changes of the powder between 1200 °C and 100 °C are continuously recorded. Finally, the buoyancy effect was corrected using data from a blank test. Then the proton concentration can be calculated according to the following equation:28
 | (1) |
The electrical characterization employs electrochemical impedance spectroscopy (EIS) over a temperature range of 150–700 °C using an Alpha-A frequency analyzer in the frequency range of 0.1–106 Hz. Within the temperature range of 150–250 °C, the testing temperature intervals are set at 25 K. Sputtered Au electrodes were utilized as the current collectors, which are conducive to deconvoluting grain boundary and polarization responses. At elevated temperatures (300–650 °C), the testing temperature intervals were extended to 50 K, and more stable Pt electrodes were employed. In order to make the Pt electrode, Pt paste (EVOCHEM Advanced Materials GmbH) was brushed on the surface of the sample, and then annealed at 900 °C for one hour to obtain stable Pt electrodes. The EIS results were collected from high to low temperatures. The equilibration time at each measurement temperature was set to 2 hours. The tests were conducted in wet air. The humidification of the gas was realized by bubbling the gas through water at RT resulting in ca. 3 vol% H2O saturation in the gas. The EIS data were finally analyzed using the RelaxIS commercial software.
The elastic modulus and hardness of the material were determined through the load-displacement curves29 obtained by the Vickers micro-indentation device HC100 (Fischer, Windsor, USA). 25 micro-indentation tests with 1 N load were conducted for each specimen. The specimens underwent grinding and polishing prior to testing. The thermo-chemical stability tests were carried out through high temperature exposure to various atmospheres and their reaction with the materials could be estimated by any phase composition changes. Three atmosphere conditions including Ar saturated with water vapor at 82 °C resulting in 50 vol% H2O, 50 vol% Ar + 50 vol% CO2, 96 vol% Ar + 4 vol% H2 were applied. In a typical experiment, the sintered pellet was ground into powder and heated up to 700 °C, then the powder was subjected to a 24-hours heat treatment under a specific gas atmosphere. After that, the phase composition of the powder was identified again using XRD and compared to a reference measurement.
Results and discussion
Phase analysis and microstructure
Fig. 1a shows the XRD patterns of materials in the BaZr0.8−xCe0.2YxO3−δ series recorded at RT. All phases exhibit a cubic perovskite structure with space group Pm![[3 with combining macron]](https://www.rsc.org/images/entities/char_0033_0304.gif) m. No apparent secondary phases were observed in the XRD patterns. The shoulder to the right of each main peak is the Kα2 peak, which is more distinctly separated from the main peak at a higher angle. There is an apparent trend in the XRD patterns that with increasing Y concertation, the peaks shift towards the smaller angles due to an obvious lattice expansion upon substitution. The reason is that the ionic radius, ri, of Zr4+ is 0.072 nm, which is smaller than that of Y3+ (ri = 0.090 nm). By adding more of the larger Y3+, the inter-planar crystal spacing d will increase upon substitution, and θ will correspondingly decrease, according to the Bragg's law of diffraction, 2dsinθ = nλ.
m. No apparent secondary phases were observed in the XRD patterns. The shoulder to the right of each main peak is the Kα2 peak, which is more distinctly separated from the main peak at a higher angle. There is an apparent trend in the XRD patterns that with increasing Y concertation, the peaks shift towards the smaller angles due to an obvious lattice expansion upon substitution. The reason is that the ionic radius, ri, of Zr4+ is 0.072 nm, which is smaller than that of Y3+ (ri = 0.090 nm). By adding more of the larger Y3+, the inter-planar crystal spacing d will increase upon substitution, and θ will correspondingly decrease, according to the Bragg's law of diffraction, 2dsinθ = nλ.
 | ||
| Fig. 1 (a) XRD patterns of the BaZr0.8−xCe0.2YxO3−δ ceramics. (b) Lattice parameters and relative density with the increase of Y content. (Fitting results are only for visual reference). | ||
All XRD patterns were refined in order to obtain more accurate analysis of the results as shown in Fig. S1 (ESI†), and the refinement results for all samples exhibited a low weighted profile R-factor (Rwp) and goodness of fit (Gof), indicating a good match between the calculated results and experimental data. The refinement results provided precise lattice parameters. As mentioned earlier, the ionic radius of Y3+ is larger than that of Zr4+, and substitution of Zr4+ with Y3+ ions will lead to an increase in the lattice parameters. Fig. 1b shows the changes in the lattice parameters with increasing Y2O3 concentration. The increase in lattice parameters with Y content exhibited a good linear relationship in accordance with Vegard's law30 and with single phase composition evidenced by qualitative XRD analysis, which means that even at high concentrations of Y2O3, Y3+ ions are possible to substitute into the perovskite structure at the given sintering temperature. Meanwhile, Fig. 1b also shows that with increasing Y content, the relative density decreased. The observed effect suggests that high concentration of Y2O3 had an inhibitory effect on the densification of BaZr0.8−xCe0.2YxO3−δ during sintering, which will be discussed further combined with the microstructural investigations.
The SEM images of polished BaZr0.8−xCe0.2YxO3−δ ceramics were obtained using a backscattered electron detector (BSD) as shown in Fig. 2. As it can be seen from the images, the number of pores increases as the Y content increase, which is consistent with the results of the relative density. Moreover, when the Y content is greater than 25%, secondary phase with different contrasts compared to the main phase can be found. In the BZCY-Y30 sample, two typical regions have been identified: one is a relatively dense region, and the other is a relatively porous region. The grain size analysis shown in Fig. 2f reveals that with increasing Y content, the average grain size initially increases and then decreases. In the BZCY-Y30 sample, the grains in the dense region are smaller compared to the grains in the relatively porous region.
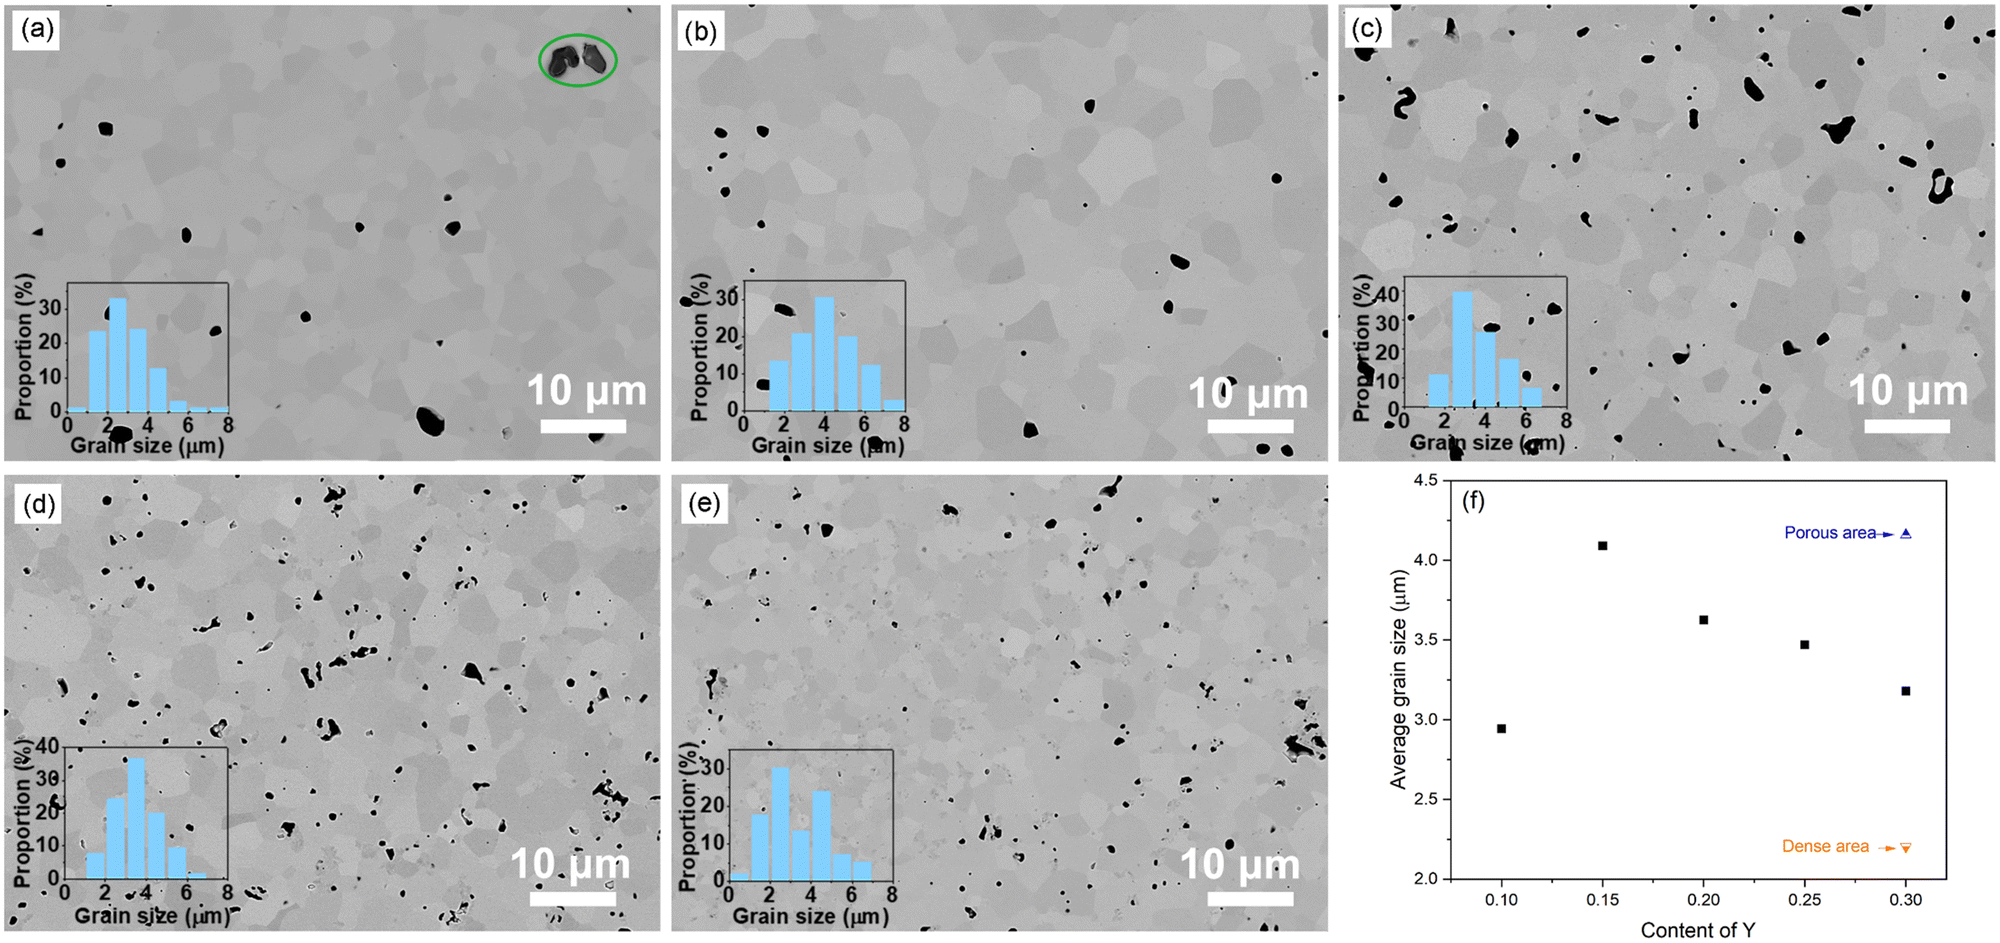 | ||
| Fig. 2 (a)–(e) SEM-BSD images of the polished surface of BaZr0.8−xCe0.2YxO3−δ ceramics. The inserts show the grain size distribution (a) BZCY–Y10, the marked particles are identified as residual NiO (b) BZCY–Y15, (c) BZCY–Y20, (d) BZCY–Y25, and (e) BZCY–Y30. (f) Average grain size as a function of the Y content. | ||
EDS analysis was performed on the BZCY-Y30 sample to determine the composition of the secondary phase. Elemental mapping was applied on a typical area encompassing the relatively dense and relatively porous regions, as shown in Fig. 3. The spectrum results show that Ba, Zr, and Ce are uniformly distributed, but there are Y-rich areas. The enrichment observed in the relatively dense and relatively porous regions differs. As shown in Fig. 3, the Y-rich phases in the relatively dense region exhibit smaller grain sizes but higher density. Conversely, the Y-rich phases in the relatively porous region show the opposite trend. This non-uniform segregation is likely a result of insufficient homogeneity in the calcined powder before sintering. Additionally, the presence of secondary Y-rich phases is expected to impact mass transfer during the sintering process. This is manifested in the inhibition of grain growth, as observed in the relatively dense region. The Y-rich particles in the porous region have larger grain size and thus have less surface energy. Owning to the lower driving force for further growth, they tend to anchor between two matrix grains, affecting densification during sintering and preventing the elimination of pores. This can be observed in Fig. 3, where the porous region shows large pores always adjacent to the larger Y particles. Although no apparent secondary Y-rich phases were detected in samples with lower Y content, the possibility of trace Y precipitation at grain boundaries, inhibiting grain growth, cannot be ruled out. This also explains the gradual reduction in average grain size when Y content exceeds 15 mol%. However, note that no impurity peaks belonging to the secondary phase were found in the XRD results, indicating that the proportion of the secondary phase was very low (below the XRD detection limit). In addition, the linear relationship between the lattice parameters and Y concentration shown in Fig. 1b also indicated that most of the Y was substituted into the main perovskite phase, and only a small amount of Y aggregated to form Y-rich secondary phases.
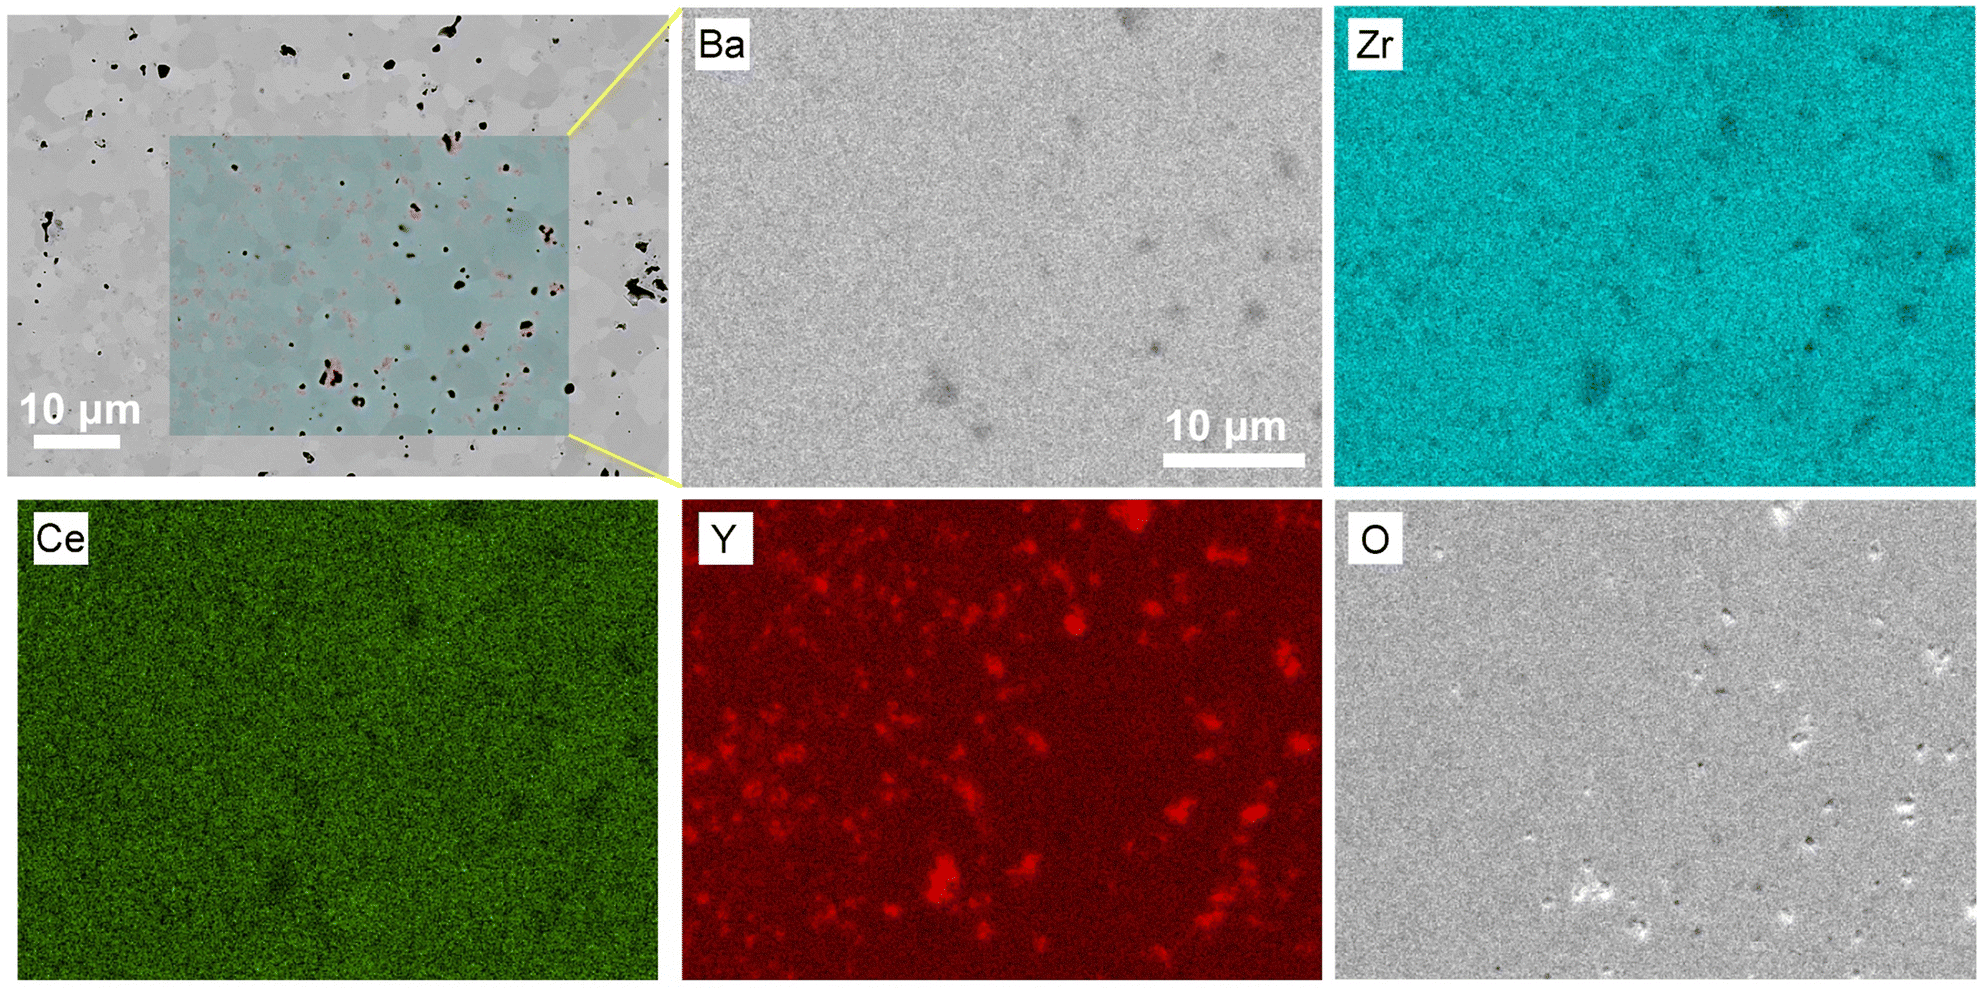 | ||
| Fig. 3 Elemental mapping of the polished BZCY–Y30 specimen. | ||
Hydration behaviour
Fig. S2 (ESI†) depicts the mass change recorded versus time and temperature for the studied BaZr0.8−xCe0.2YxO3−δ materials, from which the proton concentration can be derived according to eqn (1). Fig. 4a additionally illustrates the temperature dependency behavior of the proton concentration. As it can be observed in the figure, due to the exothermal nature of the hydration process, as the temperature decreases, the degree of hydration gradually increases. It is also evident that with an increase in the Y content, and consequently the generated oxygen vacancies, the proton concentration also gradually rises. The hydration process can be expressed using the following defect equation (eqn (2)), which shows that oxygen vacancies and proton concentration are proportionally dependent: | (2) |
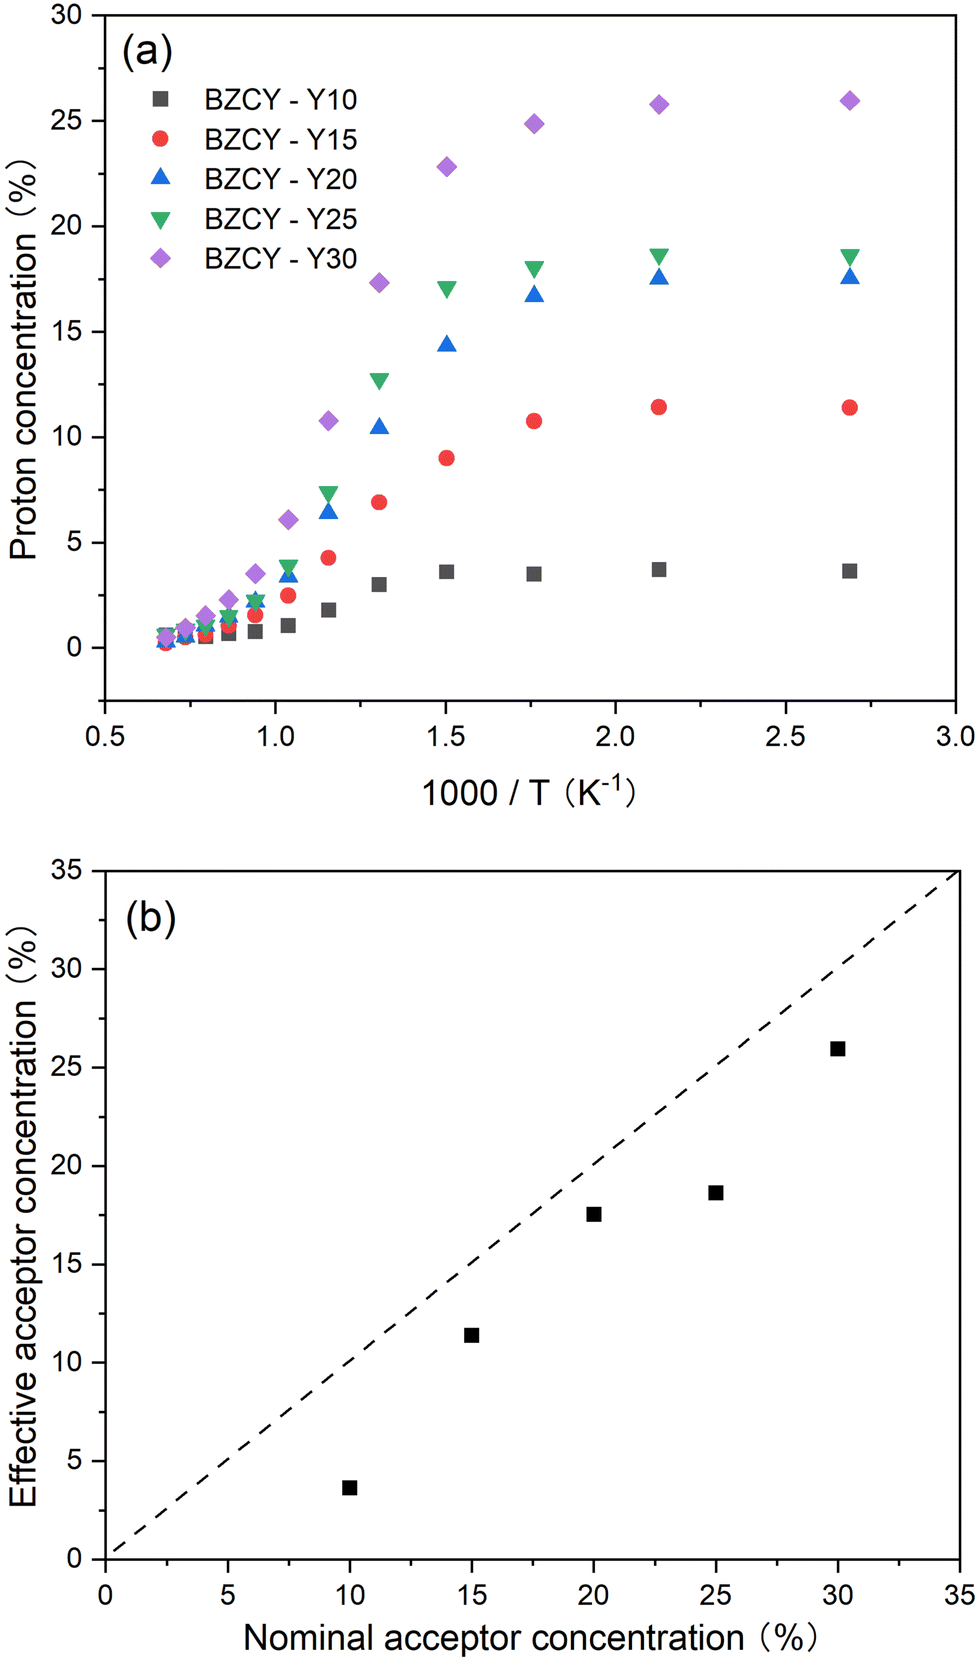 | ||
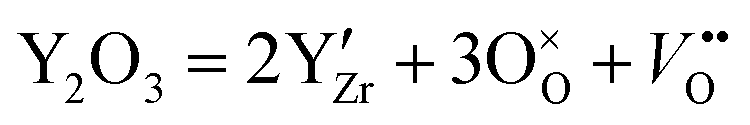
| Fig. 4 (a) Temperature dependency of the proton concentration for the materials in the BaZr0.8−xCe0.2YxO3−δ series. (b) Effective acceptor concentration versus the nominal acceptor concentration: the dashed line shows the theoretical acceptor concentration, while the symbols reflect the experimentally derived effective concentration based on data collected at 100 °C. | ||
Therefore, the proton concentration is highly dependent on the concentration of oxygen vacancies, and the concentration of oxygen vacancies is determined by the content of acceptor Y. This formation of oxygen vacancy can be expressed using the following equation:
 | (3) |
Combining eqn (2) and (3), it can be noted that two Y atoms generate one oxygen vacancy, and during the hydration process, one oxygen vacancy produces two protons. Therefore, the proton concentration should be theoretically equal to the nominal Y concentration after complete hydration. Here, the proton concentration at 100 °C is considered as the effective acceptor concentration and is plotted against the nominal acceptor concentration as shown in Fig. 4b. The dashed line represents the theoretical maximum effective acceptor substituent concentration. It can be observed that the effective substituent concentration increases with an increase in Y content. This suggests that even at high Y concentrations, most of the Y can still effectively substitute into the B-site in the perovskite lattice, resulting in the generation of oxygen vacancies. However, it is worth noting that the effective acceptor concentration is still lower than the theoretical concentration. There are two possible reasons. First, SEM analysis indicates that a small amount of Y tends to segregate into a secondary Y-rich phase. Secondly, several studies suggest that the addition of NiO as a sintering aid leads to a lower proton uptake.26,31 Huang et al.25 discussed various reasons for NiO reducing proton concentration, with the most likely being the formation of a liquid phase of (Ba, Ni, Y)Ox during sintering, which consumes not only Y but also Ba at the A-site of the perovskite. This may lead to a small amount of Y substituting Ba, forming 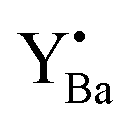 defects, thereby reducing the effective doping concentration of the substituent.
Electrical properties
The electrochemical impedance analysis of the BZCY-Y10 sample is presented in Fig. 5 to illustrate the analysis process. At a relatively low testing temperature of 150 °C, two distinct arcs can be identified at high frequencies. The fitting equivalent circuit for these two arcs is shown in Fig. 5a. Resistor (R) and constant phase element (CPE) are placed in parallel position, representing the grain interiors or grain boundaries. The two of the R/CPE components are connected in series according to the brick layer model explained in detail by Haile et al.32 The fitting resulted in obtaining the capacitances of two arcs that can be then assigned to the deconvoluted bulk and grain boundary contributions. For the first arc in the high-frequency region, a capacitance of 5.74 × 10⁻¹¹ F was calculated, while for the second arc, the obtained value is 1.38 × 10⁻⁸ F, which typically represent the responses of bulk and grain boundary, respectively.33 When the temperature rises to 200 °C, the fitted capacitance values show consistency (Fig. 5b). In this case, it is possible to obtain the resistance of both bulk and grain boundary separately. However, the arcs of bulk and grain boundary gradually overlap at higher temperatures as shown in Fig. 5c, and the tail of the grain boundary arc (high frequency) is the only visible part eventually. In this situation, it is impossible to separately obtain the electrochemical responses of bulk and grain boundary. Only the total resistance value can be estimated by the intercept of the tangent line of the tail of the grain boundary arc with the real axis. The grain conductivity and the total conductivity can be calculated using the following equation: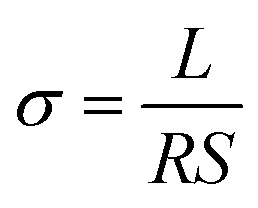 | (4) |
 | (5) |
 | (6) |
 | ||
| Fig. 5 Nyquist plots of BZCY-Y10 at elevated temperature. (a) 150 °C. (b) 200 °C. (c) 250–400 °C. | ||
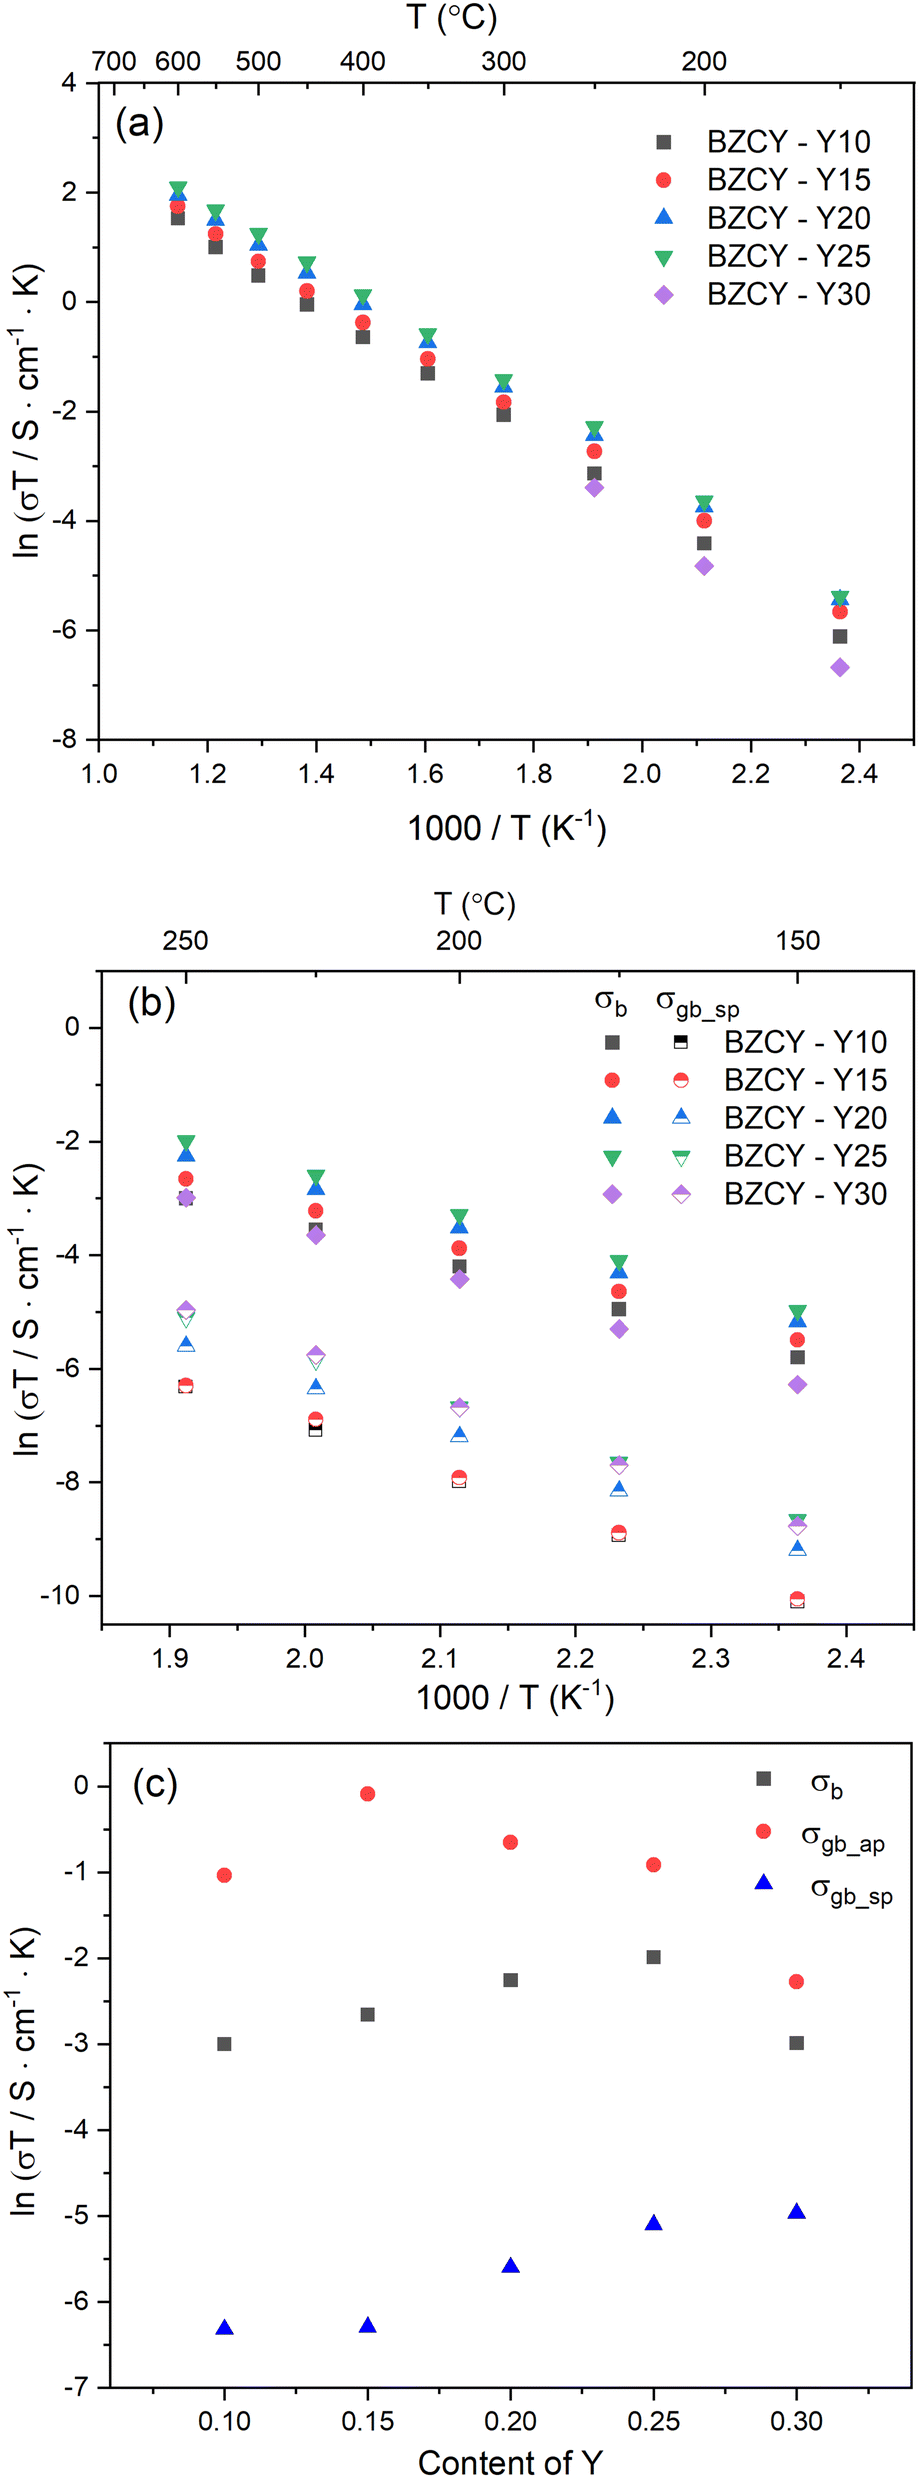 | ||
| Fig. 6 Conductivity of the materials in the BaZr0.8−xCe0.2YxO3−δ series: (a) Arrhenius plots of total conductivity in the temperature range of 150–600 °C under humid air, (b) Arrhenius plots of bulk (full symbol) and specific grain boundary (half symbol) conductivities in the temperature range of 150–250 °C, (c) bulk, apparent and specific grain boundary conductivities as a function of Y content at 250 °C. | ||
| BZCY-Y10 | BZCY-Y15 | BZCY-Y20 | BZCY-Y25 | BZCY-Y30 | |
|---|---|---|---|---|---|
| Total conductivity at 600 °C (S cm−1) | 5.3 × 10⁻³ | 6.6 × 10⁻³ | 8.0 × 10⁻³ | 9.4 × 10⁻³ | N/A |
| Activation energy (from 100–250 °C) of bulk (eV) | 0.54 | 0.54 | 0.56 | 0.57 | 0.63 |
| Activation energy (from 100–250 °C) of grain boundary (eV) | 0.72 | 0.73 | 0.69 | 0.68 | 0.73 |
| σ b at 250 °C (S cm−1) | 9.5 × 10⁻⁵ | 1.3 × 10⁻⁴ | 2.0 × 10⁻⁴ | 2.6 × 10⁻⁴ | 9.7 × 10⁻⁵ |
| σ gb_ap at 250 °C (S cm−1) | 6.8 × 10⁻⁴ | 1.7 × 10⁻³ | 9.9 × 10⁻⁴ | 7.7 × 10⁻⁴ | 2.0 × 10⁻⁴ |
| σ gb_sp at 250 °C (S cm−1) | 3.5 × 10⁻⁶ | 3.5 × 10⁻⁶ | 7.1 × 10⁻⁶ | 1.2 × 10⁻⁵ | 1.3 × 10⁻⁵ |
The conductivities of the bulk and grain boundary at temperatures below 250 °C were obtained by fitting EIS. Arrhenius plots of bulk conductivity and specific grain boundary conductivity are shown in Fig. 6b. By linear fitting, the activation energies of the bulk and grain boundary can be obtained as shown in Table 1. With increasing Y content, the activation energy of the bulk increases slightly, and the activation energy of BZCY-Y30 is significantly higher than that of the other low Y concentration samples. The variation in activation energy of the grain boundary shows no clear compositional trend. Furthermore, three of the BZCY-Y10 samples were selected to confirm the reproducibility of the experiment. This result is shown in Fig. S3 (ESI†). The variation of both σb and σgb_sp for these three samples is in an acceptable range.
In order to better understand the effect of the employed different Y contents on the conductivity of the studied BZCY samples, one should consider and analyze their bulk and grain boundary conductivities in detail as depicted in Fig. 6c.
Bulk conductivity
Fig. 6c illustrates the variation of bulk conductivity with Y content at 250 °C. A significant decrease in conductivity is observed for BZCY-Y30, which is related to the excess Y-rich phases observed in the SEM images in Fig. 3e. BZCY-Y30 will be excluded in the subsequent discussion on conductivity. Except for BZCY-Y30, the bulk conductivity continues to increase with the increasing Y content. The comparison of conductivity at 250 °C has several advantages. First, as mentioned above, it is difficult to separate the conduction contributions from the bulk and grain boundary during EIS at higher temperatures. Second, at this temperature, the degree of hydration of BZCY material is nearly at the saturated level, as shown in Fig. 4a, providing a better reference value when considering proton concentration. Finally, at such a relatively low temperature, the conductivity contribution mainly comes from proton migration rather than from other charge carriers such as electrons or oxygen ions.35 According to the conductivity equation:| σ = nqμ | (7) |
As suggested by eqn (6), apart from the concentration of charge carriers, their mobility also plays an essential role. In the literature, two mechanisms describing the influence of Y cations on proton mobility in the BZCY materials are discussed. The first one is the trapping effect of the dopant.36 In this concept, Y3+ acts as an aliovalent dopant on the Zr4+ site, for instance, thus forming a negative charge center. When a proton migrates to an O-site adjacent to a Y-site, it gets captured there because the energy required for this proton to rotate or migrate within the region is lower than the energy required to migrate out of it.37,38 This confinement restricts the long-range migration capability of protons. Therefore, Y substitution will be expected to decrease the proton mobility based on the trapping effect theory.
Another mechanism discusses an alternative effect of high Y concentrations on proton long-range migration, which is called the nanoscale percolation effect.39 The trapping effect of the individual Y cation on protons is also acknowledged in this theory. However, as the concentration of Y is high, there is a probability for Y cations to become adjacent to each other. When protons migrate within such regions formed by continuous Y-sites, the activation energy required is even lower than that for migration to other sites such as Zr-sites. This rapid pathway for protons formed by the continuous Y-site is termed as the nanoscale percolation effect. Such effect becomes more pronounced at higher Y concentrations. In other words, high concentrations of Y substitution facilitate an increase in proton mobility.
The competitive relationship between these two mechanisms for proton mobility, one having a negative impact and the other having a positive impact, collectively contributes to the effect of Y substitution on proton mobility. Considering the experimental results shown in Table 1, it is verified that the mobility of protons at 250 °C does not significantly change with increased Y content (from 10 at% to 0.25 at%). One may therefore speculate that these two effects have almost equal influence in the studied BZCY materials. The slight increase in bulk conductivity activation energy as shown in Table 1 also confirms this. In the computational work by Toyoura et al.,40 the degree of influence of the trapping effect and percolation effect of dopants on proton mobility was assessed. The authors similarly pointed out that the preferential conduction pathways formed by Y cations moderate the strong trapping effect, resulting in a minor reduction of proton diffusivity and mobility. Moreover, they also noted that interactions between protons could have a negative impact on their mobility,41 but this effect is also counteracted by the Y nanoscale percolation effect.
Most of the studies on the influence of Y on proton mobility are conducted using computational methods, for example density functional theory or molecular dynamics.38–40 In this work, this influence has been demonstrated from an experimental perspective. However, it should be noted that both mechanisms are temperature-dependent.36,39 This means that one effect may have a stronger influence than the other at different temperatures. Unfortunately, it is not possible to obtain solely bulk conductivity information from EIS at higher temperatures. It can only be demonstrated that at the relatively low temperature of 250 °C, there is a balancing among different mechanisms in this studied BZCY composition, resulting in minor changes in mobility with the increase of Y.
Grain boundary conductivity
The effect of Y content on both the apparent and specific grain boundary conductivities is depicted in Fig. 6c. The σgb_ap is significantly influenced by grain size, as the grain boundary density is directly affected by the average grain size. In fact, the trend of σgb_ap with Y content, as shown in Fig. 6c matches the grain size variation shown in Fig. 2f very well. Therefore, the comparison of the σgb_sp can be more helpful for a better understanding of the grain boundary properties. As shown in Fig. 6c, the σgb_sp gradually increases with an increase in Y content.Investigating the proton conduction across the grain boundary is more complex due to the unique microstructure. To gain better insights into the grain boundary chemistry, the elemental composition of BZCY-Y10 was characterized using STEM-EDS analysis, as shown in Fig. 7. A characterization of the selected grain boundaries is performed here to compare the chemical composition of interfaces discussed in this study to other reports in the literature. The selected area of analysis is shown in Fig. 7a and b. As shown in Fig. 7c and d, Ba, Zr, Ce and O are relatively homogeneously distributed in the adjacent grains with a slight deficiency for Zr and O in the grain boundary areas analyzed. However, the EDS results clearly illustrate the segregation of Y and Ni to the grain boundary that can be explained using the grain boundary space charge layer model.42 During sintering, positive charge point defects such as oxygen vacancies segregate to the grain boundary due to energetic effects induced by the structural change of the crystal lattice, forming positive charge grain boundary cores.43 Consequently, negative charge defects such as  and
and  segregate to the grain boundary to compensate the positive grain boundary core charge, thus forming an acceptor concentration gradient. Similar segregation effects have been observed in different BaZrO3-based compositions mainly by using atom probe tomography (APT) and transmission electron microscopy techniques.43–50 The electrostatic driving force is also the reason why the cations of Zr and Ce did not show obvious segregation at the grain boundaries. The same phenomenon was also confirmed for the high Y concentration sample BZCY-Y30 by STEM-EDS as shown in Fig. S4 (ESI†). However, due to the higher bulk concentration of Y on the B-site in this composition, the ratio between Y segregation and bulk concentration is lower.
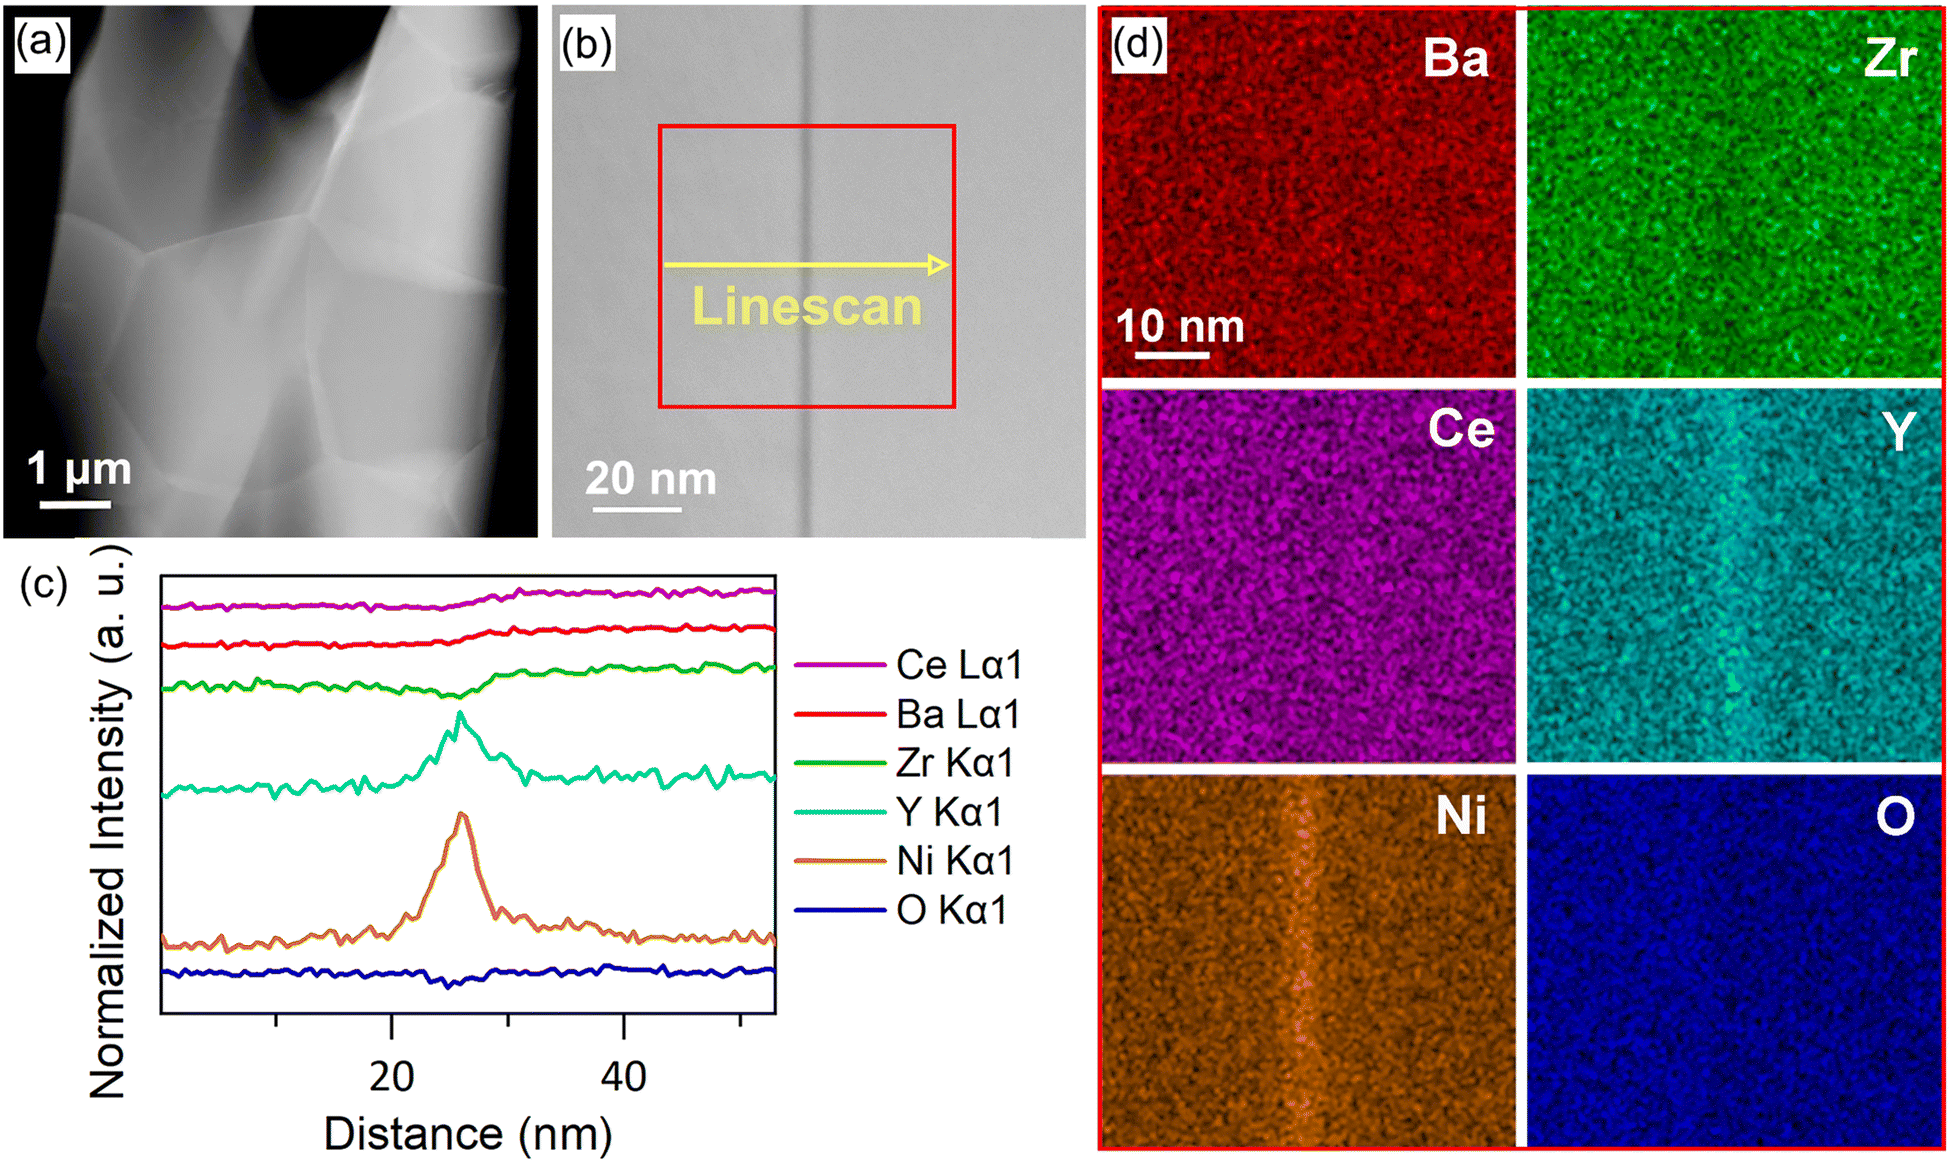 | ||
| Fig. 7 (a) and (b) High-angle annular dark-field images (HAADF) of the BZCY-Y10 microstructure and an edge-on grain boundary (the electron beam is parallel to the grain boundary). (c) Integrated linescan derived from the EDS elemental mapping in (d). | ||
Fig. 8b illustrates how such a space charge layer affects proton conduction at the grain boundaries. The positively charged grain boundary core leads to an electrostatic potential difference from the grain boundary core to the bulk, as indicated by the red curve. Under this electrostatic driving force, a depletion of protonic defects  occurs within the space charge layer, as shown by the dashed blue curve. This directly leads to a decrease in grain boundary conductivity. Fortunately, the segregation of Y as shown by the solid blue line partially compensates the electrostatic potential, mitigating proton depletion at the grain boundary. This is also the reason why with increasing Y substitution content, the conductivity at grain boundaries gradually increases as shown in Fig. 6c.
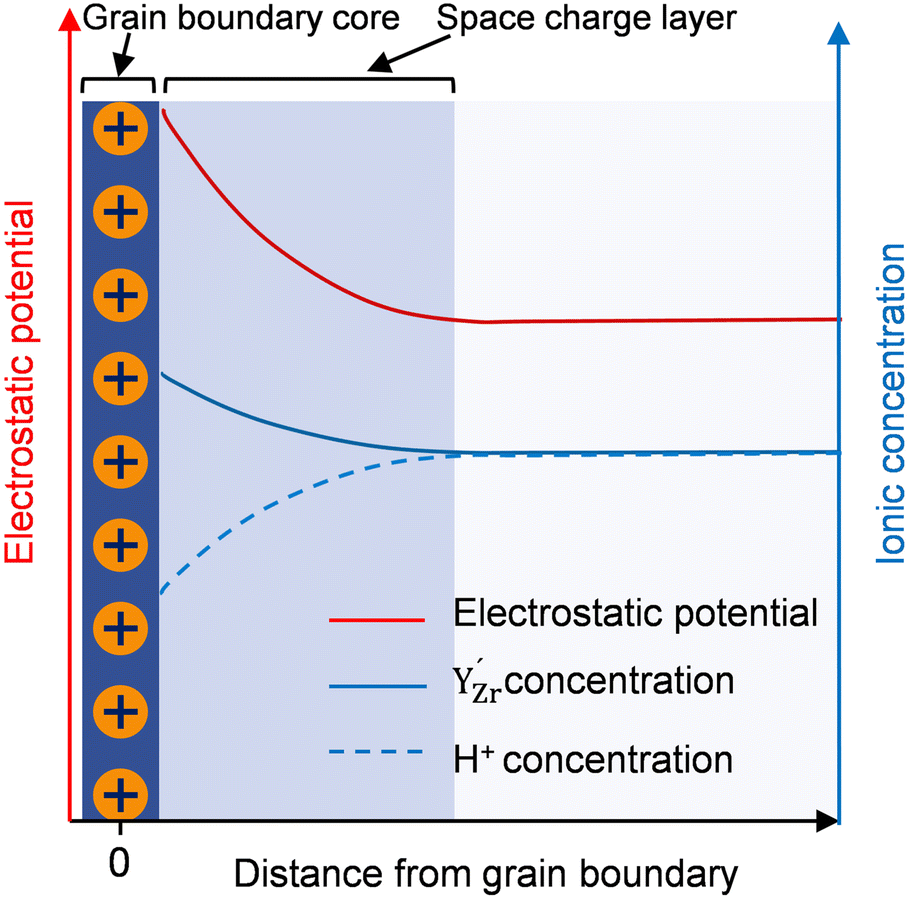 | ||
Fig. 8 Space charge layer model and the corresponding distribution of  and and  concentrations. concentrations. | ||
The proton conductivity of similar composition from the literature is plotted in Fig. S5 (ESI†) to compare the conductivity in this work. For bulk conductivity, our results are within the same order of magnitude as those reported in the literature. However, for grain boundary conductivity, both our results and those from the literature exhibit a wider range. This is because grain boundaries are more significantly affected by the ceramics processing conditions than bulk conductivity.
Mechanical properties and thermal-chemical stability
In addition to the electrochemical properties, the mechanical performance and thermo-chemical stability of BZCY materials also deserve attention from the perspective of application. Fig. 9 shows the hardness and elastic modulus of BZCY materials with different Y content. BZCY-Y10 shows similar elastic modulus values as those reported in the literature.51,52 With the same lattice structure, the increase in the lattice parameter due to the Zr substitution with Y generally leads to a decrease in elastic modulus.53 Except for BZCY-Y15, the elastic modulus shown in Fig. 9 does exhibit an overall decreasing trend. The exception for BZCY-Y15 might be related to a grain size dependency of the elastic modulus. The elastic modulus of the grain boundary might differ from that of the grain interior, and different grain sizes can affect the fraction of the grain boundary within the indentation area, thus impacting the elastic modulus.54 The hardness of ceramic materials is influenced by many factors, including grain size and porosity, in addition to the inherent properties of the material.55 The hardness of BZCY materials remains quite constant within the studied compositional range with values ranging from 8 to 9 GPa.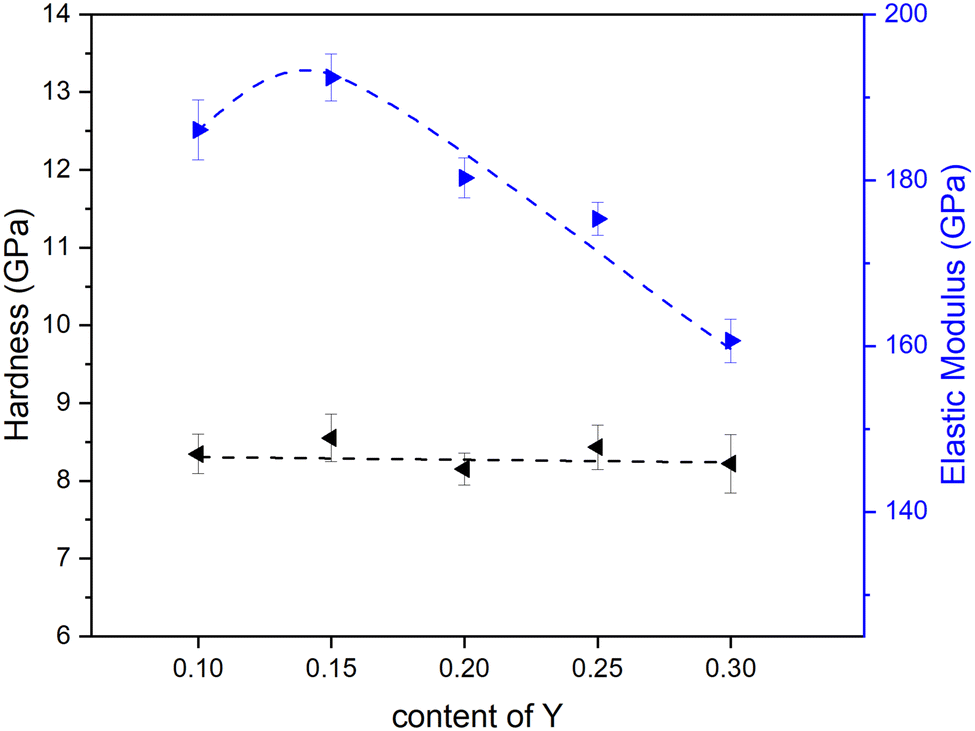 | ||
| Fig. 9 Compositional dependence of the micro-indentation hardness and the elastic modulus within the series BaZr0.8−xCe0.2YxO3−δ. (Fitting results are only for visual reference). | ||
Next to mechanical properties, the chemical stability of BZCY materials in water and CO2 containing atmospheres is of significant concern for the durable operation of electrochemical devices based on BZCY ceramics. The element Ba readily reacts with water to form Ba(OH)2,56 and Ba(OH)2 can easily convert to BaCO3 upon exposure to CO2 containing atmosphere. Ba can also react directly with CO2 to form BaCO3.6Fig. 10 shows the XRD patterns recorded for BZCY-Y20 exposed to different atmospheres at 700 °C. To better observe potential minor peaks indicating phase instabilities, the intensity is displayed on a logarithmic scale. As expected, BZCY samples with a high Zr/Ce ratio maintain their original perovskite structure after exposure to various atmospheres, with no significant secondary phases detected. Fig. S6 (ESI†) presents the XRD patterns of the other compositions exposed to different atmospheres. Only the BZCY-Y30 sample exposed to water vapor showed a small amount of BaCO3 phase. As observed from SEM-EDS, the Y-rich secondary phase is present in the BZCY-30 composition, which disbalances the stoichiometry. This increases the A/B ratio in the perovskite structure of ABO3, making the main perovskite phase BZCY to be Ba over-stoichiometric. The Ba over-stoichiometry makes BZCY more prone to degradation reactions.57,58 Nevertheless, the studied compositions in the high Zr/Ce ratio series BaZr0.8−xCe0.2YxO3−δ are proven to have high resistance to H2, H2O, and CO2.
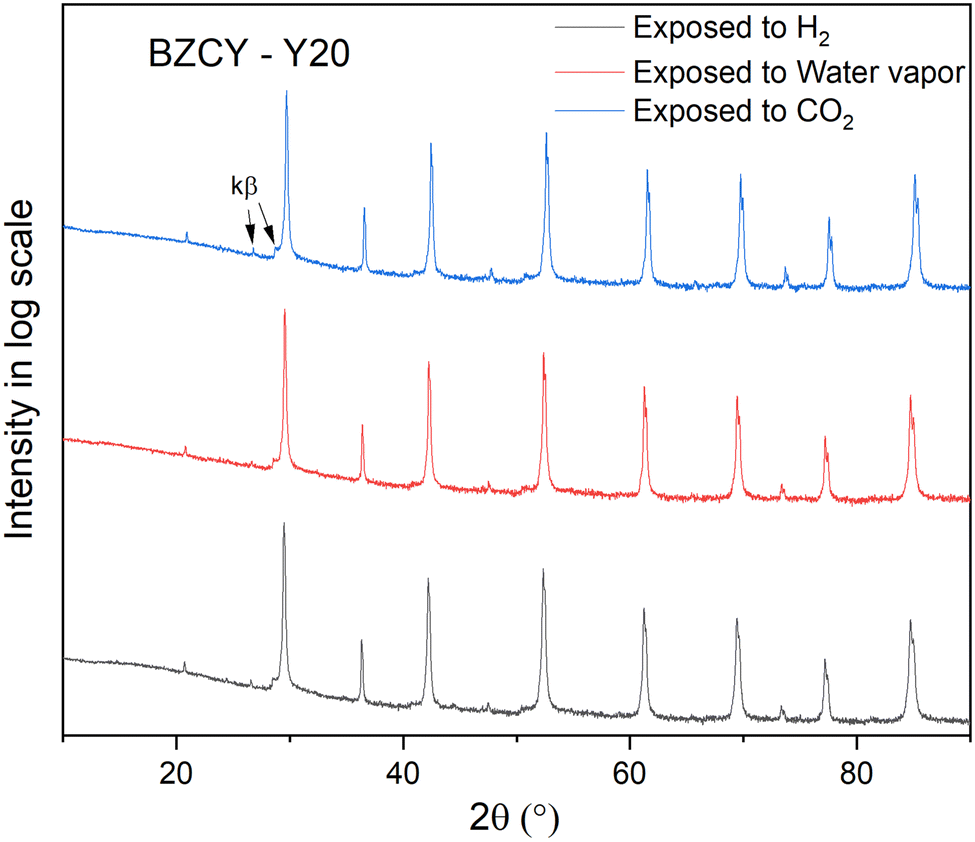 | ||
| Fig. 10 XRD patterns of BZCY-Y20 after exposure to H2, water vapor and CO2 containing atmospheres at 700 °C. Peak intensity is amplified bylogscale. | ||
Conclusions
In summary, owing to a high Zr/Ce ratio, the composition of BaZr0.8−xCe0.2YxO3−δ exhibited enough thermal-chemical stability for the potential application in electrochemical devices. Within the studied range of Y substitution concentrations, no significant secondary phases were detected in the XRD analysis. However, SEM analysis revealed the presence of Y-rich phases in samples with high Y substitution content. The proton conductivity is strongly related to the concentration of the acceptor Y. More Y means higher conductivity, primarily due to the higher proton concentration resulting from the increased Y content. From the EIS analysis results, the proton mobility in the bulk is almost independent of the Y concentration when Y is less than 25 at%, indicating a balance between different mechanisms influencing proton migration, such as the Y trapping effect and the Y nanoscale percolation effect. High Y substitution also contributes to higher grain boundary conductivity, as Y segregation promotes the proton conduction based on the space charge layer theory. However, this does not mean that more Y is always better, as excessive Y content can lead to the formation of secondary phases due to solubility saturation, which adversely affects both conductivity and stability. Therefore, 20 at% of Y content is the optimal substitution concentration to ensure the highest conductivity without the formation of secondary phases.Data availability
Data supporting this study are available within the paper and the ESI.† Raw data including XRD patterns before and after exposure measurement, EIS and mechanical properties are available from ScienceDB at https://doi.org/10.57760/sciencedb.11392.Conflicts of interest
There are no conflicts to declare.Acknowledgements
This study was supported by the Chinese Scholarship Council (CSC), the Helmholtz Research Program “Materials and Technologies for the Energy Transition” (MTET) funded by the German Ministry of education (BMBF) and the Innovation Pool Solar Hydrogen funded by the Helmholtz Association. Open Access funding was enabled and organized by project DEAL. M. K. is acknowledged for the financial support from the German Research Foundation (DFG – 491111487) under the project MA 1280/69-1. Dr Doris Sebold is acknowledged for her support with SEM imaging.References
- Y. Zhang, R. Knibbe, J. Sunarso, Y. Zhong, W. Zhou, Z. Shao and Z. Zhu, Adv. Mater., 2017, 29, 1700132 CrossRef.
- C. Duan, J. Tong, M. Shang, S. Nikodemski, M. Sanders, S. Ricote, A. Almansoori and R. O’Hayre, Science, 2015, 349, 1321–1326 CrossRef CAS PubMed.
- L. Bi, S. Boulfrad and E. Traversa, Chem. Soc. Rev., 2014, 43, 8255–8270 RSC.
- K. D. Kreuer, Annu. Rev. Mater. Res., 2003, 33, 333–359 CrossRef CAS.
- J. Jing, J. Pang, L. Chen, H. Zhang, Z. Lei and Z. Yang, Chem. Eng. J., 2022, 429, 132314 CrossRef CAS.
- R. Sažinas, M. F. Sunding, A. Thøgersen, I. Sakaguchi, T. Norby, T. Grande and J. M. Polfus, J. Mater. Chem. A, 2019, 7, 3848–3856 RSC.
- N. Zakowsky, S. Williamson and J. Irvine, Solid State Ionics, 2005, 176, 3019–3026 CrossRef CAS.
- K. H. Ryu and S. M. Haile, Solid State Ionics, 1999, 125, 355–367 CrossRef CAS.
- H.-S. Kim, H. B. Bae, W. Jung and S.-Y. Chung, Nano Lett., 2018, 18, 1110–1117 CrossRef CAS PubMed.
- Z. Zhong, Solid State Ionics, 2007, 178, 213–220 CrossRef CAS.
- E. Fabbri, A. Depifanio, E. Dibartolomeo, S. Licoccia and E. Traversa, Solid State Ionics, 2008, 179, 558–564 CrossRef CAS.
- S. Choi, C. J. Kucharczyk, Y. Liang, X. Zhang, I. Takeuchi, H.-I. Ji and S. M. Haile, Nat. Energy, 2018, 3, 202–210 CrossRef CAS.
- L. Yang, S. Wang, K. Blinn, M. Liu, Z. Liu, Z. Cheng and M. Liu, Science, 2009, 326, 126–129 CrossRef CAS PubMed.
- M. Ivanova, S. Ricote, S. Baumann, W. Meulenberg, F. Tietz, J. Serra and H. Richter, Doping: Properties, Mechanisms and Applications, 2013, pp. 221–276 Search PubMed.
- N. Agmon, Chem. Phys. Lett., 1995, 244, 456–462 CrossRef CAS.
- T. Norby, Solid State Ionics, 1999, 125, 1–11 CrossRef CAS.
- D. Han, K. Shinoda, S. Sato, M. Majima and T. Uda, J. Mater. Chem. A, 2015, 3, 1243–1250 RSC.
- K. D. Kreuer, S. Adams, W. Münch, A. Fuchs, U. Klock and J. Maier, Solid State Ionics, 2001, 145, 295–306 CrossRef CAS.
- E. Gilardi, E. Fabbri, L. Bi, J. L. M. Rupp, T. Lippert, D. Pergolesi and E. Traversa, J. Phys. Chem. C, 2017, 121, 9739–9747 CrossRef CAS.
- S. Imashuku, T. Uda, Y. Nose, G. Taniguchi, Y. Ito and Y. Awakura, J. Electrochem. Soc., 2009, 156, B1 CrossRef CAS.
- S. Ricote, N. Bonanos, M. C. Marco de Lucas and G. Caboche, J. Power Sources, 2009, 193, 189–193 CrossRef CAS.
- C.-S. Tu, R. R. Chien, V. H. Schmidt, S. C. Lee and C.-C. Huang, J. Phys.: Condens. Matter, 2012, 24, 155403 CrossRef PubMed.
- S. Nikodemski, J. Tong and R. O’Hayre, Solid State Ionics, 2013, 253, 201–210 CrossRef CAS.
- D. Han, K. Goto, M. Majima and T. Uda, ChemSusChem, 2021, 14, 614–623 CrossRef CAS PubMed.
- Y. Huang, R. Merkle and J. Maier, Solid State Ionics, 2020, 347, 115256 CrossRef CAS.
- Y. Huang, R. Merkle and J. Maier, J. Mater. Chem. A, 2021, 9, 14775–14785 RSC.
- B. H. Toby and R. B. Von Dreele, J. Appl. Crystallogr., 2013, 46, 544–549 CrossRef CAS.
- T. Schober, Solid State Ionics, 2000, 127, 351–360 CrossRef CAS.
- X. Li and B. Bhushan, Mater. Charact., 2002, 48, 11–36 CrossRef CAS.
- K. T. Jacob, S. Raj and L. Rannesh, Int. J. Mater. Res., 2007, 98, 776–779 CrossRef CAS.
- D. Han, L. Jiang and P. Zhong, Int. J. Hydrogen Energy, 2021, 46, 8767–8777 CrossRef CAS.
- S. M. Haile, D. L. West and J. Campbell, J. Mater. Res., 1998, 13, 1576–1595 CrossRef CAS.
- J. T. S. Irvine, D. C. Sinclair and A. R. West, Adv. Mater., 1990, 2, 132–138 CrossRef CAS.
- P. Babilo, T. Uda and S. M. Haile, J. Mater. Res., 2007, 22, 1322–1330 CrossRef CAS.
- G. Heras-Juaristi, D. Pérez-Coll and G. C. Mather, J. Power Sources, 2017, 364, 52–60 CrossRef CAS.
- Y. Yamazaki, F. Blanc, Y. Okuyama, L. Buannic, J. C. Lucio-Vega, C. P. Grey and S. M. Haile, Nat. Mater., 2013, 12, 647–651 CrossRef CAS PubMed.
- D. Vignesh, B. K. Sonu and E. Rout, Energy Fuels, 2022, 36, 7219–7244 CrossRef CAS.
- M. E. Björketun, P. G. Sundell and G. Wahnström, Phys. Rev. B: Condens. Matter Mater. Phys., 2007, 76, 054307 CrossRef.
- F. M. Draber, C. Ader, J. P. Arnold, S. Eisele, S. Grieshammer, S. Yamaguchi and M. Martin, Nat. Mater., 2020, 19, 338–346 CrossRef CAS.
- K. Toyoura, W. Meng, D. Han and T. Uda, J. Mater. Chem. A, 2018, 6, 22721–22730 RSC.
- K. Toyoura, T. Fujii, N. Hatada, D. Han and T. Uda, J. Phys. Chem. C, 2019, 123, 26823–26830 CrossRef CAS.
- C. Kjølseth, H. Fjeld, Ø. Prytz, P. I. Dahl, C. Estournès, R. Haugsrud and T. Norby, Solid State Ionics, 2010, 181, 268–275 CrossRef.
- D. R. Clark, H. Zhu, D. R. Diercks, S. Ricote, R. J. Kee, A. Almansoori, B. P. Gorman and R. P. O’Hayre, Nano Lett., 2016, 16, 6924–6930 CrossRef CAS PubMed.
- M. Shirpour, B. Rahmati, W. Sigle, P. A. Van Aken, R. Merkle and J. Maier, J. Phys. Chem. C, 2012, 116, 2453–2461 CrossRef CAS.
- M. Shirpour, G. Gregori, L. Houben, R. Merkle and J. Maier, Solid State Ionics, 2014, 262, 860–864 CrossRef CAS.
- D. R. Clark, H. Zhu, D. R. Diercks, S. Ricote, R. J. Kee, A. Almansoori, B. P. Gorman and R. P. O’Hayre, Nano Lett., 2016, 16, 6924–6930 CrossRef CAS.
- M. Kindelmann, S. Escolastico, L. Almar, A. Vayyala, D. Jennings, W. Deibert, W. A. Meulenberg, W. Rheinheimer, M. Bram, J. M. Serra, J. Mayer and O. Guillon, J. Mater. Chem. A, 2024, 12, 3977–3988 RSC.
- D. R. Diercks, B. P. Gorman, A. Manerbino and G. Coors, J. Am. Ceram. Soc., 2014, 97, 3301–3306 CrossRef CAS.
- D. R. Clark, D. R. Diercks, S. Ricote, T. Tauer Dearden, N. P. Sullivan, J. W. Medlin, B. P. Gorman and R. P. O’Hayre, J. Mater. Chem. C, 2023, 11, 5082–5091 RSC.
- M. Kindelmann, I. Povsturgar, S. Kuffer, D. Jennings, J. N. Ebert, M. L. Weber, M. P. Zahler, S. Escolantico, L. Almar, J. M. Serra, P. Kaghazchi, M. Bram, W. Rheinheimer, J. Mayer and O. Guillon, ChemRxiv, preprint, 2024, DOI:10.26434/chemrxiv-2024-svz4w.
- K. Hinata, N. Sata, R. Costa and F. Iguchi, Meet. Abstr., 2020, MA2020-02, 2617 CrossRef.
- E. Makagon, R. Merkle, J. Maier and I. Lubomirsky, Solid State Ionics, 2020, 344, 115130 CrossRef CAS.
- F. Iguchi and K. Hinata, Metals, 2021, 11, 968 CrossRef CAS.
- R. Chaim and M. Hefetz, J. Mater. Sci., 2004, 39, 3057–3061 CrossRef CAS.
- T. Y. Sablina, I. N. Sevostyanova and G. V. Shlyakhova, Russ. Phys. J., 2022, 65, 635–642 CrossRef CAS.
- H. Matsumoto, Y. Kawasaki, N. Ito, M. Enoki and T. Ishihara, Electrochem. Solid-State Lett., 2007, 10, B77 CrossRef CAS.
- Á. Triviño-Peláez, D. Pérez-Coll, J. Mosa, C. Ritter, U. Amador and G. C. Mather, J. Power Sources, 2021, 493, 229691 CrossRef.
- J. N. Ebert, D. Jennings, W. S. Scheld, D. Sebold and W. Rheinheimer, J. Eur. Ceram. Soc., 2024, 44, 6995–7005 CrossRef CAS.
Footnote |
| † Electronic supplementary information (ESI) available. See DOI: https://doi.org/10.1039/d4cp04384g |
| This journal is © the Owner Societies 2025 |