 Open Access Article
Creative Commons Attribution 3.0 Unported Licence
Exploring coinage bonding interactions in [Au(CN)4]− assemblies with silver and zinc complexes: a structural and theoretical study†
Alessia
Giordana
 a,
Emanuele
Priola
 *a,
Ghodrat
Mahmoudi
 *bcd,
Esmail
Doustkhah
c,
Rosa M.
Gomila
 e,
Ennio
Zangrando
 f,
Eliano
Diana
 a,
Lorenza
Operti
a and
Antonio
Frontera
 *e
*e
aDepartment of Chemistry and NIS Centre, University of Turin, Via Pietro Giuria 7, 10125 Torino, Italy. E-mail: emanuele.priola@unito.it
bDepartment of Chemistry, Faculty of Science, University of Maragheh, P.O. Box 55136-83111, Maragheh, Iran. E-mail: ghodratmahmoudi@gmail.com
cChemistry Department, Faculty of Engineering and Natural Sciences, Istinye University, Sarıyer, Istanbul 34396, Turkey
dDepartment of Technical Sciences, Western Caspian University, Baku 1001, Azerbaijan
eDepartment of Chemistry, Universitat de les Illes Balears, Crta de Valldemossa km 7.5, 07122, Palma de Mallorca, Spain. E-mail: toni.frontera@uib.es
fDepartment of Chemical and Pharmaceutical Sciences, University ofTrieste, Via L. Giorgieri 1, 34127 Trieste, Italy
First published on 19th February 2025
Abstract
This study investigates the non-covalent interactions between [Au(CN)4]− anions and silver and zinc complexes, with a particular focus on coinage bonding interactions. Four new complexes, [Ag2(pyNP)2][Au(CN)4]2 (1) [Zn(bipy)3][Au(CN)4]2 (2), [Zn(phen)3][Au(CN)4]2 (3) and [Zn(terpy)(H2O)3][Au(CN)4]2 (4), were synthesized and spectroscopically characterized, including their X-ray solid-state structures, where pyNP is (2-(2-pyridyl)-1,8-naphthyridine, bipy is 2,2′ bipyridine, phen is 1,10′-phenantroline and terpy is terpyridine. The [Au(CN)4]− anion exhibits unique anion⋯anion interactions, despite the electrostatic repulsion, forming stable 1D supramolecular polymers in the solid state. Using a combination of X-ray crystallography and DFT calculations, this work characterizes the coordination and non-covalent bonding modes, including Au⋯N coinage bonds. Energy decomposition analysis (EDA), QTAIM, and NCIplot methods were applied to understand the energetics and bonding nature. The study reveals that electrostatic and dispersion forces play critical roles in stabilizing these assemblies, especially in the formation of π-stacking and T-shaped dimers. These findings offer insights into the design of new materials leveraging coinage bonding in molecular architectures.
1. Introduction
Non-covalent interactions between molecular entities have become a pivotal topic in modern supramolecular chemistry, influencing both solution-phase and solid-state chemistry.1 While much attention has been devoted to well-known halogen bonding and interactions involving main group elements, the focus has broadened to include non-covalent interactions involving transition metals.2 These interactions, observed in the solid-state chemistry of metals such as osmium, chromium, and rhenium, are more prevalent and impactful than once believed, sometimes strong enough to overcome Coulombic repulsion in cases of anion–anion or cation–cation interactions.3Among these metals, the coinage metals (copper, silver, and gold) are of particular interest. Their supramolecular chemistry, especially in the +1 oxidation state, has long been dominated by metallophilic interactions. However, recent findings have unveiled a more diverse set of non-covalent interactions, known as “coinage” or “regium” bonding.4,5 This phenomenon is especially pronounced in gold, which not only demonstrates strong metallophilic interactions but also participates in a wide array of coinage bonding interactions, particularly in the +3 oxidation state.6 These interactions are notable for their strength, even facilitating significant anion–anion attractions, with potential applications in biochemistry and pharmaceuticals.7 The terms coinage bonding or regium bonding are commonly used to differentiate coordination bonds with predominant covalent character from noncovalent interactions, where square planar or linear complexes of group 11 metals act as electron acceptors, typically classified as π-hole interactions.4,5 In these interactions, dispersion and relativistic effects are important. A similar conceptual distinction is applied in catalysis, where σ-hole catalysis refers to transition state (TS) stabilization through noncovalent interactions, whereas Lewis acid catalysis involves TS stabilization via covalent bonding with the catalyst.
Although the majority of studies have focused on halide complexes, Leznoff's pioneering work8 demonstrated that the tetracyanoaurate anion can also act as an efficient tecton for coinage bonding, findings that have been supported by high-level theoretical calculations.6,7
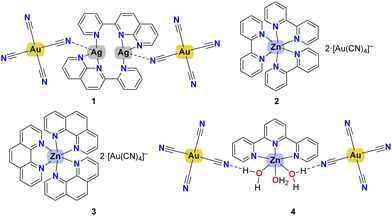
Building on these insights, we synthesized and analyzed the behaviour of the [Au(CN)4]− anion in the presence of various zinc and silver complexes, investigating their solid-state patterns and the influence of different counterions. DFT calculations were employed to explore the Ag⋯N and Au⋯N coinage bonds, where the [Au(CN)4]− anion acts as the electron donor in the former, and both electron donor and acceptor in the latter. To thoroughly characterize these coinage bonds in compounds 1–4 (see Scheme 1), a combination of computational techniques, including MEP surfaces, QTAIM, NCIPlot, ELF, and EDA, was utilized. We believe this work will deepen the understanding of coinage bonding in this relatively unexplored anion, paving the way for the development of new functional materials and molecular architectures.
2. Methods
2.1. Synthesis
IR main peaks for 1 (ν, cm−1): 3479(m), 3062(m), 2141(s), 1603(s), 1548(s), 1502(m), 1468(m), 1451(m), 1417(m), 1372(s), 1310(s), 1204(w), 1173(m), 1143(m), 1125(m), 1080(s), 1039(s), 905(m), 894(w), 855(s), 824(m), 786(s), 741(m), 713(w), 690(w), 640(w), 551(m).
![[thin space (1/6-em)]](https://www.rsc.org/images/entities/char_2009.gif) :
:![[thin space (1/6-em)]](https://www.rsc.org/images/entities/char_2009.gif) 3 ratio were mixed in 20 mL of ethanol and left under stirring condition until equilibrium was achieved. To this solution, two equivalents of K[Au(CN)4] were added, without any change in colour or precipitation. After dissolution, each solution was left to evaporate for a week and crystals of the desired compound (dark red prisms of 1, yellow prisms of 2 and dark pink prisms of 3) started to grow. The crystals were filtered and washed with cold water (yield of 2
3 ratio were mixed in 20 mL of ethanol and left under stirring condition until equilibrium was achieved. To this solution, two equivalents of K[Au(CN)4] were added, without any change in colour or precipitation. After dissolution, each solution was left to evaporate for a week and crystals of the desired compound (dark red prisms of 1, yellow prisms of 2 and dark pink prisms of 3) started to grow. The crystals were filtered and washed with cold water (yield of 2![[thin space (1/6-em)]](https://www.rsc.org/images/entities/char_2009.gif) :
:![[thin space (1/6-em)]](https://www.rsc.org/images/entities/char_2009.gif) 91.9%, yield of 3
91.9%, yield of 3![[thin space (1/6-em)]](https://www.rsc.org/images/entities/char_2009.gif) :
:![[thin space (1/6-em)]](https://www.rsc.org/images/entities/char_2009.gif) 89.9%, yield of 4
89.9%, yield of 4![[thin space (1/6-em)]](https://www.rsc.org/images/entities/char_2009.gif) :
:![[thin space (1/6-em)]](https://www.rsc.org/images/entities/char_2009.gif) 95.9%).
95.9%).
IR main peaks for 2 (ν, cm−1): 2140(s), 1636(m), 1608(s), 1567(m), 1558(m), 1466(w), 1427(s), 1313(w), 1241(s), 1152(w), 1071(m), 1065(s), 1044(m), 1020(w), 890(s), 770(w), 732(s), 650(w), 640(m), 426(m), 415(w); IR main peaks for 3 (ν, cm−1): 2160(s), 1610(m), 1604(s), 1543(m), 1533(m), 1452(w), 1410(s), 1302(w), 1220(s), 1163(w), 1089(m), 1055(s), 1023(m), 1010(w), 895(s), 750(w), 712(s), 620(w), 615(m), 446(m), 435(w).
![[thin space (1/6-em)]](https://www.rsc.org/images/entities/char_2009.gif) :
:![[thin space (1/6-em)]](https://www.rsc.org/images/entities/char_2009.gif) 1 ratio were mixed in 20 mL of ethanol and left under stirring conditions until equilibrium was achieved. To this solution, two equivalents of K[Au(CN)4] were added without any change in colour or precipitation. After dissolution, the solution was left to evaporate for a week and crystals of the desired compound (yellow prisms) started to grow. The crystals were filtered and washed with cold water (yield of 5
1 ratio were mixed in 20 mL of ethanol and left under stirring conditions until equilibrium was achieved. To this solution, two equivalents of K[Au(CN)4] were added without any change in colour or precipitation. After dissolution, the solution was left to evaporate for a week and crystals of the desired compound (yellow prisms) started to grow. The crystals were filtered and washed with cold water (yield of 5![[thin space (1/6-em)]](https://www.rsc.org/images/entities/char_2009.gif) :
:![[thin space (1/6-em)]](https://www.rsc.org/images/entities/char_2009.gif) 97.9%).
97.9%).
IR main peaks for 4 (ν, cm−1): 3373(w), 3062(w), 2925(m), 2850(w), 2163(s), 1592(s), 1445(s), 1388(m), 1312(w), 1242(w), 1157(m), 998(m), 759(s), 701(m), 652(w), 466(m).
2.2. X-ray details
Diffraction data of compounds 1–4 were collected at room temperature on a Xcalibur, AtlasS2, Gemini ultra diffractometer by using graphite monochromated Cu-Kα radiation (λ = 1.54184 Å). Data reductions were performed with CrysAlisPro software package,9 and proper absorption corrections were applied to the data sets.10 The structures were solved by direct methods with program SHELXS 2018/311 and refined by full matrix least-squares procedures using the SHELXL program.11 The intensity data of compound 4 were treated with program Squeezed (of Platon Package), to take into account some disordered residuals in the difference Fourier.12 Hydrogen atoms were placed at calculated positions and constrained to ride to atoms to which they are attached, except those of amine group of 2 that were located on the Fourier map and freely refined.Materials for publication were prepared using Diamond 3.2k13 program and WINGX package (Ver 2018.3).14 Crystal data and details of refinements are reported in Table S1 (ESI†).
2.3. Theoretical methods
The dimeric and trimeric assemblies of [Au(CN)4]− included in this study were fully optimized without symmetry constrains at the PBE0-D4/def2-TZVP level of theory15–17 using the dielectric constant of water by means of the TURBOMOLE 7.7.18 For the study of coinage bonds in the solid state of compound 1, we used the crystallographic coordinates at the same level of theory and without the utilization of polarization continuum model. The “atoms-in-molecules” (AIM)19 analysis of the electron density has been performed at the same level of theory using the Multiwfn program.20 The reduced density gradient (RDG) 2D plots,21 and ELF22 2D plots were computed using Multiwfn program.20 The Laplacian of electron density can be decomposed into the sum of contributions along the three principal axes of maximal variation, giving the three eigenvalues of the Hessian matrix (λ1, λ2, and λ3). The sign of λ2 can be utilized to distinguish bonding (attractive, λ2 < 0) weak interactions from non-bonding ones (repulsive, λ2 > 0).21 The QTAIM/NCIplot analysis was represented using the VMD software.23 The energy decomposition analysis (EDA) was performed using the Turbomole 7.7 program18 and the Kitaura–Morokuma partition scheme.243. Results and discussion
3.1. Description of the structures
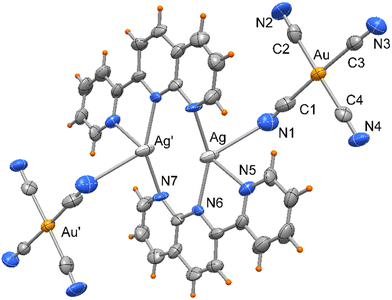
Compound 1 crystallizes in monoclinic space group P21/c, as a centrosymmetric complex, depicted in Fig. 1. It is formed by two silver(I) atoms mutually coordinated by two tridentate 2-(2-pyridyl)-1,8-naphthyridine ligands, chelating one metal through donors N5 and N6, and bound to the other via the N7 pyridyl nitrogen. In addition, the metals, separated by 2.918(2) Å, are symmetrically coordinated by tetracyanoaurate anions through one of the CN groups, so that Ag atoms are surrounded by four nitrogen atoms with Ag–N bond distances that vary from 2.250(10) to 2.427(9) Å, with the exception of Ag–N1 that is significantly longer, of 2.852(16) Å (see Table 1).| Symmetry code: #1 − x + 1, −y + 2, −z + 1. | |||
|---|---|---|---|
| Ag(1)–N(5) | 2.427(9) | Au(1)–C(1) | 1.998(17) |
| Ag(1)–N(6) | 2.306(9) | Au(1)–C(2) | 1.977(16) |
| Ag(1)–N(7)#1 | 2.250(10) | Au(1)–C(3) | 2.010(14) |
| Ag(1)–N(1) | 2.852(16) | Au(1)–C(4) | 1.955(14) |
| Ag(1)–Ag(1)#1 | 2.918(2) | ||
| N(5)–Ag(1)–N(6) | 71.1(4) | N(5)–Ag(1)–N(1) | 79.5(4) |
| N(5)–Ag(1)–N(7)#1 | 115.1(4) | N(6)–Ag(1)–N(1) | 130.7(4) |
| N(6)–Ag(1)–N(7)#1 | 147.3(4) | N(7)#1–Ag(1)–N(1) | 81.0(4) |
Each pyNP ligand has not coplanar atoms, and a dihedral angle of 10.9° is formed by the mean planes through the naphthyridine moiety and the pyridine rings. The Ag atoms are displaced from these mean planes by 0.69 and 1.55 Å, respectively, towards the apical cyano N1 nitrogen. The Au–C bond distances fall in the range 1.955(14)–2.010(14) Å, with almost linear cyanide coordination with N–C–Au bond angles that average to 175.2°.
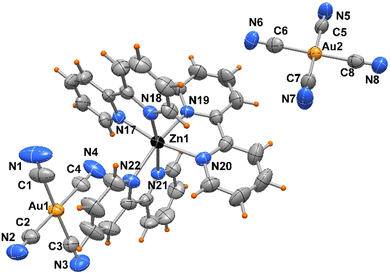
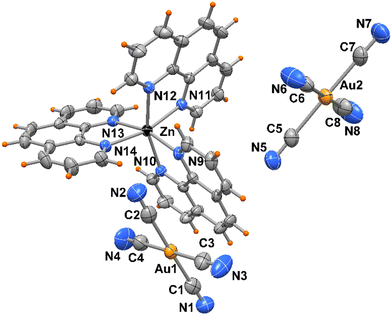
The crystal packing evidences discrete complexes interacting through π⋯π stacking between pyNP rings to form a linear chain in the direction of a axis (Fig. 2). Compounds 2 and 3 crystallize in triclinic space group P![[1 with combining macron]](https://www.rsc.org/images/entities/char_0031_0304.gif) and the X-ray structural analysis evidenced in the unit cells the presence of trischelated [Zn(bipy)3]2+ and [Zn(phen)3]2+ cations counterbalanced by tetracyanoaurate anions [Au(CN)4]−, (Fig. 3 and 4). Complex 2 has two close comparable independent units [Zn(bipy)3][Au(CN)4]2 in the unit cell.
and the X-ray structural analysis evidenced in the unit cells the presence of trischelated [Zn(bipy)3]2+ and [Zn(phen)3]2+ cations counterbalanced by tetracyanoaurate anions [Au(CN)4]−, (Fig. 3 and 4). Complex 2 has two close comparable independent units [Zn(bipy)3][Au(CN)4]2 in the unit cell.
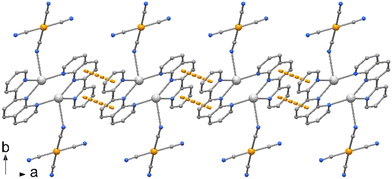 | ||
| Fig. 2 Crystal packing of compound 1 showing the polymeric chain along axis a built by π⋯π interactions between the pyNP rings. | ||
The Zn atoms exhibit distorted octahedral geometry with Zn–N bond distances varying from 2.115(5) to 2.212(5) Å in the two independent complexes of 2 and from 2.162(4) to 2.195(4) Å in 3. On the other hand, the gold atoms present Au–C bond lengths in the ranges of 1.976(8)–2.018(8) and 1.991(7)–2.019(7) Å, in compounds 2 and 3, respectively, with almost linear N–C–Au cyanide coordination (see Table 2).
| Complex 2 | |||
|---|---|---|---|
| Zn(1)–N(17) | 2.115(5) | Zn(2)–N(23) | 2.159(5) |
| Zn(1)–N(18) | 2.157(5) | Zn(2)–N(24) | 2.198(4) |
| Zn(1)–N(19) | 2.163(4) | Zn(2)–N(25) | 2.125(5) |
| Zn(1)–N(20) | 2.173(5) | Zn(2)–N(26) | 2.132(4) |
| Zn(1)–N(21) | 2.212(5) | Zn(2)–N(27) | 2.193(5) |
| Zn(1)–N(22) | 2.146(5) | Zn(2)–N(28) | 2.159(4) |
| Au–CN range | 1.976(8)–2.018(8) | ||
| Complex 3 | |||
|---|---|---|---|
| Zn(1)–N(9) | 2.195(4) | Zn(1)–N(12) | 2.183(4) |
| Zn(1)–N(10) | 2.168(4) | Zn(1)–N(13) | 2.162(4) |
| Zn(1)–N(11) | 2.195(4) | Zn(1)–N(14) | 2.156(4) |
| Au–CN range | 1.991(7)–2.019(7) |
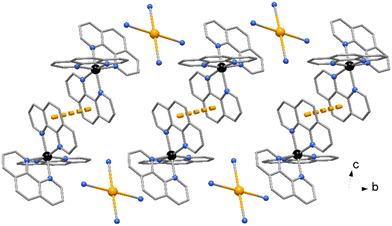
No significant π⋯π stacking interactions are detected in the crystal of compound 2, the complexes in 3 are centro-symmetrical paired with a centroid to centroid distance between central ring of phenanthrolines of 3.730(3) Å (Fig. 5). On the other hand, a myriad of C–H⋯π and CN⋯π interactions are observed in the crystal packing of both complexes. While [Au(CN)4]− anions in 2 are embedded among the Zn complexes, in 3 the anions are located in channel running parallel to crystal axes a and b (Fig. 6).
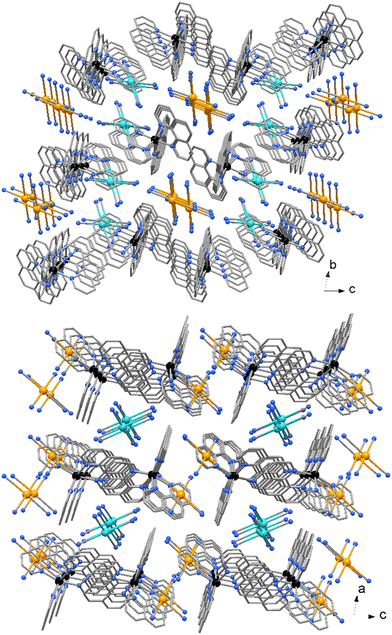 | ||
| Fig. 6 Crystal packing of compound 3. The two independent [Au(CN)4]− anions (indicated in different colors) are located in channel parallel to crystal axes a and b. | ||
Compound 4 crystallizes in orthorhombic space group Pbcn and the asymmetric unit includes half [Zn(terpy)H2O)3]+ cationic complex located on a crystallographic two-fold axis and a [Au(CN)4]− anion as depicted in Fig. 7.
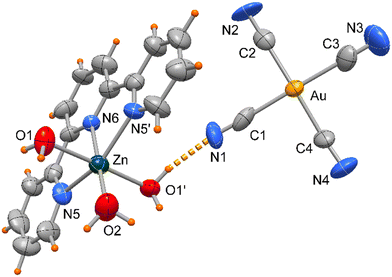 | ||
| Fig. 7 ORTEP drawing (50% ellipsoid probability) of complex 4 with the Zn(terpy) unit located on a crystallographic two-fold axis. | ||
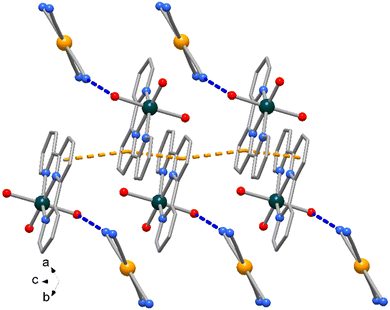
The Zn atom presents a distorted octahedral geometry built by the terpy ligands and three water molecules. Here the Zn–N bond lengths are slightly different (of 2.166(9) and 2.111(10) Å) as well the Zn–O ones, of 1.972(11) and 2.133(6) Å (see Table 3), the latter likely in order to accomplish the O1–H1⋯N1 hydrogen bond interaction (O⋯N distance of 2.889(16) Å, Fig. 6). In the crystal packing the complexes interact through weak π-stacking interactions between py rings to form a linear chain in the direction of c axis (centroid distances between py rings = 3.978(5) Å, Fig. 8).
| Symmetry code: #1 − x + 1, y, −z + 3/2. | |||
|---|---|---|---|
| Zn(1)–O(1) | 2.133(6) | Au(1)–C(1) | 1.98(2) |
| Zn(1)–O(2) | 1.972(11) | Au(1)–C(2) | 1.981(12) |
| Zn(1)–N(5) | 2.166(9) | Au(1)–C(3) | 1.96(2) |
| Zn(1)–N(6) | 2.111(10) | Au(1)–C(4) | 1.970(11) |
| O(1)–Zn(1)–O(1)#1 | 177.6(4) | N(6)–Zn(1)–O(1)#1 | 91.2(2) |
| O(1)–Zn(1)–O(2) | 88.8(2) | O(2)–Zn(1)–N(5) | 104.1(3) |
| O(1)–Zn(1)–N(5) | 90.9(3) | O(2)–Zn(1)–N(6) | 180.0 |
| O(1)–Zn(1)–N(5)#1 | 89.7(3) | N(5)#1–Zn(1)–N(5) | 151.8(5) |
| N(6)–Zn(1)–O(1) | 91.2(2) | N(6)–Zn(1)–N(5) | 75.9(3) |
3.2. DFT study
The DFT study is divided into two sections. First, we analyzed the Ag⋯NCAu(CN)3 interactions to distinguish between coordination and noncovalent coinage bonding interactions. Secondly, we examined the anion⋯anion interactions in compounds 2–4, as detailed below.Fig. 9 presents the combined QTAIM and NCIplot analyses of compound 1. These methods are highly effective for revealing interactions in real space. The distribution of bond critical points (BCPs), bond paths, and reduced density gradient (RDG) isosurfaces shows that the anions are connected to the cations via several CH⋯N(anion) and C⋯C(anion) contacts, all identified by BCPs (red spheres), bond paths (orange lines), and green isosurfaces. Additionally, two symmetrically equivalent BCPs and bond paths link the Ag atoms to the N-atoms of the counterions. These contacts are further characterized by bluish, disk-shaped RDG isosurfaces.
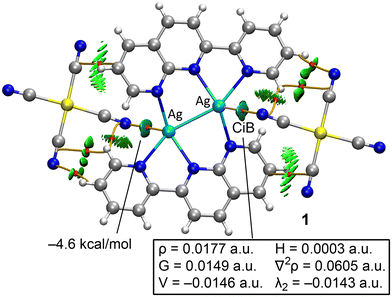 | ||
| Fig. 9 QTAIM/NCIplot analysis of compound 1. Only intermolecular interactions are shown. BCPs are indicated as red spheres and bond paths as orange lines. | ||
The QTAIM parameters at the BCPs that define the Ag⋯N interactions suggest they are typical of weak noncovalent interactions (see Fig. 9). Specifically, the small electron density value (ρ < 0.02 a.u.) and the positive total energy density (H = G + V) clearly indicate the noncovalent nature of the interaction, consistent with the long Ag⋯N distance of 2.852 Å. The interaction energy for the Ag⋯N contact is estimated at −4.6 kcal mol−1 using the value of the potential energy density at the BCP and the formula E = 0.5 × V, comparable to the strength of hydrogen bonds. Although not the primary focus of this manuscript, the QTAIM parameters for the BCP characterizing the intramolecular Ag–Ag bond are provided in the ESI† (see Fig. S1). The total energy density at the BCP is negative, suggesting a certain degree of covalency.
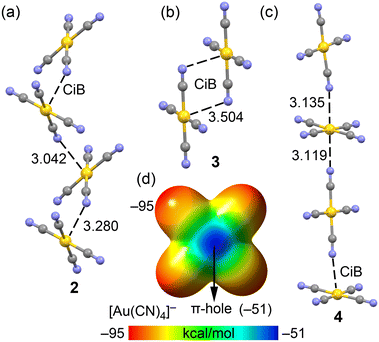
In compounds 2–4, the anionic [Au(CN)4]− units assemble into either infinite 1D chains or discrete centrosymmetric dimers. Fig. 10 illustrates the anion⋯anion assemblies, where it can be observed that in compounds 2 and 4, the anions form supramolecular polymers. These polymers are propagated through Au⋯N coinage bonds (CiB), creating zig-zag chains in compound 2 and linear chains in compound 4. The CiB distances in the supramolecular polymers are fairly consistent, ranging from 3.042 to 3.280 Å, while the distance is longer in the self-assembled dimer of compound 2, measuring 3.504 Å.
The MEP surface of the [Au(CN)4]− unit is depicted in Fig. 10d, showing a notable anisotropy in the electron density distribution. The MEP minimum is located at the N-atoms (−95 kcal mol−1), while the maximum is found at the π-holes above and below the Au-atom (−51 kcal mol−1). This distribution is consistent with the observed directionality of the anion⋯anion coinage bonds (CiBs) in compounds 2–4. Previous studies have shown that anion⋯anion dimers are unstable in the gas phase but represent true minima when calculated using a dielectric constant.7,25 In the solid state, the surrounding cations in the X-ray structures help stabilize these anion⋯anion contacts, a phenomenon we have simulated using a polarizable continuum model.
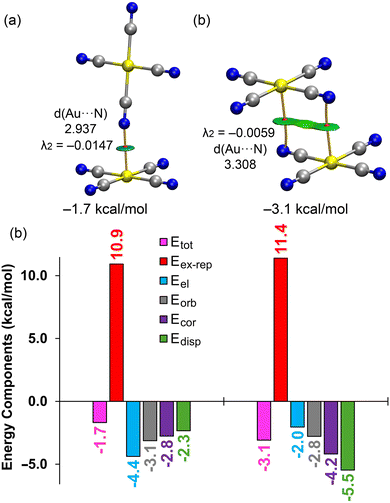
We performed energy decomposition analysis (EDA) on two anion⋯anion dimers using the dielectric constant of water (see Fig. 11), breaking down the total dimerization energy (Etot) into electrostatic (Eel), exchange repulsion (Eex-rep), orbital (Eorb), correlation (Ecor), and dispersion (Edisp) components. The QTAIM/NCIplot analysis of both fully optimized dimers (shown in Fig. 11, top) further confirms the presence of Au⋯N CiBs, with each bond characterized by a bond critical point (BCP), bond path, and green reduced density gradient (RDG) isosurface, highlighting the attractive nature of the interaction with negative λ2 values at the BCPs in both dimers. Interestingly, the EDA reveals (Fig. 11, bottom) that with the dielectric constant of water, the electrostatic term is attractive, contributing −4.4 kcal mol−1 in the T-shape dimer and −2.0 kcal mol−1 in the antiparallel dimer. A key difference between these two dimers is that the electrostatic forces are the most attractive in the T-shape dimer but the least attractive in the antiparallel dimer.
Moreover, the dispersion term is the weakest in the T-shape dimer but the largest in the antiparallel one, consistent with a π-stacking type interaction. This is supported by the size and shape of the RDG isosurface in the antiparallel dimer, which involves the π-systems of the cyano groups (see Fig. 11b), thus indicating a fundamentally different physical nature between the two binding modes.
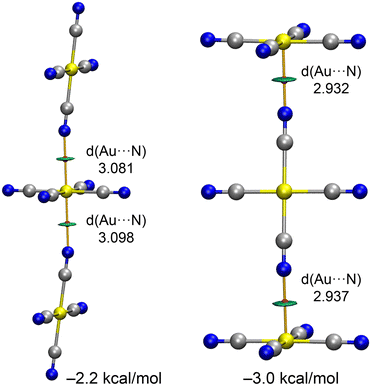
As shown in Fig. 10, in compounds 2 and 4, the anions propagate into infinite 1D chains through CiBs. To investigate whether higher-order assemblies are also favourable, we computed two possible trimer configurations, as depicted in Fig. 12. Both trimers are energetically favoured, though their stabilization energies are less than twice the dimer energy, and the Au⋯N distances are longer, suggesting anticooperative effects. As expected, the trimer where the central anion acts as a double electron donor is more stable than the one where the central anion functions as a double π-hole donor.
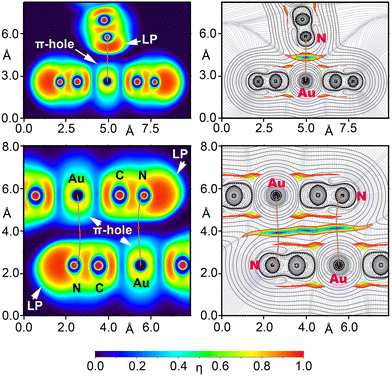
To further confirm the different physical nature of the interactions in the T-shaped and antiparallel anion⋯anion dimers, we employed electron localization function (ELF) analysis, represented in 2D maps to reveal lone pairs and π-hole regions (nucleophilic and electrophilic regions). Additionally, 2D maps of the Laplacian of the electron density (∇2ρ) were overlapped with the reduced density gradient (RDG) to analyse the covalent and noncovalent characteristics of the Au⋯N contacts. The ∇2ρ 2D plot provides insights into the covalency of the interactions, while the RDG maps identify regions of noncovalent interactions. This analysis is illustrated in Fig. 13 and is supported by the BCP parameters listed in Table 4.
| Dimer | ρ(r) | G(r) | V(r) | ∇2ρ ∇(r) | ELF | λ 2 |
|---|---|---|---|---|---|---|
| T-shape | 0.0182 | 0.0147 | −0.0137 | 0.0633 | 0.057 | −0.0147 |
| Antiparal. | 0.0090 | 0.0067 | −0.0054 | 0.0319 | 0.027 | −0.0059 |
The 2D ∇2ρ analyses (Fig. 13) display positive values (represented by solid line isocontours) between the Au and N atoms, indicating the presence of CiBs. The 2D RDG maps further confirm these noncovalent interactions, with blue RDG isocontours in these areas, typical of weak attractive forces. The bond critical points (BCPs), denoting the CiBs, are marked in red in Fig. 13, corresponding to RDG values near zero.
The electron localization function (ELF) 2D map provides additional insights. In the T-shaped dimer, it shows a peak in ELF around the N-atom, highlighting its role as a nucleophilic center (lone pair) and the electrophilic nature of the Au atom (π-hole). The bond path, represented by brown lines in Fig. 13, connects the N-atom to the Au atom, crossing the nucleophilic region of the N-atom and the π-hole of the Au atom, thus confirming the π-hole nature of the CiB. In contrast, in the antiparallel dimer (Fig. 13, bottom), the lone pair on the N-atom does not participate in the interaction. Instead, the nucleophilic π-system of the C![[triple bond, length as m-dash]](https://www.rsc.org/images/entities/char_e002.gif) N triple bond is involved. The blue RDG isocontour extends across the entire space between the Au–C
N triple bond is involved. The blue RDG isocontour extends across the entire space between the Au–C![[triple bond, length as m-dash]](https://www.rsc.org/images/entities/char_e002.gif) N region, consistent with the EDA analysis, which highlighted the significant contribution of dispersion and correlation terms in stabilizing the antiparallel dimer, as is typical for π-based interactions. Additionally, the ELF value at the bond critical point (BCP) in the T-shaped dimer is nearly double that of the antiparallel dimer, indicating a more classic electrostatic driven interaction in the T-shaped dimer. In contrast, the antiparallel dimer is dominated by dispersion interactions (see Table 4).
N region, consistent with the EDA analysis, which highlighted the significant contribution of dispersion and correlation terms in stabilizing the antiparallel dimer, as is typical for π-based interactions. Additionally, the ELF value at the bond critical point (BCP) in the T-shaped dimer is nearly double that of the antiparallel dimer, indicating a more classic electrostatic driven interaction in the T-shaped dimer. In contrast, the antiparallel dimer is dominated by dispersion interactions (see Table 4).
The DFT results presented in this study are generally consistent with those reported by Li et al.,25 who conducted a theoretical investigation into the nature of inter-anion coinage bonds (CiBs) in a range of complexes involving coinage metal anions. Their work focused on homodimers of [AuY4]− (Y = Cl and CN) and [Au(CN)4]− complexes with small anions such as F−, Cl−, CN−, and OCl−, examining their binding energy profiles, kinetic stability, and bonding characteristics under various conditions, including vacuum and crystal environments. A key distinguishing feature of the present study is the identification of antiparallel homodimers and the inclusion of two types of homotrimers, providing novel insights into the structural diversity and interactions within these systems.
4. Conclusions
In this work, we explored the solid-state assembly of [Au(CN)4]− anions with silver and zinc complexes, focusing on the non-covalent coinage bonding interactions. Through a combination of X-ray diffraction, DFT analysis, and advanced theoretical tools such as QTAIM, NCIplot, and EDA, we demonstrated the formation of stable anion⋯anion assemblies in compounds 2 and 4, despite the inherent electrostatic repulsion. The analysis revealed the importance of electrostatic and dispersion contributions in stabilizing these interactions. We also investigated higher-order assemblies (trimers), which exhibited anticooperativity effects, providing further insights into the nature of these interactions. The electron localization function (ELF) and Laplacian analysis confirmed the distinct roles of nucleophilic and electrophilic regions in T-shaped and antiparallel dimers. Our findings underscore the potential of coinage bonding in the development of novel supramolecular structures, which may have implications for material science and molecular design.Author contributions
The manuscript was collaboratively developed with contributions from all authors.Data availability
Crystallographic data for compounds 1–4 have been deposited at the CCDC under deposition numbers CCDC 2392390–2392393. The programs used in the theoretical study are referenced in the theoretical methods section and are available from commercial sources. The Cartesian coordinates of the fully optimized dimers and trimers are available in the ESI.†Conflicts of interest
There are no conflicts to declare.Acknowledgements
This research was funded by the MICIU/AEI of Spain (projects PID2020-115637GB-I00 and PID2023-148453NB-I00, FEDER funds).Notes and references
- K. Müller-Dethlefs and P. Hobza, Chem. Rev., 2000, 100, 143–168 CrossRef PubMed
.
- Y. Cornaton and J. P. Djukic, Acc. Chem. Res., 2021, 54, 3828–3840 CrossRef CAS PubMed
.
-
(a) A. Pizzi, A. Dhaka, R. Beccaria and G. Resnati, Chem. Soc. Rev., 2024, 53, 6654–6674 RSC
; (b) R. M. Gomila and A. Frontera, Dalton Trans., 2025, 54, 3095–3105 RSC
.
-
(a) A. C. Legon and N. R. Walke, Phys. Chem. Chem. Phys., 2018, 20, 19332–19338 RSC
; (b) E. Priola, G. Mahmoudi, J. Andreo and A. Frontera, Chem. Commun., 2021, 57, 7268–7271 RSC
; (c) M. D. L. N. Pina, A. Frontera and A. Bauza, J. Phys. Chem. Lett., 2020, 11, 8259–8263 CrossRef CAS PubMed
; (d) J. Yan, Y. Zeng, L. Meng, X. Li and X. Zhang, Phys. Chem. Chem. Phys., 2023, 25, 29155 RSC
; (e) J. Li, Q. Feng, C. Wang and Y. Mo, Phys. Chem. Chem. Phys., 2023, 25, 15371 RSC
; (f) A. Frontera and A. Bauzá, Chem. – Eur. J., 2018, 24, 7228–7234 CrossRef CAS PubMed
; (g) A. Bauzá and A. Frontera, Inorganics, 2018, 6, 64 CrossRef
.
-
(a) A. Terron, J. Buils, T. J. Mooibroek, M. Barcelo-Oliver, A. Garcia-Raso, J. J. Fiol and A. Frontera, Chem. Commun., 2020, 56, 3524–3527 RSC
; (b) M. D. L. N. Pina, S. Burguera, J. Buils, M. A. Crespi, J. E. Morales, J. Pons, A. Bauza and A. Frontera, Chem. Phys. Chem., 2022, 23, e202200010 CrossRef PubMed
; (c) M. N. Piña, T. J. Mooibroek, A. Frontera and A. Bauza, Phys. Chem. Chem. Phys., 2022, 24, 24983–24991 RSC
; (d) W. Zierkiewicz, M. Michalczyka and S. Scheiner, Phys. Chem. Chem. Phys., 2018, 20, 22498–22509 RSC
; (e) E. Priola, A. Giordana, P. P. Mazzeo, G. Mahmoudi, R. M. Gomila, F. I. Zubkov, K. M. Pokazeev, K. S. Valchuk, A. Bacchi, E. Zangrando and A. Frontera, Dalton Trans., 2021, 50, 16954 RSC
.
-
(a) A. Daolio, A. Pizzi, G. Terraneo, M. Ursini, A. Frontera and G. Resnati, Angew. Chem., Int. Ed., 2021, 60, 14385–14389 CrossRef CAS PubMed
; (b) D. P. Shevchenko, Rev. Adv. Chem., 2023, 13, 303–415 CrossRef CAS
.
- L. Andreo, R. M. Gomila, E. Priola, A. Giordana, S. Pantaleone, E. Diana, G. Mahmoudi and A. Frontera, Cryst. Growth Des., 2022, 22, 6539–6544 CrossRef CAS PubMed
.
-
(a) A. R. Geisheimer, J. E. C. Wren, V. K. Michaelis, M. Kobayashi, K. Sakai, S. Kroeker and D. B. Leznoff, Inorg. Chem., 2011, 50, 1265–1274 CrossRef CAS PubMed
; (b) C. J. Shorrock, H. Jong, R. J. Batchelor and D. B. Leznoff, Inorg. Chem., 2003, 42(12), 3917–3924 CrossRef CAS PubMed
; (c) J. Li, Q. Feng, C. Wang and Y. Mo, Phys. Chem. Chem. Phys., 2023, 25, 15371–15381 RSC
.
-
Bruker APEX3 Software, v2019.11-0, Bruker AXS Inc., Madison, Wisconsin, USA, 2019 Search PubMed
.
-
G. M. Sheldrick. SADABS. Program for Empirical Absorption Correction of Area Detector Data. University of Göttingen, Germany, 1997 Search PubMed
.
- G. M. Sheldrick, Acta Crystallogr., Sect. A: Found. Crystallogr., 2008, 64, 112–122 CrossRef CAS PubMed
.
- A. L. Spek, Acta Crystallogr., Sect. C: Cryst. Struct. Commun., 1990, A46, C-34 Search PubMed
.
-
K. Brandenburg and H. Putz, DIAMOND. Crystal Impact GbR, Bonn, Germany, 1999 Search PubMed
.
- L. J. Farrugia, J. Appl. Crystallogr., 2012, 45, 849–854 CrossRef CAS
.
- C. Adamo and V. Barone, J. Chem. Phys., 1999, 110, 6158–6170 CrossRef CAS
.
- E. Caldeweyher, C. Bannwarth and S. Grimme, J. Chem. Phys., 2017, 147, 034112 CrossRef PubMed
.
- F. Weigend, Phys. Chem. Chem. Phys., 2006, 8, 1057–1065 RSC
.
- R. Ahlrichs, M. Bär, M. Häser, H. Horn and C. Kölmel, Chem. Phys. Lett., 1989, 162, 165 CrossRef CAS
.
- R. F. W. Bader, Chem. Rev., 1991, 91, 893–928 CrossRef CAS
.
- T. Lu and F. Chen, J. Comput. Chem., 2012, 33, 580–592 CrossRef CAS PubMed
.
- J. Contreras-Garcia, E. R. Johnson, S. Keinan, R. Chaudret, J.-P. Piquemal, D. N. Beratan and W. Yang, J. Chem. Theory Comput., 2011, 7, 625–632 CrossRef CAS PubMed
.
- A. D. Becke and K. E. Edgecombe, J. Chem. Phys., 1990, 92, 5397–5403 CrossRef CAS
.
- W. Humphrey, A. Dalke and K. Schulten, J. Mol. Graph., 1996, 14, 33–38 CrossRef CAS PubMed
.
- K. Kitaura and K. Morokuma, Int. J. Quantum Chem., 1976, 10, 325–340 CrossRef CAS
.
- J. Li, Q. Feng, C. Wang and Y. Mo, Phys. Chem. Chem. Phys., 2023, 25, 15371 RSC
.
Footnote |
| † Electronic supplementary information (ESI) available: Table S1 and Cartesian coordinates of the optimized compounds. CCDC 2392390–2392393. For ESI and crystallographic data in CIF or other electronic format see DOI: https://doi.org/10.1039/d4cp04818k |
| This journal is © the Owner Societies 2025 |

