
 Open Access Article
 This Open Access Article is licensed under a
 Creative Commons Attribution 3.0 Unported Licence
An insight into the route from CO2 fixation to CO32−-bridged dinuclear lanthanide(III) complexes featuring inner coordination post-synthetic modification†
Vaibhav
Singh
 ,
Vajeeha
Urunikulavan
and
Arun Kumar
Bar
*
,
Vajeeha
Urunikulavan
and
Arun Kumar
Bar
*
Department of Chemistry, Indian Institute of Science Education and Research Tirupati, Tirupati – 517619, Andhra Pradesh, India. E-mail: a.bar@iisertirupati.ac.in
First published on 4th February 2025
Abstract
An insight into the route from the fixation of CO2 gas into CO32− and the concomitant formation of a novel series of carbonato-bridged dinuclear lanthanide(III) complexes is presented. Efficient and quantitative conversion of CO2 gas into CO32− is confirmed by deliberately employing CO2 gas as a reagent. The feature of inner coordination post-synthetic modification is demonstrated via ligand substitution at the terminally axial coordination sites of the dinuclear motifs. Spectroscopic and X-ray crystallographic techniques were employed for probing the reactions and structural elucidation of the products.
Introduction
Excessive amount of greenhouse gas CO2 in the atmosphere is a serious concern.1 An enormous amount of effort is being directed to mitigate it.2 Various chemical routes are being employed to capture atmospheric CO2 and convert it into value-added products.3 Notably, lanthanide (Ln) elements possess immense potential in this regard, primarily due to their high affinity towards oxygenated species.4 It has been observed on numerous occasions that Ln(III) complexes capture atmospheric CO2 to result in hierarchical complexes incorporating versatile binding modes of inorganic carbonates.3f,g The general procedure for the formation of such carbonato complexes is as follows. Trivalent lanthanide salts were treated with various organic ligands in the presence of a base in alcoholic media. The reaction mixtures were kept aside under aerobic conditions for crystallization by slow evaporation of the reaction media. Such a sequence of processes is found to result in the crystallization of versatile inorganic carbonato metal clusters.5 However, there is also precedence to obtain carbonato Ln(III) complexes by employing CO2 gas as a reaction ingredient.5s Surprisingly, to the best of our knowledge, the investigation is extensively limited to the characterization of the isolated end-products in their solid states. Little is known about the reaction media during the course of the reactions pertaining to the carbonato Ln complexes. Thus, we intended to investigate the progress of the reactions en route to the formation of the carbonato Ln complexes. Moreover, post-synthetic modification in the inner coordination environments of the Ln-based complexes is extremely challenging.6 Therefore, we also intended to explore if the carbonato lanthanide complexes could be endowed with the feature of inner coordination post-synthetic modification. Herein we report a simplistic synthetic strategy for efficient conversion of CO2 gas into CO32− and the concomitant formation of a novel series of carbonato-bridged dinuclear lanthanide(III) complexes (Scheme 1). The post-synthetic modification is demonstrated by the substitution reactions at the terminally axial coordination sites of the dinuclear motifs (Scheme 1). The progress of the reactions has been thoroughly investigated by spectroscopic and X-ray crystallographic techniques to decipher the associated products comprehensively.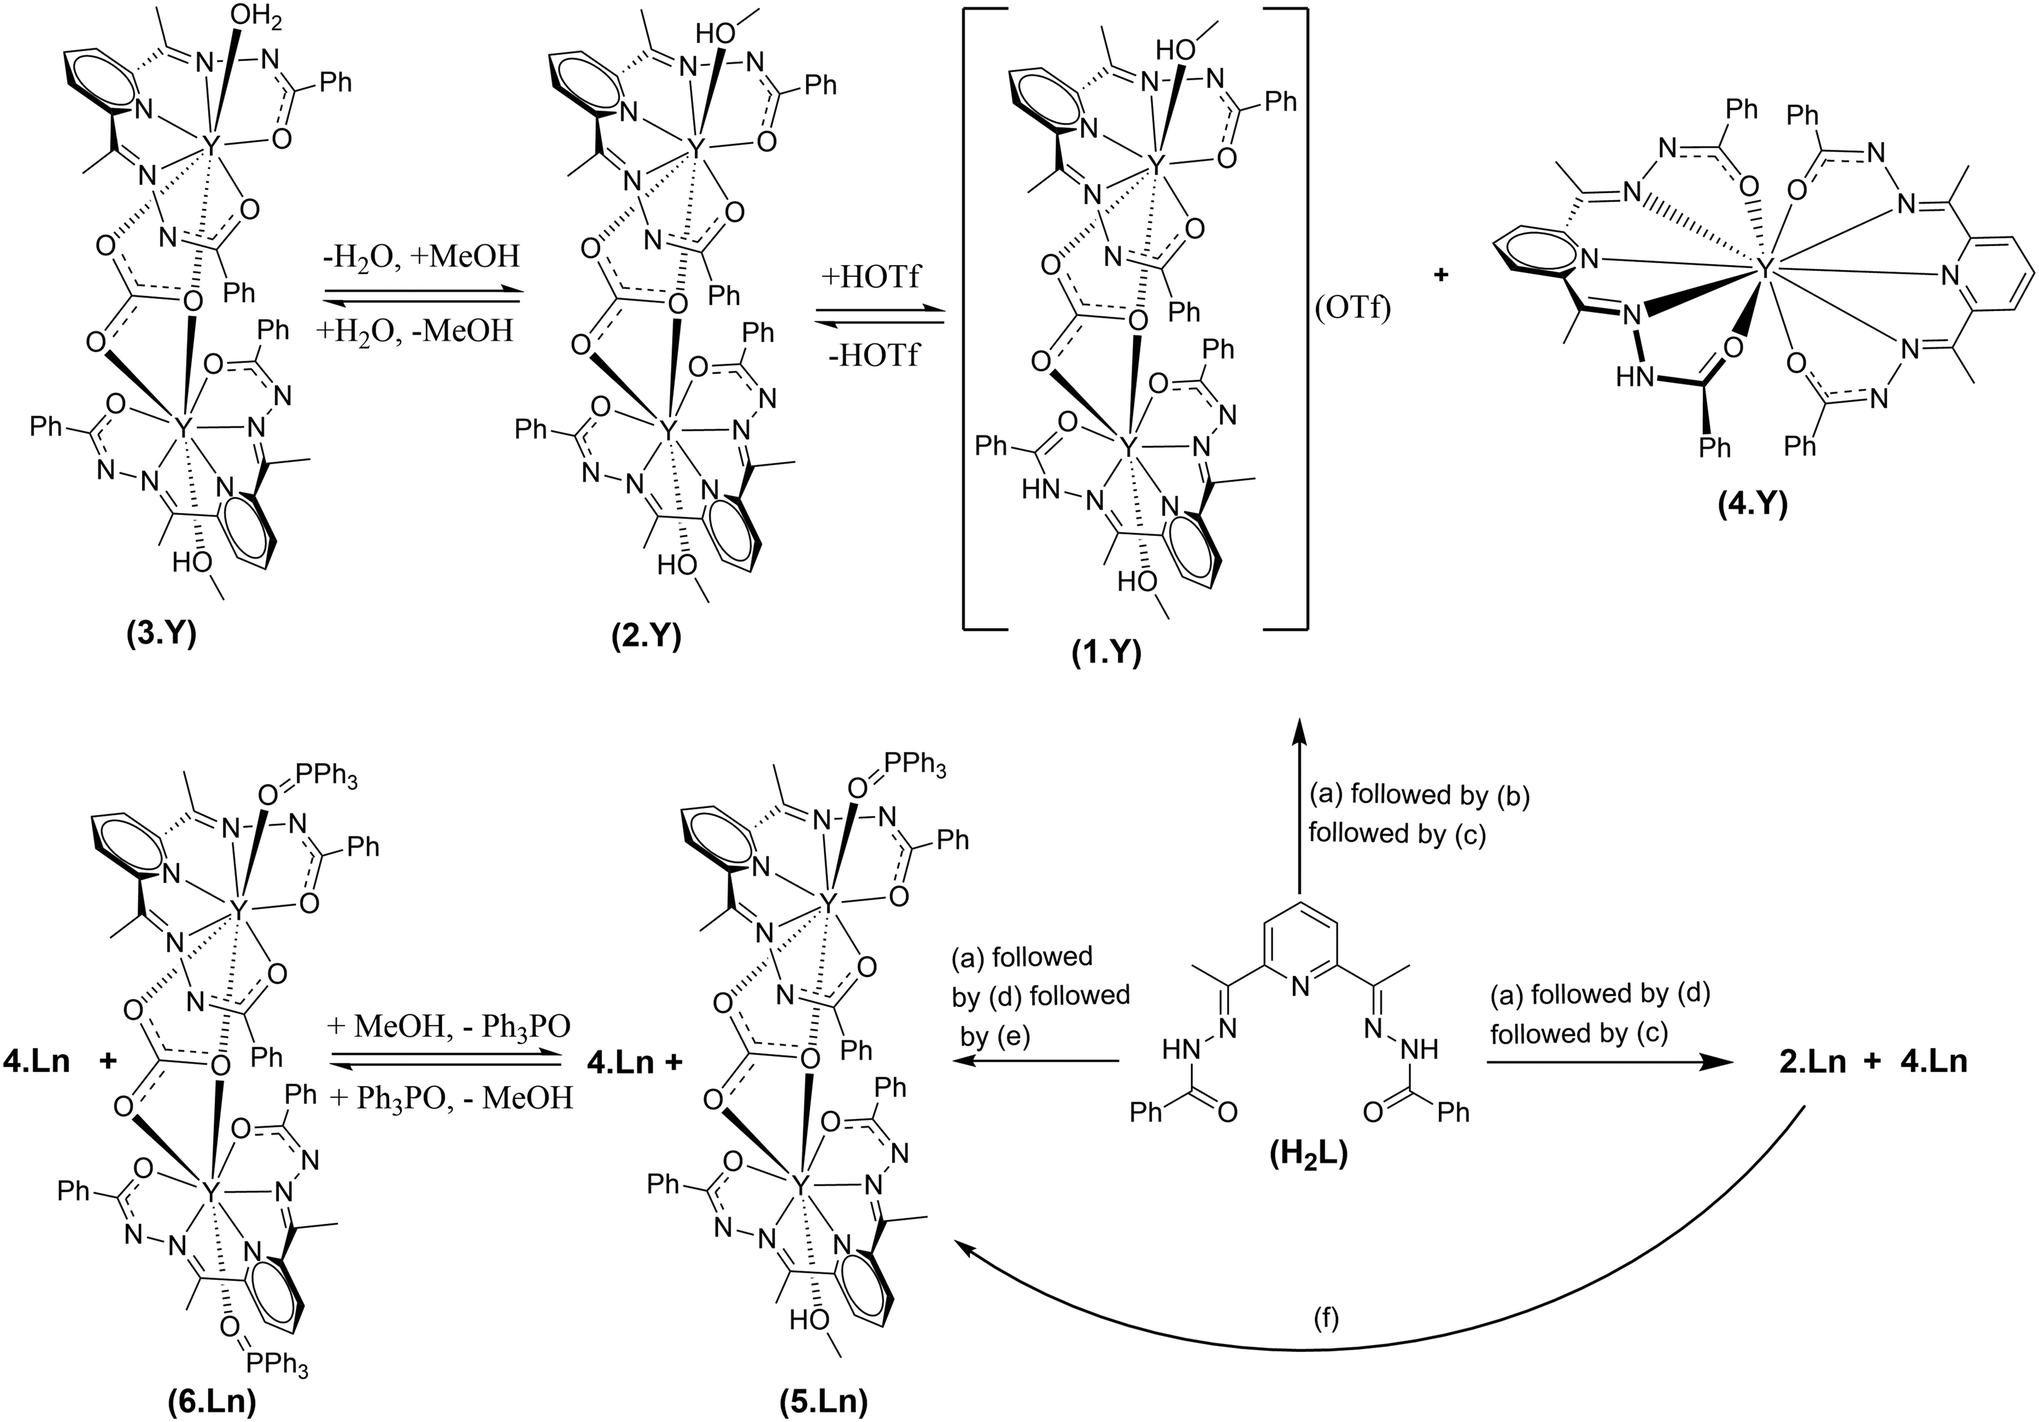 | ||
Scheme 1 Schematic representation for the conversion of CO2 gas into CO32− as the bridging ligand and the formation of dinuclear complexes 1·Ln–3·Ln, 5·Ln, and 6·Ln and the formation of the mononuclear decacoordinate complex 4·Ln. The generic reaction conditions are (a) H2L + Y(OTf)3·6H2O (1![[thin space (1/6-em)]](https://www.rsc.org/images/entities/char_2009.gif) :1 mol/mol), aqueous methanol, stirring for 5 min, room temperature; (b) Et3N (2 equiv., with respect to H2L, mol/mol), in situ, stirring for 5 min, room temperature; (c) purging of CO2 gas, stirring for 5–10 min, room temperature; (d) Et3N (3 equiv., with respect to H2L, mol/mol), in situ, stirring for 5 min, room temperature; (e) Ph3PO, in situ, room temperature; and (f) Ph3PO, into the methanolic solutions of the isolated 2·Ln, room temperature. Ln = Y for 1·Ln and 3·Ln. Ln = Y and Er for 2·Ln and 4·Ln–6·Ln. :1 mol/mol), aqueous methanol, stirring for 5 min, room temperature; (b) Et3N (2 equiv., with respect to H2L, mol/mol), in situ, stirring for 5 min, room temperature; (c) purging of CO2 gas, stirring for 5–10 min, room temperature; (d) Et3N (3 equiv., with respect to H2L, mol/mol), in situ, stirring for 5 min, room temperature; (e) Ph3PO, in situ, room temperature; and (f) Ph3PO, into the methanolic solutions of the isolated 2·Ln, room temperature. Ln = Y for 1·Ln and 3·Ln. Ln = Y and Er for 2·Ln and 4·Ln–6·Ln. | ||
Y(III) was chosen in the current studies for convenient NMR spectroscopic analyses considering its diamagnetic nature. The chemical reactivity of Ln ions is mostly governed by their ionic size and Lewis acidity.7 Thus, Er(III) was included in the current studies in order to verify the generality of lanthanides as Er(III) has a similar ionic radius and Lewis acidity to Y(III).7 The pentadentate ligand, H2L, is employed herein since such a ligand is well known to endow Ln(III) complexes with structural rigidity over a wide range of reaction conditions.8 The chemical shift corresponding to the CH3 moieties of H2L is found to be considerably sensitive to the coordination environment around the Ln centers. Moreover, it is well separated from the rest of the signals of H2L (Fig. 1). Consequently, one could obtain information about the products in the reaction solutions by monitoring their 1H NMR spectra.
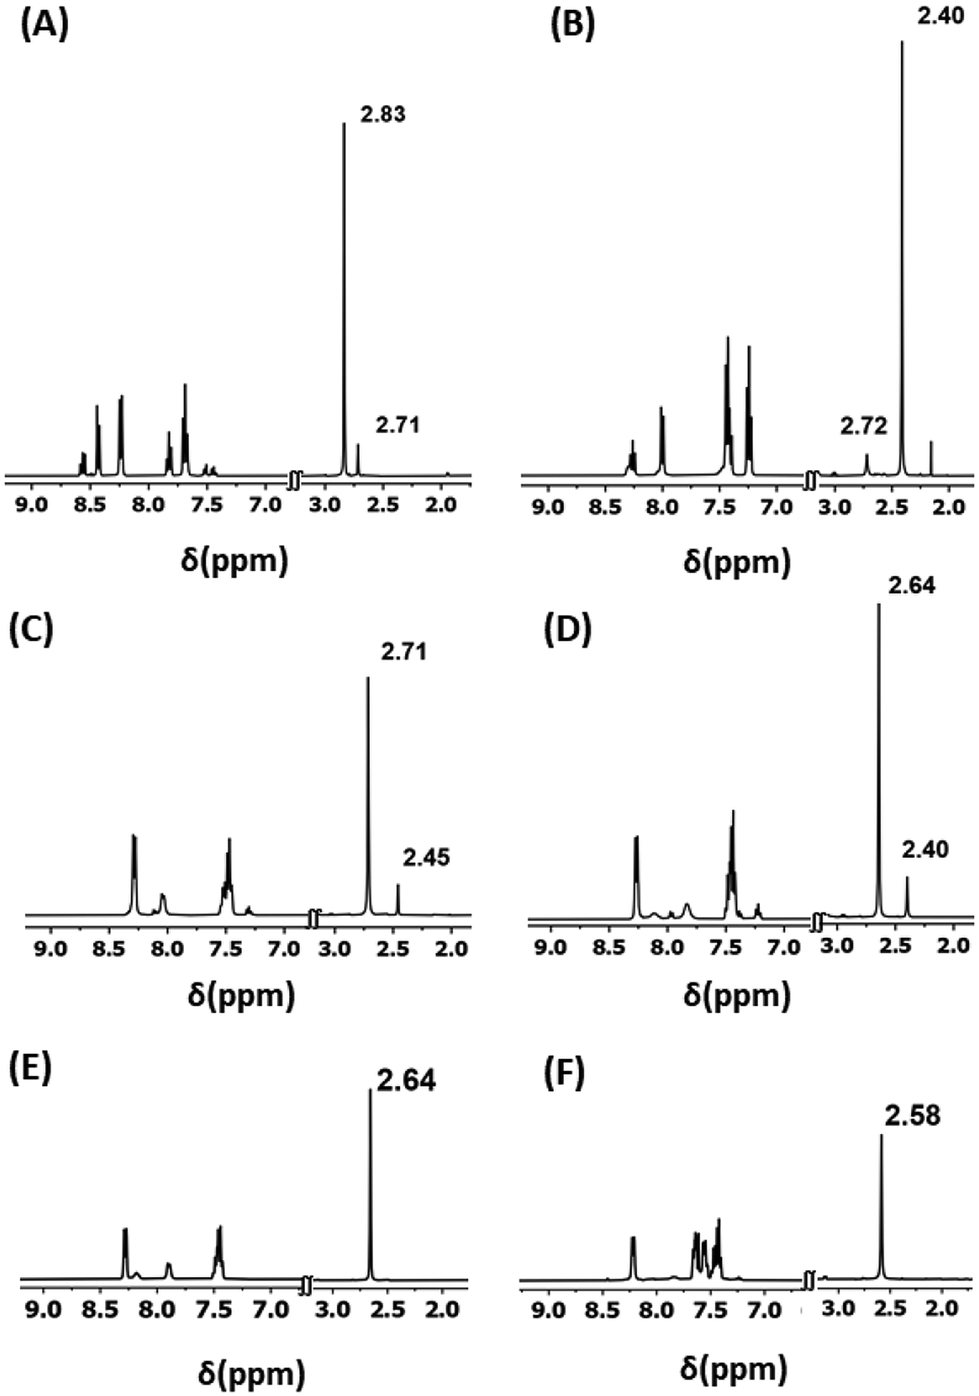 | ||
| Fig. 1 The partial 1H NMR spectra of (A) the reaction mixture of (a) as described in Scheme 1, (B) the reaction mixture of (a) followed by (b), (C) the reaction mixture of (a) followed by (b) followed by (c), (D) the reaction mixture of (a) followed by (d) followed by (c), (E) isolated 2·Y, and (F) isolated 5·Y. The chemical shifts corresponding to the –CH3 moieties are labelled. The corresponding full spectral ranges are provided in Fig. S1–S9 in the ESI.† All the NMR spectral studies were carried out in CD3OD solvent at room temperature. | ||
Experimental section
Materials and methods
All the reagents and solvents used for the syntheses were used as received from commercial suppliers. The Schiff base ligand H2L was synthesized following the reported procedure.9 Triphenylphosphine oxide (Ph3PO) was synthesized starting from triphenylphosphine following the reported procedure.10 Synthetic manipulations and sample processing for all the characterization studies in solutions were carried out under anaerobic conditions for all the complexes unless otherwise mentioned. All the spectroscopic studies were carried out under ambient conditions. UV-Vis and fluorescence spectral studies were carried out on μ(M) methanol solutions or solid samples using a CARY 3500 Compact UV-Vis spectrophotometer and Jasco FP-8500 spectrofluorometer, respectively. The 1H and 31P NMR spectral studies were carried out for the Y analogues of the complexes in deuterated methanol (CD3OD) using a Bruker Ascend 400 FT-NMR Spectrometer. Fourier transform infrared (FT-IR) spectroscopic studies were performed on the thin layers of neat samples with a Bruker-Alpha Eco-ATR FT-IR spectrometer.Photoluminescence studies
Photoluminescence excitation spectra were recorded with excitation wavelengths ranging from 200 to 700 nm for methanolic solutions and from 250 to 500 nm for solid samples. Emission wavelengths ranged from 210 to 800 nm (1 nm intervals) for methanolic solutions and from 260 to 800 nm (1 nm intervals) for solid samples, using excitation and emission bandwidths of 2.5 nm and a scanning speed of 1000 nm min−1. Both the solid-state and solution fluorescence emission spectra were recorded at excitation wavelengths corresponding to λmax values obtained from UV-Vis studies, with 2.5 nm bandwidths, a data interval of 0.1 nm, and a scanning speed of 500 nm min−1 under high-sensitivity conditions. Additionally, emission spectra of 2·Y (λex = 392 nm, 340 nm), 5·Y (λex = 392 nm, 342 nm), 2·Er (λex = 392 nm, 341 nm), and 5·Er (λex = 392 nm, 342 nm) in their μM methanolic solutions were recorded with excitation and emission bandwidths of 10 nm and 5 nm, respectively, and a scanning speed of 500 nm min−1 under high-sensitivity conditions. These spectra are shown as insets in Fig. 5.X-ray crystallographic studies
Suitable single crystals for X-ray diffraction were coated with paratone oil and mounted onto a goniometer. The X-ray crystallographic data were obtained using a Bruker (D8 Advance, Da Vinci) diffractometer using a Mo-Kα radiation source and equipped with an Oxford Cryo-system. The structures have been solved by direct methods using SIR92 or Superflip and refined by means of least-square procedures on F using the PC version of the program Olex2. The scattering factors for all the atoms were used as listed in the International Tables for X-ray Crystallography.11 Absorption correction was performed using a multi-scan procedure. The H atoms were repositioned geometrically. The H atoms were initially refined with soft restraints on the bond lengths and angles to regularize their geometry and Uiso(H) (in the range 1.2–1.5 times Ueq of the parent atom), after which the positions were refined with riding constraints. All non-hydrogen atoms were refined anisotropically. Crystallographic data and refinement parameters for the single-crystal X-ray data analyses for all the complexes are summarized in Tables S5 and S6.† The selected bond parameters are provided in Table S7.† CIF files have been deposited at the CCDC with references 2378627–2378634 for the complexes 1·Y, 2·Y, 3·Y, 4·Y, 5·Y, 6·Y, 2·Er and 5·Er. The solid-state phase purity of the isolated polycrystalline solid samples of the complexes was confirmed by powder X-ray diffraction (PXRD) using a Rigaku (SmartLab) diffractometer with a Cu-Kα radiation source, λ = 1.5406 Å. The PXRD studies were carried out with 2θ ranging from 5 to 50° with a step size of 0.01.Gas-phase IR studies
In order to investigate the efficiency of the capture and conversion of CO2 gas, gas-phase FT-IR spectroscopic studies in conjunction with gasometer spectroscopic analyses were carried out on the headspace of the reaction mixture of the Y analogue. The reaction with three equivalent Et3N was performed in a home-made H-type Schlenk tube under the same reaction conditions as above (see the synthetic details). At the stage of the reaction after the addition of a base ((a) followed by (d); Scheme 1), the Schlenk tube was charged with one equivalent CO2 gas using a home-made manometer. The equivalency of CO2 gas was calculated based on the yield of 2·Y as observed in the aforementioned NMR studies on the reaction mixture, assuming the ideal-gas behaviour of CO2 gas. The analyses were carried out on the headspace of the reaction Schlenk tube.Determination of the solubility product
A sample of 0.7 mg of 2·Y was dissolved in 50 mL methanol using a volumetric flask. The UV-vis absorbance (A1 = 0.7416 a.u.) was measured at λmax = 340 at STP. A saturated solution of 2·Y was prepared in methanol as a stock solution at STP. An aliquot of 200 μL stock solution was diluted to a 2 mL solution at STP. The UV-vis absorbance (A2 = 0.3376 a.u.) was measured for the diluted solution at λmax = 340 at STP. The concentration of the saturated solution was calculated from A1 and A2 employing Beer–Lambert's law, which yielded a Ksp value of 0.064 g L−1.Synthetic procedures
Isolated yield 55% (64 mg). UV-Vis: λmax = 392 nm; ε = 2.0 × 10⁴ L mol−1 cm−1; λmax = 340 nm; ε = 5.42 × 10⁴ L mol−1 cm−1; λmax = 250 nm; ε = 2.26 × 10⁴ L mol−1 cm−1; λmax = 203 nm; ε = 6.7 × 10⁴ L mol−1 cm−1. NMR (CD3OD): δ ppm: 1H: 2.64 (s, 12H, –CH3), 7.40–7.50 (m, 16H, Aromatic-CH), 8.2–8.3 (m, 10H, aromatic –CH). IR (cm−1): νC![[double bond, length as m-dash]](https://www.rsc.org/images/entities/char_e001.gif) O = 1552 (s); νCN = 1640(w), 1586(m). Elemental analysis (%) calcd C51H54N10O11Y2 (FW = 1160.86 g mol−1): C 52.77; H 4.69; N 12.07; found: C 52.80; H 4.74; N 12.05.
O = 1552 (s); νCN = 1640(w), 1586(m). Elemental analysis (%) calcd C51H54N10O11Y2 (FW = 1160.86 g mol−1): C 52.77; H 4.69; N 12.07; found: C 52.80; H 4.74; N 12.05.
Isolated yield 70% (62 mg). UV-Vis: λmax = 392 nm; ε = 1.13 × 10⁴ L mol−1 cm−1; λmax = 315 nm; ε = 4.28 × 10⁴ L mol−1 cm−1; λmax = 202 nm; and ε = 6.27 × 10⁴ L mol−1 cm−1. NMR (CD3OD): δ ppm: 1H: 2.40 (s, 12H, –CH3), 7.18–7.25 (m, 7H, aromatic-CH), 7.35–7.45 (m, 13H, aromatic-CH), 7.94–8.0 (d, 4H, aromatic –CH), 8.2–8.26 (t, 2H, aromatic –CH). IR (cm−1): νCO = 1558 (m); νCN = 1644(w), 1582(m). Elemental analysis (%) calcd C46H39N10O4Y (FW = 884.78 g mol−1): C 62.44; H 4.44; N 15.83; found: C 62.48; H 4.46; N 15.80.
Isolated yield 40% (53 mg). UV-Vis: λmax = 392 nm; ε = 1.1 × 10⁴ L mol−1 cm−1; λmax = 342 nm; ε = 2.80 × 10⁴ L mol−1 cm−1; λmax = 249 nm; ε = 1.27 × 10⁴ L mol−1 cm−1; λmax = 203 nm; and ε = 5.74 × 10⁴ L mol−1 cm−1. NMR (CD3OD): δ ppm: 1H: 2.58 (s, 12H, –CH3), 7.37–7.70 (m, 33H, aromatic-CH), 8.15–8.25 (m, 8H, aromatic –CH). 31P: 32.47. IR (cm−1): νCO = 1542 (m); νCN = 1670(w), 1586(m). Elemental analysis (%) calcd C66H57N10O9PY2 (FW = 1343.00 g mol−1): C 59.03; H 4.28; N 10.43; found: C 59.06; H 4.32; N 10.40.
Isolated yield 50% (64 mg). UV-Vis: λmax = 392 nm; ε = 2.1 × 10⁴ L mol−1 cm−1; λmax = 341 nm; ε = 5.80 × 10⁴ L mol−1 cm−1; λmax = 249 nm; ε = 2.60 × 10⁴ L mol−1 cm−1; λmax = 203 nm; and ε = 7.23 × 10⁴ L mol−1 cm−1. IR (cm−1): νCO = 1554 (s); νCN = 1634(w), 1586(m). Elemental analysis (%) calcd C51H54Er2N10O11 (FW = 1317.56 g mol−1): C 46.49; H 4.13; N 10.63; found: C 46.55; H 4.10; N 10.60.
Isolated yield 42% (53 mg). UV-Vis: λmax = 392 nm; ε = 1.12 × 10⁴ L mol−1 cm−1; λmax = 342 nm; ε = 3.16 × 10⁴ L mol−1 cm−1; λmax = 250 nm; ε = 1.38 × 10⁴ L mol−1 cm−1; λmax = 202 nm; and ε = 6.13 × 10⁴ L mol−1 cm−1. IR (cm−1): νCO = 1540 (m); νCN = 1670(w), 1586(m). Elemental analysis (%) calcd C66H57Er2N10O9P (FW = 1449.70 g mol−1): C 52.86; H 3.83; N 9.34; found: C 52.90; H 3.86; N 9.36.
Results and discussion
Synthesis and spectroscopic characterization
The as-synthesized solid sample of H2L appears off-white in color and it is sparingly soluble in methanol at STP. A white slurry of H2L in commercially available methanol (with ∼1%, v/v, water content) turned immediately into bright, golden yellow solution with concomitant consumption of the white suspended particles of H2L upon the addition of a methanolic solution of Y(III) salt – implying complexation of the ligand with the metal ions (Scheme 1). The reaction solution displayed two distinct sets of signals in its 1H NMR spectrum (δ (CH3, ppm) = 2.83 and 2.71; Fig. 1). The 1H NMR spectral behavior could be attributed to the probable products as depicted in Scheme S1 (see the ESI†). As per our previous experience, H2L can afford double deprotonation.8 Therefore, the reaction mixtures were charged with two equivalents of Et3N as a base. The reaction solution appeared dark yellow immediately upon addition of Et3N, indicating deprotonation of the ligand.8 The 1H NMR spectrum of the resulting solution revealed two new sets of signals (δ (CH3, ppm) = 2.72 and 2.40; Fig. 1). Fortunately, the mononuclear decacoordinate complex, 4·Y, crystallized out of the reaction mixture ((a) followed by (b), Scheme 1). The 1H NMR spectroscopic analyses on the isolated sample of 4·Y revealed that the signal appearing at δ = 2.40 ppm corresponds to the CH3 protons of 4·Y (Fig. S3, see the ESI†).The purging of CO2 gas into the reaction mixtures changed the dark-yellow solutions into light-yellow solutions. The 1H NMR spectrum of the reaction mixture ((a) followed by (b) followed by (c), Scheme 1) implied dominantly one product other than 4·Y (Fig. 1). Visibly slightly different types of single crystals were found to appear from the reaction solutions upon concentrating the reaction mixtures under reduced pressure. The crystallographically characterized complexes include 1·Y–4·Y, as depicted in Scheme 1. Notably, 1·Y and 3·Y were found to deteriorate spontaneously at room temperature upon isolation from their mother liquors. Though the molecular structures of 1·Y and 3·Y were unambiguously characterized by single crystal X-ray diffraction analyses, we could not purify them in bulk. However, the chemical shift at 2.72 ppm in the 1H NMR spectrum could be attributed to the CH3 moieties of the ligand in 1·Y (Fig. 1).
Characterization of the cationic dinuclear analogue (1·Y) prompted us to repeat the same reactions but employing three equivalents of Et3N instead of two equivalents of Et3N. In order for generality, both Y(III) and Er(III) salts were employed in the reactions. The observations were found to be similar for both of them. However, the reaction mixtures ((a) followed by (d); Scheme 1) resulted in a fluorescent, gelatinous yellow precipitate immediately upon addition of three equivalents of Et3N under the same conditions. The whole reaction mixture turned into a translucent yellow solution immediately upon purging CO2 gas into the reaction mixture under stirring conditions at STP. The 1H NMR spectrum of the reaction mixture ((a) followed by (d) followed by (c)) of the Y analogue revealed the presence of only the neutral dinuclear complex (2·Ln, Fig. 1) where both the terminally axial coordination sites are occupied by MeOH. The mononuclear decacoordinate complex (4·Ln) was also detected as the minor product which was carried forward from the previous steps of the reactions. However, purging of CO2 gas was discontinued once the yellow precipitate was visibly consumed completely. Bright yellow, plate-shaped single crystals of 2·Ln (Ln = Y and Er) started to crash out of the reaction solutions within a few minutes depending on the concentration of the reaction solutions. Notably, the outcome of the reaction was found to be independent of the amount of the employed Et3N once it exceeded three equivalents.
In order to investigate the efficiency of the capture and conversion of CO2 gas, the gas-phase FT-IR spectroscopic studies in conjunction with the gasometer spectroscopic analyses were carried out on the headspace of the reaction mixtures (see the Experimental section for details). No trace of CO2 was detected in the headspace within 20 minutes of the reaction time (Fig. 2). Considering a very low solubility product of CO2 in aqueous methanol,12 the above observation can be regarded as the quantitative consumption of the employed CO2 gas. It is worth pointing out that the dinuclear complexes, 2·Ln, can also be achieved with excellent yields upon performing the reactions (a) followed by (d) (Scheme 1) under open atmospheric conditions without employing any CO2 gas as a reagent. The bridging CO32− in the complexes originated from the open atmosphere despite the partial pressure of CO2 gas under an open atmosphere being very low (<0.25 mmHg), implying the high efficiency of capturing CO2 and converting it into CO32−.
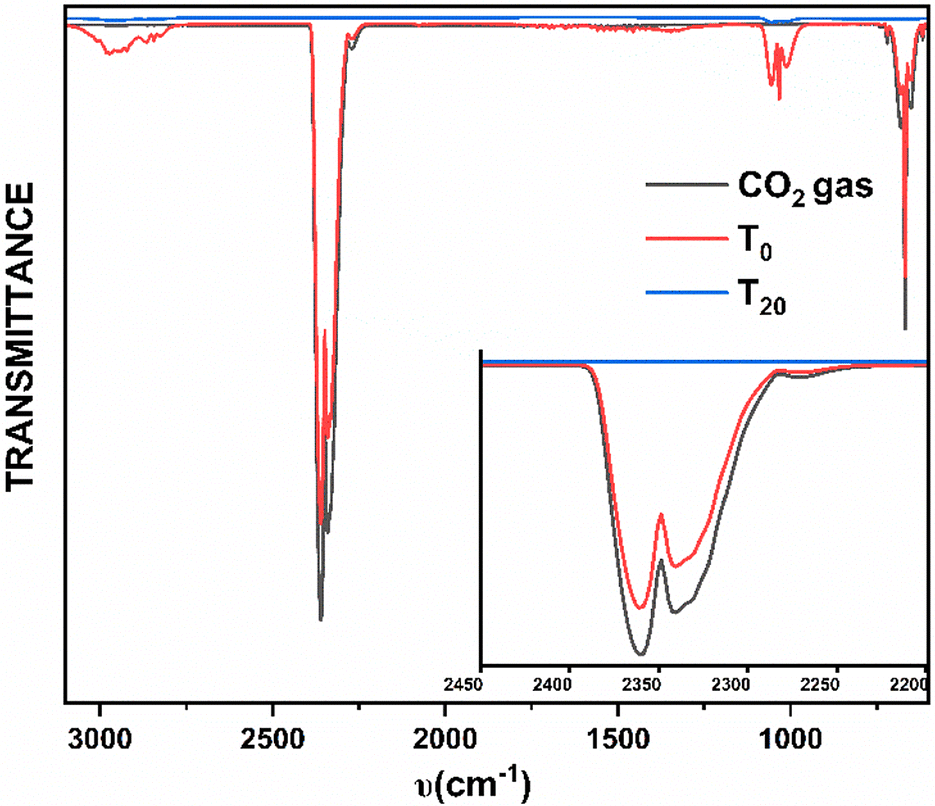 | ||
| Fig. 2 The comparative gas-phase IR spectra of free CO2 gas (black), headspace of the reaction mixture in the beginning (T0, red) and headspace of the reaction mixture after 20 minutes (T20, blue). | ||
The dinuclear carbonato-bridged complexes 2·Ln are air-stable both in solution and in the solid state indefinitely. Thus, we intended to investigate if the coordinated MeOH in 2·Ln could be deliberately replaced with stronger Lewis bases. In this regard, 2·Ln were treated with Ph3PO. The progress of the reactions was monitored by multinuclear (1H and 31P) NMR spectroscopic studies on the reaction mixtures of the Y analogues. Indeed, treatment of 2·Ln with one equivalent of Ph3PO rendered substitution of the coordinated MeOH with Ph3PO at one of the terminally axial coordination sites, resulting in 5·Ln (Ln = Y and Er) with near-quantitative yields. Notably, the conversion of 2·Ln into 6·Ln was found to be low-yielding even upon employment of excess Ph3PO. It can be ascribed to the following reasons. 2·Ln is sparingly soluble (∼10−5 mol L−1) in MeOH at STP. Consequently, the substitution reactions were carried out under significantly dilute conditions. As MeOH is present in the reaction mixture at an enormously large excess compared to Ph3PO, the formation of 5·Ln is kinetically more favorable over the formation of 6·Ln according to Le Chatelier's principle. Moreover, the solubility products of both 5·Ln and 6·Ln are quite similar to each other in MeOH. 6·Y can be isolated in pure form with a very low yield by manual separation of its single crystals from the physical mixture of the single crystals of 5·Y and 6·Y. The 1H NMR spectral analysis of 6·Y reveals that it slowly transforms into 5·Y in solution (Fig. S7, see the ESI†). On the other hand, 5·Y is found not to equilibrate with 6·Y even upon prolonged standing in methanolic solution. Sharp and considerably downfield shifted 31P NMR signals for 5·Y (32.47 ppm) and 6·Y (32.55 ppm) compared to the free Ph3PO (32.39 ppm) indicated considerably stronger coordination of Ph3PO to the Ln centers (Fig. S10, see the ESI†). 1H NMR spectroscopic analyses also indicated stronger coordination of Ph3PO to the Ln centers (Fig. 1 and S6–S8, see the ESI†). Unfortunately, we could not isolate and characterize the Er analogue of 6·Ln despite various efforts.
The FT-IR spectral profiles of the isolated complexes appear similar to each other, implying a similar degree of metal–ligand chelation (Fig. S13, S14 and Tables S3, S4, see the ESI†). Notably, the yellow coloration of the Ln(III) complexes with the doubly deprotonated forms of the analogous Schiff base ligands is known to originate from the ligand-to-metal charge transfer.8 All of 2·Ln, 4·Ln and 5·Ln exhibit absorption bands in four different domains of the UV-vis range (Fig. S11, S12 and Tables S1, S2, see the ESI†). The spectral patterns of the series 4·Ln are distinctly different from those of 2·Ln and 5·Ln. Though the spectral patterns of 2·Ln and 5·Ln are practically indistinguishable from each other, their molar extinction coefficients were found to be significantly different from each other.
X-ray crystallographic characterization
Both the Y and Er analogues for a given series of the complexes are isostructural. Therefore, the crystallographic characteristics of the Y analogues are presented in the main text as the representatives for their respective series. Notably, the Er(III) analogue of the mononuclear decacoordinate complex, 4·Er, has already been reported.13 The solid-state single crystal X-ray molecular structures for 1·Y, 2·Y, 3·Y, 5·Y and 6·Y are portrayed in Fig. 3. The solid-state single-crystal molecular structures of the rest of the complexes and the associated crystallographic parameters are provided in the ESI (Fig. S15–S30 and Tables S5, S6†). The molecular skeletons of all the dinuclear complexes are mutually similar to each other as follows. A pentadentate ligand chelates an Ln ion in the κ5-fashion by coordinating through its pyridyl N atom, two imine N atoms and two carbonyl O atoms, resulting in a pseudo pentagonal building block (Fig. 3). Except for 1·Y and 4·Y, the pentadentate chelating ligand was found to be doubly deprotonated, which could be concluded from the following observations. The statistical single crystal X-ray diffraction analyses on the coordination complexes of the analogous Schiff base ligands revealed that the crystallographic bond angles associated with the hydrazide functional groups (ca. <C17–N1–N2 in 1·Y, Table S7, see the ESI†) fall below a threshold value of 111° if the amide N center is deprotonated,8,14 while they fall above the threshold value when the amide N center remains protonated. In the case of the cationic dinuclear complex herein (1·Y), one of such angles (<C17–N1–N2 = 112.42°) falls above the threshold values, while the rest of such angles fall below the threshold values (108.81°–110.35°, Table S7, see the ESI†).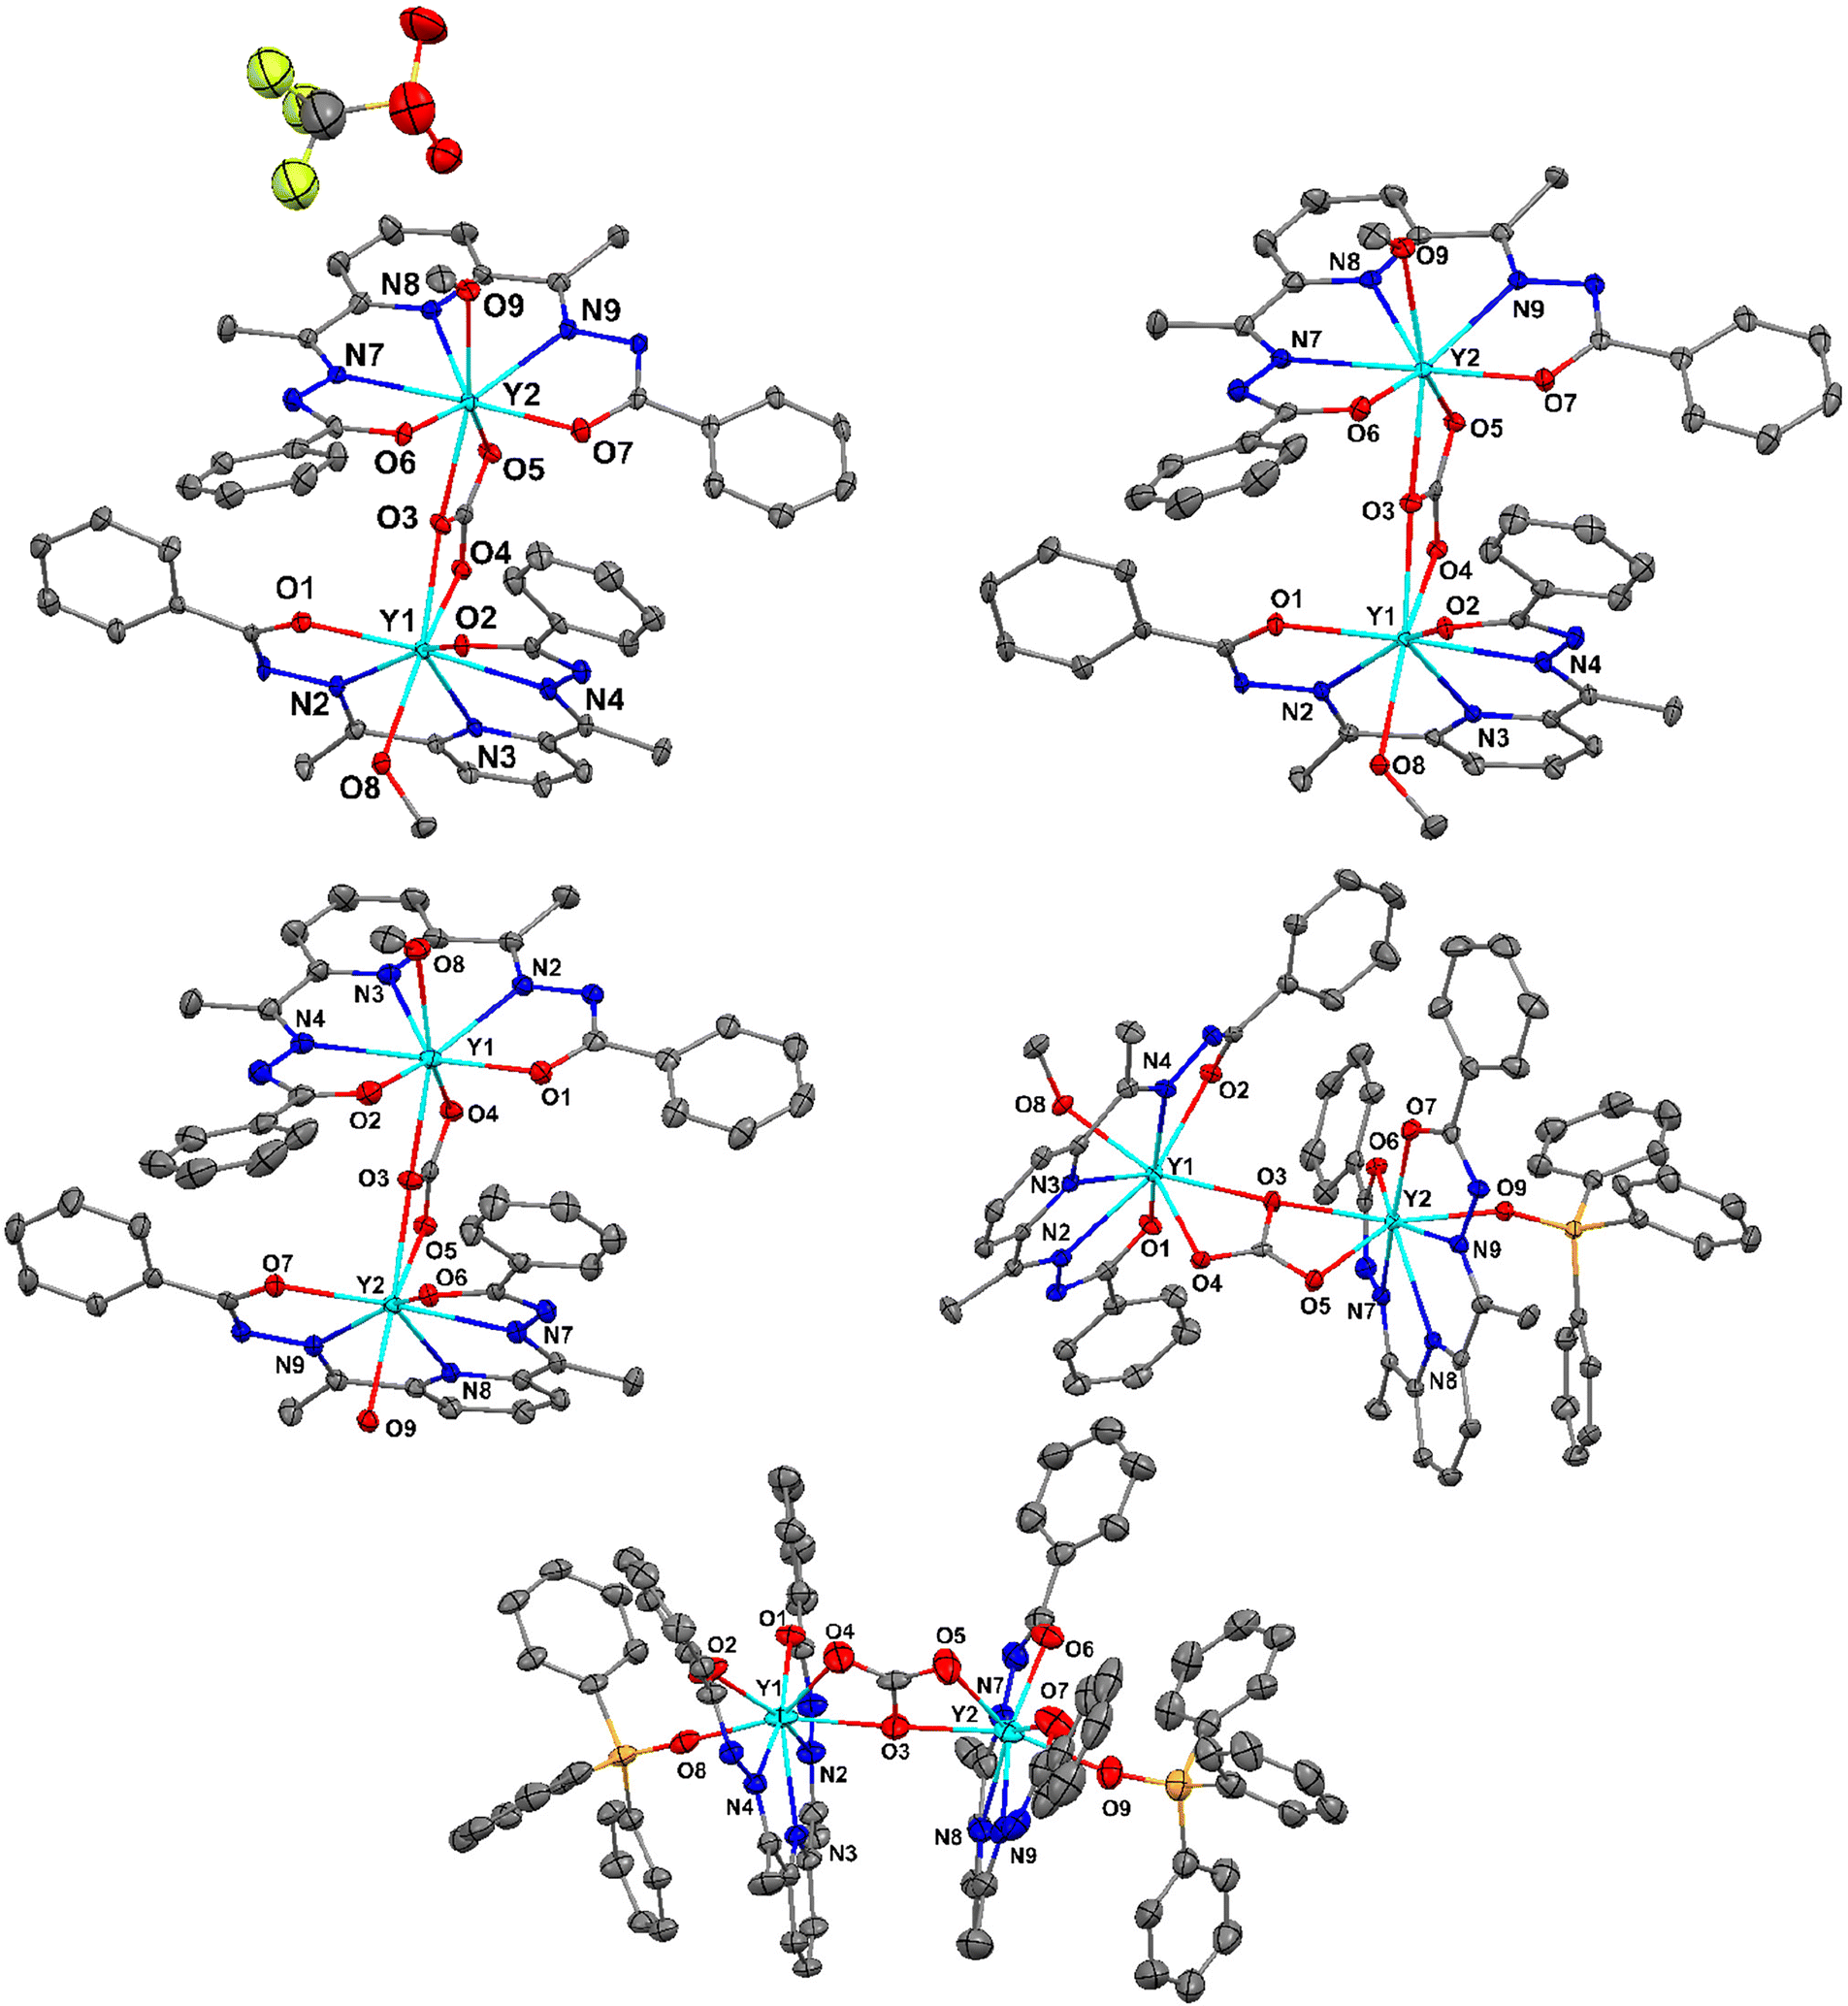 | ||
| Fig. 3 ORTEP representations with 40% ellipsoid probability for the solid-state single crystal X-ray molecular structures of 1·Y (top left), 2·Y (top right), 3·Y (middle left), 5·Y (middle right), and 6·Y (bottom). The atomic sites of the inner coordination environments are labelled. The H atoms and the co-crystallized solvent molecules are omitted for clarity. Color codes: cyan, Y; yellow, S; orange, P; greenish yellow, F; red, O; blue, N; and grey, C. | ||
Similarly, for the mononuclear decacoordinate complexes (4·Y), out of the two pentadentate chelating ligands, one is doubly deprotonated, while the other one is singly deprotonated. The bond parameters of the bridging CO3 moieties imply a doubly negative charge in it. Thus, the overall charges on the complexes also indicate the same conclusion.
Photoluminescence property studies
Because of the characteristic electronic structures, the lanthanide ions are expected to possess immense potential in tuning and tailoring varieties of photophysical phenomena, especially photoluminescence (PL).15 However, the valence orbitals (4f) are in the inner cores of the lanthanide ions.4b Thus, the influence of the ligand field on the energy landscapes of the spectroscopic terms is not prominent.15b Consequently, modulating spectroscopic characteristics that originated from the lanthanide ions is challenging.15e Moreover, the spectroscopic characteristics are subject to the coordination geometry and ligand-field topology around the metal ions. On the other hand, the lanthanide coordinative bonds are significantly ionic in nature. Thus, it is non-trivial to rigidify a specific coordination geometry around the lanthanide ions and to tailor the spectroscopic properties.15b However, the continuous SHAPE analyses16 revealed fairly rigid coordination geometries around the metal ions of the dinuclear lanthanide motifs described herein (Table S8, see the ESI†). In addition to it, the terminally axial coordination sites are kinetically labile. The electronic and crystal-field effects of the dinuclear complexes could be tailored by tuning various ancillary ligands at the terminally axial coordination sites. Moreover, these dinuclear motifs could be chemically decorated with a huge variety of Schiff-base ligands of the genre H2L. In this regard, we intended to investigate the detailed PL properties both in solutions and in the solid states of dinuclear complexes 2·Ln and 5·Ln (Ln = Y and Er) which were isolated in bulk with phase purity (see the Experimental section for details).The as-synthesized solid sample of H2L appeared off-white under visible light at room temperature (Fig. 4). It appeared brighter upon irradiation with the UV-vis light. Both 2·Y and 5·Y appeared bright yellow under visible light at room temperature, which turned into glowing green under irradiation with UV-vis light (Fig. 4). Notably, the Er analogues were found to be not as bright as their Y analogues under irradiation with similar light (Fig. 4). However, the brightest appearance was found to be upon excitation near 390 nm for all of H2L, 2·Ln and 5·Ln (Fig. 4). The room temperature PL excitation spectral analyses of the as-synthesized samples of H2L, 2·Ln and 5·Ln (Ln = Y and Er) revealed characteristic emission bands (Fig. S33–S39†). H2L exhibited structured emission spectra having significantly overlapping emission bands with emission maxima near 625 nm, 550 nm, 475 nm, 450 nm and 425 nm (Fig. S33, see the ESI†). Both 2·Ln and 5·Ln exhibited strong emission bands near the emission maximum of 310 nm upon excitation near 250 nm in their methanolic solutions at room temperature (Fig. 5). Though the Y analogues displayed prominently broad bands near the emission maximum of 540 nm consistently for all the excitations near 390 nm, 340 nm and 250 nm, no emission band was observed above the emission wavelength of 350 nm for the Er analogues under the same conditions (Fig. 5). The room temperature solid-state emission spectral profiles for both 2·Ln and 5·Ln were found to be similar to each other upon excitation near 250 nm, displaying bands near the emission maxima of 300 nm, 400 nm, 500 nm and 550 nm (Fig. 5). The strongest emission bands were observed near the emission maxima of 550 nm for 2·Er, 520 nm for 2·Y and 5·Y, and 400 nm for 5·Er. Notably, the solid samples of 2·Y and 5·Y exhibited bands near the emission maximum of 520 nm with significantly high emission intensities upon excitations near 340 nm and 390 nm, where the Er analogues displayed very weak emission bands. It is in line with the observation that the solid samples of Y analogues appeared way brighter than their Er analogues under the irradiation with the UV-vis light. It is worth mentioning that all the above PL spectral studies were carried out with the slit widths of 2.5 nm for both excitation (Δlex.) and emission (Δlem.). The room temperature emission spectra of the methanolic solutions of the Er analogues revealed prominent bands near the emission maximum of 520 nm for the excitations near 390 nm and 340 nm upon increasing the slit widths (insets, Fig. 5). In addition to the emission bands with the emission maxima near 520 nm, the spectra also displayed relatively sharp, prominent bands near emission maxima of 380 nm and 450. However, the Y analogues exhibited enormously high emission intensity in the same spectral range in the same experimental set-up (inset, Fig. 5). It could be attributed to the following reason. All the emission bands herein are characteristic of the ligand. The electronic transitions characteristic of the spectroscopic terms of the Er(III) ion also span over the lower energy spectral range herein.15,17 Upon excitation of the Er analogues, it could lead to the spin–phonon coupling and subsequent non-radiative spin–lattice/Orbach relaxation at room temperature, thereby quenching the emission for the Er analogues.18
 | ||
| Fig. 4 The appearances of the as-synthesized solid samples of H2L (first column), 2·Y (second column), 5·Y (third column), 2·Er (fourth column) and 5·Er (fifth column) upon irradiation with different wavelengths at room temperature (see the experimental section for details). | ||
 | ||
| Fig. 5 The photoluminescence (PL) spectra of the as-synthesized samples of 2·Ln and 5·Ln (Ln = Y and Er) in methanolic solutions ((A) for Y and (C) for Er analogues) and in solid states ((B) for Y and (D) for Er analogues). All the spectra in the figures were recorded at room temperature with slit-widths of 2.5 nm for both excitation and emission. The spectra in the insets were recorded at room temperature with slit-widths of 10 nm for excitation and 5 nm for emission. | ||
Mechanistic aspects
The widely accepted mechanism for the fixation of CO2 into CO32− is as follows: dissolution of CO2 gas followed by carbonation of water to produce carbonic acid and subsequent ionization of carbonic acid into bicarbonate/carbonate before complexation with metal ions.3g,5f For a carbonato Ln complex with the usual bridging mode(s) of CO32−, the aforementioned mechanism might be operative. However, there is also precedence for the formation of Ln-based carbonato complexes in non-polar solvents under anhydrous conditions.5i Moreover, the formation of cluster complexes with extremely short non-covalent distances between the coordinated carbonates is also evidenced.5g Therefore, the existence of additional alternative pathway(s) for the fixation of CO2 into carbonato complexes could probably not be ruled out.Conclusions
In conclusion, Ln ions in conjunction with the Schiff base ligands of the genre H2L possess immense potential for facile fixation of CO2 under ambient conditions. The carbonato-bridged dinuclear Ln(III) cores are equipped with the kinetically labile terminally axial coordination sites of the Ln centers, which could afford inner coordination post-synthetic modifications. The feasibility for the post-synthetic modification opens up an opportunity to tailor hierarchical physico-chemical properties by employing various ancillary ligands. The dinuclear complexes were also found to be UV-vis active with strong molar extinction coefficients at room temperature. They also exhibited photoluminescence both in solid state and in solution with significantly large emission intensities at room temperature. The photophysical properties of the dinuclear complexes were found to be significantly different from those of the pristine ligand. Moreover, both the UV-vis and PL spectral characteristics were found to be considerably susceptible to the ancillary ligands at the terminally axial coordination sites of the dinuclear motifs.Author contributions
The manuscript was written through contributions from all the authors. All the authors have given approval to the final version of the manuscript.Data availability
All the data related to the article are provided in the ESI.† Crystallographic data are also deposited in the form of CIF files at the Cambridge Crystallographic Data Centre with reference number CCDC 2378627–2378634.† Any additional associated experimental details and relevant data can be obtained from the authors upon request.Conflicts of interest
There are no conflicts to declare.Acknowledgements
AKB thanks the Empowerment and Equity Opportunities for Excellence in Science (EEQ/2021/000800), and the Science and Engineering Research Board (SERB), for the financial support to carry out the research.References
- H. Ritchie, P. Rosado and M. Roser, “Our World in Data: CO2 and Greenhouse Gas Emissions”, https://ourworldindata.org/co2-and-greenhouse-gas-emissions, 2022.
- P. Gabrielli, M. Gazzani and M. Mazzotti, Ind. Eng. Chem. Res., 2020, 59, 7033–7045 CrossRef CAS.
- (a) C. Xia, P. Zhu, Q. Jiang, Y. Pan, W. Liang, E. Stavitski, H. N. Alshareef and H. Wang, Nat. Energy, 2019, 4, 776–785 CrossRef CAS; (b) V. Kumaravel, J. Bartlett and S. C. Pillai, ACS Energy Lett., 2020, 5, 486–519 CrossRef CAS; (c) K. Sumida, D. L. Rogow, J. A. Mason, T. M. McDonald, E. D. Bloch, Z. R. Herm, T.-H. Bae and J. R. Long, Chem. Rev., 2012, 112, 724–781 CrossRef CAS PubMed; (d) M. Ding, R. W. Flaig, H.-L. Jiang and O. M. Yaghi, Chem. Soc. Rev., 2019, 48, 2783–2828 RSC; (e) H. Demir, G. O. Aksu, H. C. Gulbalkan and S. Keskin, Carbon Capture Sci. Technol., 2022, 2, 100026–100038 CrossRef CAS; (f) D. A. Palmer and R. van Eldik, Chem. Rev., 1983, 83, 651–731 CrossRef CAS; (g) K. Sołtys-Brzostek, M. Terlecki, K. Sokołowski and J. Lewiński, Coord. Chem. Rev., 2017, 334, 199–231 CrossRef; (h) J. Wu, X.-L. Li, L. Zhao, M. Guo and J. Tang, Inorg. Chem., 2017, 56(7), 4104–4111 CrossRef CAS PubMed.
- (a) R. G. Pearson, J. Am. Chem. Soc., 1963, 85, 3533–3539 CrossRef CAS; (b) R. A. Layfield and M. Murugesu, Lanthanides and Actinides in Molecular Magnetism, Wiley VCH, 2015 CrossRef.
- (a) K. Griffiths, J. Mayans, M. A. Shipman, G. J. Tizzard, S. J. Coles, B. A. Blight, A. Escuer and G. E. Kostakis, Cryst. Growth Des., 2017, 17, 1524–1538 CrossRef CAS; (b) K. Ehama, Y. Ohmichi, S. Sakamoto, T. Fujinami, N. Matsumoto, N. Mochida, T. Ishida, Y. Sunatsuki, M. Tsuchimoto and N. Re, Inorg. Chem., 2013, 52, 12828–12841 CrossRef CAS PubMed; (c) S. Sakamoto, T. Fujinami, K. Nishi, N. Matsumoto, N. Mochida, T. Ishida, Y. Sunatsuki and N. Re, Inorg. Chem., 2013, 52, 7218–7229 CrossRef CAS PubMed; (d) S. Sakamoto, S. Yamauchi, H. Hagiwara, N. Matsumoto, Y. Sunatsuki and N. Re, Inorg. Chem. Commun., 2012, 26, 20–23 CrossRef CAS; (e) S. Titos-Padilla, J. Ruiz, J. M. Herrera, E. K. Brechin, W. Wersndorfer, F. Lloret and E. Colacio, Inorg. Chem., 2013, 52, 9620–9626 CrossRef CAS PubMed; (f) N. Qiao, X.-Y. Xin, X.-F. Guan, C.-X. Zhang and W.-M. Wang, Inorg. Chem., 2022, 61, 15098–15107 CrossRef CAS PubMed; (g) V. Velasco, D. Aguila, L. A. Barrios, I. Borilovic, O. Roubeau, J. Ribas-Arino, M. Fumanal, S. J. Teatd and G. Aromi, Chem. Sci., 2015, 6, 123–131 RSC; (h) T. D. Pasatoiu, A. Ghirri, A. M. Madalan, M. Affronte and M. Andruh, Dalton Trans., 2014, 43, 9136–9142 RSC; (i) S. Maity, A. Mondal, S. Konar and A. Ghosh, Dalton Trans., 2019, 48, 15170–15183 RSC; (j) A. R. Willauer, M. Laurent, D. Toniolo, F. Fadaei-Tirani, Y. Yang and M. Mazzanti, Dalton Trans., 2019, 48, 6100–6110 RSC; (k) H. Tian, L. Zhao and J. Tang, Cryst. Growth Des., 2018, 18, 1173–1181 CrossRef CAS; (l) C. H. Hossack, R. J. Butcher, C. L. Cahill and C. Besson, Inorg. Chem., 2021, 60, 15724–15743 CrossRef CAS PubMed; (m) H. Tian, M. Wang, L. Zhao, Y.-N. Guo, Y. Guo, J. Tang and Z. Liu, Chem. – Eur. J., 2012, 18, 442–445 CrossRef CAS PubMed; (n) H.-R. Wen, J.-J. Hu, K. Yang, J.-L. Zhang, S.-J. Liu, J.-S. Liao and C.-M. Liu, Inorg. Chem., 2020, 59, 2811–2824 CrossRef CAS PubMed; (o) C. Browne, W. J. Ramsay, T. K. Ronson, J. Medley-Hallam and J. R. Nitschke, Angew. Chem., Int. Ed., 2015, 54, 11122–11127 CrossRef CAS PubMed; (p) L. Armelao, D. B. D. Amico, P. Biagini, G. Bottaro, S. Chiaberge, P. Falvo, L. Labella, F. Marchetti and S. Samaritani, Inorg. Chem., 2014, 53, 4861–4871 CrossRef CAS PubMed; (q) S. K. Langley, B. Moubaraki and K. S. Murray, Inorg. Chem., 2012, 51, 3947–3949 CrossRef CAS PubMed; (r) C.-M. Liu, D.-Q. Zhang, X. Hao and D.-B. Zhu, Dalton Trans., 2020, 49, 2121–2128 RSC; (s) T. N. Hooper, R. Inglis, M. A. Palacios, G. S. Nichol, M. B. Pitak, S. J. Coles, G. Lorusso, M. Evangelisti and E. K. Brechin, Chem. Commun., 2014, 50, 3498–3500 RSC; (t) W.-M. Wang, X.-Y. Xin, N. Qiao, Z.-L. Wu, L. Lib and J.-Y. Zou, Dalton Trans., 2022, 51, 13957–13969 RSC; (u) H. Tian, L. Zhao, Y.-N. Guo, Y. Guo, J. Tang and Z. Liu, Chem. Commun., 2012, 48, 708–710 RSC; (v) J. Vallejo, J. Cano, I. Castro, M. Julve, F. Lloret, O. Fabelo, L. Canadillas-Delgadoz and E. Pardo, Chem. Commun., 2012, 48, 7726–7728 RSC; (w) S. Xue, L. Zhao, Y.-N. Guo, P. Zhangab and J. Tang, Chem. Commun., 2012, 48, 8946–8948 RSC; (x) H. Ke, L. Zhao, G.-F. Xu, Y.-N. Guo, J. Tang, X.-Y. Zhang and H.-J. Zhang, Dalton Trans., 2009, 10609–10613 RSC; (y) K. Ehama, Y. Ohmichi, S. Sakamoto, T. Fujinami, N. Matsumoto, N. Mochida, T. Ishida, Y. Sunatsuki, M. Tsuchimoto and N. Re, Inorg. Chem., 2013, 52, 12828–12841 CrossRef CAS PubMed; (z) W. Sethi, S. Sanz, K. S. Pedersen, M. A. Sørensen, G. S. Nichol, G. Lorusso, M. Evangelisti, E. K. Brechin and S. Piligkos, Dalton Trans., 2015, 44, 10315–10320 RSC.
- (a) F.-S. Guo, A. K. Bar and R. A. Layfield, Chem. Rev., 2019, 119, 8479 CrossRef CAS PubMed; (b) A. K. Bar, P. Kalita, M. K. Singh, G. Rajaraman and V. Chandrasekhar, Coord. Chem. Rev., 2018, 367, 163 CrossRef CAS.
- S. Cotton, Lanthanide and Actinide Chemistry, John Wiley & Sons, Ltd, 2006 Search PubMed.
- (a) P. Kalita, N. Ahmed, S. Moorthy, V. Béreau, A. K. Bar, P. Kumar, P. Nayak, J.-P. Sutter, S. K. Singh and V. Chandrasekhar, Dalton Trans., 2023, 52, 2804–2815 RSC; (b) P. Kalita, N. Ahmed, A. K. Bar, S. Dey, A. Jana, G. Rajaraman, J.-P. Sutter and V. Chandrasekhar, Inorg. Chem., 2020, 59, 6603–6612 CrossRef CAS PubMed; (c) A. K. Bar, P. Kalita, J.-P. Sutter and V. Chandrasekhar, Inorg. Chem., 2018, 57, 2398–2401 CrossRef CAS PubMed; (d) V. Singh, D. Das, S. Anga, J.-P. Sutter, V. Chandrasekhar and A. K. Bar, ACS Omega, 2022, 7, 25881–25890 CrossRef CAS PubMed; (e) V. Singh, L. T. Suresh, J.-P. Sutter and A. K. Bar, Dalton Trans., 2024, 53, 7436–7449 RSC.
- C. Lorenzini, C. Pelizzi, G. Pelizzi and G. Predieri, J. Chem. Soc., Dalton Trans., 1983, 4, 721–727 RSC.
- L. Dubovan, A. Pollnitz and C. Silvestru, Eur. J. Inorg. Chem., 2016, 10, 1521–1527 CrossRef.
- International Tables for Crystallography, DOI:10.1107/97809553602060000001.
- M. Décultot, A. Ledoux, M.-C. Fournier-Salaün and L. Estel, J. Chem. Thermodyn., 2019, 138, 67–77 CrossRef.
- T. A. Bazhenova, I. A. Yakushev, K. A. Lyssenko, O. V. Maximova, V. S. Mironov, Y. V. Manakin, A. B. Kornev, A. N. Vasiliev and E. B. Yagubskii, Magnetochemistry, 2020, 6, 60–86 CrossRef CAS.
- J.-P. Sutter, V. Béreau, V. Jubault, K. Bretosh, C. Pichon and C. Duhayon, Chem. Soc. Rev., 2022, 51, 3280–3313 RSC.
- (a) A. de Bettencourt-Dias, Inorg. Chem., 2016, 55, 3199–3202 CrossRef CAS PubMed; and the references therein; (b) A. de Bettencourt-Dias, Introduction to Lanthanide Ion Luminescence, in Luminescence of Lanthanide Ions in Coordination Compounds and Nanomaterials, ed. A. de Bettencourt-Dias, John Wiley & Sons, Ltd, Chichester, United Kingdom, 2014, pp. 1–48 CrossRef; (c) Y. Hasegawa, Y. Kitagaw and T. Nakanishi, NPG Asia Mater., 2018, 10, 52–70 CrossRef CAS; (d) S. Lis, J. Alloys Compd., 2002, 341, 45–50 CrossRef CAS; (e) R. C. Leif, L. M. Vallarino, M. C. Becker and S. Yang, Cytometry, Part A, 2006, 69A, 767–778 CrossRef CAS PubMed; (f) M. Hasegawa, H. Ohmagari, H. Tanaka and K. Machida, J. Photochem. Photobiol., C, 2022, 50, 100484–100511 CrossRef CAS; (g) I. Hemmila, J. Alloys Compd., 1995, 225, 480–485 CrossRef CAS.
- M. C. D. Llunell, J. Cirera, P. Alemany and S. Alvarez, SHAPE program, version 2, Universitat de Barcelona, Barcelona, Spain, 2010 Search PubMed.
- (a) W. T. Carnall, P. R. Fields and K. Rajnak, J. Chem. Phys., 1968, 49, 4424–4442 CrossRef CAS; (b) M. Irfanullah and K. Iftikhar, J. Fluoresc., 2011, 21, 81–93 CrossRef CAS PubMed.
- (a) R. Orbach, Proc. R. Soc. A, 1968, 264, 458–484 Search PubMed; (b) G. H. Larson and C. D. Jeffries, Phys. Rev., 1966, 141, 461–478 CrossRef CAS; (c) L. E. Nodaraki, A.-M. Ariciu, D. N. Huh, J. Liu, D. O. T. A. Martins, F. Ortu, R. E. P. Winpenny, N. F. Chilton, E. J. L. McInnes, D. P. Mills, W. J. Evans, F. Tuna and J. Am, Chem. Soc., 2024, 146(22), 15000–15009 CrossRef CAS PubMed.
Footnote |
| † Electronic supplementary information (ESI) available: Experimental procedure along with the supplementary data and their analysis plots related to UV-vis, PL, IR, and NMR spectroscopy, single crystal and powder X-ray crystallography, and DFT computations. CCDC 2378627–2378634. For ESI and crystallographic data in CIF or other electronic format see DOI: https://doi.org/10.1039/d4dt03050h |
| This journal is © The Royal Society of Chemistry 2025 |