
 Open Access Article
 This Open Access Article is licensed under a
 Creative Commons Attribution 3.0 Unported Licence
Elucidating the impact of metal doping in Li1.15(Ni0.35Mn0.65)0.85O2 cathodes using high-throughput experiments and machine learning†
Alex
Hebert‡
a,
Nooshin
Zeinali Galabi‡
a,
J. Michael
Sieffert
 a,
Maxime
Blangero
*b and
Eric
McCalla
*a
a,
Maxime
Blangero
*b and
Eric
McCalla
*a
aDepartment of Chemistry, McGill University, Montreal, QC, Canada H3A 0B8. E-mail: eric.mccalla@mcgill.ca
bUmicore Battery Materials Korea, 71, 3 Gongdan 2-Ro, Seobuk-Gu, CheonAn 331-200 Chungnam, South-Korea. E-mail: maxime.blangero@ap.umicore.com
First published on 14th January 2025
Abstract
With the ever-increasing demand for Li-ion batteries amplifying the economic, environmental, and geopolitical issues of cobalt-containing electrodes, Li-rich Mn-based layered oxides (LMRs) are regarded as promising next generation cathode materials. Due to the projected lower costs and higher energy density than current-generation LiNixMnyCozO2 materials, LMRs have been the subject of extensive research. However, cycling stability remains a key challenge with transition metal (TM) dissolution during cycling being at the root of this problem. Several methods have previously been applied to reduce transition metal dissolution, including doping. However, there has been no systematic study of the impact of a wide variety of dopants on LMR materials, limiting our ability to gather foundational knowledge about the role of doping in these structures and predict their impact to efficiently screen promising materials. In this work, we applied high-throughput techniques established by the McCalla group to study both the structural and electrochemical characteristics of cathodes made at 3 different temperatures with 57 different dopants. For the first time, transition metal dissolution was studied in high-throughput through the elemental analysis of the Li anode after a high-temperature voltage hold. After collecting all these data, we employed machine-learning techniques to establish predictive links between various properties (both structural and electrochemical) and TM dissolution. Ultimately, we discovered 45 different dopant/temperature combinations that showed both improved specific discharge capacity and reduced TM dissolution such that valuable lessons were learned about the impact of dopants in these materials to facilitate further accelerated material design.
Broader contextLi-ion batteries are being scaled up to an unprecedented scale to meet needs for widespread implementation of electric vehicles. However, it is widely acknowledged that the highest energy batteries, relying on Co and increasingly Ni, are not sustainable: Co must be eliminated now, and Ni is likely to be in short supply in the future. The next-generation of high energy cathode is therefore likely to be Co-free Li,Mn-rich oxides, where the Ni content is minimized and the excess Li helps generate high energy densities that in fact outstrip those of the current Ni-rich state-of-the-art cathodes. However, the Li,Mn-rich materials suffer from numerous problems during battery operation that are preventing commercialization; an important one being transition metal dissolution from the cathodes. In this collaboration between an industrial cathode maker and academia, 192 materials tested using high-throughput methods are used to discover composition/synthesis condition combinations that overcome this challenge while maintaining high energy density. Furthermore, using machine learning techniques, the reasons for the improvements are uncovered thereby guiding the future design of these important materials. Achieving functional Co-free cathodes with beyond-state-of-the-art energy density remains a very important sustainability target for electrification in general, and of immediate importance for vehicles in particular. |
1. Introduction
Electric vehicles are the main driver of Li-ion battery demand and their stringent requirements are resulting in the continued acceleration of battery development.1 In current Li-ion battery systems, the cathode limits the specific capacity compared to the higher capacity of anode materials.2 Additionally, current market-dominating cathode materials, LiNixMnyCozO2, contain at least some cobalt, which has a myriad of issues associated with it including environmental toxicity, human rights issues, and high cost.3 Li-rich Mn-based layered oxides (LMRs) provide a potential way to increase specific capacity while relieving the problems posed by Co and its extraction. LMRs have theoretical capacities upwards of 300 mA h g−1 and do not contain cobalt.4 These properties make LMRs a strong candidate for next-generation cathode materials. Additionally, they have been explored for use with all solid-state batteries, allowing us to bridge the gap between liquid and solid electrolyte batteries and will, therefore, see longevity in the battery space if its shortcomings can be overcome.5 The main shortcoming, however, cycling stability remains a key challenge still impeding their mass adoption.6 Structural stability is at the heart of this issue, as these materials suffer from poor cycle life due to oxygen loss during the high voltage plateau where oxygen oxidation takes place. One consequence of this oxygen deficiency is transition metal (TM) dissolution into the electrolyte where Mn and Ni can react with the electrolyte and migrate from the cathode, to the anode where it deposits.7 Several methods have been applied to reduce transition metal dissolution, including doping and coating of the cathode materials.8–16 For example, tungsten has been shown to increase structural stability and reduce transition metal dissolution.8 It is currently impossible, however, to compare the magnitude of dopant impacts across different studies conducted by researchers who use a myriad of protocols in both synthesis and testing. To our knowledge, there has been no systematic study of the impact of a wide variety of dopants on LMR materials, limiting our ability to gather foundational knowledge about the role of doping in these structures and predict their impact to rapidly screen for promising materials.17 Computational methods are often used here to supplement our experiments and get to the root of key questions such as the origins of material instability. However, these calculations are quite expensive and do not always completely reproduce the experimentally observed behaviours. Increasingly, the predictive power of machine learning is cementing itself alongside traditional experimentation: using data-driven techniques to gather insights into these materials and predict their properties.18–20 Currently, machine learning is mostly being applied using computational datasets or material databases with data from different labs with different experimental procedures.21–23 Ideally, to uncover the relationships between the numerous properties of cathode materials, one would collect structural and electrochemical data for hundreds of materials under the same conditions.The McCalla group has developed methodologies to achieve just this. We have employed high-throughput characterization techniques to develop materials with over 50 dopants in them including Li-ion anodes,24 cathodes,25 solid-electrolytes,26,27 and Na-ion cathodes.28,29 Previously, we have screened the entire Li–Mn–Ni–O pseudoternary system.30,31 Herein, we focus on modifying an optimal composition within that system, Li1.15(Mn0.65Ni0.35)0.85−xMxO2. We are able to synthesize and characterize 64 cathode compositions simultaneously in order to rapidly screen the effects of up to 57 different dopants on the structure and electrochemistry of a given material. In this work, we apply these techniques to test 57 different elements as potential dopants in the LMR material Li1.15(Mn0.65Ni0.35)0.85−xMxO2 followed by machine learning to predict transition metal dissolution and capacity retention with information from only the first cycle. For the first time to our knowledge, transition metal deposition on the anode was studied in high-throughput.
2. Results and discussion
Here, we aim to gain a deeper understanding of the impact of substitution on LMR materials and see if we can extract relationships between structural features of the materials and electrochemical and degradation behaviour. This begins with the physical characterization of all undoped materials to validate our synthesis and determine structural changes due to doping. X-ray diffraction (XRD) of the undoped materials all show the expected layered hexagonal α-NaFeO2 structure of Li1.15(Ni0.35Mn0.65)0.85O2 at all three sintering temperatures (Fig. 1). Furthermore, the inductively coupled plasma (ICP) results on the undoped materials (Table S1†) show that lithium loss was indeed managed correctly as described in the Experimental section, with all three synthesis temperatures yielding materials with lithium contents ranging from 1.15 to 1.18, within ICP uncertainty (3%) of the target 1.15. The XRD results for the doped samples (x = 0.05 in Li1.15(Mn0.65Ni0.35)0.85−xMxO2, i.e. 5% of the transition metal layer was substituted with dopant) are shown in their entirety in the ESI (Fig. S1–S3†) with a few representative patterns showed in Fig. 1. We chose 5% doping, as it has been shown to incorporate into the layered structure for some commonly studied dopants (Al and Ti) and have superior performances to other concentrations.32,33 5% doping is also more likely to cause a significant change in the electrochemistry compared to lower concentrations, so this yields better contrast than lower doping levels. Despite this, it is certainly worth exploring other concentrations in future work. For example, 3% W doping was not single-phase, while 2% doping was.34 Additionally, doping W at 2% in Li1.2Ni0.13Co0.13Mn0.54O2 resulted in around 3% higher capacity and a 20% difference in capacity retention after 100 cycles compared to the 3% doped material. Al is another example where changing composition has a significant impact in another LMR material, 5% substitution resulted in 10% less capacity loss compared to 2% substituted and a 50 μV increase to average discharge voltage.32 There is a wide variety of XRD patterns with some showing that a single layered phase was maintained while others show phase co-existence occurs. Careful analysis of Fig. S1–S3† was performed to determine which samples were single-phase and the results are summarized in Table S2† and in the ESI as well as in Fig. S4.† The results show that 24 of the 56 doped samples were single-phase at 800 °C, while this number was 27 and 23 at 850 °C and 900 °C, respectively. These temperatures were chosen, as below 800 °C the undoped material displays poor crystallinity and above 900 °C Li loss is too great to get high performing materials given the high specific surface areas in such small samples. Fig. S4† shows that not all dopants are equally capable of being integrated in the layered structure at all temperatures. Numerous dopants (e.g. Na, Al, Zn, Tl, and Pb) yield single-phase materials but others are only single-phase at low temperature (e.g. Zr, Lu, Ta, W, Re) or high temperature (e.g. Ru, Ir). These varied results demonstrate how important it is to perform such systematic doping studies at various synthesis temperatures as certain dopants show slow kinetics at the lower temperatures while other dopants may result in new secondary phases at elevated temperatures. A visualization of whether a doped sample is single-phase or multi-phase can be found in Fig. 1.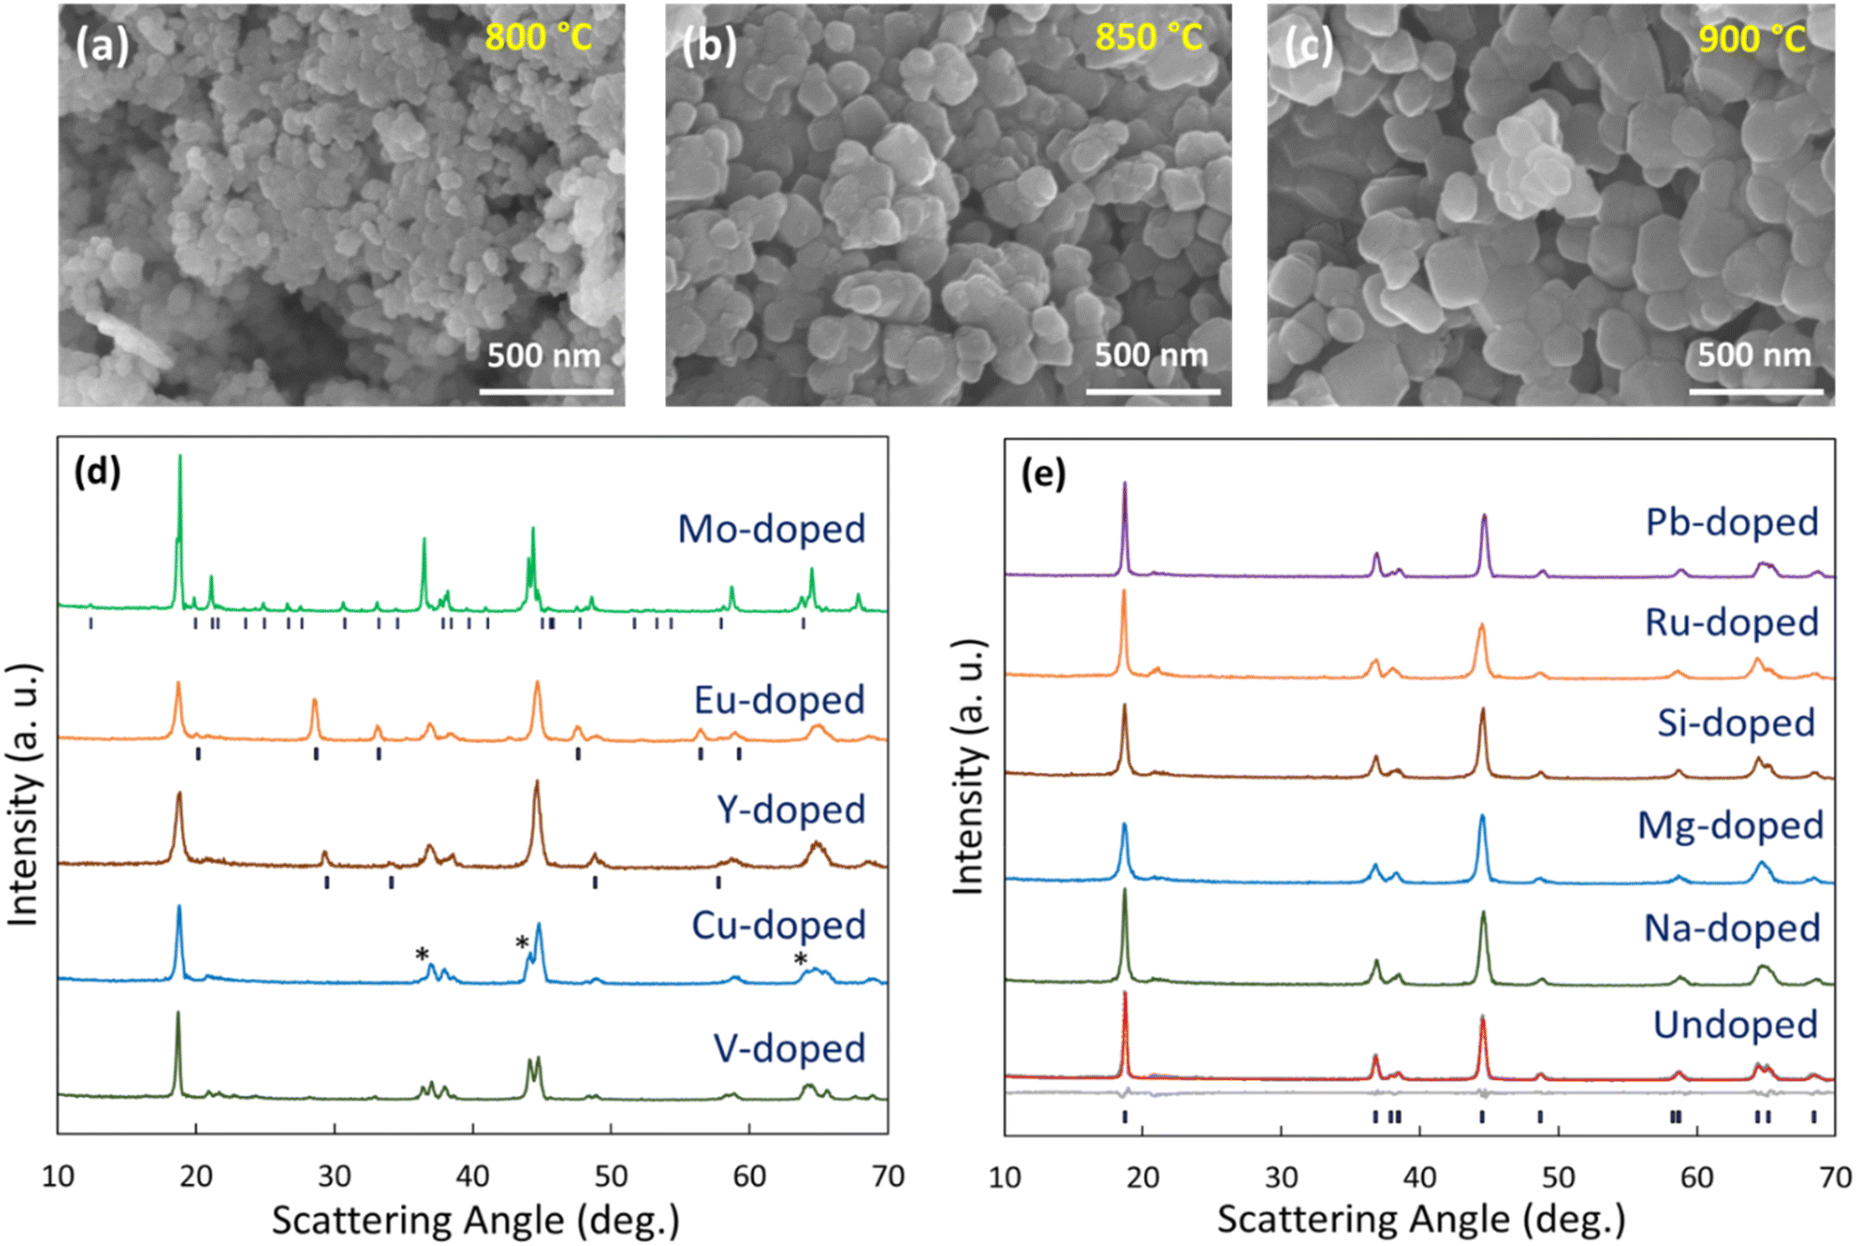 | ||
| Fig. 1 SEM images of undoped HLM materials sintered at 800, 850, and 900 °C (a, b and c). Representative XRD spectra for select multi-phase dopants after sintering at 900 °C (d and e). The reference patterns for the Mo-, Eu-, and Y-doped materials correspond to dilithium molybdate, europium oxide, and yttrium oxide respectively. The * symbols refer to peaks from a phase in the undoped Li–Mn–Ni–O phase diagram referred to as the “ordered rocksalt” in ref. 31. Representative scans at 800 and 850 °C are included in Fig. S4.† | ||
The XRD patterns were further analyzed by performing single-phase Pawley fits on all XRD patterns. The resulting lattice parameters for the layered phase of all materials are shown in Fig. 2 and S6† and demonstrate the large impact that substitution has on the lattice parameters at the three sintering temperatures. The cell volume changed significantly during both the single and multi-phase substitution. In the case of single-phase materials that show a clear change in lattice parameters, we can confidently conclude doping has taken place (i.e. the dopant has fully integrated into the layered structure). For multiphase samples, it is more complicated as a lattice parameter shift could occur in these samples whether substitution into the layered materials happens or not (the lattice parameters in the Li–Mn–Ni–O system evolve significantly as detailed in ref. 31). As sintering temperature increased, the cell volume tended to increase amongst the doped and undoped samples. The variance in cell volume of the undoped and single-phase doped materials decreased.
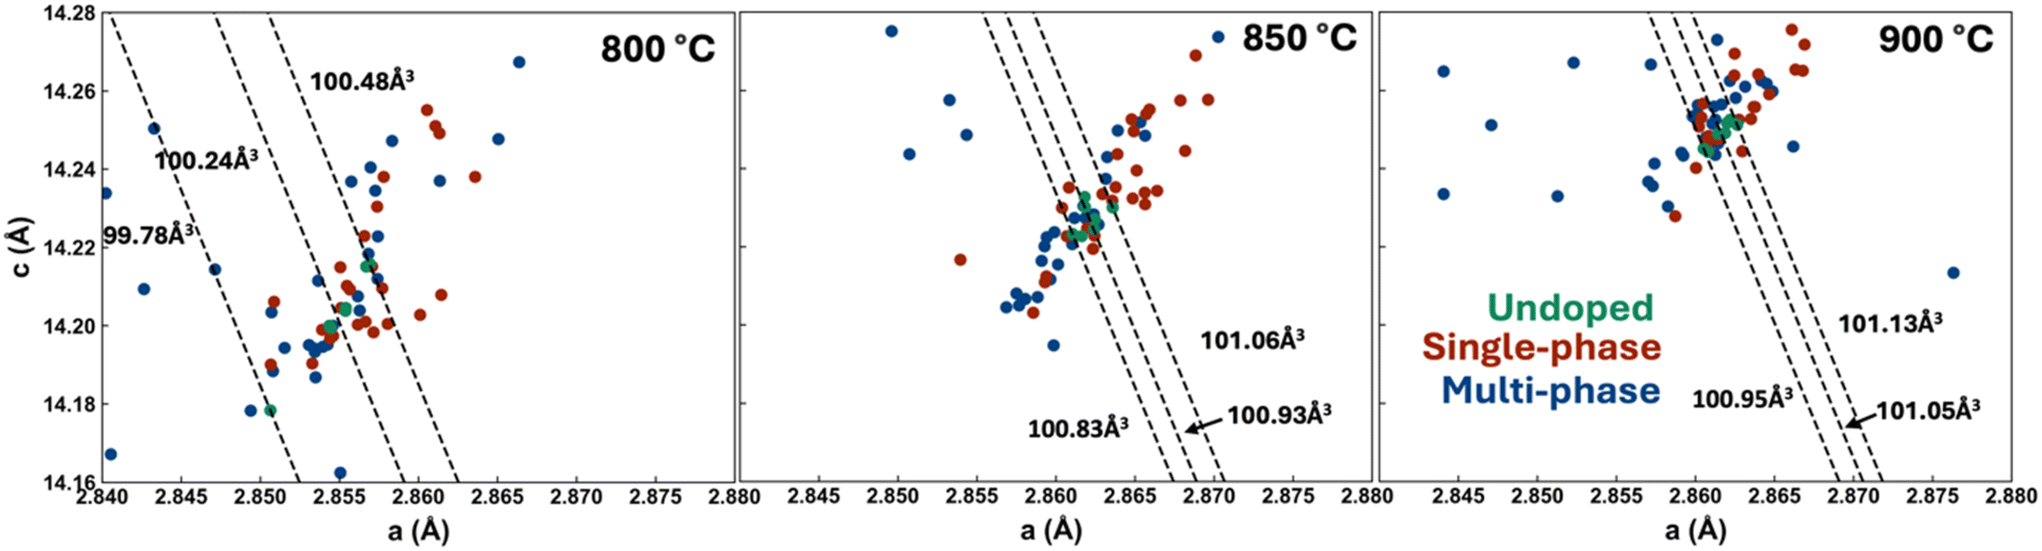 | ||
| Fig. 2 Lattice parameters of undoped, single-phase and multi-phase materials at each sintering temperature. Parameters were obtained through Pawley refinement of the layered phase. Lines of constant column are drawn for the minimum, maximum, and mean of the undoped samples. | ||
Scanning electron microscopy (SEM) images of the undoped materials shown in Fig. 1 reveal an increasing particle size with temperature. When synthesized at 800 °C, the primary particles were approximately 50 nm in diameter, while at 900 °C, they increased to over 100 nm. Grain size is expected to be larger at higher temperature due to the accelerated kinetics of crystal growth and this has been reported for many Li cathode materials exhibiting larger grain sizes and particle sizes with increasing sintering temperature.35–37 These relatively small primary particles are typical for our sol–gel synthesis.38,39 Without the ability to perform high-throughput SEM especially with the high resolution needed to resolve such small particles, it is difficult to see trends in particle size for all samples at the various sintering temperatures. However, the crystallite size was estimated using the Scherrer equation, L = Kλ/β![[thin space (1/6-em)]](https://www.rsc.org/images/entities/char_2009.gif) cosθ, for all materials by first correcting for machine broadening and using the main peak near 44° (visual inspection of the fits was made for all multi-phase samples to ensure that the fit was of high quality on this peak and not distorted by the secondary phases). The results in Fig. S6† show that on average, the crystallite size increased with sintering temperature, consistent with the SEM results and previous literature.35 The undoped materials show values from 20 to 30 nm with the increase occurring at higher temperatures; this shows an overall underestimate compared to the primary particle sizes obtained from SEM. The Scherrer lengths, therefore, do correlate to particle sizes and will be used as an input parameter in the machine-learning model below as particle sizes result in changing areal contact between the cathodes and the electrolyte and as such play important role in determining battery performance. The extracted lattice parameters will also be used in the model.
cosθ, for all materials by first correcting for machine broadening and using the main peak near 44° (visual inspection of the fits was made for all multi-phase samples to ensure that the fit was of high quality on this peak and not distorted by the secondary phases). The results in Fig. S6† show that on average, the crystallite size increased with sintering temperature, consistent with the SEM results and previous literature.35 The undoped materials show values from 20 to 30 nm with the increase occurring at higher temperatures; this shows an overall underestimate compared to the primary particle sizes obtained from SEM. The Scherrer lengths, therefore, do correlate to particle sizes and will be used as an input parameter in the machine-learning model below as particle sizes result in changing areal contact between the cathodes and the electrolyte and as such play important role in determining battery performance. The extracted lattice parameters will also be used in the model.
Combinatorial electrochemistry was then performed on all samples with the resulting CVs shown in Fig. S7–S9.† The vast majority of the CVs are consistent with those of Li-rich oxides as detailed in ref. 30. One noticeable exception is the Mo-doped sample which shows features consistent with high-voltage spinel30 which is in fact consistent with the XRD pattern of this material from Fig. S1–S3.† Although Mo-doped samples are of interest in the literature for LMR materials, these are at lower doping levels40 and this explains the difference with our results. In fact, the 5% Mo-doped sample made here shows a high lithium content secondary phase with nearly all the Mo (dilithium molybdate) such that the remaining materials is lithium deficient and the XRD shows a significant amount of high voltage spinel phase (Fig. 1 and S4,† matched to ref. 31). The spinel particles can be seen as cubic crystals without Mo in the SEM/EDX in Fig. S4† while the other particles contain all the Mo. Since this spinel phase has no capacity up to 4.8 V, the result of the Mo-induced off-stoichiometry is very low capacities for our Mo-doped material here (on the order of 10 mA h g−1).
The CVs were further analyzed to extract the important battery metrics shown in Fig. 3 and S11, S12.† At the lowest temperature of 800 °C, the average charge and discharge capacities of the undoped material were 287 and 157 mA h g−1 respectively with a retention of 57% after 8 cycles. At 850 °C the charge and discharge capacities increased to 315 and 166 mA h g−1, respectively, while at 900 °C the charge capacity decreased to 268 mA h g−1 but the discharge capacity increased to 193 mA h g−1. Fig. 3 also shows the standard deviations of the values extracted from the CVs (the horizontal bands represent ±1 standard deviation from the mean values), such that any doped sample lying outside of these bands is deemed to having impacted the performance (i.e. they lie outside of the range expected for undoped materials). Specifically, the standard deviation on the first discharge capacities for the undoped materials were 4.8%, 7.4% and 8.9% for 800, 850, and 900 °C, respectively. These low standard deviations are consistent with our previous work and allow for excellent screening of beneficial dopants as detailed below. Furthermore, the reproducibility was outstanding as illustrated by the fact that the charge capacities of the first cycle of the TM dissolution cells had an average error of 4.0% compared to those from the cells cycled long-term (note: the first cycle protocols were identical). Thus, the best undoped performance was found at the highest synthesis temperature. The capacity retention of the undoped materials also improved with temperature, increasing to 66% and 84% at 850 °C and 900 °C, respectively.
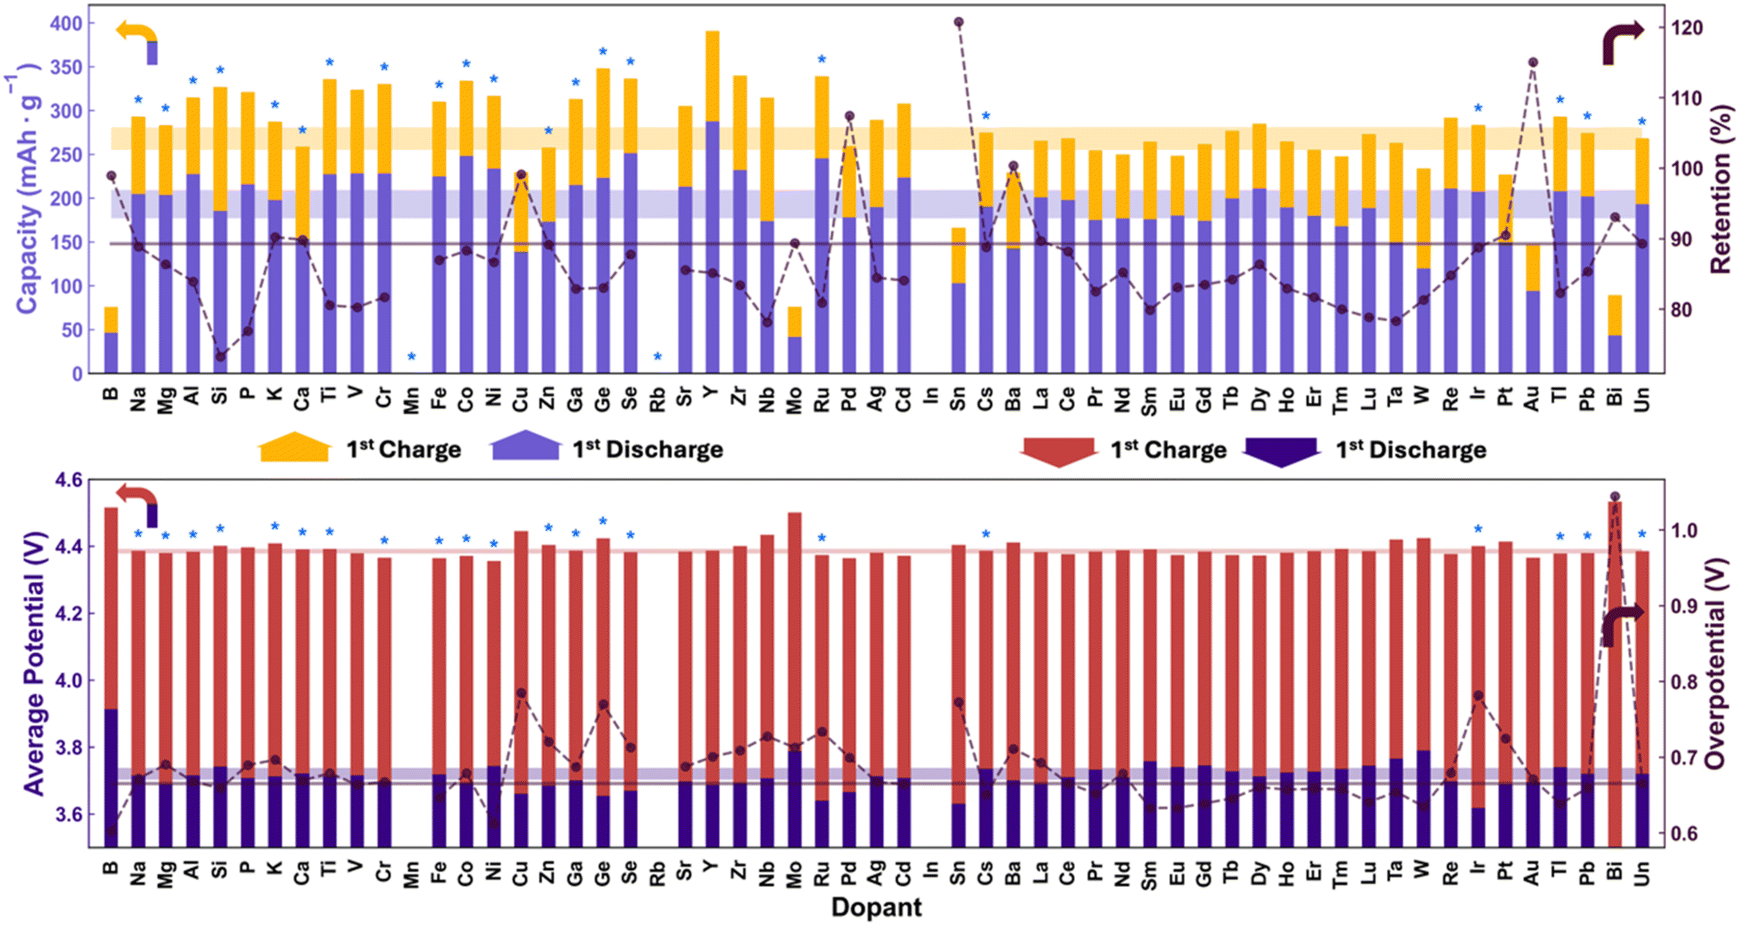 | ||
| Fig. 3 Summary of electrochemical properties for materials sintered at 900 °C. (Top) 1st charge and discharge capacities (bars) and retention after 8 cycles (markers). (Bottom) 1st charge and discharge average voltages (bars) and overpotential (markers). Single-phase materials are marked with an * (Mo is not single phase). The translucent bands depict one standard deviation around the mean of eight undoped samples. All data were collected via cyclic voltammetry at a rate of 0.1 V h−1 over a potential range of 3 to 4.6 V followed by a rate of 0.02 V h−1 over 4.6–4.8 V on charge and 0.1 V h−1 sweep on discharge from 4.8 to 3 V. | ||
At each temperature, a number of materials increased the discharge capacity and also decreased the TM dissolution (to be discussed below), these samples are summarized in Table S2.† This large table demonstrates the clear benefit of these dopants in order to improve the energy stored in the cathodes, while still maintaining or even improving the capacity retention. At 800 °C, a few that stand out are Y, In, Ir, and Pb which increase the discharge capacity while also increasing retention significantly. It is worth noting, however, that the overpotential of all three of these doped samples increased from around ∼622 mV to ∼700 mV. Pb increased the discharge capacity to 207 mA h g−1 while increasing retention after 8 cycles to 82%. Ir pushed the retention slightly higher to 84% but only increases capacity to 174 mA h g−1, and also lowered charge capacity from 287 to 250 mA h g−1. These two dopants maintained their effects of increasing capacity and retention at the other two sintering temperatures. At 900 °C, where the undoped performed the best, Y and Cd increased capacity without sacrificing retention with capacities of 288 and 223 mA h g−1, respectively, and retentions within 1% of the undoped material. What is interesting is that the Ir-doped material at 800 °C and the Y-doped material at both 800 °C and 900 °C are both multi-phase. Thus, the minor phase may be contributing to the observed effects, or seeking out the single phase Y- and Ir-saturated materials may yield a material with even better performance; this work therefore guides further design of these materials. At 900 °C, many dopants help reduce overpotential, but come at a performance cost, except for Cs which does not compromise on discharge capacity, but increases retention to 92%. This material was also multi-phase. Looking at some materials whose capacity grew over the 8 cycles. Namely, Sn and Bi, examining the cyclic voltammograms (Fig. S7–S9†), the peak at 4.6 V is much smaller than other materials, indicating incomplete activation, which continued over multiple cycles, resulting in the increase in capacity.
In order to obtain meaningful information about long-term performance, a high-temperature storage experiment was performed as detailed in the Experimental section. Such storage experiments accelerate the damaging reactions occurring in the cells and enables rapid distinction between the good and poor performers.41–43Fig. 4 and Table S2† provide a summary of the Mn and Ni detected on the Li anode for each of the samples after the week long 4.4 V hold at 60 °C. At a sintering temperature of 800 °C, the undoped materials have the highest concentration of Mn and Ni on the Li electrode. As sintering temperature was increased, the Mn dissolution was reduced, reaching 5.2 μg mg−1 of active material at 900 °C sintering from 14.7 μg mg−1 of active material at 800 °C sintering. This is primarily attributed to the larger primary particle (crystallite) size at higher temperatures, thus reducing the total surface area. Ni dissolution seems to decrease sintering at 850 °C and 900 °C compared to sintering at 800 °C. Many dopants decrease metal dissolution, even in cases where the Scherrer length does not increase. Notably, Pb, which had positive electrochemical effects, lowered the dissolved Mn to less than 1 μg mg−1 of active material across all sintering temperatures. Sm also lowered dissolution with a performance benefit at 800 °C, but significantly reduced performance at 900 °C.
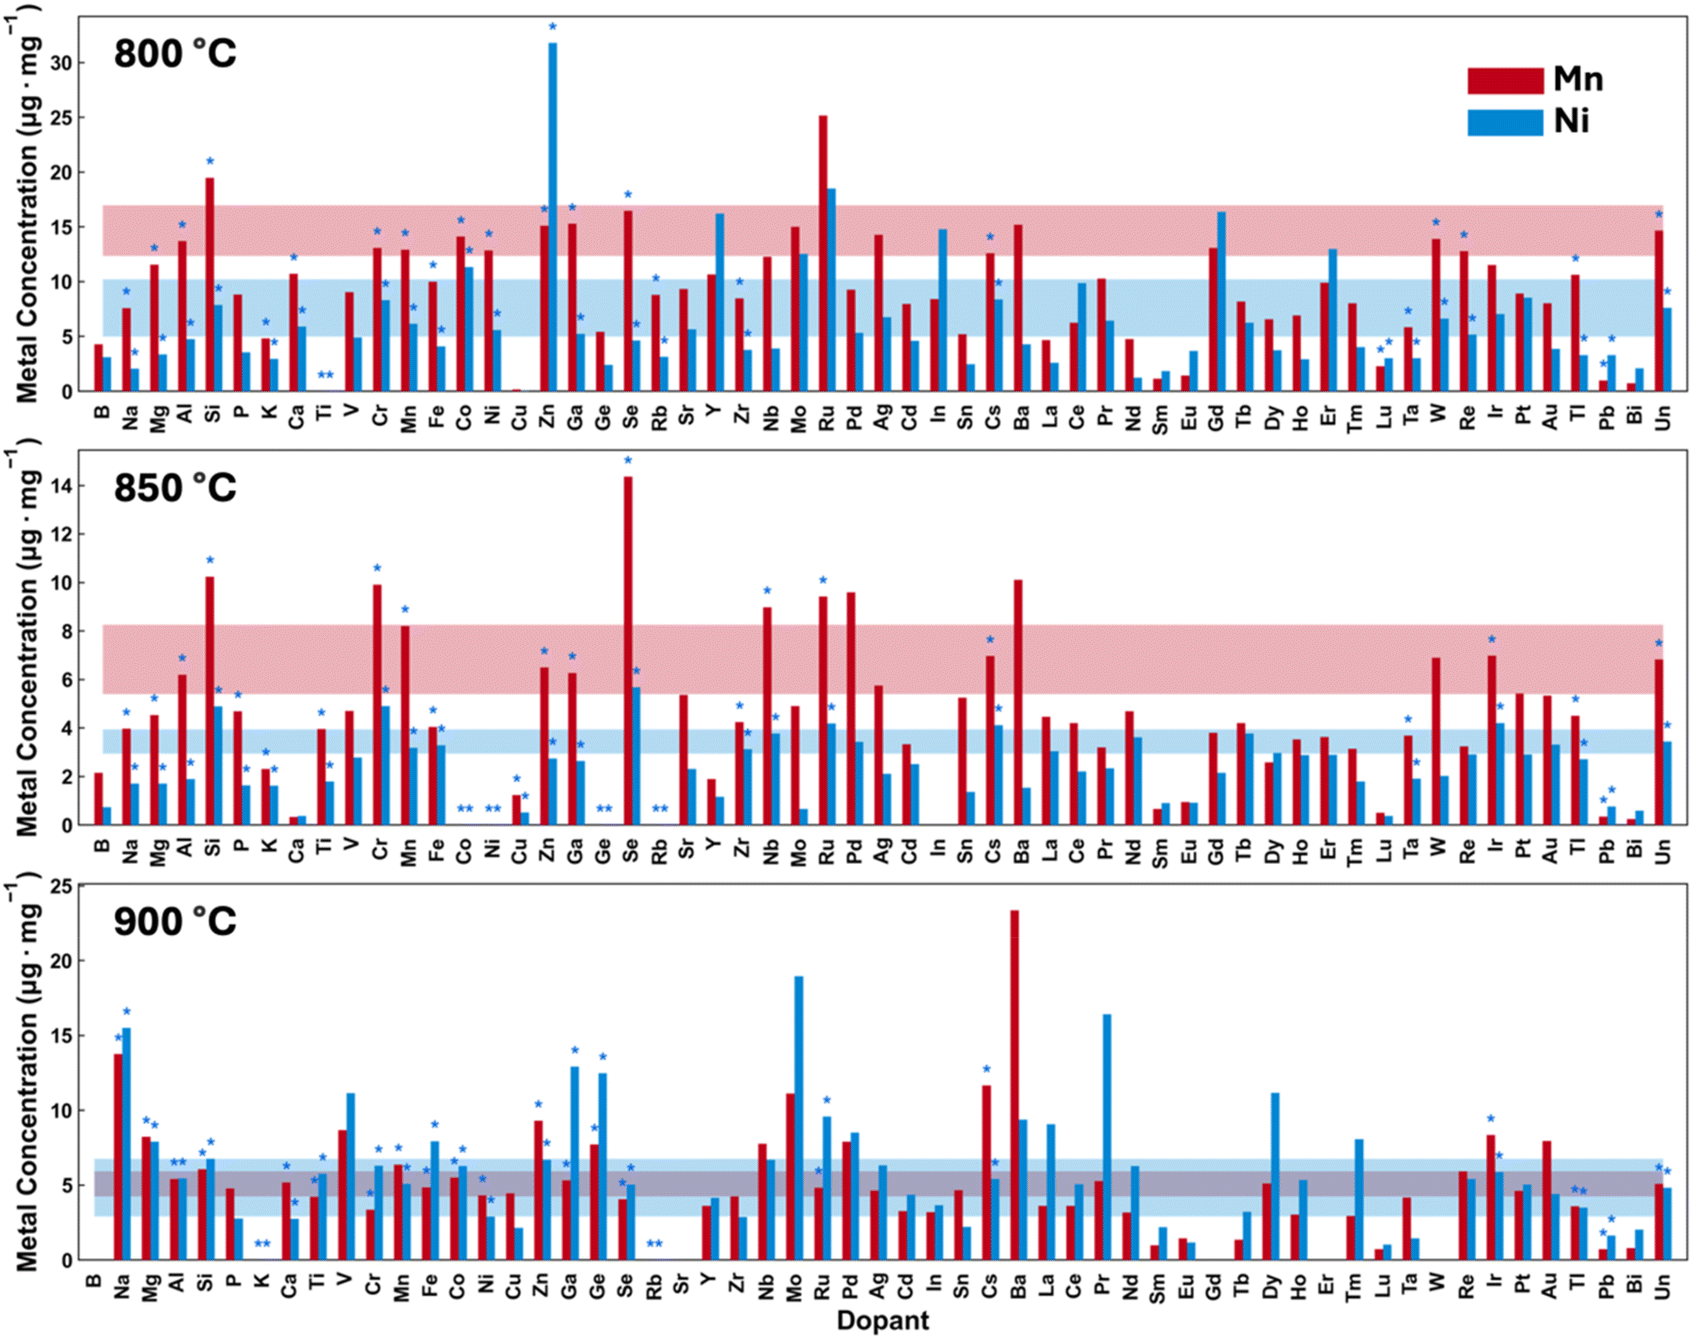 | ||
| Fig. 4 Ni and Mn quantified by ICP-OES of the dissolved Li anode after one week hold at 4.45 V with a complete cycle between 3 to 4.8 V before and after the hold. Single-phase materials are marked with a *. Metal concentration is reported at μg mg−1 of active material. | ||
It is worth putting into context the relative benefits of sintering temperature vs. the benefits from doping. Fig. 5 and S18† (zoom-in) show some clear trends with temperature. We focus on three here: (1) the average crystallite size increases with sintering temperature, (2) the average discharge capacity at 900 °C is greater than at the two lower temperatures, and (3) the average Mn dissolution is higher at 800 °C. These are the three strongest trends with temperature and they have they greatest significance in terms of cathode performance. However, in all three cases the variation at any given temperature is well above the change seen in the average value obtained by changing the sintering temperature. In other words, the variation in property value due to doping is far higher than the change seen in the average values due to increasing the temperature. It is therefore far more important to choose the right dopant (and then select the ideal temperature for that dopant) than to insist on selecting a particular sintering temperature first.
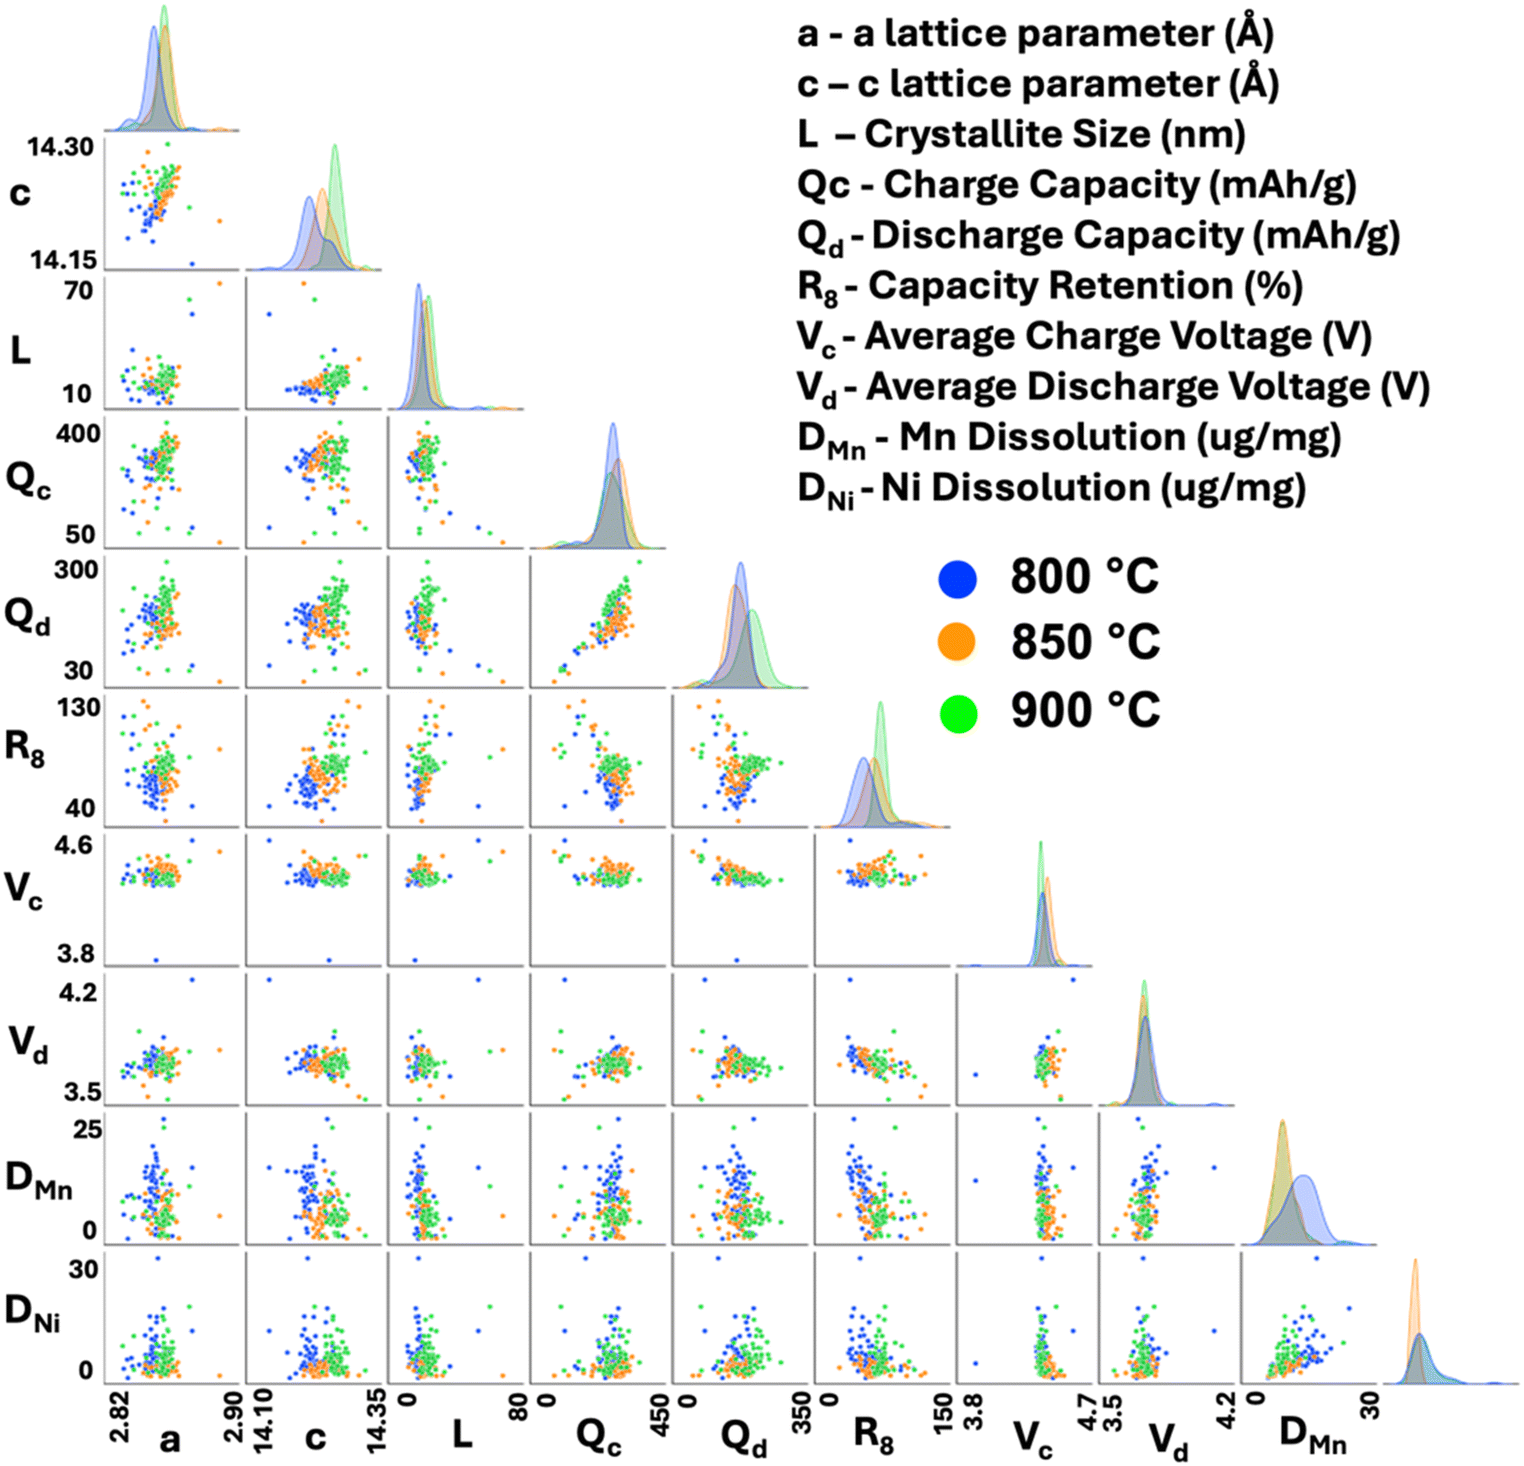 | ||
| Fig. 5 Pair plot of cathode properties measured on all 192 materials (both doped and undoped) coloured by sintering temperature. The numbers on the x and y axes represent the minimum and maximum values along the axis. | ||
We are also presented with an opportunity to better understand some mechanisms at play to make the electrochemical performance dramatically worse with doping, even in materials that are single-phase layered oxides. First, subvalent dopants may force Ni to be oxidized during synthesis (Mn cannot change from its 4+ state) and this will reduce the amount of Ni redox available. One such example is Ca sintered at 900 °C which maintains a single-phase, but we nonetheless clearly see a decrease in first charge capacity, especially below 4.5 V. However, we also see cases where supervalent dopants, like Si sintered at 900 °C, result in some detrimental performance. Although Si increases the first charge capacity below 4.5 V as we would expect (i.e. some Ni was reduced down to 2+), it also results in an increase in the capacity above 4.5 V and this is related to irreversible oxygen loss. Thus, Si shows a larger irreversible capacity than the undoped material. We speculate that the surface instability created by the oxygen loss then leads to poor long-term cycling and TM dissolution. Although much can be learned by looking at this data case by case (and the dataset provided as ESI† allows that exploration), we now turn towards generating a global interpretation of this dataset guided by machine-learning models.
With a dataset this large, showing a wide variety of battery performance and high contrast in the TM dissolution results, it is an opportune moment to learn from this data in order to better understand what material property leads to the best performance. First, we examine the data to see if trends/correlations exist in the overall dataset. Fig. 5 and S13–S16† show our extensive efforts in this regard where numerous pair plots are shown to look for correlations between structural (a, c, L), first cycle (capacities, average voltages), and extended cycling results (capacity retention, Mn and Ni dissolution after storage experiments). While some trends are visible such as those outlined above (e.g. generally the samples made at higher temperatures yield lower TM dissolution), there are no clear correlations and certainly no single parameter can be used in a predictive manner (e.g. if we knew L could we calculate the expected TM dissolution). We also provide the full dataset with all extracted parameters to allow the reader to further explore the data.
Visualizing the data like this certainly shows some interesting trends based on sintering temperature. It is clear that the c lattice parameter increases with sintering temperature, as does discharge capacity and retention. However, charge capacity seems to not depend strongly on sintering temperature. Ultimately, our objective is to determine what material properties lead to improved extended performance (either 8 cycle retention, or, preferably, TM dissolution as it correlates better to very long-term cycling). Trying to extract predictive trends out of this data in this manner is impossible. There does not appear to be any strong relationships between either structural or first cycle electrochemical properties and dissolution or retention after 8 cycles. Thus, to better understand the dataset, machine-learning techniques were applied. Several regression models were applied to attempt to predict both Mn dissolution and capacity retention after 8 cycles. We found that using a voting regressor with a combination of a gradient boosting regressor, random forest regressor, and linear regressor gave the best results as demonstrated in Fig. S16.† The voting yields better R values for the test sets, better than any one model on its own, thereby validating the use of the voting model. Fig. 6 provides an overview of the machine-learning performance on predicting both Mn dissolution and retention from only structural and first cycle electrochemical information. We were able to get a strong linear correlation between the predicted and the measured values in both scenarios using our models. It is worth noting that the model is most accurate in the region of interest (<10 μg mg−1) and tends to overestimate the dissolution but this is simply a constant offset so it can be easily accounted for. This was also true of the model predicting retention, as it underestimates retentions above ∼80%, assuming the validation set had an equal distribution compared to the training set. Having successfully trained the model on our data; we now aim to unravel the impact of each feature on the model. To do this, the dataset was changed by either increasing or decreasing one feature only by one standard deviation for all samples and using this new dataset on our pre-trained model. Table 1 shows the mean and standard deviation of the features tested. Fig. 6 shows the calculated results for the changed datasets. This was repeated for all features and the features that led to significant changes in predictions are shown in Fig. 6. For example, artificially increasing the crystallite size led the model to predict increased retention (green points) and decreased Mn dissolution (red points) universally through the whole dataset. Since the change was a standard deviation, this represents the average impact of this parameter on the entire dataset. This result is a good validation of this approach, it is certainly expected that larger particles will yield better extended cycling and less TM dissolution as the contact area between electrolyte and cathode is decreased. Similarly, increasing charge capacity resulted in a higher dissolution to be predicted and lower retention. Increasing the discharge capacity had the opposite effect but to a smaller degree. Together, the capacity results show that a small irreversible capacity (first charge capacity minus first discharge) is best, again an expected result and a good validation of the technique. Now, interestingly, increasing the average charge voltage caused the model to predict lower Mn dissolution while having no impact on the capacity retention. Increasing the discharge average voltage, however, increased the predicted dissolution overall, while predicting lower capacity retention. Strangely, the average voltage results indicate that a large overpotential (charge voltage minus discharge voltage) might be best, particularly for TM dissolution. Upon manual analysis of charge profiles and cyclic voltammograms, we were unable to identify any simple feature in the CVs that separated materials with large overpotentials and low TM dissolution from those with lower overpotentials and higher TM dissolution. We speculate that the high overpotential (particularly when due to a high average charge voltage) may limit the TM dissolution by decreasing the charge capacity (i.e. some of the voltage plateau on charge is moved to above our voltage window), thereby preventing some of the damaging mechanisms (e.g. oxygen release) that occur at high states of charge. In the ESI,† we further discuss the importance of features in the random forest model, as this model is easily interpretable and was the second best behind the voting model as shown in Fig. S17.† Overall, it shows agreement with our interpretation here with both crystallite size and average voltages being the most critical for TM dissolution. In future works, we intend to further explore the mechanisms giving rise to the favourability of higher overpotential. It is important to note that the model was not given any sintering temperature information. Thus, any conclusions drawn from the model apply regardless of sintering temperature, and the model was able to fully predict the performance with solely structural and first cycle information. The success of this model clearly results in an improved understanding of the root causes of performance in LMR materials, but it also suggests the model can be used predictively to accelerate future testing into co-doped materials where a single cycle will suffice to identify the materials of highest interest. This will accelerate our screening into these higher dimensional material spaces, and also enable our more thorough screening of doping levels which were maintained at 5% in the present study.
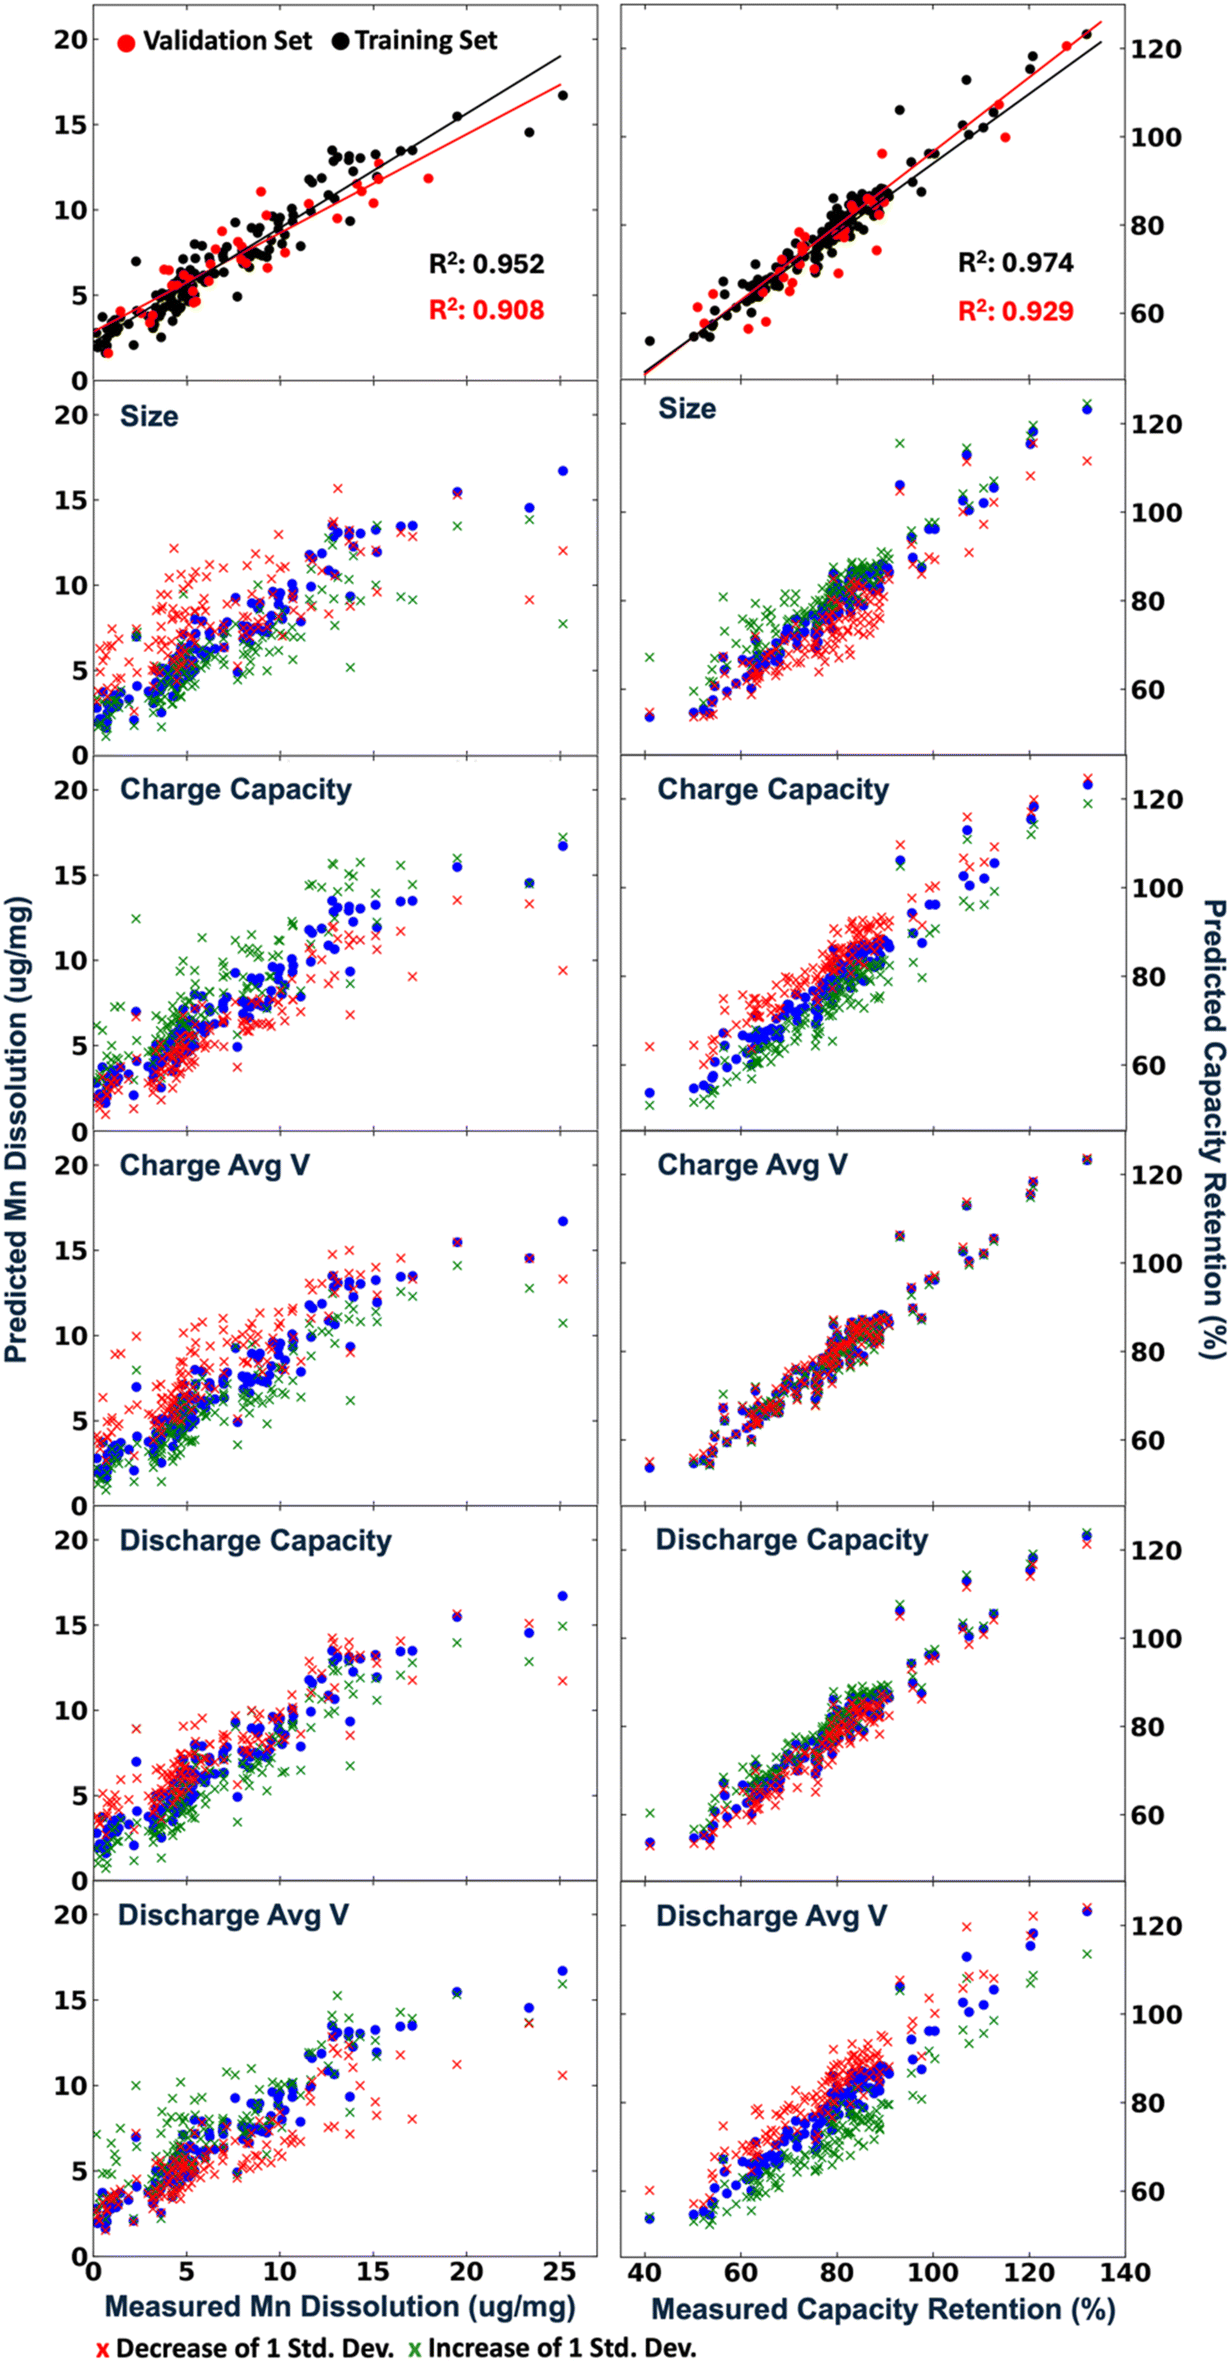 | ||
| Fig. 6 Predicted vs. measured Mn dissolution (left) and capacity retention (right) using a three-component voting model. The uppermost plots show the training and validation set predictions with linear fits. The rest of the plots show the effect of adding (green x) or subtracting (red x) one standard deviation of each of the properties listed above the plots. The blue points represent the unaltered training set. | ||
| Property | Mean | Std. dev. |
|---|---|---|
| Crystallite size (nm) | 22.0 | 7.8 |
| Charge capacity (mA h g−1) | 275 | 53 |
| Charge average voltage (V) | 4.413 | 0.041 |
| Discharge capacity (mA h g−1) | 163 | 42 |
| Discharge average voltage (V) | 3.715 | 0.063 |
3. Conclusion
The effects of 56 different elements on the Li1.15(Ni0.35Mn0.65)0.85O2 system were determined after synthesis at three different sintering temperatures. Several interesting doping candidates were identified including Y, In, Ir, Cd, Sm, Lu, Eu and the complete dataset was shared as ESI.† The extensive dataset helps identify dopants that fully integrate into the layered materials and shows what sintering temperature is optimal for each dopant; this was found to be highly dopant dependent further justifying such thorough systematic studies. For the first time, Mn and Ni dissolution were quantified in high-throughput after a high temperature storage experiment, a metric that must be improved to further develop lithium-rich oxides. The data for the resulting 192 samples (available in the ESI†) allowed us to identify a total of 45 dopant/temperature combinations that outperform the undoped materials in both specific capacity and in suppressing Mn and Ni dissolution. Our dataset shows that battery metrics change far more strongly with dopant selection at a given sintering temperature as compared to the benefits seen by changing the sintering temperature, such that we strongly suggest researchers first select the dopant and then screen to find the ideal sintering temperature for that dopant. Machine learning was leveraged on this large experimental dataset to successfully predict both capacity retention and Mn dissolution with structural and first cycle information only (i.e. data that can be obtained within four days of synthesizing the batches of 64 materials). This approach will now allow the rapid screening of materials beyond this single-dopant system. The prospect of co-doping is especially enticing, as various dopants were able to improve different properties. This dataset and the trained model will guide further development of lithium-rich oxides as they aim to be next-generation Li-ion cathodes for cheap and sustainable electric vehicles.4. Experimental methods
4.1 Synthesis
First, a mixed Ni(NO3)2 and Mn(NO3)2 stock solution was prepared in the ratio of 0.35:0.65. Then, citric acid was pipetted into 64 alumina cups followed by the Ni(NO3)2 and Mn(NO3)2 solution; a dopant solution (the salt depended on the dopant), at 5% for this work; and LiNO3. The ratio of LiNO3 to Ni(NO3)2 and Mn(NO3)2 varied depending on the calcination temperature to account for varying degrees of Li loss at different temperatures. This was determined experimentally on undoped materials before the synthesis of doped materials. Specifically, at 800 °C we used a Li/(Ni + Mn + dopant) = 1.40, while at 850 and 900 °C we used ratios of 1.45 and 1.55, respectively. Table S1† confirms that at all 3 temperatures we obtained materials with Li content very close to the target and withing ±0.015 of each other. After pipetting, all samples were dried at 75 °C for 24 hours with a steel block (referred to as a “smokestack”) on top with columns drilled into it such that there is no mixing between samples if the gel expands out of the alumina cup. The samples were placed in a furnace in air at room temperature and heated to 400 °C to decompose the nitrates. After cooling to room temperature, any gel that was caught in the smokestack was crushed down using a spatula and all samples were crushed into a powder. These powders were then transferred out of the cups onto alumina plates and placed in a tube furnace under O2 and calcined at 800 °C, 850 °C, or 900 °C, depending on the synthesis, regardless of temperature, the heating rate was 5 °C min−1 and the temperature was held for 4 hours at the target temperature before cooling to room temperature with the same rate.
To measure the extent of lithium loss during the synthesis, various samples from the phase diagram were chosen for elemental composition analysis using inductively coupled plasma-optical emission spectrometry (ICP-OES). First, about 2 mg of samples were dissolved in aqua regia and then diluted down to measurable concentrations. Measurements were done using an Agilent Technologies 5100 ICP-OES that can run 20 samples per hour in an automated fashion. The batches of doped samples were synthesized after determining the amount of excess lithium needed at each sintering temperature to obtain the desired composition for the undoped sample.
4.2 Structural characterization
Samples were characterized by powder X-ray diffraction (XRD) in high throughput mode (64 scans in 10 h). Their diffraction patterns were collected in transmission mode using PANalytical diffractometer equipped with a Mo anode X-ray source (60 kV, 40 mA) and GaliPIX3D area detector. The scattering angle range for Mo Kα radiation (λ = 0.70926 Å for Kα1) was 4–30°, which is approximately equal to the 10–70° angle range for Cu radiation. The phases present were identified using the matching tool in Panalytical's HighScore Plus software, by searching against open crystal and ICSD databases. Rietveld and Pawley refinements were performed to determine the content of each phase, and the lattice parameters, respectively. For ease of comparison to the literature, the patterns shown in this paper are K-alpha stripped and angles were converted to the angles corresponding to Cu-Kα1 (λ = 1.54051 Å), as described in ref. 44. Scanning electron microscopy and energy dispersive X-ray spectroscopy was performed using a Hitachi SU-3500.4.3 Electrochemistry
For high-throughput electrochemical characterization, a custom combinatorial cell was used as outlined in other works by the McCalla group.30 First, approximately 1.5 mg of cathode materials were weighed into steel cups. Then, approximately 20 wt% carbon black was added to each sample and the samples were mixed thoroughly. Each active material + carbon black blend was deposited onto an aluminum pad on the combinatorial current collector and a binder solution of 20 wt% polyvinylidene fluoride (PVDF) in N-methyl pyrrolidone (NMP) was drop cast onto the powder. The cathodes were dried overnight at 90 °C. The combinatorial cell was assembled under Ar atmosphere wherein two individual glass microfiber filters were stacked one on top of the other for all 64 samples. Li metal was used as a common anode for all samples. The cell was sealed using a polymer ring. The electrolyte used was 1 M LiPF6 in EC:DMC (3:7 vol:vol). Cyclic voltammetry was performed using a Keithley quad source and a Keithley multiplexed multimeter. The cell was cycled between 3 and 4.8 V. During charging between 3 and 4.6 V, the sweep rate was 0.1 V h−1. The rate was decreased to 0.02 V h−1 over the range 4.6–4.8 V to allow more time for activation of the material.45 On discharge, the sweep rate was 0.1 V h−1 from 4.8 to 3 V.
4.4 Transition metal dissolution
The electrochemical cell was prepared as outlined above. However, instead of two common separators, each sample had two individual separators and an individual Li anode to reduce crosstalk between samples and increase consistency of the anode sampled when dissolving it to evaluate transition metal dissolution. The lack of crosstalk was confirmed on a “checkerboard” cell where samples without Ni, Mn (LiCoO2) are interspersed between our LMR materials in a grid and the result shows no detectable Ni, Mn on the Li anodes across from the LiCoO2 samples. The storage procedure was as follows. First, the cell was cycled once between 3 and 4.8 V with a sweep rate of 0.1 V h−1 over the range 3–4.6 V, 0.02 V h−1 over the range 4.6–4.8 V, and 0.1 V h−1 from 4.8–3 V during discharge. The cell was then charged to 4.45 V at 0.1 V h−1 and moved to a 60 °C chamber for a voltage hold for 1 week. After storage, the cell was discharged to 3 V at 0.1 V h−1 and a charge/discharge cycle was performed at the same rates as the initial formation cycle. The cell was disassembled, and the Li anodes were collected and placed in glass vials. The Li was consumed with a small amount of distilled water and the samples were left to dry overnight. Then, the metals were digested using a minimal amount of aqua regia and left for 24 hours. Finally, the samples were diluted with deionized water and ICP-OES is performed on this final solution to determine the quantity of Ni and Mn on the Li anodes. In our method development, we found that about 9 times more TM was found on the Li anode than in the separator nearest the anode so we did not include the separators in our screening in this article.4.5 Machine learning
Machine learning was performed using the scikit learn library, with significant use of the NumPy and Pandas libraries.46–48 In total, the dataset consisted of 168 individual samples. Ten features were used in the training process for predicting both Mn dissolution and capacity retention: single phase (boolean), a lattice parameter (A), c lattice parameter (A), cell volume (A3) grain size (nm), first cycle charge capacity (mA h g−1), first cycle discharge capacity (mA h g−1), first cycle average charge voltage (V), first cycle average discharge voltage (V), first cycle charge capacity between 4.4 and 4.6 V (mA h g−1). Voting models consisting of a gradient boosting regressor, a random forest regressor, and a linear regressor were used. 20% of the data were withheld from training and used as the validation set. Mn dissolution after the storage experiment mentioned above and capacity retention after 8 cycles were predicted using these models. For both properties, only information collected from powder XRD and the first cycle were used in the models (crystallite size, a and c lattice parameters, cell volume, charge and discharge capacities, charge capacity above 4.6 V, charge and discharge average voltages, and whether or not the materials were single phase). Further details regarding the machine learning models are included in the ESI,† including full listings of the parameters used in scikit learn.Data availability
Data extracted from XRD and electrochemistry is included for all samples reported here in the excel file. Raw data can be obtained from the corresponding author upon reasonable request.Conflicts of interest
There are no conflicts to declare.Acknowledgements
This work was funded by NSERC under the auspices of a discovery grant and the Canadian Foundation for Innovation.References
- A. Pesaran, L. Roman and J. Kincaide, Electric Vehicle Lithium-Ion Battery Life Cycle Management, National Renewable Energy Laboratory (NREL), Golden, CO (United States), 2023 Search PubMed.
- P. K. Nayak, E. M. Erickson, F. Schipper, T. R. Penki, N. Munichandraiah, P. Adelhelm, H. Sclar, F. Amalraj, B. Markovsky and D. Aurbach, Review on challenges and recent advances in the electrochemical performance of high capacity Li–and Mn–rich cathode materials for Li–ion batteries, Adv. Energy Mater., 2018, 8(8), 1702397 CrossRef.
- S. Van den Brink, R. Kleijn, B. Sprecher and A. Tukker, Identifying supply risks by mapping the cobalt supply chain, Resour., Conserv. Recycl., 2020, 156, 104743 CrossRef.
- S. L. Cui, M. Y. Gao, G. R. Li and X. P. Gao, Insights into Li–rich Mn–based cathode materials with high capacity: from dimension to lattice to atom, Adv. Energy Mater., 2022, 12(4), 2003885 Search PubMed.
- L. Xu, S. Chen, Y. Su, J. He, L. Wang, X. Shen, L. Chen, D. Cao, Y. Lu and M. Wang, Building better batteries: solid-state batteries with Li-rich oxide cathodes, Energy Mater. Adv., 2023, 4, 0045 Search PubMed.
- A. Gutierrez, D. Tewari, J. Chen, V. Srinivasan, M. Balasubramanian and J. R. Croy, Earth-Abundant, Mn-Rich Cathodes for Vehicle Applications and Beyond: Overview of Critical Barriers, J. Electrochem. Soc., 2023, 170(3), 030509 CrossRef CAS.
- Z. Li, B. Zhang, G. Li, S. Cao, C. Guo, H. Li, R. Wang, J. Chen, L. Wu and J. Huang, Restraining migration and dissolution of transition-metal-ions via functionalized separator for Li-rich Mn-based cathode with high-energy-density, J. Energy Chem., 2023, 84, 11–21 CrossRef CAS.
- J. Meng, L. Xu, Q. Ma, M. Yang, Y. Fang, G. Wan, R. Li, J. Yuan, X. Zhang and H. Yu, Modulating crystal and interfacial properties by W–gradient doping for highly stable and long life Li–rich layered cathodes, Adv. Funct. Mater., 2022, 32(19), 2113013 Search PubMed.
- Y. Fan, E. Olsson, G. Liang, Z. Wang, A. M. D'Angelo, B. Johannessen, L. Thomsen, B. Cowie, J. Li and F. Zhang, Stabilizing Cobalt–free Li–rich Layered Oxide Cathodes through Oxygen Lattice Regulation by Two–phase Ru Doping, Angew. Chem., Int. Ed., 2023, 62(5), e202213806 Search PubMed.
- J. Chen, Z. Huang, W. Zeng, J. Ma, F. Cao, T. Wang, W. Tian and S. Mu, Surface engineering and trace cobalt doping suppress overall Li/Ni mixing of Li-rich Mn-based cathode materials, ACS Appl. Mater. Interfaces, 2022, 14(5), 6649–6657 Search PubMed.
- A. Medvedeva, E. Makhonina, L. Pechen, Y. Politov, A. Rumyantsev, Y. Koshtyal, A. Goloveshkin, K. Maslakov and I. Eremenko, Effect of Al and Fe doping on the electrochemical behavior of Li1. 2Ni0. 133Mn0. 534Co0. 133O2 Li-rich cathode material, Materials, 2022, 15(22), 8225 CrossRef CAS PubMed.
- J. Yang, Y. Chen, Y. Li, X. Xi, J. Zheng, Y. Zhu, Y. Xiong and S. Liu, Encouraging voltage stability upon long cycling of Li-rich Mn-based cathode materials by Ta–Mo dual doping, ACS Appl. Mater. Interfaces, 2021, 13(22), 25981–25992 CrossRef CAS PubMed.
- E. Makhonina, L. Pechen, A. Medvedeva, Y. Politov, A. Rumyantsev, Y. Koshtyal, V. Volkov, A. Goloveshkin and I. Eremenko, Effects of Mg doping at different positions in Li-rich Mn-based cathode material on electrochemical performance, Nanomaterials, 2022, 12(1), 156 Search PubMed.
- M. Vivekanantha, R. S. A. Saravanan, P. K. Nayak, R. Prakash and K. K. Bharathi, Synergistic-effect of high Ni content and Na dopant towards developing a highly stable Li-Rich cathode in Li-ion batteries, Chem. Eng. J., 2022, 444, 136503 CrossRef CAS.
- A. Celeste, M. Paolacci, P. G. Schiavi, S. Brutti, M. A. Navarra and L. Silvestri, Understanding the impact of Fe–doping on the structure and battery performance of a Co–free Li–rich layered cathodes, ChemElectroChem, 2023, 10(5), e202201072 CrossRef CAS.
- Y. Fan, E. Olsson, B. Johannessen, A. M. D'Angelo, L. Thomsen, B. Cowie, L. Smillie, G. Liang, Y. Lei and G. Bo, Manipulation of transition metal migration via cr-doping for better-performance li-rich, co-free cathodes, ACS Energy Lett., 2024, 9(2), 487–496 CrossRef CAS.
- A. Hebert and E. McCalla, The role of metal substitutions in the development of Li batteries, part I: cathodes, Mater. Adv., 2021, 2(11), 3474–3518 RSC.
- X. Shen, X.-Q. Zhang, F. Ding, J.-Q. Huang, R. Xu, X. Chen, C. Yan, F.-Y. Su, C.-M. Chen and X. Liu, Advanced electrode materials in lithium batteries: Retrospect and prospect, Energy Mater. Adv., 2021, 1205324 Search PubMed.
- C. Lv, X. Zhou, L. Zhong, C. Yan, M. Srinivasan, Z. W. Seh, C. Liu, H. Pan, S. Li and Y. Wen, Machine learning: an advanced platform for materials development and state prediction in lithium–ion batteries, Adv. Mater., 2022, 34(25), 2101474 Search PubMed.
- Y. Liu, B. Guo, X. Zou, Y. Li and S. Shi, Machine learning assisted materials design and discovery for rechargeable batteries, Energy Storage Mater., 2020, 31, 434–450 Search PubMed.
- Z. Zhuang and A. S. Barnard, Predicting battery applications for complex materials based on chemical composition and machine learning, Comput. Mater. Sci., 2025, 246, 113344 CrossRef CAS.
- R. Zhang, F. Rong, G. Lai, G. Wu, Y. Ye and J. Zheng, Machine learning descriptors for crystal materials: applications in Ni-rich layered cathode and lithium anode materials for high-energy-density lithium batteries, J. Mater. Inf., 2024, 4(4), 17 Search PubMed.
- Z. Wei, Q. He and Y. Zhao, Machine learning for battery research, J. Power Sources, 2022, 549, 232125 CrossRef CAS.
- J. M. Sieffert, C. J. Lang, S. Frazzini, N. Zeinali Galabi, S. Bazylevych, P. López Sarmiento, M. Abdolhosseini and E. McCalla, Improving Li-Ion Anodes with Systematic Elemental Doping in Titanium Niobate, Chem. Mater., 2024, 5709–5719 Search PubMed.
- A. Jonderian, S. Jia, G. Yoon, V. T. Cozea, N. Z. Galabi, S. B. Ma and E. McCalla, Accelerated Development of High Voltage Li–Ion Cathodes, Adv. Energy Mater., 2022, 12(40), 2201704 CrossRef CAS.
- E. Anderson, E. Zolfaghar, A. Jonderian, R. Z. Khaliullin and E. McCalla, Comprehensive Dopant Screening in Li7La3Zr2O12 Garnet Solid Electrolyte, Adv. Energy Mater., 2024, 14(20), 2304025 Search PubMed.
- A. Jonderian, R. Peng, D. Davies and E. McCalla, Benefits and limitations of 226 substitutions into Li-La-Ti-O perovskites, Chem. Mater., 2023, 35(16), 6227–6234 CrossRef CAS.
- S. Jia, S. Kumakura and E. McCalla, Unravelling air/moisture stability of cathode materials in sodium ion batteries: characterization, rational design, and perspectives, Energy Environ. Sci., 2024, 4343–4389 Search PubMed.
- S. Jia, E. Yao, R. Peng, A. Jonderian, M. Abdolhosseini and E. McCalla, Chemical speed dating: the impact of 52 dopants in Na–Mn–O cathodes, Chem. Mater., 2022, 34(24), 11047–11061 Search PubMed.
- K. P. Potts, E. Grignon and E. McCalla, Accelerated screening of high-energy lithium-ion battery cathodes, ACS Appl. Energy Mater., 2019, 2(12), 8388–8393 CrossRef CAS.
- E. McCalla, A. Rowe, R. Shunmugasundaram and J. Dahn, Structural study of the Li–Mn–Ni oxide pseudoternary system of interest for positive electrodes of Li-ion batteries, Chem. Mater., 2013, 25(6), 989–999 Search PubMed.
- P. K. Nayak, J. Grinblat, M. Levi, E. Levi, S. Kim, J. W. Choi and D. Aurbach, Al doping for mitigating the capacity fading and voltage decay of layered Li and Mn–rich cathodes for Li–Ion batteries, Adv. Energy Mater., 2016, 6(8), 1502398 Search PubMed.
- S. Liu, X. Yan, P. Li, X. Tian, S. Li, Y. Tao, P. Li and S. Luo, Ti-Doped Co-Free Li1. 2Mn0. 6Ni0. 2O2 Cathode Materials with Enhanced Electrochemical Performance for Lithium-Ion Batteries, Inorganics, 2024, 12(3), 88 Search PubMed.
- Q. Tian, Y. Ji, H. He, H. Tong, W. Yu and X. Guo, Bifunctional modulation of Li-rich layered oxide cathode material via W-modification for improved electrochemical performance, Mater. Today Energy, 2024, 46, 101709 Search PubMed.
- J. Liu, H. Chen, J. Xie, Z. Sun, N. Wu and B. Wu, Electrochemical performance studies of Li-rich cathode materials with different primary particle sizes, J. Power Sources, 2014, 251, 208–214 Search PubMed.
- F. Nomura, Y. Liu, T. Tanabe, N. Tamura, T. Tsuda, T. Hagiwara, T. Gunji, T. Ohsaka and F. Matsumoto, Optimization of calcination temperature in preparation of a high capacity Li-rich solid-solution Li [Li0. 2Ni0. 18Co0. 03Mn0. 58] O2 material and its cathode performance in lithium ion battery, Electrochim. Acta, 2018, 269, 321–330 CrossRef CAS.
- J. Zheng, P. Yan, L. Estevez, C. Wang and J.-G. Zhang, Effect of calcination temperature on the electrochemical properties of nickel-rich LiNi0. 76Mn0. 14Co0. 10O2 cathodes for lithium-ion batteries, Nano Energy, 2018, 49, 538–548 Search PubMed.
- D.-Q. Liao, C.-Y. Xia, X.-M. Xi, C.-X. Zhou, K.-S. Xiao, X.-Q. Chen and S.-B. Qin, Sol–gel preparation of Li-rich layered cathode material for lithium ion battery with polymer polyacrylic acid+ citric acid chelators, J. Sol-Gel Sci. Technol., 2016, 78, 403–410 Search PubMed.
- T. Adhikari, A. Hebert, M. Adamic, J. Yao, K. Potts and E. McCalla, Development of high-throughput methods for sodium-ion battery cathodes, ACS Comb. Sci., 2020, 22(6), 311–318 Search PubMed.
- K.-Q. Geng, M.-Q. Yang, J.-X. Meng, L.-F. Zhou, Y.-Q. Wang, S. Dmytro, Q. Zhang, S.-W. Zhong and Q.-X. Ma, Engineering layered/spinel heterostructure via molybdenum doping towards highly stable Li-rich cathodes, Tungsten, 2022, 4(4), 323–335 CrossRef.
- J. Burns, A. Kassam, N. Sinha, L. Downie, L. Solnickova, B. Way and J. Dahn, Predicting and extending the lifetime of Li-ion batteries, J. Electrochem. Soc., 2013, 160(9), A1451 CrossRef CAS.
- S. Li, N. Sinha, C. Chen, K. Xu and J. Dahn, A consideration of electrolyte additives for LiNi0. 5Mn1. 5O4/Li4Ti5O12 Li-Ion Cells, J. Electrochem. Soc., 2013, 160(11), A2014 CrossRef CAS.
- D. Xiong, R. Petibon, M. Nie, L. Ma, J. Xia and J. R. Dahn, Interactions between positive and negative electrodes in Li-ion cells operated at high temperature and high voltage, J. Electrochem. Soc., 2016, 163(3), A546 Search PubMed.
- E. McCalla, M. Parmaklis, S. Rehman, E. Anderson, S. Jia, A. Hebert, K. Potts, A. Jonderian, T. Adhikari and M. Adamič, Combinatorial methods in advanced battery materials design, Can. J. Chem., 2022, 100(2), 132–143 CrossRef CAS.
- Y. Li, Z. Li, C. Chen, K. Yang, B. Cao, S. Xu, N. Yang, W. Zhao, H. Chen and M. Zhang, Recent progress in Li and Mn rich layered oxide cathodes for Li-ion batteries, J. Energy Chem., 2021, 61, 368–385 Search PubMed.
- O. Kramer and O. Kramer, Scikit-learn, in Machine learning for evolution strategies, 2016, pp. 45–53 Search PubMed.
- C. R. Harris, K. J. Millman, S. J. Van Der Walt, R. Gommers, P. Virtanen, D. Cournapeau, E. Wieser, J. Taylor, S. Berg and N. J. Smith, Array programming with NumPy, Nature, 2020, 585(7825), 357–362 CrossRef CAS PubMed.
- W. McKinney, Data structures for statistical computing in Python, In SciPy, 2010, 445, 51–56 Search PubMed.
Footnotes |
| † Electronic supplementary information (ESI) available: XRD patterns, further electrochemical analysis and details on the machine-learning model. All extracted properties from XRD, electrochemistry and TM dissolution experiments. See DOI: https://doi.org/10.1039/d4eb00016a |
| ‡ These authors contributed equally. |
| This journal is © The Royal Society of Chemistry 2025 |