 Open Access Article
Creative Commons Attribution 3.0 Unported Licence
Li+ crosstalk-driven calendar aging in Si/C composite anodes†
Kai
Sun
a,
Xueyan
Li
a,
Kang
Fu
a,
Zhuojun
Zhang
a,
Anmin
Wang
ab,
Xingmin
He
a,
Lili
Gong
*a and
Peng
Tan
 *ac
*ac
aDepartment of Thermal Science and Energy Engineering, University of Science and Technology of China (USTC), Hefei 230026, Anhui, China. E-mail: liligong@ustc.edu.cn; pengtan@ustc.edu.cn
bGotion High-Tech Co., Ltd, Hefei 230012, Anhui, China
cState Key Laboratory of Fire Science, University of Science and Technology of China (USTC), Hefei 230026, Anhui, China
First published on 21st January 2025
Abstract
To meet the demand for high-energy density, lithium-ion batteries (LIBs) with silicon/graphite (Si/C) composite anodes are capturing an increasing share of the market. Contrary to the common belief of low self-discharge, we demonstrate that LIBs with anodes containing 15 wt% Si retain only 77.7% of their capacity after 24 h of storage at room temperature. We quantitatively analyse the impact of Si addition on calendar aging, emphasizing the critical role of Li+ crosstalk during storage through a synergy of cross-scale characterizations and multidimensional simulations. Si induces severe side reactions, leading to significant Li loss and potential jump. To balance inter-particle potentials, graphite is compelled to transfer Li+ to Si, resulting in additional capacity loss. Theoretical calculations indicate that modifying the Li+ crosstalk pathway can suppress self-discharge, for instance, by increasing the Li diffusion coefficient (DLi+) of active materials. To validate this approach, the Si@C material with a higher DLi+ is synthesized, and the improved batteries with anodes containing 15 wt% Si@C retain 93.0% of their capacity after 24 h of storage. This work uncovers the underlying impact of Li+ crosstalk on calendar aging, offering new perspectives and guidance for investigating degradation mechanisms in other composite electrode systems.
Broader contextThe silicon (Si)-containing lithium-ion batteries are one of the most successful power devices. However, spontaneous side reactions between Si and electrolyte significantly shorten the calendar life of these batteries, which has long been overlooked. In this work, we integrated experimental and simulation approaches to reveal the kinetic changes in Si-containing batteries during storage. The findings highlight that Li+ crosstalk significantly impacts calendar life: Si plunders Li+ from graphite, compromising the stability of graphite. By enhancing the Li storage capability of Si through promoting Li diffusion coefficients, we effectively altered the self-discharge pathway, substantially suppressing the self-discharge. The calendar life demonstrated a 20% increase for cells with improved Si-containing anode after 24 h of storage. With the expanding market for Si-containing batteries, more attention must be paid to calendar aging studies, as the extra addition of active materials alters the physical and chemical environment. Besides, the combined simulation and experimental approach used here offers a reference for further studies on electrodes with composite materials. |
Introduction
Lithium-ion batteries (LIBs) have served as a primary power source for electric vehicles (EVs) owing to their excellent energy density (250–300 W h kg−1),1 and long cycle life (1000 km cruise range),2 which is helpful for sustainable and green development.3,4 Since the graphite anode has approached its theoretical capacity (372 mA h g−1),5 to meet the demands for higher energy density,6 cells with silicon/graphite (Si/C) composite anodes (>500 W h kg−1) quickly attract attention from both academia and industry.7–9Compared to traditional graphite anodes, adding Si offers advantages such as low cost ($4.2–$6.5 kg−1), high abundance, and high specific capacity (3579 mA h g−1 for Li3.75Si).10 However, the mechanical failure caused by ∼300% volume change of Si leads to rapid performance degradation.11–13 Additionally, Si readily undergoes side reactions with the electrolyte, resulting in capacity loss.14,15 To improve the stability of Si/C composite anodes, significant efforts have been made from material design to electrode preparation, such as employing nano-Si,16 modifying material structures,17,18 and changing binders and electrolytes.19,20 For example, Jia et al. synthesized Si@C with high mechanical strength, which effectively buffers Si expansion and enables over 92% capacity retention after 500 cycles.21 Recently, the Si-containing cells proposed by Bai et al. achieved an energy density of 325.9 W h kg−1 by combining structural optimization and gel electrolytes, maintaining 88.7% capacity retention even after 2000 cycles.10
Although higher energy density and cycle life have greatly inspired both academia and industry, the calendar life of these cells during storage has been habitually overlooked.22,23 For EVs, more than 12 hours a day are spent in an idle state, which means that calendar life accounts for more than half of the total battery lifespan. Furthermore, Si-containing cells from the market were reported with calendar life far less than traditional graphite-based cells.23 Research on calendar aging for cells with Si/C composite anodes plays a crucial role in extending lifespan and expanding market scale. During storage, Si/C composite anodes experience both active material loss (LAM) and lithium inventory loss (LLI).24,25 No matter what aging mechanism was proposed, the main reason was considered as side reactions on Si.26,27 The solid electrolyte interphase (SEI) on Si undergoes continuous decomposition and deposition, causing abundant Li loss.28 However, the decay pathway among active materials (AMs) is blurry during storage.
In this work, the calendar aging pathways of cells with Si/C composite anodes were specified by combining cross-scale characterization with multidimensional simulation models. First, the accelerating effect of Si addition on calendar aging was quantified using electrochemical testing and multiple compositional analysis techniques. To reveal the kinetic process between AMs, multidimensional models were developed to capture mass transport and charge transfer within the anode supplementing with microscale characterizations. Li+ crosstalk was identified as a key factor in calendar aging, in which the transfer of Li+ from graphite to Si compromises the stability of graphite. Based on these findings, adjusting Li+ crosstalk significantly suppresses calendar aging. We tried to improve the calendar life from a kinetic aspect and promote the Li storage in Si by enhancing the Li diffusion coefficient (DLi+). As a proof of concept, Si@C with a high DLi+ was fabricated, and the improved Si-containing cells demonstrated an increase of 20% in calendar life after 24 h of storage. We emphasize the significant impact of Li+ crosstalk on calendar aging, and this effect offers guidance for investigating degradation mechanisms in other composite electrode systems.
Results and discussion
The instability induced by the Si
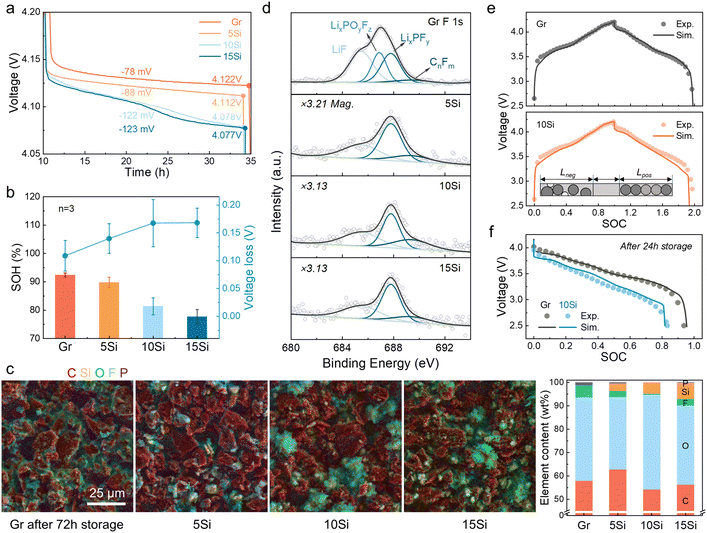
To evaluate storage performance, cells with anodes containing varying Si contents (0 wt% to 15 wt%, marked as Gr, 5Si, 10Si, and 15Si) were charged to 4.2 V and stored at room temperature (RT) for 24 h. The open circuit potential (OCP) drops were found to be Si content dependent, ranging from a 78 mV drop for the graphite-based cell to a 123 mV drop for the cell with a 15Si anode (Fig. 1a). This self-discharge effect also leads to a noticeable difference in capacity loss (Fig. 1b). After 24 h of storage, the average state of health (SOH) was 92.4%, 89.8%, 81.4%, and 77.7% for cells with the graphite, 5Si, 10Si, and 15Si anode, respectively. Increasing Si content intensifies calendar aging. Especially for cells with 15Si anodes, internal side reactions result in complete cell failure after 24 h of storage.The addition of Si was proven to cause severe capacity and voltage loss, and this decay is aggravated when Si content increases. A three-electrode cell with a Li reference electrode was tested to record the OCPs of the anode and cathode (Fig. S1†). The potential of the cathode hardly descended, while the potential of the anode increased obviously, leading to the decay of voltage and capacity. The anodes were dissembled out after 72 h of storage and compared with the pristine lithiated state (Fig. S2†). The golden color of each pristine anode refers to a Li-rich state of graphite (LiC6),29,30 but the Si-containing anodes after 72 h self-discharge became black and covered with a gray film. To specify the interface changes, the interfacial components were analyzed using scanning electron microscopy with energy dispersive spectroscopy (SEM-EDS, Fig. 1c and S3†). A huge growth of Li2CO3 and decomposition of F-containing intermediates were discovered, which has been affirmed in our previous work.31 The weight percentage of O shifted from pristine ∼10% to more than 30% after storage, especially 40.6% for the aged 10Si anode (Fig. 1c and S3, Table S1†). Besides, the weight percentage of F decreased from the original 10–23% to 0–5%. Using X-ray photoelectron spectroscopy (XPS), the LixPOyFz peak at 686.9 eV in F 1s spectra demonstrated an inverse relationship with Si content,32 where the LixPOyFz peak decreases as the Si content increases (Fig. S3c†). For the most stable graphite anodes, the peak of LixPOyFz still existed after 72 h of storage. In contrast, all the Si-containing anodes showed no LixPOyFz left (Fig. 1d).
Limited by characterization technology, the real-time kinetic process during calendar aging is still dimmish, including the Li+ diffusion, transfer, and corresponding side reactions. Related simulations are thus introduced to demystify the mystery. The simulation results of cells with the graphite anode and the 10Si anode showed good consistency with the experimental data during the 0.1 C formation process (Fig. 1e). When leaving the fully charged full cells open circuit at RT for 24 h, the discharge data also demonstrated the same curve shape and capacity retention (Fig. 1f). Thus, the models established here are validated to reveal the self-discharge mechanism of cells with Si/C composite anodes.
Detailed aging process in the 10Si anode
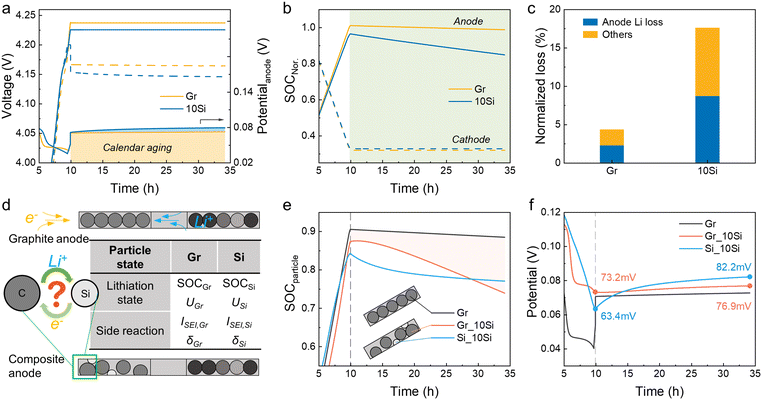
When cells were rest after fully charged, the voltage dropped immediately due to polarization (Fig. 2a). For cells with 10Si anodes, the low conductivity of Si leads to a greater voltage drop to 4.154 V (vs. 4.166 V for graphite-based cells). The OCPs of cathodes remained nearly constant and the voltage losses of full cells were mainly determined by the anodes, which was in agreement with the experimental data (Fig. S1†). The states of charge (SOC) of electrodes were calculated by dividing the remaining Li inventory in electrodes by the charging capacity (Fig. 2b).33 The Li loss of the 10Si anode was much faster than that of the graphite anode, causing a nearly 3-fold increase in attenuation (8.7% vs. 2.3% in 24 h). Over the entire 24 h storage period, cells with 10Si anodes experienced a 17.6% capacity loss, while cells with graphite anodes showed only a 4.3% capacity reduction (Fig. 2c).Through experiments and simulations, the Si/C composite anodes are proven to induce more severe Li loss than graphite anodes. But what interests us is the pathway of self-discharge caused by the unstable Si. As shown in Fig. 2d, when cells are placed in an open-circuit state, the calendar aging for graphite anode is influenced by only one active material. When taking account of the effect of Si, however, the aging mechanism becomes complicated. Specifically, are the decay rates for Si and graphite particles independent of each other, and would the side reaction of graphite be accelerated by Si? The simulation established here allows us to monitor these changes. In Fig. 2e, the SOC of particles refers to the average Li+ concentration over the maximum Li+ concentration of the material (cLi+/cmax).34,35 For 10Si anodes, the SOC of graphite dropped rapidly from 0.874 to 0.739, while the SOC of Si decreased slowly from 0.842 to 0.771. The potential of Si increased rapidly with an increase of 18.8 mV during 24 h of storage, and the potential jump of graphite particles was faster than the one in graphite anode (3.7 mV vs. 2.1 mV, Fig. 2f).
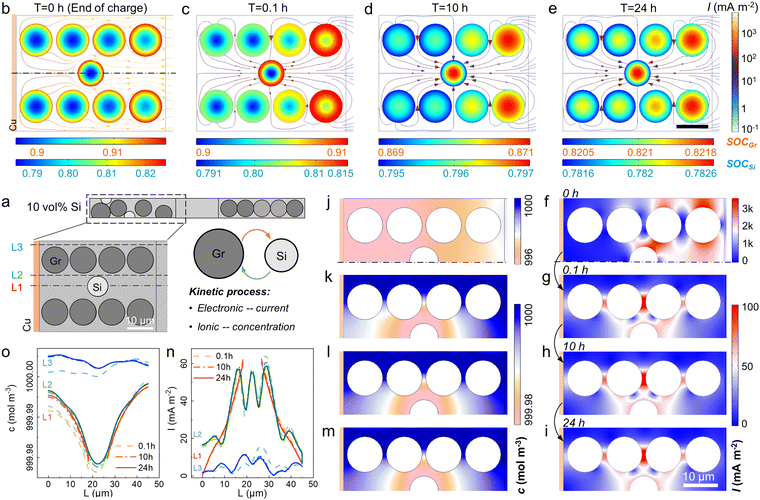
A 2D model was introduced to unveil the kinetic process among AMs, i.e. Li+ crosstalk (Fig. 3a and S4†).36 The lithiation state along thickness was inhomogeneous even at 0.1 C charging. Graphite particles near the separator showed 0.909 SOC while only 0.906 was acquired near the Cu current collector (Fig. 3b and S5†). Once the charging process stopped, the Li+ transferred from graphite to Si with a current density (I) around 100 mA m−2 (Fig. 3c–e). During the storage time, Si displayed a higher potential than graphite, thus a micro-loop was formed between Si and graphite, in which lithiated graphite was treated as a Li source. Driven by the overpotential, the Li+ ions in graphite particles were forced to supply to Si (Fig. S6†). The mass and charge transport in the electrolyte are shown in Fig. 3f–m. I and cLi+ changed more violently at charging than in storage. Initially, the areas near the separator showed a higher I (>3 A m−2, Fig. 3f), while cLi+ varied along the thickness direction from 996 to 999 mol m−3 due to the external electric field (Fig. 3j). Once the external current vanished (t > 0 h), the side reaction current was higher near Si with a more prominent Li+ depletion. The gradient of cLi+ in Si transitioned from “lower inside and higher outside” to “higher inside and lower outside” at ∼1.6 h when internal Li+ supply cannot meet surface consumption (Fig. S7†). I and cLi+ at three different locations were monitored, i.e. areas near the Si (L1 and L2) and near the graphite (L3). L2 and L3 were affirmed with the largest I and Li+ consumption (Fig. 3n and o). The 10 vol% Si addition led to a 3-fold I increase and extra cLi+ decrease than graphite-based cells (Fig. S8†).
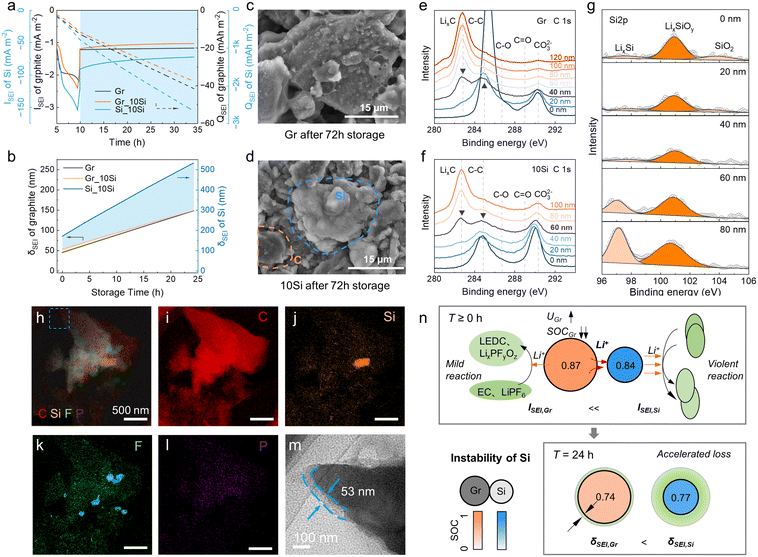
The SEI growth was explored additionally (Fig. 4). The side reaction of Si was always dominant during the calendar aging (−90 to −70 mA m−2, Fig. 4a). The side reaction current density (ISEI) and areal capacity (QSEI) of graphite in 10Si anodes were lower than those in graphite anodes because the SOC of graphite and the corresponding overpotential of side reaction (ηSEI) in 10Si anodes was lower than in graphite anodes (Fig. 2e and f). The calculated thickness of SEI (δSEI) of graphite raised from 53 nm to 149 nm in 10Si anodes, while increased from 45 nm to 148 nm for graphite anodes (Fig. 4b). The Si addition promotes the SEI growth of graphite with greater ISEI, especially during the charging process (Fig. 4a). Once the external current disappears, the δSEI of graphite in Si-containing anodes increases slowly due to the lower ηSEI.
To affirm the simulation results, the fully charged cells were stored at RT for 72 h and then dissembled. From SEM images (Fig. 4c and d), Si appeared as smooth, rounded chunks with a brighter color due to its lower conductivity, while graphite shows a distinct layered structure with a darker color. The SEI on 10Si anodes was indeed more luxuriant than graphite anodes. XPS depth profiling was conducted to determine the δSEI grown on each AM (Fig. 4e–g). The δSEI of graphite was specified when the LixC peak intensity at 282.2 eV equaled the C–C peak at 284.8 eV (Fig. 4e and f).37 Similarly, the δSEI of Si was specified when the LixSi peak intensity at 97.2 eV equaled the LixSiOy peak at 101.1 eV (Fig. 4g).38 As a result, the δSEI of graphite anodes was 40 nm, lower than 60 nm for the graphite in 10Si anodes. The δSEI of Si in 10Si anodes was 80 nm. An extra transmission electron microscopy (TEM) characterization reaffirmed the δSEI of graphite in 10Si anodes was thicker than that in graphite anodes (Fig. 4h–m).
Combining the experiments and simulations, the adverse impact of unstable Si on calendar life was clarified (Fig. 4n). Due to quite low conductivity and DLi+ for Si, the lithiation state of Si-containing anodes is insufficient, thus the SOC of Si is lower than graphite. The active Si induces a quite severe side reaction during storage accompanied by prominent Li loss and potential rebound. Driven by the potential gradient, the Li+ in graphite is forced to supply to Si, leading to an accelerated Li loss of graphite. As a result, the available capacity in Si-containing anodes plummets with a robust SEI growth.
The role of Si content in calendar aging
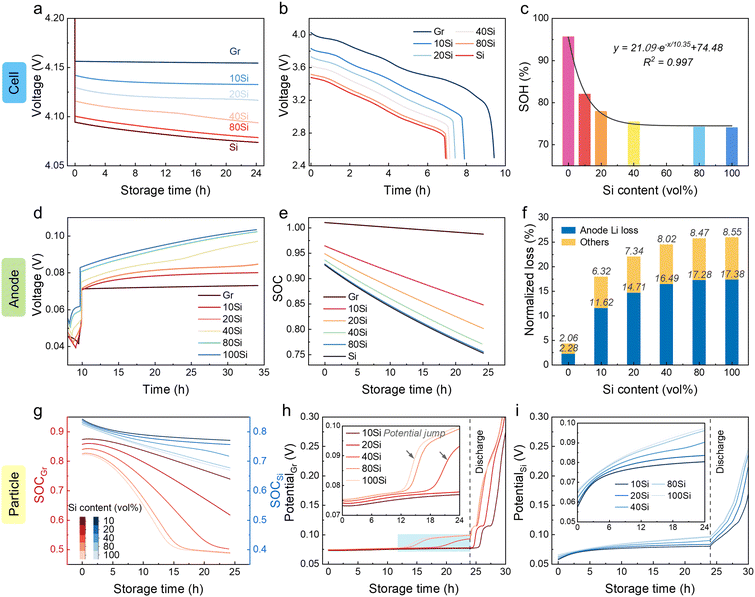
Increasing the Si content in anodes indeed enhances the energy density.14 Regrettably, cells with high Si content anodes experience more severe self-discharge as mentioned above. To balance the relationship between energy density and service life, the effects of Si content were explored using the established model (Fig. 5). Cells with higher Si content were proved to suffer a larger voltage drop with less capacity retention (Fig. 5a and b). Before reaching a Si content of 40 vol%, the SOH decreased dramatically during the 24 h of storage period with increasing Si content (Fig. 5c). When the Si content exceeded 50%, the decay rate slowed down. The SOH of 24 h stored cells followed the relationship with Si content (x) as shown below:| SOH = 21.09e−x/10.35 + 74.48 | (1) |
The potentials of anodes were monitored, showing an increase trend with a higher Si content (Fig. 5d). The remaining Li inventory in anodes decreased more rapidly with increasing Si content (Fig. 5e). By calculating the SOC decrease during 24 h of storage, the Li loss of the anode reached 2.3%, 11.6%, 14.7%, 16.5%, 17.3%, and 17.4%, respectively, when the Si content was 0, 10%, 20%, 40%, 80%, and ∼100% (Fig. 5f). The ratio of Li loss in the total capacity loss increased with the Si content. The Li inventory of graphite particles suffered from sharp attenuation compared with that of Si particles (Fig. 5g). For anodes with Si content of ∼100%, the SOC of graphite decreased from 0.82 to 0.49, while shifted from 0.82 to 0.67 for Si. Considering the phase transfer stage at 0.07 V for graphite (LiC6 to LiC12), a huge Li loss leads to a potential jump, which was also shown in the experiment (Fig. 5h, i, and S1†). The time of this potential jump advanced from 19 h to 13 h as the Si content increased from 40% to ∼100%.
For anodes with a higher Si content, the ISEI and QSEI were detected with a decreasing trend (Fig. S9†). This is because ηSEI decreased due to insufficient capacity utilization (low SOC) when using an anode with a higher Si content. Accordingly, the SEI growth descended. Although the ISEI and QSEI went down when the Si content increased, when it comes to the total capacity loss, the incremental reactive area of Si still caused a graver decay.
A self-discharge suppression method by adjusting Li+ crosstalk
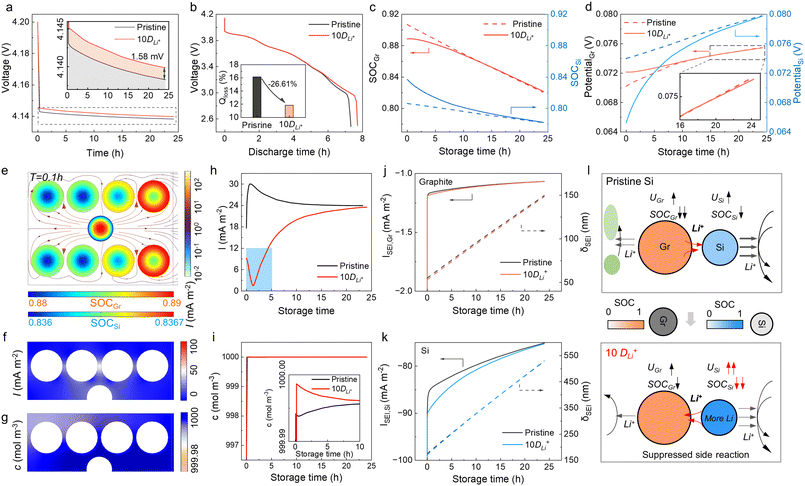
It is well-known that side reactions can be suppressed by AM coating,39,40 while little attention is paid to the kinetic improvement. Since Si reacts severely and plunders Li+ from graphite, enhancing the Li storage in Si by improving the DLi+ may help suppress self-discharge. The DLi+ of Si was set to 10-fold in the 10Si anode (marked as “10DLi+”), and the OCP of full cells was increased by 2 mV after 24 h of storage (Fig. 6a). After 24 h of storage, cells with improved 10Si anodes enabled a 7.7 h of 0.1 C discharging, showing a 5.5% increase in capacity retention than unimproved cells (7.3 h, Fig. 6b). When the anodes were fully charged (storage time at 0 h), the SOC of Si was improved from pristine 0.81 to 0.84 (Fig. 6c). Besides, the potential of Si in improved 10Si anodes was lower (65 mV vs. 74 mV) and rebounded with a greater speed (Fig. 6d). The Li loss from graphite was proven to be inhibited, showing a much lower SOC decrease of 0.067 and voltage rebound of 3.2 mV.A larger DLi+ of Si enabled more sufficient Li storage, which allowed Si to have a lower potential than graphite when fully charged (Fig. 6d). Once the current vanished, the Si served as Li sources and the Li+ crosstalk was modified (Fig. S10 and S11† for details). Fig. 6e shows the Li+ movement among AMs at the beginning of storage (T = 0.1 h). Different from the traditional 10Si anode (Fig. 3c), the Si provided Li+ to the graphite, making up for the Li loss caused by the side reaction. The distribution of I in the electrolyte was uniform and the value was less than 50 mA m−2 (Fig. 6f), much lower than the original condition (∼100 mA m−2). Besides, the distribution of cLi+ was also more uniform, and less electrolyte was decomposed (Fig. 6g). When the storage time reached 1.4 h, the potential of Si rose close to the potential of graphite, and Li+ no longer transferred from Si to graphite (Fig. S11†). After 1.4 h, Si no longer supplied Li+ outwards, instead the graphite transferred Li+ to Si (Fig. S10†). The Si with 10DLi+ exhibits an effect similar to pre-lithiation in Si/C composite anodes, supplying extra Li.41,42 During the storage, the gradient of cLi+ in graphite was proven unchanged, and only the cLi+ distribution in Si became more uniform (Fig. S12†).
Fig. 6h shows the I change with the storage time, and the improved 10Si anode exhibited a much lower I, especially in the first 5 h. In the traditional 10Si anode, I was 30.0 mA m−2 at 0.89 h; in contrast, 1.7 mA m−2 of I was shown in improved 10Si anodes. The Li+ movement in anodes went milder and this improvement lasted for the whole storage time (Fig. S10b†). The consumption of electrolytes was somewhat inhibited as well (Fig. 6i and S10c†). As for the side reaction, the ISEI of graphite and Si showed a little increase, and little changes were shown on the δSEI (Fig. 6j and k). Fig. 6l displays how the Si with improved DLi+ suppresses the self-discharge during storage. The Si enabled extra Li storage, compensating for the Li loss of AMs and inhibiting the electrolyte consumption. The degree of suppression depends on the amount of Li stored in the Si, and once the additional Li is completely consumed, the calendar aging pathway will revert to the conventional mode.
Inhibited calendar aging by kinetic enhancement
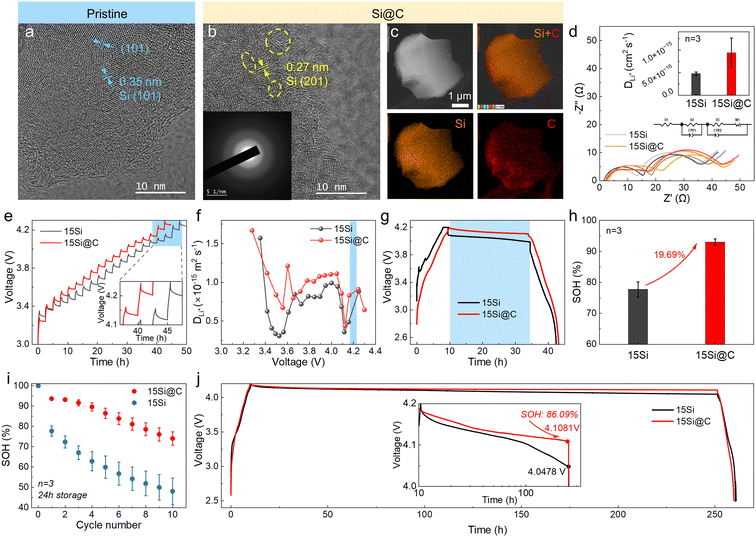
To improve the DLi+ of Si, nano-Si was deposited in porous carbon (marked as “Si@C”) by chemical vapor deposition (CVD). As shown in Fig. 7a, the pristine Si exhibits an ordered crystal structure. The TEM image of Si@C demonstrates ordered (201) Si embedded in a disordered carbon matrix, while the selected area electron diffraction (SAED) exhibits characteristics of long-range disorder (Fig. 7b). The elemental mapping shows that Si and C are uniformly distributed throughout the Si@C particles (Fig. 7c).The previous analysis demonstrated that higher Si content leads to more pronounced self-discharge. To test the improvement brought by this material, anodes with 15 wt% Si were fabricated (Fig. S13†). The electrochemical impedance spectroscopy (EIS) result of the fully charged battery showed a typical shape of 2 circles in the high- and middle-frequency ranges plus 1 line in the low-frequency range (Fig. 7d).43 The ohmic resistance (RΩ), SEI resistance (RSEI), and charge transfer resistance (Rct) were calculated using the equivalent circuit presented in Fig. 7d. The interfacial impedance was shown a little larger for cells with 15Si@C anodes (Table S2†), but the DLi+ at 4.2 V was calculated to be 2-fold higher than 15Si anodes (Note S1†).44Fig. 7e demonstrates the potential profiles using galvanostatic intermittent titration technique (GITT). The DLi+ at 4.2 V was 9 × 10⁻¹⁶ m2 s−1 for cells with 15Si@C anodes, and 7 × 10⁻¹⁶ m2 s−1 for 15Si anodes, reaffirming a higher DLi+ for 15Si@C anodes (Fig. 7f, S14, and Note S2†).45,46 The OCP of full cells with 15Si@C anodes was indeed larger than that for 15Si anodes during storage (Fig. 7g). After 24 h of storage, the SOH of cells with 15Si@C anodes was 93.0%, showing a 20% increase to cells with 15Si anodes (77.7%), as shown in Fig. 7h. Besides, a 10 times 24 h storage test was repeated, and the cells with 15Si@C anodes displayed much more stable capacity retention. After 10 times repeating, the SOH of cells with 15Si@C anodes maintained at 74.0%, while the traditional cells decayed to 48.1% (Fig. 7i). The advantages of the pre-lithiation effect still remained after 240 h of storage (with SOH of 86.1%) but were depleted after 300 h of storage (Fig. 7j and S15†).
Conclusions
In summary, a real-time kinetic process during calendar aging was revealed for cells with Si/C composite anodes. The unstable Si induced severe side reactions, causing a massive Li loss. Driven by the potential difference, the graphite was forced to supply Li+ to Si. As a result, graphite was affected by Si to perform more unstably during storage, with a fast Li loss and a thicker SEI film growth of 60 nm (vs. 40 nm for graphite anode) after 72 h of storage. Besides, the ion transfer and electrolyte consumption were aggravated by the Si addition. For cells with 10Si anodes, the max current density of self-discharge was 30.0 mA m−2, 3 times larger than that for graphite anodes, and the electrolyte concentration was decreased below 1000 mol m−3. An innovative method to suppress self-discharge was proposed by adjusting the aging pathway, i.e. converting the Li+ crosstalk between graphite and Si. The self-discharge was found to be inhibited by increasing the DLi+ of Si, which enabled a more sufficient Li storage to change the movement from “graphite to Si” to “Si to graphite”. The ion transfer in electrolyte was inhibited to 1.7 mA m−2, and the electrolyte concentration can maintain ∼1000 mol m−3. As a proof of concept, full cells with two kinds of Si-containing anodes were fabricated: the traditional Si and Si@C with nano-Si embedded in a carbon matrix. A 15 wt% of Si content was added in anodes, and the DLi+ was improved from 7 × 10⁻¹⁶ m2 s−1 to 9 × 10⁻¹⁶ m2 s−1 once cells were fully charged. After 24 h of storage, the SOH was increased from 74.1% to 93.1%. This work enhances the understanding of calendar aging mechanisms in Si/C composite anodes, aiding the development of cells with extended service life.Author contributions
Kai Sun: conceptualization, methodology, investigation, writing – original draft preparation; Xueyan Li: investigation, methodology; Kang Fu: investigation; Zhuojun Zhang: visualization; Anmin Wang: methodology; Xingmin He: investigation; Lili Gong: conceptualization, investigation; methodology; Peng Tan: conceptualization, writing – review & editing, supervision, project administration, funding acquisition.Data availability
All relevant data are included in this article and the ESI.†Conflicts of interest
There are no conflicts to declare.Acknowledgements
We acknowledge the funding support from National Key R&D Program of China (2023YFB2408100), and Anhui Provincial Natural Science Foundation of China (2308085QG231). This work was partially carried out at the Instruments Center for Physical Science, University of Science and Technology of China.References
- C.-Y. Wang, T. Liu, X.-G. Yang, S. Ge, N. V. Stanley, E. S. Rountree, Y. Leng and B. D. McCarthy, Nature, 2022, 611, 485–490 Search PubMed.
- CATL, 2022, https://www.catl.com/news/6467.html.
- J. Xie and Y.-C. Lu, Nat. Commun., 2020, 11, 2499 CrossRef CAS PubMed.
- C. P. Grey and D. S. Hall, Nat. Commun., 2020, 11, 6279 Search PubMed.
- H. L. Andersen, L. Djuandhi, U. Mittal and N. Sharma, Adv. Energy Mater., 2021, 11, 2102693 Search PubMed.
- Y. Gao, Z. Pan, J. Sun, Z. Liu and J. Wang, Nano-Micro Lett., 2022, 14, 94 CrossRef CAS PubMed.
- K. Sun, X. Xiao, W. Shang, K. Fu, X. Li, Z. Zhang, L. Gong and P. Tan, Small, 2024, 2405674 Search PubMed.
- X. Su, Q. Wu, J. Li, X. Xiao, A. Lott, W. Lu, B. W. Sheldon and J. Wu, Adv. Energy Mater., 2014, 4, 1300882 Search PubMed.
- W. Dou, M. Zheng, W. Zhang, T. Liu, F. Wang, G. Wan, Y. Liu and X. Tao, Adv. Funct. Mater., 2023, 33, 2305161 Search PubMed.
- M. Bai, X. Tang, M. Zhang, H. Wang, Z. Wang, A. Shao and Y. Ma, Nat. Commun., 2024, 15, 1–13 Search PubMed.
- M. T. McDowell, S. W. Lee, J. T. Harris, B. A. Korgel, C. Wang, W. D. Nix and Y. Cui, Nano Lett., 2013, 13, 758–764 Search PubMed.
- S. W. Lee, M. T. McDowell, J. W. Choi and Y. Cui, Nano Lett., 2011, 11, 3034–3039 Search PubMed.
- F. Luo, B. Liu, J. Zheng, G. Chu, K. Zhong, H. Li, X. Huang and L. Chen, J. Electrochem. Soc., 2015, 162, A2509–A2528 CrossRef CAS.
- S. Chae, S. Choi, N. Kim, J. Sung and J. Cho, Angew. Chem., Int. Ed., 2020, 59, 110–135 CrossRef CAS PubMed.
- L. Sun, Y. Liu, L. Wang and Z. Jin, Adv. Funct. Mater., 2024, 34, 2403032 CrossRef CAS.
- J. Sung, N. Kim, J. Ma, J. H. Lee, S. H. Joo, T. Lee, S. Chae, M. Yoon, Y. Lee, J. Hwang, S. K. Kwak and J. Cho, Nat. Energy, 2021, 6, 1164–1175 CrossRef.
- X. Zhang, D. Wang, X. Qiu, Y. Ma, D. Kong, K. Müllen, X. Li and L. Zhi, Nat. Commun., 2020, 11, 3826 Search PubMed.
- K. Ge, Z. Wang, J. Liu, Y. Mu, R. Wang, X. Xu, Y. Wang, Z. Zou, Q. Zhang, M. Han and L. Zeng, Adv. Funct. Mater., 2024, 2414384 Search PubMed.
- C. Sun, H. Zhang, P. Mu, G. Wang, C. Luo, X. Zhang, C. Gao, X. Zhou and G. Cui, ACS Nano, 2024, 18, 2475–2484 CrossRef CAS PubMed.
- H. Cheng, Z. Ma, P. Kumar, H. Liang, Z. Cao, H. Xie, L. Cavallo, H. Kim, Q. Li, Y. Sun and J. Ming, Adv. Energy Mater., 2024, 14, 2304321 CrossRef CAS.
- H. Jia, X. Li, J. Song, X. Zhang, L. Luo, Y. He, B. Li, Y. Cai, S. Hu, X. Xiao, C. Wang, K. M. Rosso, R. Yi, R. Patel and J.-G. Zhang, Nat. Commun., 2020, 11, 1474 CrossRef CAS PubMed.
- J. D. McBrayer, M.-T. F. Rodrigues, M. C. Schulze, D. P. Abraham, C. A. Apblett, I. Bloom, G. M. Carroll, A. M. Colclasure, C. Fang, K. L. Harrison, G. Liu, S. D. Minteer, N. R. Neale, G. M. Veith, C. S. Johnson, J. T. Vaughey, A. K. Burrell and B. Cunningham, Nat. Energy, 2021, 6, 866–872 CrossRef CAS.
- N. Kim, Y. Kim, J. Sung and J. Cho, Nat. Energy, 2023, 8, 921–933 CrossRef CAS.
- I. Zilberman, J. Sturm and A. Jossen, J. Power Sources, 2019, 425, 217–226 CrossRef CAS.
- K. Bischof, M. Flügel, M. Hölzle, M. Wohlfahrt-Mehrens and T. Waldmann, J. Electrochem. Soc., 2024, 171, 010510 CrossRef CAS.
- W. Lu, L. Zhang, Y. Qin and A. Jansen, J. Electrochem. Soc., 2018, 165, A2179–A2183 CrossRef CAS.
- K. Kalaga, M.-T. F. Rodrigues, S. E. Trask, I. A. Shkrob and D. P. Abraham, Electrochim. Acta, 2018, 280, 221–228 CrossRef CAS.
- Y. Yin, E. Arca, L. Wang, G. Yang, M. Schnabel, L. Cao, C. Xiao, H. Zhou, P. Liu, J. Nanda, G. Teeter, B. Eichhorn, K. Xu, A. Burrell and C. Ban, ACS Appl. Mater. Interfaces, 2020, 12, 26593–26600 CrossRef CAS PubMed.
- T. Gao, Y. Han, D. Fraggedakis, S. Das, T. Zhou, C.-N. Yeh, S. Xu, W. C. Chueh, J. Li and M. Z. Bazant, Joule, 2021, 5, 393–414 CrossRef CAS.
- X. Lu, M. Lagnoni, A. Bertei, S. Das, R. E. Owen, Q. Li, K. O'Regan, A. Wade, D. P. Finegan, E. Kendrick, M. Z. Bazant, D. J. L. Brett and P. R. Shearing, Nat. Commun., 2023, 14, 5127 CrossRef CAS.
- K. Sun, Z. Zhang, F. Kang, L. Xueyan, X. Xu, Y. Jianwen, G. Lili and T. Peng, Nano Lett., 2025 DOI:10.1021/acs.nanolett.4c03530.
- J. Huang, H. Zhang, X. Yuan, Y. Sha, J. Li, T. Dong, Y. Song and S. Zhang, Chem. Eng. J., 2023, 464, 142578 CrossRef CAS.
- K. Fu, X. Li, K. Sun, Z. Zhang, H. Yang, L. Gong, G. Qin, D. Hu, T. Li and P. Tan, Adv. Funct. Mater., 2024, 2409623 Search PubMed.
- X. Gao, S. Li, J. Xue, D. Hu and J. Xu, Adv. Energy Mater., 2023, 13, 2202584 Search PubMed.
- X. Duan, D. Hu, W. Chen, J. Li, L. Wang, S. Sun and J. Xu, Adv. Energy Mater., 2024, 14, 2400710 CrossRef CAS.
- J. Moon, H. C. Lee, H. Jung, S. Wakita, S. Cho, J. Yoon, J. Lee, A. Ueda, B. Choi, S. Lee, K. Ito, Y. Kubo, A. C. Lim, J. G. Seo, J. Yoo, S. Lee, Y. Ham, W. Baek, Y.-G. Ryu and I. T. Han, Nat. Commun., 2021, 12, 2714 CrossRef CAS PubMed.
- K. Sun, X. Li, Z. Zhang, K. Fu, X. Xiao, L. Gong and P. Tan, Energy Storage Mater., 2024, 66, 103216 Search PubMed.
- W. Huang, J. Li, K. Wei and L. Wang, J. Alloys Compd., 2024, 990, 174416 Search PubMed.
- L. C. Merrill, D. M. Long, K. A. Small, K. L. Jungjohann, K. Leung, K. L. Bassett and K. L. Harrison, J. Phys. Chem. C, 2022, 126, 17490–17501 Search PubMed.
- Z. Chen, Y. Qin, K. Amine and Y.-K. Sun, J. Mater. Chem., 2010, 20, 7606 RSC.
- C. Yang, H. Ma, R. Yuan, K. Wang, K. Liu, Y. Long, F. Xu, L. Li, H. Zhang, Y. Zhang, X. Li and H. Wu, Nat. Energy, 2023, 8, 703–713 CrossRef CAS.
- S.-Y. Ham, E. Sebti, A. Cronk, T. Pennebaker, G. Deysher, Y.-T. Chen, J. A. S. Oh, J. B. Lee, M. S. Song, P. Ridley, D. H. S. Tan, R. J. Clément, J. Jang and Y. S. Meng, Nat. Commun., 2024, 15, 2991 CrossRef CAS PubMed.
- S. Wang, J. Zhang, O. Gharbi, V. Vivier, M. Gao and M. E. Orazem, Nat. Rev. Methods Primmers, 2021, 1, 41 CrossRef CAS.
- E. Hüger, D. Uxa and H. Schmidt, J. Phys. Chem. C, 2024, 128, 7408–7423 CrossRef.
- A. Nickol, T. Schied, C. Heubner, M. Schneider, A. Michaelis, M. Bobeth and G. Cuniberti, J. Electrochem. Soc., 2020, 167, 090546 CrossRef CAS.
- T. Schied, A. Nickol, C. Heubner, M. Schneider, A. Michaelis, M. Bobeth and G. Cuniberti, ChemPhysChem, 2021, 22, 885–893 CrossRef CAS PubMed.
Footnote |
| † Electronic supplementary information (ESI) available. See DOI: https://doi.org/10.1039/d4eb00040d |
| This journal is © The Royal Society of Chemistry 2025 |

