DOI:
10.1039/D5EL00008D
(Paper)
EES Sol., 2025,
1, 267-278
Thermodynamic properties, defect equilibria, and water splitting behavior of Ga- doped LSM perovskite†
Received
21st January 2025
, Accepted 21st April 2025
First published on 22nd April 2025
Abstract
Solar thermochemical hydrogen (STCH) production via thermochemical redox cycling of metal oxides is a promising pathway for production of green hydrogen. Understanding the intrinsic thermodynamic properties of metal oxide candidates employed in these cycles is vital for better understanding process technoeconomics and reactor design. Herein, for the candidate Ga- doped La–Sr–Mn perovskite water splitting oxide (La0.6Sr0.4)0.95Mn0.8Ga0.2O3−δ (LSMG6482), we present a detailed characterization of the partial molar thermodynamic properties, defect equilibria, and water splitting behavior. Measurements of equilibrium oxygen non-stoichiometry (δ) were obtained from thermogravimetric relaxation experiments to describe the equilibrium behavior of LSMG6482 (and CeO2−δ as a reference) in a pO2 range of 10−6.84 atm ≤ pO2 ≤ 10−2.94 atm and a temperature range of 1200 °C ≤ T ≤ 1400 °C. From this data, the partial molar changes of enthalpy and entropy (Δ![[h with combining macron]](https://www.rsc.org/images/entities/i_char_0068_0304.gif) o and Δ
o and Δ![[s with combining macron]](https://www.rsc.org/images/entities/i_char_0073_0304.gif) o), were extracted by fitting the experimental data to an oxygen defect model, and through Van't Hoff analysis were compared to prior published Al- doped La–Sr–Mn perovskites. It was found that the magnitude of Δo and Δo was greater than those of Al- doped LSM perovskites at δ ≥ 0.1, with Δo(δ = 0.1) = 286 kJ mol−1 and Δo(δ = 0.1) = 132 J mol−1 K−1. An Ellingham diagram and water splitting model was developed using Δo and Δo to observe trends in H2 yield and steam conversion to identify suitable operating conditions for LSMG6482 and contrasted with the state-of-the-art CeO2−δ. Overall, it was found that LSMG6482 is most suitable for cycling under smaller temperature swings than ceria and is suitable for lower reduction temperature operation (∼1300 °C vs. ∼1500 °C), but at the expense of low steam conversion to H2.
o), were extracted by fitting the experimental data to an oxygen defect model, and through Van't Hoff analysis were compared to prior published Al- doped La–Sr–Mn perovskites. It was found that the magnitude of Δo and Δo was greater than those of Al- doped LSM perovskites at δ ≥ 0.1, with Δo(δ = 0.1) = 286 kJ mol−1 and Δo(δ = 0.1) = 132 J mol−1 K−1. An Ellingham diagram and water splitting model was developed using Δo and Δo to observe trends in H2 yield and steam conversion to identify suitable operating conditions for LSMG6482 and contrasted with the state-of-the-art CeO2−δ. Overall, it was found that LSMG6482 is most suitable for cycling under smaller temperature swings than ceria and is suitable for lower reduction temperature operation (∼1300 °C vs. ∼1500 °C), but at the expense of low steam conversion to H2.
Broader context
As solar penetration in the power sector increases, long- and short-term storage strategies become an increasingly important complement. H2 has been identified as a potentially cost-effective solution with high energy density and is important not only as a potential seasonal and short-term storage strategy, but also as a renewable energy vector that can enable sustainable liquid fuels. The DOE has a target cost of green H2 of $ kg−1 by 2030, but there are still several technological barriers preventing this from being realized. In the short term, electrolysis offers the most practical path to economical green H2 due to its technological maturity, but there are several competing technologies with lower TRL that can enable cheaper H2. Solar thermochemical H2 production, which this paper is concerned with, utilizes solar heat and a potentially higher overall efficiency because of its ability to utilize the entire solar spectrum. But current limitations exist surrounding the redox active materials that enable this technology. There is a push to decrease operating temperatures below 1400 °C like the herein utilized LSMG perovskite is capable. But to integrate this into real systems, better understanding of the thermodynamic properties needs to be realized, which this paper aims to accomplish.
|
Introduction
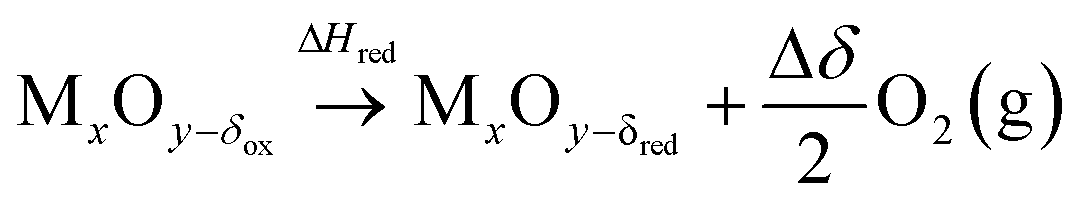
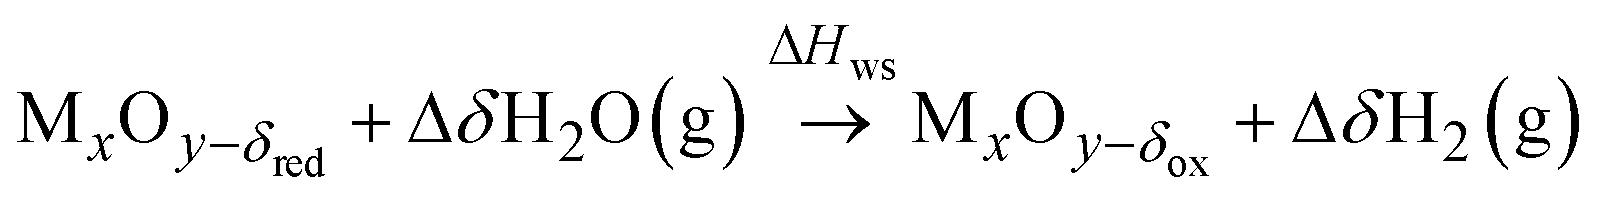
Thermochemical redox cycling has been shown to be a promising method for the conversion of solar energy, water and carbon dioxide into fungible, drop in renewable fuels or green hydrogen.1 Specifically for green hydrogen production, the dissociation of water at temperatures accessible through concentrating solar energy can be achieved through two-step thermochemical redox cycling of metal oxides described by the reactions shown in eqn (1) and eqn (2), for a non-stoichiometric, generic metal oxide MxOy−δ.| |  | (1) |
| |  | (2) |
The first step (eqn. (1)) utilizes concentrated solar energy to provide high quality heat to drive an endothermic reduction reaction in which O2 (g) evolves from the metal oxide, leaving it in a state of oxygen deficiency, with oxygen non-stoichiometry of δred. The amount of oxygen released (Δδ/2) is dependent on the initial oxygen non-stoichiometry prior to reduction, δi. In the second step (eqn. (2)), steam is reacted with the reduced metal oxide, resulting gaseous H2 in the amount δred − δox, or Δδ, an exothermic process. Oxidation can also be initiated using CO2 or co-fed H2O and CO2 to produce H2 and CO, or syngas, the building blocks for synthetic hydrocarbon fuels.2 Typically, reduction is performed at high temperatures (Tred ≥ 1773 K) in a sweep gas of low oxygen potential. The oxidation reaction is usually performed at lower temperatures (Tox ≤ 1273 K), where oxidation is more thermodynamically favorable.3 Alternatively, the oxidation reaction can be performed at higher temperatures, approaching Tox ≈ Tred (so called isothermal operation) to limit the required sensible heating input of the oxide between reactions, though this requires excess steam to drive the reaction.4–6
Ceria (CeO2−δ) is typically regarded as the state-of-the-art metal oxide for solar thermochemical hydrogen (STCH) production due to its stability at high temperatures, favorable oxidation thermodynamics, and fast kinetics.1,3 These attributes have resulted in solar to fuel efficiencies as high as 5.25% by Marxer et al. using a 4 kW reactor performing CO2 splitting cycles and 5.60% by Zoller et al. using a 50 kW reactor.7,8 The solar to fuel efficiency, however, is limited largely by the small reduction extent (∼0.1) that can be achieved using ceria without surpassing 1500 °C, beyond which optical efficiencies suffer and experimental complexity increases due to oxide and reactor instabilities.9 The magnitude of δred and δox at a given temperature and oxygen partial pressure (pO2) are dictated by the partial molar enthalpy (Δo) and entropy (Δo) and of the metal oxide during oxygen exchange.10–12 The small reduction extent of ceria is due to its high Δo (∼430 kJ mol−1).13,14 On the other hand, ceria has a large Δo (∼200 J mol−1 K−1) which is desirable because it limits the difference required between Tred and Tox (ΔT).10
Techno-economic studies have shown that it is imperative to improve the solar to fuel efficiency beyond that achievable with ceria.15 Perovskite metal oxides (ABO3−δ) have been identified as a class of materials highly attractive to STCH processes due to the tunability of their partial molar thermodynamic properties through doping strategies.16–18 The LaMnO3−δ in particular has proven to be a promising base metal oxide for doping and tuning water splitting behavior.19 Sr doping on the A-site of LaMnO3−δ (LSM) was shown by Scheffe et al. to promote favorability toward reduction, reaching reduction extents up to 6.5× that of ceria at 1600 K using La0.6Sr0.4MnO3−δ, or LSM40.16 Other additional A- and B- site doping schemes have been investigated including the Al-doped (LSMA) and Ca–Al doped (LCMA) systems which each showed an improvement in water splitting performance over the base LSM system.17,20 Takacs et al. and Ezbiri et al. characterized the partial molar thermodynamic properties of these materials under different doping concentrations through a combination of thermogravimetry and oxygen defect modeling.11,12 Overall, the doped LaMnO3−δ perovskites have small ![[capital Delta, Greek, macron]](https://www.rsc.org/images/entities/char_e135.gif) (∼275 kJ mol−1) as well as low Δo (∼125 J mol−1 K−1) relative to ceria. More recent advancements in perovskite material design beyond the LaMnO3−δ system has resulted in the high-entropy perovskite oxide (La1/6Pr1/6Nd1/6Gd1/6Sr1/6Ba1/6)MnO3−δ or LPNGSB_Mn with Δo and Δo ranging from 252.51–296.32 kJ mol−1 and 126.95–168.85 J mol−1 K−1, respectively, in a δ range of 0.0025–0.04 from Liu et al.21 Qian et al. identified and characterized the perovskite CaTi0.5Mn0.5O3−δ (CTM55) with Δo and Δo ranging from 213.54–284.41 kJ mol−1 and 118.79–251.68 J mol−1 K−1, respectively, in a δ range of 0.007–0.023.22 Promising perovskites Ca2/3Ce1/3Ti1/3Mn2/3O3−δ, or CCTM2112, and BaCe0.25Mn0.75O3−δ, or BCM, show excellent water splitting performance under STCH conditions but have yet to be thermodynamically characterized in terms of Δo and Δo.18,23 While most perovskites investigated in literature have shown a propensity for water splitting at conditions relevant to STCH, and importantly at lower temperature than ceria, they generally suffer in terms of steam conversion and solid phase heating requirements.
(∼275 kJ mol−1) as well as low Δo (∼125 J mol−1 K−1) relative to ceria. More recent advancements in perovskite material design beyond the LaMnO3−δ system has resulted in the high-entropy perovskite oxide (La1/6Pr1/6Nd1/6Gd1/6Sr1/6Ba1/6)MnO3−δ or LPNGSB_Mn with Δo and Δo ranging from 252.51–296.32 kJ mol−1 and 126.95–168.85 J mol−1 K−1, respectively, in a δ range of 0.0025–0.04 from Liu et al.21 Qian et al. identified and characterized the perovskite CaTi0.5Mn0.5O3−δ (CTM55) with Δo and Δo ranging from 213.54–284.41 kJ mol−1 and 118.79–251.68 J mol−1 K−1, respectively, in a δ range of 0.007–0.023.22 Promising perovskites Ca2/3Ce1/3Ti1/3Mn2/3O3−δ, or CCTM2112, and BaCe0.25Mn0.75O3−δ, or BCM, show excellent water splitting performance under STCH conditions but have yet to be thermodynamically characterized in terms of Δo and Δo.18,23 While most perovskites investigated in literature have shown a propensity for water splitting at conditions relevant to STCH, and importantly at lower temperature than ceria, they generally suffer in terms of steam conversion and solid phase heating requirements.
(La0.6Sr0.4)0.95Mn0.8Ga0.2O3−δ, or LSMG6482, was investigated experimentally under a variety of water splitting conditions in our prior work, demonstrating promising H2 yields of Ga-doped LSM perovskites equal to or exceeding those of the Al- doped LSM perovskites at conditions relevant to STCH. This was motivated by computational work from Wang et al. that concluded B-site doping with Ga on the LaMnO3 system results in an oxygen vacancy formation energy conducive to lower temperature water splitting.19 In addition, Ga-doping has been shown to stabilize the surface chemical composition compared to undoped, by preventing Sr segregation to the surface and stabilizing catalytically active surface defects that promote the binding of adsorbed hydroxides.24 In our prior work, Δo and Δo were reported based on thermogravimetric data only at high pO2 (10−3.94 ≤ pO2 (atm) ≤ 10−2.94) and were found to range from 201.84–286.89 kJ mol−1 and 108.60–157.58 J mol−1 K−1. In this work, we expand the thermodynamic characterization of LSMG6482 to cover a broader range of conditions, especially closer to those expected during STCH oxidation (pO2 between ∼10−4 to 10−7 atm at T ≥ 1200 °C) by using controlled mixing of CO and CO2, which offers access lower pO2, and using ceria as a reference. Results are coupled with an oxygen defect model which provides insight toward possible oxygen defect mechanisms and serves as an interpolation method for Van't Hoff extraction of thermodynamic properties. A thermodynamic model for water splitting redox cycling using LSMG6482 is developed using Gibb's free energy relationships. Estimations of H2 yield and H2O conversion are presented and normalized to ceria to map appropriate and advantageous cycling conditions for LSMG6482. This work provides an expansive model of thermodynamic properties for LSMG6482, an estimation of defect mechanisms, and a map of performance metrics as functions of STCH related cycling conditions to inform future modeling and on-sun applications of the material.
Methodology
Material synthesis
(La0.6Sr0.4)0.95(Mn0.8Ga0.2)O3−δ (LSMG6482) was synthesized via solid-state method starting with powders of La2O3 (99.99%, Cerac), SrCO3 (>99.9%, Sigma-Aldrich), MnO2 (99.99, Acros Organics), and Ga2O3 (99.999%, Alfa Aesar). La2O3 was heated to 900 °C for 1 h prior to synthesis to ensure decomposition of lanthanum hydroxide. All other precursors were dried overnight at 120 °C prior to use. Stoichiometric amounts of precursors were mixed using a unitary ball mill with yttria stabilized zirconia media for 20 h. Water was used as the solvent and 1 wt% Duramax D-3005 was added as dispersant. After mixing, the mixture was dried at 120 °C, and the powders were calcined at 1200 °C for 4 h. The resulting powders were then ground using a mortar and pestle and further annealed at 1450 °C for 6 h.
X-ray diffraction
X-ray diffraction (XRD) was collected from the powders before and after cycling experiments using the conventional Bragg–Brentano θ − 2θ diffractometer configuration (Panalytical X'Pert Powder). The powders were ground using a mortar and pestle and sieved prior to characterization to ensure leveled samples. Characterization was performed using a Cu X-ray source with a voltage of 45 kV, step size of 0.016°, dwell time of 15 s, current of 40 mA, and 2θ value from 5° to 70°.
Thermogravimetric analysis
Isothermal relaxation experiments to extract oxidation state as a function of temperature and oxygen partial pressure (pO2) were conducted in a vertically oriented thermogravimetric analyzer (TGA, Netzsch STA 449 F3). During each experiment, a 98.2 mg powdered LSMG6482 or CeO2 (Alfa Asar, ≤ 5 micron) sample was heated in a 4.4% CO2/Ar mixture where temperature was increased at a rate of 20 °C min−1 from room temperature to a set temperature between 1250 °C ≤ T ≤ 1400 °C. Stepwise changes in pO2 between 10−6.84 atm ≤ pO2 ≤ 10−3.98 atm were then implemented by controlling the ratio of CO2/CO. The full range of CO2/CO and the corresponding pO2 used is tabulated in Table ESI 1.†pO2 values were calculated using the Cantera suite in Python, and each pO2 was maintained until the sample mass reached (or closely approached) a steady value.25pO2 set points using CO2/CO mixing were also validated using ceria and comparing to well-known thermodynamic equilibrium properties from Panlener et al..13 A ‘blank run’ with an equivalent amount of alumina powder was also conducted at each temperature to correct for buoyancy effects. The total inlet flow rate was set to 170 sccm for the duration of each experiment.
Using the change in mass (Δm) measured by the TGA, δ was calculated using eqn (3), where mi is the initial sample mass, Ms is the molar mass of the sample, and MO is the molar mass of monatomic oxygen.
| |  | (3) |
Since the sample was not fully oxidized at the end of each experiment, Δm was referenced to a known state (pO2 and temperature) determined from a separate experiment in which the sample was fully oxidized during the final step in 70% O2 at 1000 °C. The pO2 and temperature during all experiments using this method are shown in figure ESI 1.†
Oxygen defect modeling
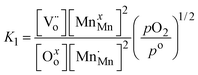
Reduction of Sr-doped LaMnO3−δ, or  , in Kroger Vink notation, can be described by eqn (4), as demonstrated by other studies.11,12
| |  | (4) |
Eqn (4) describes tetravalent manganese on manganese lattice sites  and oxygen atoms on oxygen lattice sites (Oxo) in equilibrium with trivalent manganese on manganese lattice sites (MnxMn), doubly ionized oxygen vacancies
  , and gaseous oxygen. The development of the oxygen defect model is described in detail by Takacs et al.12 In short, the equilibrium constant of eqn (4) is described by eqn (5). Further, disproportionation of trivalent manganese into tetravalent and divalent manganese
  can be combined with eqn (4) to write the disproportionation reaction as seen in eqn (6). The equilibrium constant for the disproportionation reaction is shown in eqn (7).
| |  | (5) |
| |  | (6) |
| | 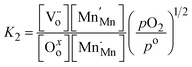 | (7) |
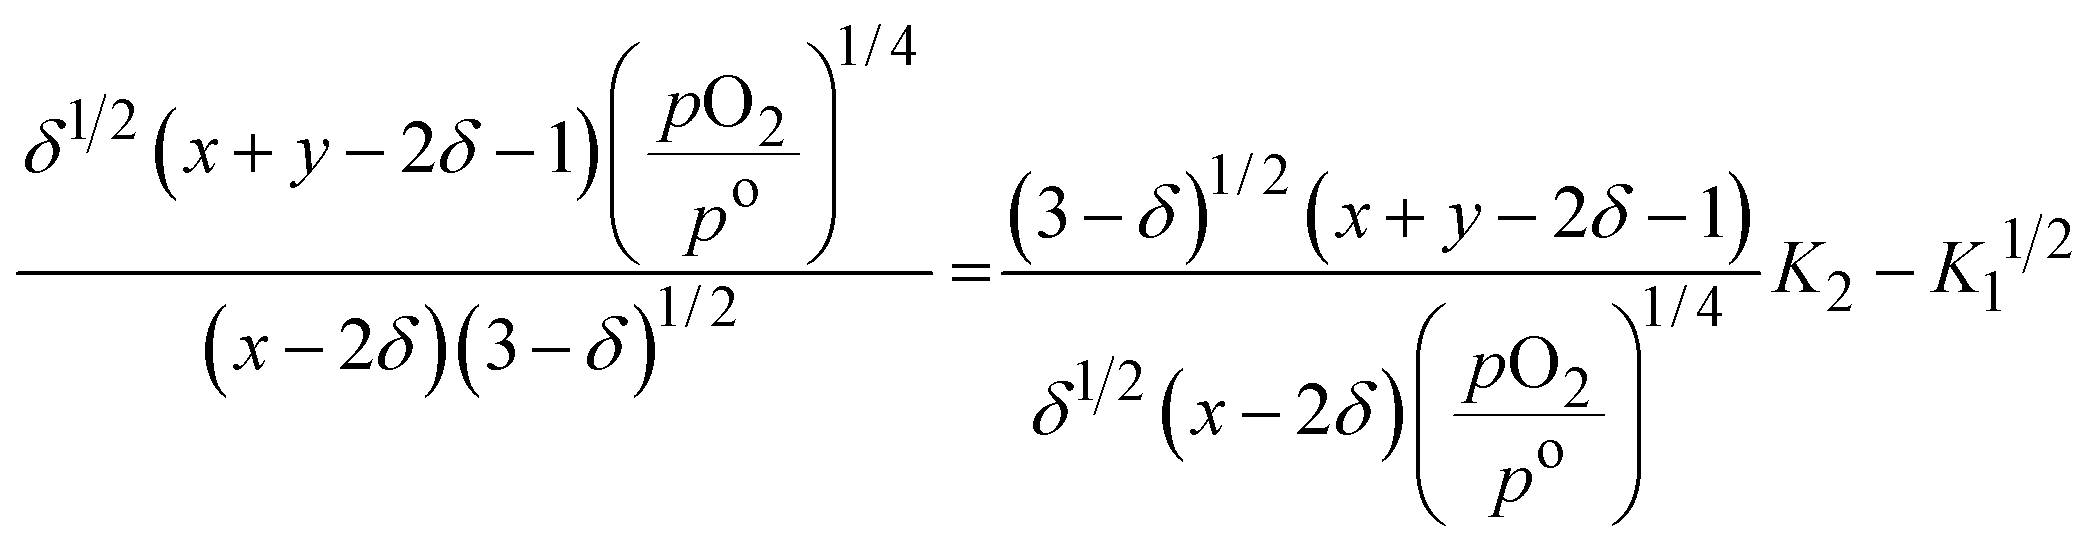
K
1 and K2 can be combined and written in terms of δ, pO2, and doping concentration of the A-site dopant (x) and the B-site dopant (y) shown in eqn (8), derived through manganese and oxygen site balances and maintaining charge neutrality.11
| |  | (8) |
It is assumed here, and has been shown previously for similar materials, that there exists an Arrhenius dependence of K1 and K2 on temperature. Thus, to facilitate global fitting of the data set, K1 and K2 are substituted with the functions described in eqn (9) and eqn (10).
| |  | (9) |
| |  | (10) |
It is clear by inspection of eqn (11) that fitting parameters mi and bi (where i = 1, 2) are proportional to the partial molar enthalpy and partial molar entropy change for single defect reactions (Δhoi and Δsoi) for each defect reaction.
| | | −RTln(Ki) = Δhoi − TΔsoi (i=1,2) | (11) |
A-site and B-site doping concentrations, x and y respectively, were also allowed an extra degree of freedom in the fitting procedure to account for any unknown volatilization or migration of each doping species away from the bulk of the material.24 In total, 6 parameters (m1, b1, m2, b2, x, y) were varied to minimize the sum of square errors (SSE) between the model and measured data using a bounded minimization MATLAB program. Convergence to a global minimum was verified by repeated, random initial guesses.
Determination of thermodynamic properties
Results from the above oxygen defect equilibria provide a means of interpolating experimentally gathered equilibrium data, which is necessary for extracting Δo and Δo as a function of δ via Van't Hoff analysis. The reduction reaction for an infinitesimally small change in δ in LSMG6482 can be written as below, here represented as a generic perovskite ABO3−δ.12| | 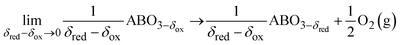 | (12) |
It can be shown that, assuming equal activity of solid products and reactants, the partial molar change in Gibb's free energy for eqn (12) at equilibrium can be described by eqn (13) through eqn (15) where Kred is the equilibrium constant for eqn (12), R is the universal gas constant, and δred is the equilibrium δ following the reduction reaction.26
| | | Δrgred = Δrgored + RTln(Kred) = 0 | (13) |
| | | Δrgored(T,pO2)=−RTredln(Kred) = −RTredln(pO1/22,red) | (14) |
| | | Δrgored(T,δ) = Δo(δred) − TredΔo(δred) | (15) |
Eqn (14) and (15) can be combined and rearranged such that there is a linear relationship between inverse absolute temperature and ln(pO1/22,red), as shown in eqn (16).
| |  | (16) |
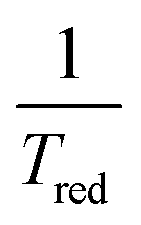
It is clear by inspection, that when plotting ln(pO1/22,red) vs. for a given equilibrium δred, the Δo(δred) is proportional to the slope of the line by −R, the universal gas constant, while Δo(δred) is proportional to the y-intercept by R. This procedure was employed to extract the partial molar thermodynamic properties of LSMG6482 as a function of δ.
Water splitting activity equilibrium modeling
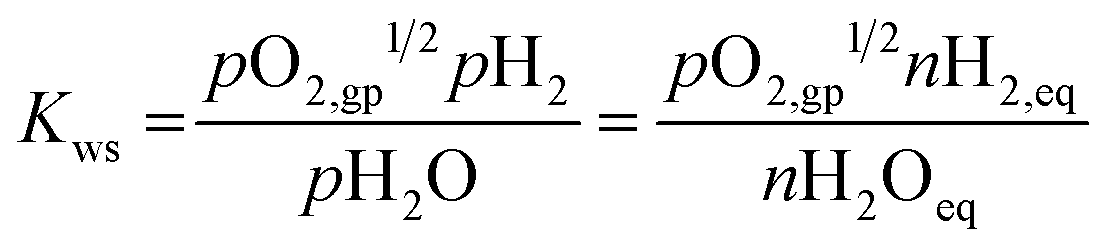
Water splitting activity, specifically H2 yield and H2O conversion under a variety of oxidation conditions, was investigated at a reduction pO2 (pO2,red) of 10−5 atm and reduction temperatures (Tred) ranging from Tred = 1573 K to Tred = 1773 K. To develop the water splitting model, the water thermolysis equilibrium constant (Kws), shown in eqn (17), was utilized to obtain a relationship for equilibrium pO2 in the gas phase.| |  | (17) |
Here, nH2,eq and nH2Oeq are the moles of H2 and H2O in the gas mixture at equilibrium and pO2,gp is the resulting oxygen partial pressure of the gas phase during oxidation. nH2,eq and nH2Oeq are defined in eqn (18) and (19), respectively, where nH2,eq is defined for 1 mole of metal oxide, nH2Oi is the molar amount of input steam, and δox is the equilibrium δ following the oxidation reaction. Further, the conversion, or α, of input steam to hydrogen is defined in eqn (20).| | | nH2Oeq = nH2Oi − nH2,eq | (19) |
| |  | (20) |
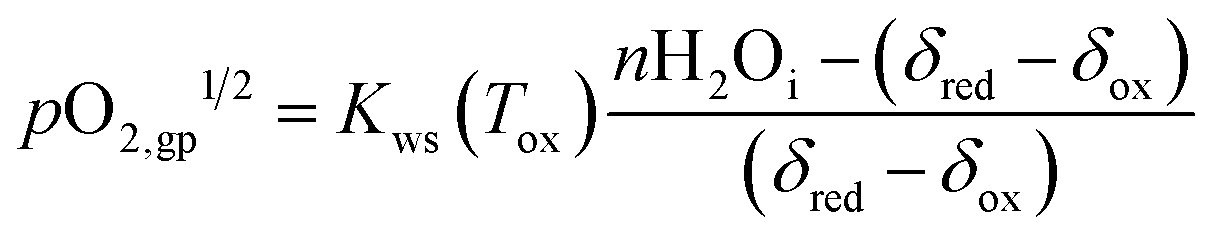
Eqn (17) can be rearranged and combined with eqn (18) and (19) to obtain a relationship for pO2,gp in terms of oxidation temperature (Tox), input steam, δred, and δox, shown in eqn (21).
| |  | (21) |
Eqn (21) can be combined with eqn (14) by equating pO2,red with pO2,gp and defining the temperature at Tox to obtain the partial molar Gibb's free energy change of the oxidation of the metal oxide when considering the equilibrium constant for the reverse reaction. This can further be equated to eqn (15), taken at Tox and δox, for the reverse reaction to allow computation of all variables.
Overall, two objective equations were defined to allow probing of water splitting behavior of LSMG6482 and CeO2. The first, shown in eqn (22), was used to determine δred under a given, pO2,red and Tred. δred was then passed to the second equation, shown in eqn (23), which was solved to find δox for a given input amount of steam, nH2Oi and oxidation temperature, Tox. Tox was varied from 400 K to Tred to show trends between two extreme ranges of operation: large temperature swings and isothermal cycling.
| | | Δo(δred) − Tred Δo(δred) + RTred ln(pO2,red½) = 0 | (22) |
| |  | (23) |
Results and discussion
Equilibrium mapping
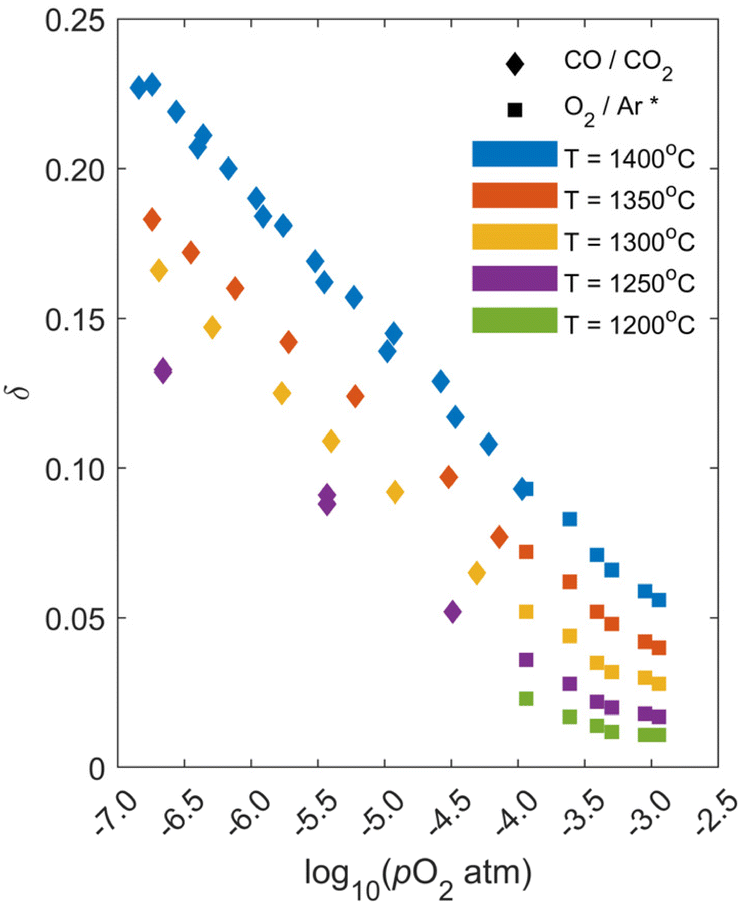
An exemplary thermogravimetric response to changing pO2 under a constant temperature of T = 1400 °C is shown in Fig. 1 for LSMG6482. The top plot shows the controlled conditions in the TGA while the bottom plot shows the mass response of the LSMG6482 powder. Reduction was initiated at ∼1000 °C indicated by a decrease in mass in response to oxygen evolving from the solid. Once the isothermal temperature was reached, gas flowrates were changed such that the first target pO2 was set and the initial reduction was allowed sufficient time to equilibrate, indicated by a plateau in the mass response. At 308 minutes, the CO/CO2 flowrates corresponding to the lowest pO2 were set and the material was again given sufficient time to equilibrate. Following this largest reduction, the atmosphere was changed stepwise to increase pO2, which was followed each time by an increase in mass as oxygen was reincorporated into the solid. At the end of the final oxidation, the material was cooled back to room temperature at a rate of 20 °C min−1 in the 4.4% CO2/Ar mixture. This was repeated for temperatures ranging from 1250 °C to 1400 °C. A summary of all equilibrium δ as a function of temperature and pO2 measurements are shown in Fig. 2 as diamonds, along with higher pressure data obtained through trace oxygen mixing (10−3.94 atm ≤ pO2 ≤ 10−2.94 atm) from prior work, shown as squares McCord et al.27pO2 set points using CO2/CO mixing are validated and compared to well-known ceria thermodynamic equilibrium properties from Panlener et al.13 and results are summarized in Fig. 2 and Table ESI 2.† They indicate < 5% difference, giving confidence in the pO2 setpoints.
 |
| | Fig. 1 Thermogravimetric results for LSMG6482 at T = 1400 °C. Input conditions are shown on the top plot while mass response is shown on the bottom plot. | |
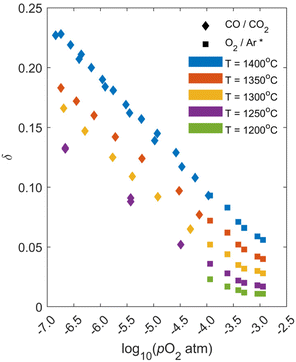 |
| | Fig. 2 Measured equilibrium δ from thermogravimetric experiments for LSMG6482 as a function of temperature and pO2. Diamond markers are from this study, while square markers (marked * in legend) are from McCord et al. | |
Material characterization
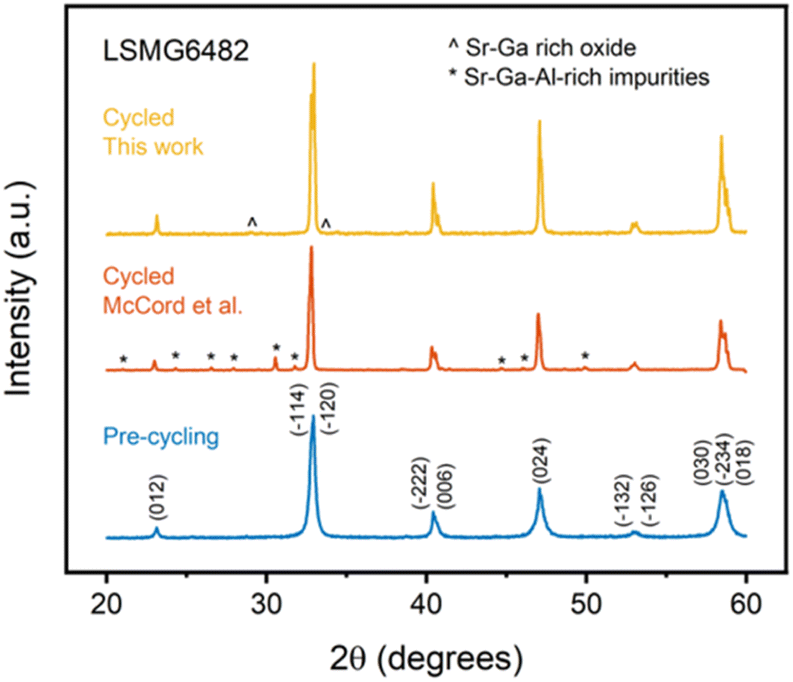
XRD patterns of LSMG powders before and after all relaxation experiments cycling are shown in Fig. 3. The pre-cycled powder crystallizes in the anticipated R![[3 with combining macron]](https://www.rsc.org/images/entities/char_0033_0304.gif) c space group with no evidence of secondary phases. After cycling, evidence of a secondary phase is observed at ∼29° and ∼34°. Prior work showed cycling of LSMG at higher pressures led to a different secondary phase as a result of interaction with the alumina crucible, with the main peak identified at ∼30.5°.27 The powder cycled in this experiment showed no signs of aluminum contamination. Instead, the secondary phase is reasonably matched to SrGa2O4. Additionally, the peak intensity for the secondary phase is significantly smaller than prior work. This is likely due to differences in aluminum contamination due to less surface contact with the sample in this work compared to prior work that used pellets with the entire surface in contact with alumina.
c space group with no evidence of secondary phases. After cycling, evidence of a secondary phase is observed at ∼29° and ∼34°. Prior work showed cycling of LSMG at higher pressures led to a different secondary phase as a result of interaction with the alumina crucible, with the main peak identified at ∼30.5°.27 The powder cycled in this experiment showed no signs of aluminum contamination. Instead, the secondary phase is reasonably matched to SrGa2O4. Additionally, the peak intensity for the secondary phase is significantly smaller than prior work. This is likely due to differences in aluminum contamination due to less surface contact with the sample in this work compared to prior work that used pellets with the entire surface in contact with alumina.
 |
| | Fig. 3 XRD patterns of LSMG6482 before cycling, after cycling from a pO2 of 10−3 atm to 10−4 atm (McCord et al.), and after cycling from a pO2 of 10−4 atm to 10−7 atm. LSMG6482 forms in the perovskite structure with no secondary phases prior to cycling. Cycling causes Sr–Ga rich secondary phases to form in the material. | |
Defect equilibria
The six fitted parameters, m1, b1, m2, b2, x, and y, of the oxygen defect model described in eqn (8)–(10) are shown in Table 1 and their convergence is described in Fig. 3 and ESI 4.† The resulting equilibrium behavior described by the defect model is plotted as solid lines in Fig. 4a, overlaid with experimentally obtained values. Fig. 4b shows the resulting linear relationship between ln(Ki) and 1000/T from the fitted slope and intercept values. Eqn (11) was used to extract the partial molar enthalpy and entropy of single defect reactions for both the reduction of Mn4+ to Mn3+ (K1) and the disproportionation of Mn3+ to Mn4+ and Mn2+ (K2). Those values are presented in Table 1 as defect reaction fitting parameters and plotted together in Fig. 4c.
Table 1 Oxygen defect model fitting parameters and defect reaction fitting parameters
| Defect Reaction |
Equilibrium model fitting parameters |
Defect reaction linear fitting parameters |
|
K
1
|
m
1
|
b
1
|
x
|
y
|
Δho1 (kJ mol−1) |
Δso1 (J mol−1 K−1) |
| −29.56 |
11.51 |
0.36 |
0.17 |
245.77 |
95.67 |
|
K
2
|
m
2
|
b
2
|
x
|
y
|
Δho2 (kJ mol−1) |
Δso2 (J mol-1 K−1) |
| −40.01 |
14.47 |
0.36 |
0.17 |
332.66 |
120.33 |
 |
| | Fig. 4 Oxygen defect modeling results: (a) equilibrium model predictions are shown as solid lines for each temperature, overlaid with markers for experimental data, (b) equilibrium coefficients for each defect reaction as a function of temperature, (c) partial molar change in enthalpy and entropy for each single defect reaction. | |
Overall, the model describes the equilibrium behavior of LSMG6482 well across the entire range of measured δ, with some deviation at the lower pO2 for T = 1300 °C and at the highest pO2 for T = 1200 °C. The final SSE between the model and measured data was 0.0026. The nominal values of x and y for LSMG6482 as synthesized here with a 5% A-site deficiency are 0.38 and 0.2, respectively. Here, the best fit was obtained with fitted values of 0.36 and 0.17 indicating that the model best fits the data representative of a material with bulk deficiency in Sr and Ga. This fit may be caused by Sr segregation from the bulk and explains well the prior mentioned Ga- rich secondary phase growth from Fig. 3. AP-XPS work has indicated that the presence of Ga prevents excessive Sr segregation in the bulk as is seen with undoped LSM samples, however some degree of segregation may be expected.24 The defect reaction fitting parameters for K1 shown in Table 1 and Fig. 4c are comparable to those reported from Takacs et al. for LSM40 (Δho1 = 256.12 kJ mol−1, Δso1 = 98.60 kJ mol−1, Δho2 = 314.52 kJ mol−1, Δso2 = 96.82 kJ mol−1), the undoped B-site equivalent of LSMG6482, and below those reported from Ezbiri et al. for LSMA6482 (Δho1 = 494.53 kJ mol−1, Δso1 = 229.55 kJ mol−1, Δho2 = 370.91 kJ mol−1, Δso2 = 144.91 kJ mol−1), the Al- doped analogue of LSMG6482.11,12 This is qualitatively consistent with predictions of oxygen vacancy formation energy of varying LaMnO3 substitutions from Wang et al. where the median electron vacancy formation energy is approximately 3.1 eV for A-site Sr-doped LaMnO3, 3.75 eV for B-site Ga- doped LaMnO3, and 3.9 eV for B-site Al- doped LaMnO3.19
Previous applications of this defect modeling approach have involved measuring δ in pO2 ≥ 10−4, achievable through trace oxygen mixing, and using the defect model to extrapolate to lower pO2, as is done here with the 1200 °C isotherm. We have compared the effect of inclusion of lower pressure data points on the fitted residuals, and somewhat surprisingly, the fitted parameters when using only high-pressure data are remarkably similar to those presented in Table 1, differing by less than 2.1%. The fitted parameters to the limited data set are tabulated in Table ESI 3† and the resulting fit is plotted in Fig. ESI 5.† A comparison of fit residuals using either method is shown in Fig. 5. The top plot shows fit residuals using the full range of measured data (10−6.84 ≤ pO2 (atm) ≤ 10−2.94) and the bottom plot shows fit residuals using data from a previous study in the pO2 range 10−3.94 ≤ pO2 (atm) ≤ 10−2.94. It can be seen that the magnitude and distribution of error of the model in δ space are quite similar. Thus, a limited data set is certainly suitable for the application defect models to describe thermodynamic behavior in LSMG6482. It is, of course, advantageous to include lower pressure measurements as a check of validity of the extrapolation as δ approaches values large enough that defect clustering might be considered, which is not included in this model.
 |
| | Fig. 5 Residuals of the oxygen defect model when fitted to the full thermogravimetric data set (top) compared to those when fitted to only data achieved through trace oxygen mixing (bottom). | |
Thermodynamic properties
Δo(δ) and Δo(δ) are extracted from the fitted equilibrium curves shown in Fig. 4a are plotted in Fig. 6a and the linear fits for select isostoichiometric values are shown in Fig. 6b. Eqn (14) was used to analyze the properties at 0.009 ≤ δ ≤ 0.250 in 0.001 increments. The solid lines are linear fits, and the asterisks are the ln(pO2)1/2 values that correspond to the temperature for a given δ value. Each regression had a coefficient of determination of 0.99 or greater, indicating an excellent fit. Overall, it was found that Δo(δ) and Δo(δ) for LSMG6482 are suitable for water splitting with Δo greater than that of the formation enthalpy of H2O (∼250 kJ mol−1).28 The average Δo and Δo across the measured range of δ was 310.9 kJ mol−1 and 142.2 J mol−1 K−1, respectively, with Δo increasing with increasing δ and Δo remaining relatively constant. The increase in Δo with increasing δ is due to the divergence of the modeled isotherms relative to each other as δ increases, or in other words as delta increases, dpO2/dT also increases, and represents the material well. A similar trend was observed by Cooper et al. for Sr and Ca doped lanthanum manganites.20 Properties are compared to other high performance water slitting materials in Fig. 7.11–14,20–22,29,30 The left plot of Fig. 7 shows LSMG6482 Δo and Δo at δ = 0.05 as a star, compared to other notable redox materials shown as asterisks. Materials marked by a superscripted asterisk are plotted at δ = 0.04 due to a lack of characterization at δ = 0.05. Δo and Δo at δ = 0.10 are also shown for materials which have been characterized at that extent in the right plot of Fig. 7. At δ = 0.05, properties for LSMG6482 are roughly an average of similar perovskites, grouped between Δo of 200–300 kJ mol−1 and Δo of 120–160 J mol−1 K−1. Ceria is shown in the upper right corner of the plot, with well-known high Δo and Δo, which is maintained in the right plot at δ = 0.10. While, LSMA6446 also exists in the middle of these two groups at δ = 0.05, it has been shown that Δo and Δo decrease as a function of δ, while, LSMG6482 generally maintains increasing or flat Δo and Δo over the entire range of measured δ. This is apparent in the right plot of Fig. 7. Here, values of Δo and Δo for LSMG6482 are near the top of the perovskite group. This can be advantageous as this combination of properties allows the material to maintain some degree of oxidation favorability at high temperatures while simultaneously being highly reducible at moderate temperatures.10
 |
| | Fig. 6 ln(pO1/22) vs. 1000/T fits at select δ (left) and partial thermodynamic properties of LSMG6482 as a function of delta (right). | |
 |
| | Fig. 7 Comparison of Δo(δ) and Δo(δ) at δ = 0.05 (left) and δ = 0.10 (right) LSMG6482 and notable perovskites from literature. Insights from Ellingham diagram. | |
Insights from Ellingham diagram
The partial molar thermodynamic properties of LSMG6482 can be used to describe the equilibrium thermodynamics of LSMG6482 reduction and oxidation by way of an Ellingham diagram, as described by Cooper et al.20Fig. 8 shows the standard equilibrium Gibbs free energy of the oxidation of LSMG6482 (solid lines) and ceria (dashed lines) as a function of temperature and δ, described below in eqn (24).| | | Δrgoox(T,δ) = −Δrgoox(T,δ) = −Δo(δ) + TΔo(δ) | (24) |
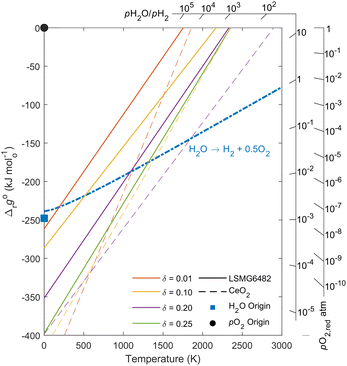 |
| | Fig. 8 Ellingham diagram for LSMG6482 (solid lines) and ceria (dashed lines) for analysis of favorability of redox reactions and resulting fuel to feed ratios. | |
The equilibrium δ states shown for each material are 0.01, 0.10, 0.20, and 0.25 for LSMG6482 to allow for analysis of both reduction and oxidation conditions of each material. Temperatures at which oxidation to a given δ becomes favorable exist below the intersection of Δrgoox(T,δ) and the Gibbs free energy change for the thermolysis of H2O, shown as a dashed-dotted blue line. Additional insights toward oxidation can be gained by observation of the Gibbs free energy change for thermolysis of H2O under variable feed to fuel ratio, or pH2O/pH2. The oxidation reaction, analogous to that shown in eqn (14) during reduction for an infinitesimally small change in δ, can be described by eqn (25), assuming equal activity between solid reactants and products.20,26
| |  | (25) |
Recalling the relationship between pO2 and the feed to fuel ratio during water splitting, described by eqn (17), the relationship seen in eqn (25) can be rewritten in terms of Kws and pH2O/pH2, as seen in eqn (26), where pO2,ox is the pO2 of the gas phase, or pO2,gp, and values for Kws can be obtained from NIST-JANAF.28
| |  | (26) |
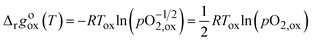
The resulting Gibbs free energy change for a given pH2O/pH2 is plotted as a function of temperature. The slopes of these lines extend from the pH2O/pH2 axis and converge on the blue square marker, the H2O origin. Accordingly, in order to assess the feed to fuel ratio at equilibrium for a given set of oxidation conditions, δ and T, a line can be passed from the H2O origin through the desired point on the materials' Δrgoox(Tox,δox) line and out to the pH2O/pH2 axis. Similarly, reduction favorability can be assessed from this plot by equating eqn (24) with the Gibbs free energy change described in eqn (14). Accordingly, −Δrgoox(Tred,pO2,red) is plotted on the furthest right axis as a function of pO2,red and temperature, where the slopes of the axis ticks extend toward the black circle marker for the pO2 origin. The intersection of these lines with the Δrgoox(T,δ) for a given oxide will give insight to the temperature at which the oxide will favorably reduce to the corresponding δ and pO2.
At pO2,red = 10−5 atm, results indicate that the reduction to δ = 0.2 will occur at ∼1750 K and ∼2150 K for LSMG6482 and ceria, respectively. Reduction to δ = 0.1 will occur at ∼1600 K and ∼1850K for LSMG6482 and ceria, respectively.
During oxidation, two representative cases are considered: a high feed to fuel ratio of 500, and a low feed to fuel ratio of 10. For the high feed to fuel case, representative of excess steam conditions, the temperature at which oxidation to δ = 0.01 will occur is 350 K and 1530 K for LSMG6482 and ceria, respectively. However, it is well understood that for lower enthalpy materials like LSMG6482, full oxidation may not be optimal for time averaged fuel yields. A more realistic oxidation δ expected for LSMG6482, e.g., δ = 0.10, will occur 1600 K. For the low feed to fuel case, representative of high conversion conditions, the temperature at which oxidation to δ = 0.01 will occur is 200 K and 1250 K for LSMG6482 and ceria, respectively. Oxidation of LSMG6482 to δ = 0.10 will occur at a temperature of 700 K. It is evident that the oxidation of ceria is favorable even at high temperatures up to 1250 K while maintaining high conversion, which can take advantage of more favorable oxidation kinetics and limit the required temperature swing between reactions. Conversely, the oxidation of LSMG6482 is not favorable until reaching lower temperatures unless increasing the fuel to feed ratio, or in other words providing excess steam. This is consistent with experimental findings in our previous studies.27
Water splitting activity
Fig. 9 shows computed H2 yield (nH2) and steam conversion (α) for one mole of metal oxide with input steam (nH2Oi) of 0.1, 1, and 10 moles for Tred ranging from 1573 K to 1773 K at pO2,red of 10−5 atm. Overall, nH2 and α increase monotonically with increasing Tred and decreasing Tox for both ceria and LSMG6482. nH2 yield and α plateau once nH2 approaches δred for ceria, though this only occurs at these conditions for LSMG6482 at the highest Tred, and lowest Tox with nH2Oi = 0.1. It should be noted that the maximum α as it is defined here is also limited by δred and can therefore not reach 100% for nH2Oi > 2 for ceria or nH2Oi > 3 for LSMG6482 in the case of full stoichiometric reduction to a metal. Thus, the limit for α is δred/nH2Oi. This should be considered when determining input steam flowrates as operating in these regimes will result in increased downstream separation costs but may be thermodynamically favorable in the case of LSMG6482. Under all conditions, when supplying 10 moles of steam, LSMG6482 produces more H2 and converts more steam at all conditions, with a maximum α of 1.69% at Tred = 1773 K. At all other steam inputs, however, the LSMG6482 only performs better or as well as ceria under close to isothermal conditions. Once any temperature swing greater than ∼40 K is introduced, ceria will produce more H2 and convert more steam until it reaches its limit set by δred. Importantly, from Fig. 9, it is clear that ceria is quite limited to operation at Tred at well above 1573 K.
 |
| | Fig. 9 H2 yield (top row) and steam conversion (bottom row) for Tred ranging from 1573 K to 1773 K at pO2,red = 10−5 atm for ceria and LSMG6482 under fixed steam inputs and variable Tox. Solid lines represent results for ceria, while dashed-dotted lines represent results for LSMG6482. | |
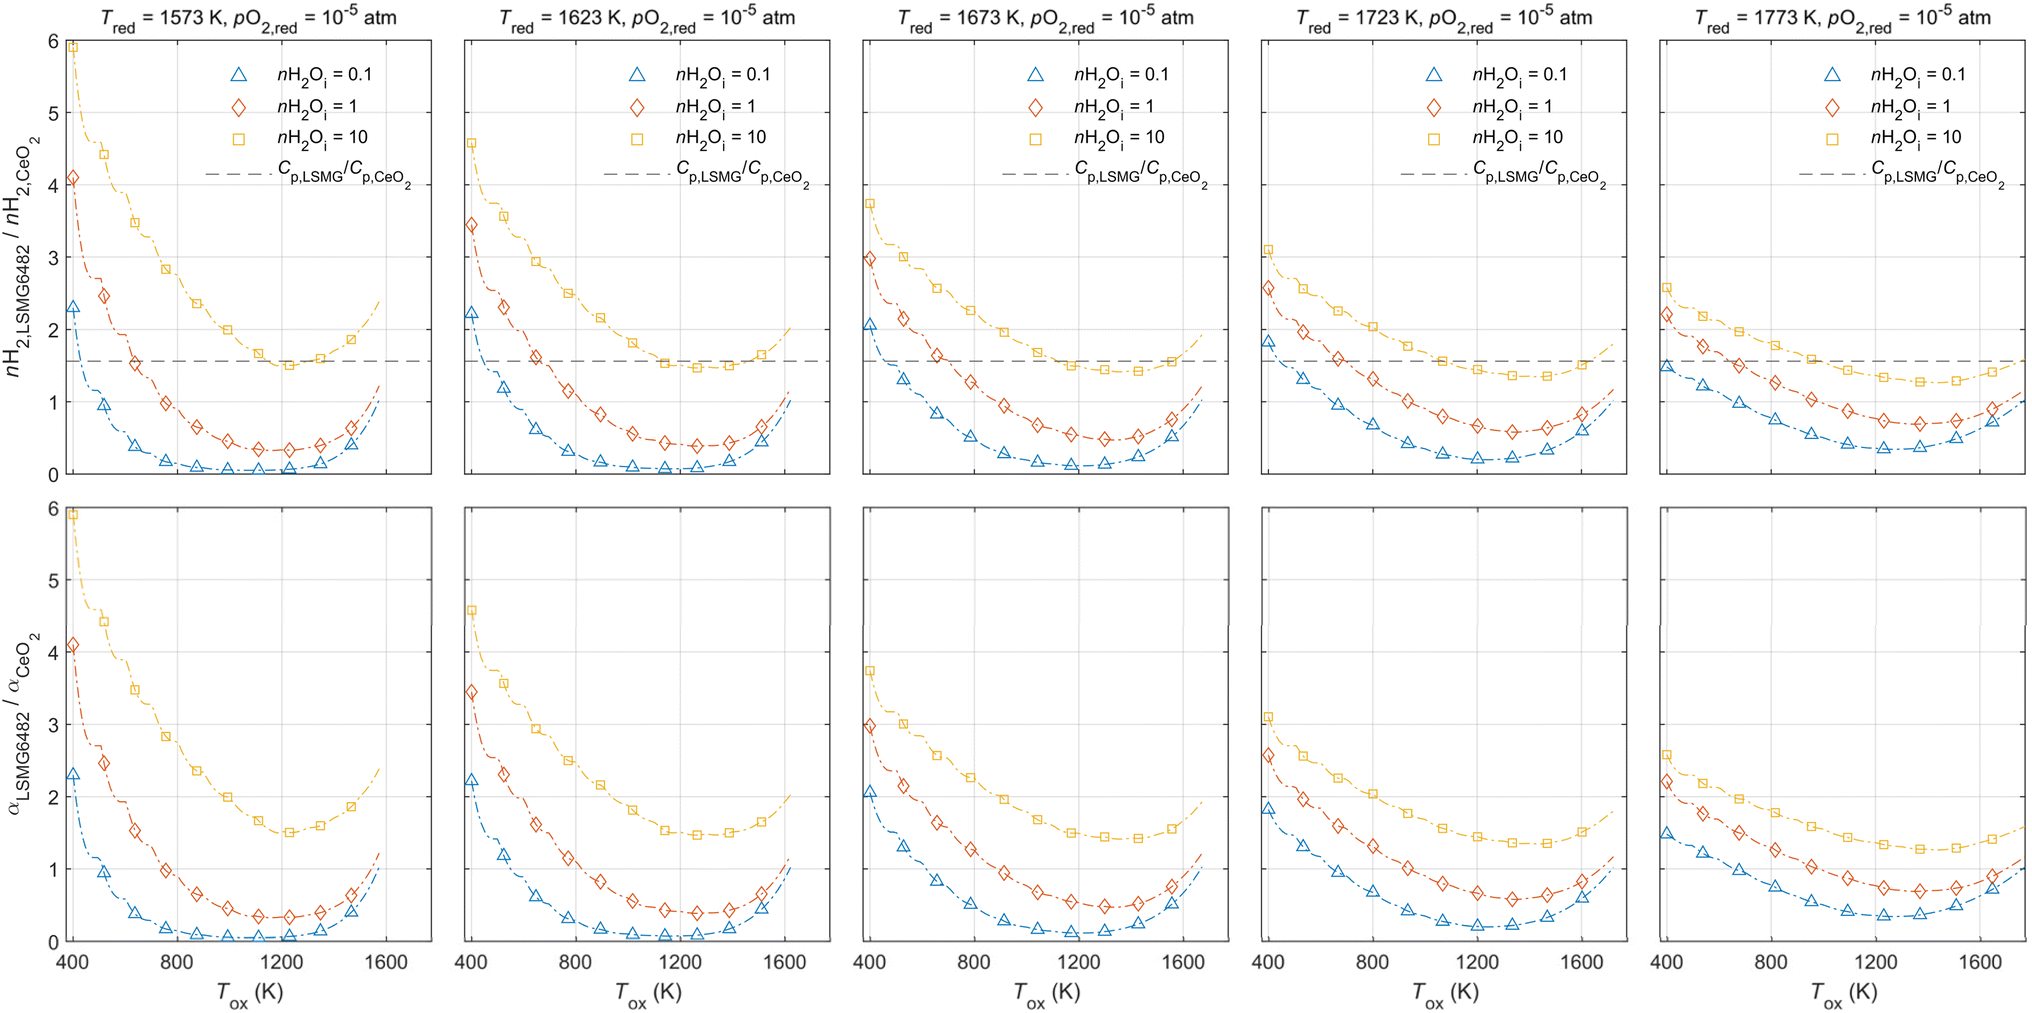
For conditions other than isothermal, solid phase heating requirements have a large impact on solar-to-fuel efficiency. A high ratio of H2 yields relative to the ratio of their specific heats would be desirable when operating in temperature swing mode and can lend some insight toward beneficial cycling regimes for each material. Results for nH2 and α ratios of LSMG6482 to ceria are shown in Fig. 10. In addition, a dashed line has been plotted at Cp,LSMG6482/Cp,ceria which is approximated at 1.56.31–33 Results indicate that nH2,LSMG6482/nH2,ceria is greatest when supplying excess steam and exceeds the ratio of specific heats under nearly all ΔT at the lowest Tred. As Tred is increased, there is eventually a requirement for a large temperature swing even at the greatest amount of excess steam in order for nH2,LSMG6482/nH2,ceria to exceed Cp,LSMG6482/Cp,ceria.
 |
| | Fig. 10
nH2,LSMG6482 normalized to that of ceria (top row) for 1573 K ≤ Tred ≤ 1773 K (columns) and varying nH2Oi, noted by different colors and markers. The criterion for thermodynamic advantage over ceria under a given ΔT, specifically the ratio of specific heat capacities of each solid, is shown by the dashed line. It is assumed here based on specific heat capacity correlations that Cp,LSMG6482 and Cp,ceria are equal ∼94 J mol K and ∼60 J mol K, respectively.31–33 | |
In summary, the results presented in Fig. 9 and 10 predict that LSMG6482 is most suitable for lower temperature reduction conditions with excess steam input. While results show that very large temperature swings will result in up to 6 times the yield of nH2 when compared to ceria, the low oxidation temperatures required will certainly result in undesirable kinetics. However, according to Fig. 10, a small temperature swing can be introduced under excess steam conditions to increase nH2 without suffering large solid phase heating penalties compared to ceria or reaching a temperature regime where kinetics may be limiting. Ceria is shown to be most suitable for higher reduction temperatures with larger temperature swings that allow high steam conversion but will not surpass the thermodynamic limit of oxygen in ceria (or δ = 0).
Conclusions
The work herein involved the characterization of oxygen defect equilibria and partial molar thermodynamic properties for the STCH redox material LSMG6482. An oxygen defect model used for the characterization of other similarly doped LSM perovskites was fitted to measured thermogravimetric data to adequately describe the defect behavior of LSMG6482. Van't Hoff analysis was utilized to extract partial molar thermodynamic properties, Δo and Δo, as a function of δ. The properties were comparable in magnitude to similar LSM materials characterized in literature but were found to maintain a high magnitude as δ increased, which is beneficial when oxidizing at high temperatures. Thermodynamic properties were used as input to a water splitting model which was used to analyze conversion and H2 yield at various conditions relevant to STCH production. LSMG6482 equilibrium yields of H2 at the lowest Tred are large relative to ceria, where the latter is thermodynamically limited. It was found that it is ideal to operate LSMG6482 isothermally or under small temperature swings with sufficient steam delivery. It was noted that under the large ΔT conditions, despite the large predicted H2 yields, LSMG6482 may become kinetically limited due to the low oxidation temperature.
Overall, these results provide a set of thermodynamic properties that can be used for more in depth thermodynamic and techno-economic modeling of the LSMG6482 redox system and provides direction toward the most ideal operating conditions for its use. In future research, the intrinsic thermodynamic properties and modeled behavior characterized herein will be used to optimize the design of a pilot scale combined receiver reactor system for the demonstration of efficient, low temperature H2 production.
Data availability
The data supporting this article have been included as part of the ESI.†
Conflicts of interest
There are no conflicts of interest to report for this work.
Acknowledgements
We gratefully acknowledge financial support from the U.S. Department of Energy Hydrogen and Fuel Cell Technologies Office (Award Number: EE0008840) and the U.S. Department of Energy Solar Energy Technologies Office (Award Number: EE00010315).
References
- W. Chueh,
et al., High-Flux Solar-Driven Thermochemical Dissociation of CO2 and H2O Using Nonstoichiometric Ceria, Science, 2010, 330(6010), 1797–1801, DOI:10.1126/science.1197834
 .
.
- P. Furler, J. R. Scheffe and A. Steinfeld, Syngas production by simultaneous splitting of H2O and CO2via ceria redox reactions in a high-temperature solar reactor, Energy Environ. Sci., 2012, 5(3), 6098–6103, 10.1039/c1ee02620h .
- W. C. Chueh and S. M. Haile, A thermochemical study of ceria: exploiting an old material for new modes of energy conversion and CO2 mitigation, Philos. Trans. R. Soc., A, 2010, 368(1923), 3269–3294 CrossRef CAS PubMed .
- R. Bader, L. J. Venstrom, J. H. Davidson and W. Lipiński, Thermodynamic Analysis of Isothermal Redox Cycling of Ceria for Solar Fuel Production, Energy Fuels, 2013, 27(9), 5533–5544, DOI:10.1021/ef400132d .
- R. J. Carrillo and J. R. Scheffe, Beyond Ceria: Theoretical Investigation of Isothermal and Near Isothermal Redox Cycling of Perovskites for Solar Thermochemical Fuel Production, Energy Fuels, 2019, 33(12), 12871–12884, DOI:10.1021/acs.energyfuels.9b02714 .
- K. Lee, D. C. McCord, R. J. Carrillo, B. Guyll and J. R. Scheffe, Improved Performance and Efficiency of Lanthanum–Strontium–Manganese Perovskites Undergoing Isothermal Redox Cycling under Controlled pH2O/pH2, Energy Fuels, 2020, 34(12), 16918–16926, DOI:10.1021/acs.energyfuels.0c02872 .
- D. Marxer, P. Furler, M. Takacs and A. Steinfeld, Solar thermochemical splitting of CO 2 into separate streams of CO and O 2 with high selectivity, stability, conversion, and efficiency, Energy Environ. Sci., 2017, 10(5), 1142–1149 RSC .
-
S. Zoller, “A 50 kW Solar Thermochemical Reactor for Syngas Production Utilizing Porous Ceria Structures,”Thesis, ETH Zurich, 2020 Search PubMed .
- S. Siegrist, H. von Storch, M. Roeb and C. Sattler, Moving brick receiver–reactor: a solar thermochemical reactor and process design with a solid–solid heat exchanger and on-demand production of hydrogen and/or carbon monoxide, J. Sol. Energy Eng., 2019, 141(2), 021009 CrossRef CAS .
- R. J. Carrillo and J. R. Scheffe, Advances and trends in redox materials for solar thermochemical fuel production, Sol. Energy, 2017, 156, 3–20 CrossRef CAS .
- M. Ezbiri, M. Takacs, D. Theiler, R. Michalsky and A. Steinfeld, Tunable thermodynamic activity of LaxSr1−xMnyAl1−yO3−δ (0 ≤ x ≤ 1, 0 ≤ y ≤ 1) perovskites for solar thermochemical fuel synthesis, J. Mater. Chem. A, 2017, 5(8), 4172–4182, 10.1039/c6ta06644e .
- M. Takacs, M. Hoes, M. Caduff, T. Cooper, J. R. Scheffe and A. Steinfeld, Oxygen nonstoichiometry, defect equilibria, and thermodynamic characterization of LaMnO3 perovskites with Ca/Sr A-site and Al B-site doping, Acta Mater., 2016, 103, 700–710 CrossRef CAS .
- R. J. Panlener, R. N. Blumenthal and J. E. Garnier, Thermodynamic Study Of Nonstoichiometric Cerium Dioxide, J. Phys. Chem. Solids, 1975, 36(11), 1213–1222, DOI:10.1016/0022-3697(75)90192-4 .
- M. Zinkevich, D. Djurovic and F. Aldinger, Thermodynamic modelling of the cerium–oxygen system, Solid State Ionics, 2006, 177(11), 989–1001 CrossRef CAS .
- V. K. Budama, N. G. Johnson, I. Ermanoski and E. B. Stechel, Techno-economic analysis of thermochemical water-splitting system for Co-production of hydrogen and electricity, Int. J. Hydrogen Energy, 2021, 46(2), 1656–1670, DOI:10.1016/j.ijhydene.2020.10.060 .
- J. R. Scheffe, D. Weibel and A. Steinfed, Lanthanum-Strontium-Manganese Perovskites as Redox Materials for Solar Thermochemical Splitting of H2O and CO2, Energy Fuels, 2013, 27(8), 4250–4257, DOI:10.1021/ef301923h .
- A. H. McDaniel,
et al., Sr-and Mn-doped LaAlO3− δ for solar thermochemical H2 and CO production, Energy Environ. Sci., 2013, 6(8), 2424–2428 RSC .
- D. R. Barcellos, M. D. Sanders, J. Tong, A. H. McDaniel and R. P. O'Hayre, BaCe 0.25 Mn 0.75 O 3−δ —a promising perovskite-type oxide for solar thermochemical hydrogen production, Energy Environ. Sci., 2018, 11(11), 3256–3265, 10.1039/C8EE01989D .
- X. Wang,
et al., LaMnO3 Dopants for Efficient Thermochemical Water Splitting Identified by Density Functional Theory Calculations, J. Phys. Chem. C, 2023, 127(49), 23988–24000, DOI:10.1021/acs.jpcc.3c06835 .
- T. Cooper, J. R. Scheffe, M. E. Galvez, R. Jacot, G. Patzke and A. Steinfeld, Lanthanum Manganite Perovskites with Ca/Sr A-site and Al B-site Doping as Effective Oxygen Exchange Materials for Solar Thermochemical Fuel Production, Energy Technol., 2015, 3(11), 1130–1142, DOI:10.1002/ente.201500226 .
- C. Liu,
et al., Manganese-based A-site high-entropy perovskite oxide for solar thermochemical hydrogen production, J. Mater. Chem. A, 2024, 12(7), 2910–3922, 10.1039/d3ta03554a .
- X. Qian,
et al., Outstanding Properties and Performance of CaTi0.5Mn0.5O3–δ for Solar-Driven Thermochemical Hydrogen Production, Matter, 2021, 4(2), 688–708, DOI:10.1016/j.matt.2020.11.016 .
- R. B. Wexler,
et al., Multiple and nonlocal cation redox in Ca–Ce–Ti–Mn oxide perovskites for solar thermochemical applications, Energy Environ. Sci., 2023, 16(6), 2550–2560, 10.1039/D3EE00234A .
- A. L. Fernandes Cauduro,
et al., Stabilization of Catalytically Active Surface Defects on Ga-doped La–Sr–Mn Perovskites for Improved Solar Thermochemical Generation of Hydrogen, Top. Catal., 2024, 67(13), 900–908, DOI:10.1007/s11244-024-01940-w .
-
D. G. Goodwin, H. K. Moffat, I. Schoegl, R. L. Speth and B. W. Weber, Cantera: An object-oriented software toolkit for chemical kinetics, thermodynamics, and transport processes, Version 3.1.0, 2024, DOI:10.5281/zenodo.14455267, https://www.cantera.org .
-
J. Scheffe, D. McCord and D. Gordon, “Hydrogen (or Syngas) Generation-Solar Thermal Chemical Energy Storage,” in Advances in Energy Storage Latest Developments from R&D to the Market, Wiley, pp. 441–487, 2024, https://faculty.eng.ufl.edu/jonathan-scheffe/wp-content/uploads/sites/100/2021/09/Solar-Syngas-Production_Scheffe_vWEB.pdf Search PubMed .
- D. C. McCord,
et al., Solar Thermochemical Redox Cycling Using Ga- and Al-Doped LSM Perovskites for Renewable Hydrogen Production, J. Phys. Chem. C, 2024, 128(38), 15796–15806, DOI:10.1021/acs.jpcc.4c02797 .
-
M. W. Chase and N. I. S. Organization, “NIST-JANAF Thermochemical Tables, ”American Chemical Society, Washington, DC, vol. 9, 1998 Search PubMed .
- K. J. Warren, J. T. Tran and A. W. Weimer, A thermochemical study of iron aluminate-based materials: a preferred class for isothermal water splitting, Energy Environ. Sci., 2022, 15(2), 806–821, 10.1039/D1EE02679H .
- M. J. Ignatowich,
et al., Impact of enhanced oxide reducibility on rates of solar-driven thermochemical fuel production, MRS Commun., 2017, 7(4), 873–878, DOI:10.1557/mrc.2017.108 .
- J. E. HURST Jr and B. Keith Harrison, Estimation of liquid and solid heat capacities using a modified Kopp’s rule, Chem. Eng. Commun., 1992, 112(1), 21–30 CrossRef .
- I. Riess, M. Ricken and J. No, On the specific heat of nonstoichiometric ceria, J. Solid State Chem., 1985, 57(3), 314–322 CrossRef CAS .
- D. McCord, E. J. Gager, K. Lee, A. McDaniel, J. C. Nino and J. Scheffe, Assessment of Bulk Oxygen Capacity and Transient Redox Behavior of Foamed LSM Perovskites, J. Sol. Energy Eng., 1–13 Search PubMed .
|
| This journal is © The Royal Society of Chemistry 2025 |
Click here to see how this site uses Cookies. View our privacy policy here. 
 Open Access Article
 This Open Access Article is licensed under a
  a,
Caroline M.
Hill
a,
Caroline M.
Hill

 , in Kroger Vink notation, can be described by eqn (4), as demonstrated by other studies.11,12
 and oxygen atoms on oxygen lattice sites (Oxo) in equilibrium with trivalent manganese on manganese lattice sites (MnxMn), doubly ionized oxygen vacancies
  , and gaseous oxygen. The development of the oxygen defect model is described in detail by Takacs et al.12 In short, the equilibrium constant of eqn (4) is described by eqn (5). Further, disproportionation of trivalent manganese into tetravalent and divalent manganese
  can be combined with eqn (4) to write the disproportionation reaction as seen in eqn (6). The equilibrium constant for the disproportionation reaction is shown in eqn (7).


 for a given equilibrium δred, the Δ