
A new empirical equation for the gas/particle partitioning of OPFRs in ambient atmosphere†
Man
Li‡
a,
Wenhao
Hou‡
b,
Lina
Qiao
 *a,
Hong
Zhang
b,
Mengdan
Wang
a,
Yonghui
Wen
a and
Zejiang
Jia
a
*a,
Hong
Zhang
b,
Mengdan
Wang
a,
Yonghui
Wen
a and
Zejiang
Jia
a
aMarine College, Shandong University, Weihai 264209, China. E-mail: qiaolina@sdu.edu.cn
bSchool of Marine Science and Technology, Harbin Institute of Technology at Weihai, Weihai, Shandong 264209, China
First published on 17th December 2024
Abstract
Gas/particle (G/P) partitioning is a core process governing the atmospheric transport of organophosphate flame retardants (OPFRs). However, accurately predicting the G/P partition performance of OPFRs remains a challenge. In this study, four independent models were employed to estimate the characteristics of OPFR G/P partitioning within the octanol–air partition coefficient range of 4.7 (TMP) to 14.2 (TMPP). The results showed that in the maximum partition domain, the Li–Ma–Yang steady-state model fitted the best, with 85.2% of the predicted G/P partition quotient (log![[thin space (1/6-em)]](https://www.rsc.org/images/entities/char_2009.gif) KP) values within an acceptable deviation range of ±1 log units for OPFRs. Accordingly, no significant deviations were observed between the predicted (0.56 ± 0.32) and monitored (0.52 ± 0.11) values of the average particle-bound fraction (φP) for the Li–Ma–Yang model in the maximum partition domain. Large deviations were observed between the monitored values and predicted logKP values by these four models in the equilibrium domain. Several factors responsible for the significant deviations observed in G/P partitioning values of OPFRs were discussed. These identified factors were used to develop a new empirical equation, which substantially improved logKP predictions for OPFRs to 75.8% in the equilibrium domain.
KP) values within an acceptable deviation range of ±1 log units for OPFRs. Accordingly, no significant deviations were observed between the predicted (0.56 ± 0.32) and monitored (0.52 ± 0.11) values of the average particle-bound fraction (φP) for the Li–Ma–Yang model in the maximum partition domain. Large deviations were observed between the monitored values and predicted logKP values by these four models in the equilibrium domain. Several factors responsible for the significant deviations observed in G/P partitioning values of OPFRs were discussed. These identified factors were used to develop a new empirical equation, which substantially improved logKP predictions for OPFRs to 75.8% in the equilibrium domain.
Environmental significanceThe gas/particle partitioning behavior of emerging chemicals such as organophosphate flame retardants determines their long-range transport, wet and dry deposition and atmospheric fate. Currently, the accurate prediction of the gas/particle partition quotient of OPFRs remains a challenge. Understanding the characteristics and influencing factors of gas particle partition of OPFRs is the key to addressing this challenge. In this study, the characteristics of gas/particle partition of OPFRs and the determining factors were comprehensively investigated in the octanol–air partition coefficient (KOA) range of 4.7 (TMP) to 14.2 (TMPP). Large deviations were observed between the measured and predicted logKP values in the EQ domain (logKOA < 11.4). A new empirical equation for the EQ domain was developed with a better agreement between the predicted and measured data, and the percentage of data points that fall within the ADR increased from 23.1% to 75.8%.
|
1. Introduction
Organophosphate flame retardants (OPFRs) have been widely used as alternatives to brominated flame retardants in household appliances, building materials, textiles, wires, cables, and other products due to their excellent flame-retarding performance, and some of the OPFRs are evaluated to have the potential for long-range transport via air and water.1–3 Unlike polybrominated diphenyl ethers (PBDEs), OPFRs are not chemically bonded to the material, which makes them more prone to leaching from the material, leading to significantly higher concentration of OPFRs in environment than other flame retardants.4 In recent years, OPFRs have been detected in the atmosphere,5,6 waters,7 sediments,8 aquatic organisms9 and even in areas, such as the Antarctic Peninsula and the Arctic,10,11 posing potential hazards to the environment and human health.After OPFRs are released into the atmosphere, they are adsorbed or absorbed onto/into particulate matter, and their distribution between gas and particle phases determines their global long-range atmospheric transport, wet and dry deposition, degradation and the pathways to human exposure.12 Generally, gaseous OPFRs are more easily transported through the atmosphere. Higher gaseous concentrations of OPFRs are observed in summer, while higher particulate concentrations of OPFRs are found in winter.13 Additionally, both gaseous and particulate OPFRs can enter organisms through different pathways and pose potential hazards. Hence, more attention has to be paid to the gas/particle partitioning (GPP) behavior of OPFRs in the environment that affects their long-range transport and human exposure pathways. Particulate OPFRs might be more persistent in the air due to their low vapor pressure.14–16 The G/P partition of OPFRs could affect their long-range transport via both air and seawater, even from the European continent and seas to the polar regions.11 Thus, the knowledge of GPP of OPFRs is of great significance for understanding their environmental behavior and fate.
There are many factors that affect the G/P partition of OPFRs in ambient atmosphere. Previous studies have shown that high temperature can promote the mass transfer of OPFRs from particles to the gas phase, which will lead to OPFRs distributing in the gas phase.17 A negative correlation between temperature and particle-bound fraction (φp) has been observed, suggesting the temperature might affect the GPP of OPFRs (except for triphenyl phosphate (TPHP)).18 High particle matter (PM) mass and low temperature will facilitate the condensation effect of OPFR, contributing to the migration of gaseous OPFRs into solid particulate matter.19 Therefore, it is generally acknowledged that temperature and TSP are the driving forces of OPFR sorption on particulate matter.20 Recent studies show that relative humidity and wind speed positively correlate with the φP of OPFRs.21 The octanol-air partition coefficient (KOA), organic matter fraction (fOM), liquid vapor pressure, volatility, mass of the target compound, and aerosol surface area also are essential parameters relevant to the GPP of OPFRs.17,19 The potential point sources and sampling measurements also have strong influence on the GPP of semi-volatile organic compounds (SVOCs), such as OPFRs.22 The contribution of these GPP-influencing factors to predicting the KP values of OPFRs is still unclear and not quantified.17
Many gas/particle partition models have been developed to quantify the factors that influence and determine the G/P partitioning of SVOCs, such as OPFRs. The Harner–Bidleman (H–B) model (equilibrium model) might be more reliable for predicting the KP values of OPFRs in typical urban cities and rural sites.13 Both Junge–Pankow (J–P) and H–B models tend to underestimate the φP of low-molecular-weight OPFRs and overestimate those of high-molecular-weight OPFRs.23 By comparing the results of J–P model and H–B model in the island in the South China Sea, it is suggested that the GPP of OPFRs might be in a non-equilibrium state.24 Due to the small temperature range, both the temperature-related models did not fit the monitored logKP data well. The pp-LFER model, H–B model, D–E model and steady-state model, which are used to evaluate the phase distribution of OPFRs in urban areas, suggest that all these models underestimate the logKP values in winter and summer conditions, especially for relatively volatile OPFRs that are mainly distributed in the equilibrium (EQ) domain.17 It has been shown previously that a glass fiber filter can change the observed particle-bound fraction of compounds with higher volatility but has little impact on relatively non-volatile components.22 The relative humidity, temperature, and TSP might affect the ability of the glass fiber filter to capture OPFRs, and further research is needed to quantify the impact of these factors.22 Therefore, the questions of how to consider these factors into the G/P partition model and predict the G/P partitioning of OPFRs more accurately are desired to be answered.
In this study, the characteristics and new empirical prediction equation of the G/P partitioning of OPFRs are investigated. Here, we intended (1) to identify the characteristics of G/P partitioning of OPFRs in three aspects: monitoring data, model prediction, and substituent groups in the three partition domains; (2) to develop a new empirical equation for the G/P partitioning of OPFRs in the EQ domain. The findings of this study will provide more knowledge on the dominating mechanisms underlying the partition of various OPFR compounds in the atmosphere.
2. Models and data source
2.1 G/P partitioning quotient and particle-bound fraction
The G/P partition quotient (KP, m3 μg−1) is calculated by monitoring the concentrations of selected OPFRs in the gaseous and particulate phases, and the total suspended particle concentration (TSP, μg m−3):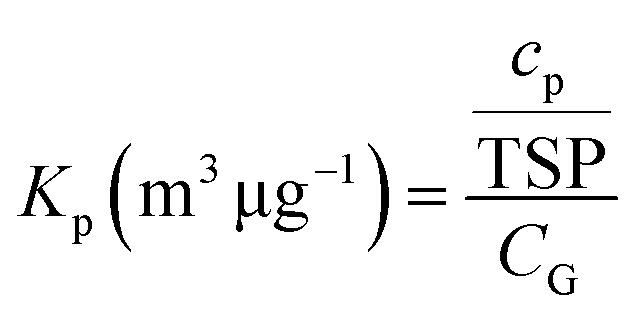 | (1) |
The particle-bound fraction (φp) is another commonly used dimensionless parameter to describe the G/P partitioning behavior of OPFRs:
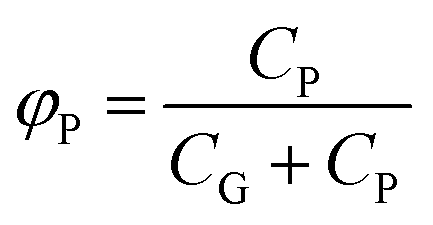 | (2) |
2.2 G/P partitioning models
In this study, four models, including the steady state model (L–M–Y model) and three equilibrium models, namely Junge–Pankow (J–P) model, Harner–Bidleman (H–B) model, Dachs–Eisenreich (D–E) model, were evaluated. To ensure consistency in model comparison and evaluation, the pp-LFER model is not discussed in this study due to the absence of parameters needed for pp-LFER. Considering both wet and dry particle deposition and absorption are dominant in the G/P partitioning process, the L–M–Y model could be represented as:25| logKP-LMY = logKPE + logα | (3) |
KP-LMY is the value of logKP predicted by the L–M–Y model, and logKPE is the equilibrium term calculated by the Harner–Bidleman model. The equilibrium is a special case of the steady state when logα = 0. The logα is the non-equilibrium term, corresponding to the wet and dry deposition on particles:25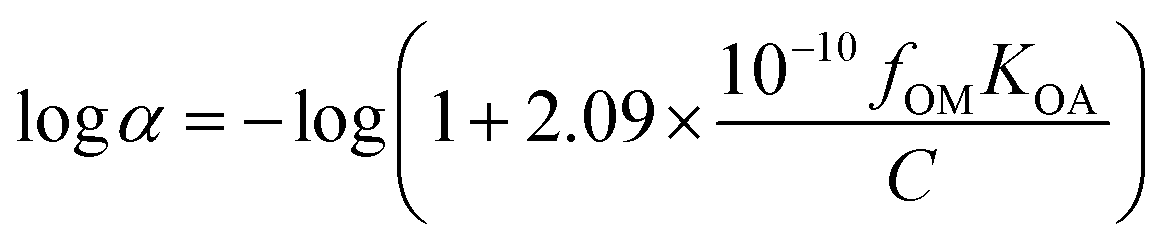 | (4) |
K
OA is a necessary parameter to predict logKP and is the function of temperature:26
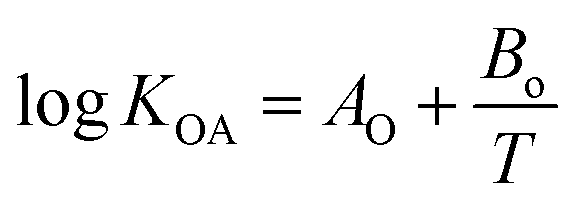 | (5) |
The logKOA could be calculated from the relationship between the logKOA and logPL by the following equation:27
log![[thin space (1/6-em)]](https://www.rsc.org/images/entities/i_char_2009.gif) KOA = −logPL + 6.46 KOA = −logPL + 6.46 | (6) |
The Ao and Bo values of the OPFRs are listed in Table S1.†
C in eqn (4) is a weighting factor for the mass transfer coefficient, with a value of 5 for OPFRs in this study. C = 5 has been successfully used for several SVOCs, such as PBDEs,28,29 non-PBDE brominated flame retardants,30 halogenated flame retardants,31 polychlorinated dibenzo-p-dioxins/furans,32 organochlorine pesticides,33 short- and medium-chain chlorinated paraffins,34 and polychlorinated biphenyls.35
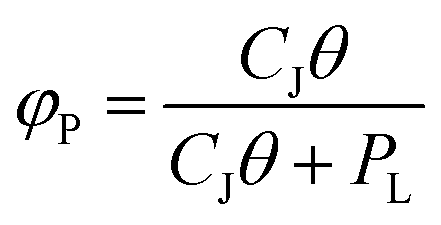
The Junge–Pankow model assumes that particle surface adsorption dominates the GPP process as a function of subcooled liquid vapor pressure (PL, Pa) and the surface area concentration of particulate matter in the air (θ, cmsurface2 cmair−3). The formula for φP is given below :36
 | (7) |
The Harner–Bidleman model assumes that the absorption of SVOCs by the particles is equivalent to that in octanol, which acts as a surrogate to the sorbing organic matter in the particles.38 The Harner–Bidleman formula is a function of KOA and fOM:
| logKP-HB = logKOA + logfOM − 11.91 | (8) |
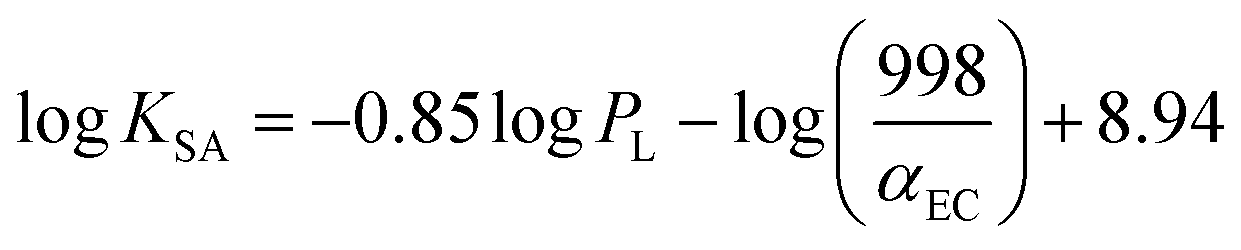
By considering the adsorption and absorption processes as two equally important parts, the soot–air partition coefficient (KSA, L kg−1) and the fraction of elemental carbon (fEC) as the core factors of the adsorption process, the equation of the Dachs–Eisenreich model is derived as follows:
| KP−DE = 10−12fOMKOA + 10−12fECKSA | (9) |
logKSA is given by the following equation:
 | (10) |
2.3 Data sources of OPFRs
The measured data of OPFRs were collated from published articles by retrieving from the “Web of Science” using “OPFRs” and “air”, “organophosphate flame retardants” and “air”, “OPFRs” and “gas particle partitioning”, “organophosphate flame retardants” and “gas particle partitioning” as the topics; the sampling sites (Table S2†) included Beijing, Tianjin, Shanghai, Wuhan, Guiyang, Shijiazhuang, Lanzhou, Jinan, Chengdu, Zhengzhou, Guangzhou in China;39–41 Woody Island in the South China Sea;42 West Antarctic Peninsula;43 New York state;44 and German part of the North Sea.45 Thirteen OPFRs with a wide range of chlorination, namely Tris (2-butoxyethyl) phosphate (TBOEP), tri (2-chloroethyl) phosphate (TCEP), tri (chloropropyl) phosphate (TCPP), Tris (1,3-dichloro-2-propyl) phosphate (TDCIPP), Tris (2-ethyl hexyl) phosphate (TEHP), tri-ethyl phosphate (TEP), trihexyl phosphate (THP), tri-isobutyl phosphate (TIBP), trimethyl phosphate (TMP), Tris(methylphenyl)phosphate (TMPP), tri-n-butyl phosphate (TNBP), tripentyl phosphate (TPEP), and triphenyl phosphate (TPHP), were selected in the present study (Table S3†). A total of 2058 data points measured from all the sampling sites were used to compare the logKP predictions of OPFRs based on the four models. More detail information on the sampling method, quality assurance and quality control can be found in Table S2†. The measured data used for modeling are displayed in Table S4†.
3. Results and discussion
3.1 Monitoring log![[thin space (1/6-em)]](https://www.rsc.org/images/entities/h3_char_2009.gif) KPvs. logKOA in ambient atmosphere
KPvs. logKOA in ambient atmosphere
The relationship between logKP and logKOA is an important descriptor of the G/P partitioning of SVOCs. According to the two logKOA thresholds (logKOA1 = 11.4 and logKOA2 = 12.5), the partitioning span could be divided into three domains: equilibrium (EQ) domain (logKOA ≤ 11.4), non-equilibrium (NE) domain (11.4 < logKOA < 12.5), and the maximum partition (MP) domain (logKOA ≥ 12.5).25 Fig. S1† displays the partition domains of the 13 OPFRs compounds in the sampling temperature range (0–30 °C) and simulated temperature range (−50–50 °C) according to their temperature-adjusted logKOA and the two logKOA thresholds. About 70.2% of the observed OPFR data were in the EQ domain, including those of TMP, TEP, TCEP, TIBP, TNBP, TCIPP, and TPEP at the sampling temperature. All the recorded TMPP data points were found to be distributed in the MP domain under the monitoring conditions. According to the steady state model, the logKP of TMPP will be a constant value in the MP domain. TDCIPP, TPHP, TBOEP were the EQ-NE domain compounds in the sampling temperature range. The logKP values of OPFRs ranged from −4.86 to 1.10 m3 μg−1, with a mean value ± standard deviation of −1.58 ± 1.17 m3 μg−1 and a median value of −1.58 m3 μg−1. The relationship regression equation between the logKP of the monitored OPFRs and their logKOA is shown in Fig. 1, with logKOA ranging from 4.7 for TMP to 14.2 for TMPP. After entering the MP domain, the logKP value should approach a constant according to the steady state theory. As shown in Fig. 1, the constant value of logKP (−1.21) observed for the OPFRs in the MP domain is close to the predicted logKP-LMY value of −1.53. The slope (mo) and intercept (bo) values from the log–log relationship between KP and KOA of the OPFRs were 0.09 and −2.58, respectively, revealing a much smoother curve than those of other SVOCs. For example, the slope and intercept of the logKPversus logKOA plot were 0.53 and −7.60 for PBDEs sampled in the Arctic,46 0.24 and −4.21 for organochlorine compounds sampled in west Antarctica,47 and 0.62 and −7.81 for PAHs sampled in China,48 respectively. Based on our previous study,49 the value of mo should lie between 0 and 1 depending on the values of logKOA under the steady state. The relationship between bo and mo when C equals 5 can be presented as bo = −11.38 × mo − 1.53. The bo value was calculated as −2.55 using the above equation, which is very close to the monitored bo value of −2.45, along with a measured mo of 0.09. The normality results of the Kolmogorov–Smirnov test revealed that the monitored logKP and logKOA data points did not follow a normal distribution. LogKP of the OPFRs positive correlated with logKOA (p < 0.05), with a Spearman correlation coefficient of 0.21. This suggests a non-linear relationship between the observed logKP and logKOA of the OPFRs.
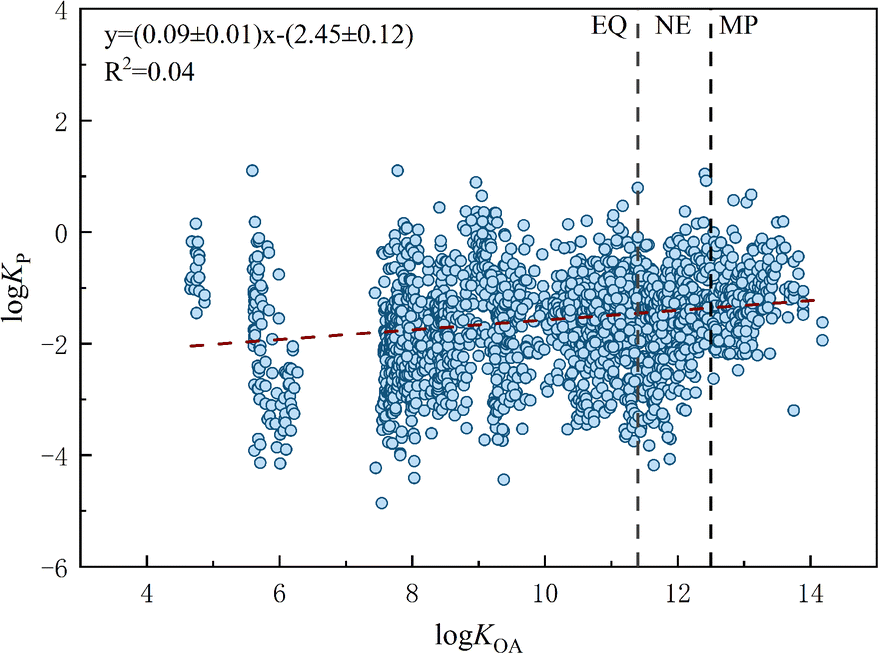 | ||
| Fig. 1 Monitoring of logKPvs. logKOA. | ||
3.2 Characteristics of logKP and φP obtained using the models and measured data
The prediction performance of these models (equilibrium models: H–B model, D–E model, J–P model; steady state model: L–M–Y model) were compared in terms of logKP and φP, respectively. As shown in Fig. 2, the absolute errors between the data predicted by the four models and the observed data (ΔlogKP = predicted logKP − measured logKP) were compared, respectively, for the 13 target OPFR compounds. The percentage of data points falling within the acceptable deviation range (ADR) was used to evaluate the prediction capability of these gas-particle distribution models. The ADR is defined as the region bounded by a deviation of ±1 (ADR: −1 ≤ ΔlogKP ≤ 1).28,29 As shown in Fig. 2, in the MP domain, the L–M–Y model showed a better performance, with 85.2% (with root mean square error (RMSE) = 0.68) of the monitored data points of the MP domain compounds (TMPP, THP, and TEHP) within the ADR. The other models (H–B model, D–E model and J–P model) tended to overestimate the logKP values of the OPFRs, with less than 33% of data points in the ADR. These results indicate that the logKP predicted using the L–M–Y model that considers logKOA and particle deposition agree well with the measured logKP values of TMPP, THP, and TEHP in the MP domain. In the NE domain, 78.6% (with RMSE = 0.82) of logKP-LMY data points belonging to 5 OPFRs compounds (THP, TEHP, TBOEP, TPHP, and TDCIPP) were within the ADR in comparison with 70.7% (with RMSE = 1.00) for logKP-HB, 68.7% (with RMSE = 1.03) for logKP-DE, and 19.4% (with RMSE = 1.83) for logKP-JP.
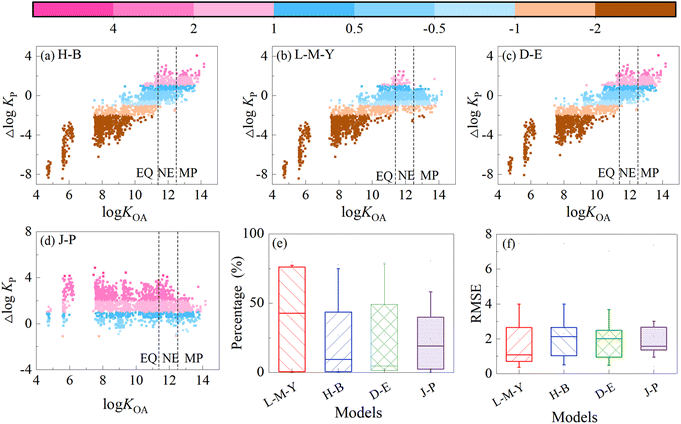 | ||
| Fig. 2 ΔlogKP predicted by the four models versus logKOA of the OPFRs: (a) H–B model; (b) L–M–Y model; (c) D–E model; (d) J–P model; (e) percentage of predicted data points within the ADR; (f) RMSE of the G/P partition models of OPFRs. The points in blue denote data points within the ADR. The points in pink and brown indicate that the predicted results overestimate and underestimate the measured data, respectively. | ||
As shown in Fig. 2, large deviations between the measured and predicted logKP of OPFRs were observed in the EQ domain. Furthermore, in the NE and MP domains, the L–M–Y model, which considers both logKOA and particle deposition in the GPP process (or temperature, Ao and Bo), showed acceptable performance in predicting logKP. Thus, logKOA (or temperature) and particle deposition might be the core factors that promote the mass transfer of OPFRs (TMPP, THP, TEHP, TBOEP, TPHP, and TDCIPP) between the gas and particle phases in the NE and MP domains.
The particle-bound fraction (φP) is a crucial parameter for characterizing the G/P partitioning of OPFRs. Fig. S2† presents the predicted φP values of OPFRs and measured values across the three partition domains. In the EQ domain, all four models tended to underestimate the φP values of OPFRs. In the NE domain, predictions from the steady state (L–M–Y) model aligned more closely with the measured results. The average φP value ± standard deviation (SD) for the monitored data was 0.52 ± 0.11, while that predicted by the steady state model was 0.56 ± 0.32 for THP, TEHP, TBOEP, TPHP, and TDCIPP. Within the MP domain, there was clear consistency between the measured data and φP predicted by the L–M–Y model for TMPP, THP, and TEHP, with monitored values at 0.72 ± 0.21 and predicted φP at 0.61 ± 0.07. Consequently, these results clearly demonstrate that the L–M–Y model provides better agreement with the monitored φP values of OPFRs, particularly within the NE and MP domains.
3.3 Effects of functional groups on the G/P partitioning of OPFRs
OPFRs are phosphoric-acid derivatives composed of phosphate radicals and three different groups, which can generally be divided into halogenated phosphate esters, aromatic phosphate esters and alkyl phosphate esters.5 Among the 13 organophosphorus flame retardants, there are 2 aryl-OPFRs (TMPP and TPHP), 3 chlorine-OPFRs (TCEP, TCIPP, and TDCIPP), and 8 alkyl-OPFRs (TMP, TEP, TIBP, TNBP, TPEP, THP, TEHP, and TBOEP). As shown in Fig. S3,† the measured particle-bound fractions of these 13 OPFR compounds are listed from left to right according to the molecular weight (from light to heavy), with the aryl-OPFRs in orange, chlorine-OPFRs in green and alkyl-OPFRs in blue. The mean particle-bound fractions of alkyl-OPFRs (TEP, TIBP, TNBP, TPEP, THP, TEHP) ranged from 0.30 for TIBP to 0.39 for TNBP, indicating that these six OPFR compounds were dominant in the gas phase, though the molecular weight increased from 182.2 for TEP to 434.6 for TEHP. This is consistent with the observed annual average φP value of 0.35 reported in a previous study.24 The distribution ratio of chlorine-OPFRs (TCEP, TCIPP, and TDCIPP) in both gaseous and particulate phases was equivalent, with the mean particulate-bound fraction approaching 0.50. TCEP and TCIPP were usually observed in remote areas, suggesting a potential long-range transport behavior. The average φP value of aryl-OPFRs (TMPP and TPHP) was 0.62, and the high-molecular-weight aryl-OPFR component TMPP had a larger proportion in the particle phase due to low vapor pressure and high octanol–air partition coefficients. These results indicate that the functional groups might affect the G/P partitioning process of OPFRs. For OPFR compounds with more branched chains and fewer functional groups, the monitoring φP values were generally low, such as those of TEHP, THP and TIBP. Interestingly, both TMP (alkyl-OPFR with low molecular weight) and TBOEP (alkyl-OPFR with high molecular weight) exhibited higher average φP values over 0.70. This discrepancy can be partially attributed to the probable sorption of gas-phase OPFRs to the filters during active air sampling.22 Another possible explanation is that OPFRs have better persistence and longer half-lives in the particle phase than in the gaseous phase, resulting in a higher proportion in the particle phase.3A comparison of logKP as a function of logKOA values predicted by the four models for the three OPFRs groups (2 aryl-OPFRs, 3 chlorine-OPFRs, and 8 alkyl-OPFRs) is presented along with the measured data in Fig. 3 and S4.† OPFR compounds with high molecular weights and high logKOA values were mainly distributed in the MP domain, such as the aryl-OPFR compound TMPP. The monitoring constant, logKP, values of TMPP, TEHP and THP were observed in the MP domain (Fig. 3(f), (e) and S4(g)†). The L–M–Y model presented better consistency with the measured logKP values of OPFRs in the ADR in the MP domain: 97.2% for the alkyl-OPFR compound TEHP, 76% for the aryl-OPFR molecule TMPP, and 100% for the alkyl-OPFR compound THP. In contrast, the other equilibrium models tended to overestimate the logKP values of TEHP, TMPP, and THP. Especially in the MP domain, the observed constant logKP values of OPFRs, including −1.51 ± 0.36 for TEHP, −1.16 ± 0.62 for TMPP, −1.45 ± 0.35 for THP, were close to the constant value (−1.53 ± 1) predicted by the L–M–Y model. In the NE domain, the L–M–Y model also demonstrated superior performance in predicting the G/P partition quotients for OPFRs, with 79.8% of the TEHP data points in the ADR (with RMSE = 0.81) in comparison with 60.1% (with RMSE = 1.14) for logKP-HB, 58.3% (with RMSE = 1.18) for logKP-DE, and 8.72% (with RMSE = 2.18) for logKP-JP. Comparing the prediction theories and results of these four models, the wet and dry deposition might be an important factor for better prediction performance of the L–M–Y model in NE and MP domain.
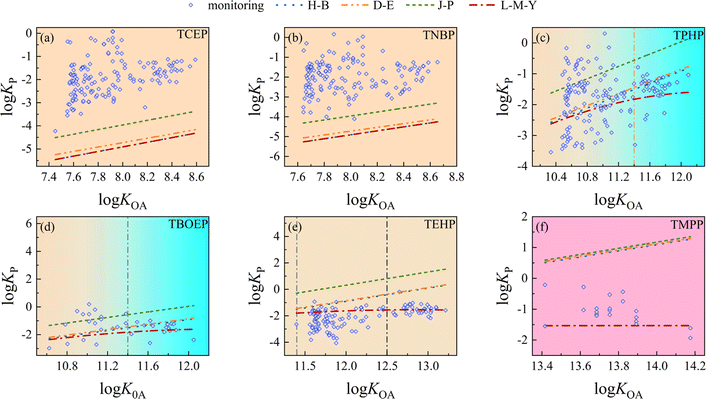 | ||
| Fig. 3 LogKP predicted by the four models vs. logKOA for 6 OPFR compounds: (a) TCEP; (b) TNBP; (c) TPHP; (d) TBOEP; (e) TEHP; (f) TMPP. (1) Chlorine-OPFR (TCEP), (2) aryl-OPFRs (TPHP and TMPP), and (3) alkyl-OPFRs (TNBP, TEHP, and TBOEP). | ||
3.4 Driving factors for deviations in GPP predictions of OPFRs
As mentioned above, large deviations were observed between the measured logKP and φP values of the OPFRs in the EQ domain and those predicted by the GPP models. These significant discrepancies may be attributed to sampling artifacts and some key influential factors that impact the GPP process of OPFRs, particularly the low-molecular-weight alkyl-OPFR compounds.50 However, the deviation may also be caused by atmospheric processes that are overlooked or not described by these models, such as photodegradation and photocatalysis. These atmospheric processes are influenced by meteorological parameters, including temperature, relative humidity, wind speed, atmospheric pressure, solar radiation, UV index, and OH radicals.51 In a previous study, temperature (R = 0.789, p < 0.01), humidity (R = 0.525, p < 0.01), solar radiation (R = 0.429, p < 0.01), wind speed (R = −0.456, p < 0.01), and atmospheric pressure (R = −0.634, p < 0.01) have been correlated with the gas-phase OPFR concentration.50 In previous research, the concentration of gaseous OPFRs has been found to have a significantly positive correlation with temperature and relative humidity.13 Higher relative humidity will cause the formation of liquid film covering the surface of the particle, which may disturb the interactions between the OPFRs and particle components via H-bonding or π–π bonding interactions.52 Greater wind speed is conducive to the diffusion, dilution and partition behavior of OPFRs.53 Hence, we analyzed the correlation between the influencing factors (logKOA, temperature, wind speed, and relative humidity) and the deviation of the results predicted by each model. The results show that the deviation of values predicted by these models has a significant correlation with logKOA (Table S5†). The deviations of the L–M–Y, H–B, and D–E models exhibit significant correlation with logKOA, temperature, and relative humidity, suggesting that these parameters might be the main factors influencing the deviation. Therefore, logKOA, temperature, and relative humidity are considered to be the main drivers of OPFR distribution in the particulate phase in the EQ domain.
As mentioned above, the L–M–Y model shows better consistency with the measured data in the NE and MP domains. Thus, the L–M–Y model was chosen as the basic model to develop an empirical steady state model. In the EQ domain, similar to the other models, the L–M–Y model also demonstrates a large deviation from the measured data of the OPFR compounds with strong volatility and low lipophilicity.
3.5 An empirical equation for G/P partitioning of OPFRs
To reduce the deviation, an empirical equation was developed in the EQ domain based on the steady state theory. Firstly, considering the significant correlation between the deviation and logKOA (R2 = 0.87, p < 0.05), a relationship between the L–M–Y model-predicted deviations and logKOA in the EQ domain was obtained as a linear regression:| ΔlogKP = 0.961logKOA − 10.68 (EQ domain) | (11) |
Secondly, by combining eqn (3) and (11), the empirical equation in the EQ domain could be written as
| logKP = 0.039logKOA + logfOM + logα − 1.23 | (12) |
The percentage of measured data within the ADR of prediction increased from 23.1% in the original steady state model to 65.0% using the new empirical equation (eqn (12)), decreasing the impact coefficient of logKOA from 1 to 0.039.
Furthermore, the Pearson correlation statistical method was applied for variable selection. Thus, logKOA, relative humidity, and temperature might also be the reasons for data deviation in the EQ domain. A five-fold cross validation was adopted in modeling and validation to ensure the reliability and generalization ability of the model. The monitored data set used for modeling was randomly divided into five equally sized subsets, followed by 5 modeling and validation processes. Four subsets were selected as the modeling sets, and one subset was selected as the validation set each time. Considering these three parameters, a multilinear regression method was employed to establish the deviation equation for the OPFRs in the EQ domain using SPSS.22.0. In the established equations, the P-values of relative humidity were higher than 0.05. Therefore, logKOA and temperature were considered as the main factors to reconstruct the equations using the above method. Five equations were derived to describe ΔlogKP based on logKOA and temperature. The R2 values of the five equations were 0.750, 0.747, 0.755, 0.762, and 0.754, respectively. The P values were lower than 0.01. Finally, deviation of the data predicted by the L–M–Y model in the EQ domain improved:
| ΔlogKP = (0.966 ± 0.007)logKOA + (0.011 ± 0.001)T − (10.961 ± 0.062) | (13) |
Then, the empirical prediction equation was improved:
| logKP = 0.034logKOA + logfOM + logα − 0.011T − 0.949 | (14) |
As mentioned above, overestimation of the contribution of logKOA and temperature is the main reason for the large deviation observed in the values predicted in the EQ domain. As shown in eqn (14), wet and dry deposition, organic matter, and temperature could affect the G/P partition of OPFRs. Based on the characteristics of individual OPFRs, chlorinated OPFRs are more resistant to degradation than non-chlorinated compounds. Low-molecular-weight OPFRs (TEP and TPP) are expected to evaporate more readily than polymeric compounds and be less-associated with airborne particulate matter.54 Some high-molecular-weight OPFRs containing benzene rings, such as TMPP, usually have good thermal and hydrolytic stability and high logKOA values, and they are usually distributed in the particular phase at higher concentrations.24,42
In addition to the factors mentioned above, the gas particle partitioning behavior of OPFRs can be influenced by other environmental factors, such as solar radiation, UV index, and OH radicals.51 OPFRs can be preferentially removed from the atmosphere by photooxidation. If the reactivity of OPFRs is related to their molecular weight, photooxidation may explain the observed OPFR partition behavior.55
Then, the ADR of the improved empirical equation (eqn (14)) contained 75.8 ± 3.4% of the measured data points, as shown in Fig. 4, which represents a 10.8% increase compared with eqn (12) and a 52.7% increase compared with the original steady state model. The RMSE was 2.84 ± 0.04 for the improved empirical equation, in contrast to 4.52 ± 0.94 for the original steady state model. Therefore, eqn (14) can be considered the empirical equation for the G/P partitioning of OPFRs in the EQ domain.
 | ||
| Fig. 4 Percentage of data points in the ADRs of the steady state model and the new empirical equation. | ||
As shown in a previous article, wet and dry deposition are non-ignorable determining processes in the G/P partitioning of SVOCs, such as PBDEs,28 OCPs,33 and PCBs.35 In this work, an empirical equation without considering particle deposition was also derived, and the percentage of measured data points in the ADR was obviously lower than that obtained using eqn (14). Therefore, wet and dry deposition could also be an important factor for the G/P partitioning of OPFRs in the EQ domain.
Organic matter constitutes an important part of atmospheric particulate matter. According to eqn (14), the variation curves of logKP with logKOA at different organic matter concentrations are presented in Fig. S5.† As shown in Fig. S5,† the logKP values of the OPFRs increased with an increase in fom in the whole EQ domain. When logKOA < 10, the logKP of OPFRs increased nearly by 1 log unit as fom increased from 0.1 to 0.9. When 10 < logKOA < 11.4, the logKP values of OPFRs increased slightly about 0.25, with the increase of fom from 0.1 to 0.9. Thus, organic matter is also a crucial factor that influenced the G/P partitioning of OPFRs in the equilibrium domain.
In the EQ domain, inflection points of logKPvs. logKOA of the OPFRs were observed in Fig. S5.† These inflection points mainly occurred at logKOA values between 9.5 and 11.4. When logKOA was below the inflection point, logKP exhibited an increasing trend with respect to an increase in logKOA. Conversely, logKP decreased as logKOA increased. Furthermore, the value of fom also affected the occurrence of these inflection points. The larger the fom, the smaller the logKOA value at the inflection point. That is, the larger the fom, the higher the temperature at which the inflection point appeared. This is an interesting discovery. The underlying reasons also warrant further investigations in the future to provide comprehensive answers.
4. Conclusions
The G/P partitioning of OPFRs in the atmosphere controls their atmospheric behaviors, such as long-range transport, as well as wet and dry deposition. In order to identify the key influencing factors and describe the OPFR gas/particle partition process more accurately, the characteristics of G/P partitioning of OPFRs were investigated by comparing the measured data and values predicted using four G/P partitioning models. Large deviations were observed between the measured logKP and values predicted by these models in the EQ domain. The results indicated that in the MP domain, a constant value of logKP (−1.21) was observed for the OPFRs, which is close to the predicted logKP-LMY value of −1.53. The steady state model shows some advantages on predicting the logKP of OPFRs with 85.2% of data points in ADR and φP close to the measured data in the MP domain. The deviation between the steady state model and measured data could be a function of logKOA and temperature. A new empirical equation was derived to achieve better consistency between the predicted and monitored data, and the percentage of data points in the ADR increased from 23.1% to 75.8% in the EQ domain. These results demonstrate that wet and dry deposition could also be an important process for the GPP of OPFRs in the EQ domain. The higher fOM value will lead to a higher logKP value for OPFRs in the EQ domain, provided that all other conditions remain constant. Inflection points of logKP with respect to logKOA of the OPFRs have also been predicted in the EQ domain. Further research is required to discover the reasons behind the appearance of these inflection points.
Data availability
Data are available from the authors upon request.Author contributions
Man Li collected data and wrote the manuscript. Wenhao Hou collected and checked data, analysed and revised the manuscript. Lina Qiao designed, wrote and revised the manuscript. Hong Zhang revised the manuscript. Mengdan Wang analysed data. Yonghui Wen analysed data. Zejiang Jia analysed data.Conflicts of interest
There are no conflicts to declare.Acknowledgements
This work was supported by the National Natural Science Foundation of China (No.42307472), the Natural Science Foundation of Shandong Province (No. ZR2021QD149). We also thank Prof. Yi-Fan Li and Prof. Wan-Li Ma for their valuable suggestions.References
- J. W. Yang, Y. Y. Zhao, M. H. Li, M. J. Du, X. X. Li and Y. Li, A Review of a Class of Emerging Contaminants: The Classification, Distribution, Intensity of Consumption, Synthesis Routes, Environmental Effects and Expectation of Pollution Abatement to Organophosphate Flame Retardants (OPFRs), Int. J. Mol. Sci., 2019, 20, 2874–2912 CrossRef CAS.
- P. Luo, L. J. Bao, F. C. Wu, S. M. Li and E. Y. Zeng, Health Risk Characterization for Resident Inhalation Exposure to Particle-Bound Halogenated Flame Retardants in a Typical E-Waste Recycling Zone, Environ. Sci. Technol., 2014, 48, 8815–8822 CrossRef CAS.
- R. Sühring, M. Scheringer, T. Rodgers, L. M. Jantunen and M. L. Diamond, Evaluation of the OECD POV and LRTP screening tool for estimating the long-range transport of organophosphate esters, Environ. Sci.:Processes Impacts, 2020, 22, 207–216 RSC.
- G. L. Wei, D. Q. Li, M. N. Zhuo, Y. S. Liao, Z. Y. Xie, T. L. Guo, J. J. Li, S. Y. Zhang and Z. Q. Liang, Organophosphorus flame retardants and plasticizers: Sources, occurrence, toxicity and human exposure, Environ. Pollut., 2015, 196, 29–46 CrossRef CAS.
- A. Moller, R. Sturm, Z. Y. Xie, M. H. Cai, J. F. He and R. Ebinghaus, Organophosphorus Flame Retardants and Plasticizers in Airborne Particles over the Northern Pacific and Indian Ocean toward the Polar Regions: Evidence for Global Occurrence, Environ. Sci. Technol., 2012, 46, 3127–3134 CrossRef PubMed.
- A. Moller, R. Sturm, Z. Xie, M. Cai, J. He and R. Ebinghaus, Organophosphorus Flame Retardants and Plasticizers in Airborne Particles over the Northern Pacific and Indian Ocean toward the Polar Regions: Evidence for Global Occurrence, Environ. Sci. Technol., 2012, 46(6), 3127–3134 CrossRef PubMed.
- U.-J. Kim and K. Kannan, Occurrence and Distribution of Organophosphate Flame Retardants/Plasticizers in Surface Waters, Tap Water, and Rainwater: Implications for Human Exposure, Environ. Sci. Technol., 2018, 52(10), 5625–5633 CrossRef CAS PubMed.
- Y. Ma, Z. Xie, R. Lohmann, W. Mi and G. Gao, Organophosphate Ester Flame Retardants and Plasticizers in Ocean Sediments from the North Pacific to the Arctic Ocean, Environ. Sci. Technol., 2017, 51(7), 3809–3815 CrossRef CAS.
- S. H. Brandsma, P. E. G. Leonards, H. A. Leslie and J. de Boer, Tracing organophosphorus and brominated flame retardants and plasticizers in an estuarine food web, Sci. Total Environ., 2015, 505, 22–31 CrossRef CAS.
- R. Sühring, M. L. Diamond, M. Scheringer, F. Wong, M. Pućko, G. Stern, A. Burt, H. Hung, P. Fellin, H. Li and L. M. Jantunen, Organophosphate Esters in Canadian Arctic Air: Occurrence, Levels and Trends, Environ. Sci. Technol., 2016, 50, 7409–7415 CrossRef.
- J. Li, Z. Xie, W. Mi, S. Lai, C. Tian, K. C. Emeis and R. Ebinghaus, Organophosphate Esters in Air, Snow, and Seawater in the North Atlantic and the Arctic, Environ. Sci. Technol., 2017, 51(12), 6887–6896 CrossRef CAS.
- S. D. Xie and X. X. Tian, Formation Mechanism of Secondary Organic Aerosols from the Reaction of Volatile and Semi-Volatile Compounds, Prog. Chem., 2010, 22, 727–733 CAS.
- W. Zhang, P. Wang, Y. Li, D. Wang, J. Matsiko, R. Yang, H. Sun, Y. Hao, Q. Zhang and G. Jiang, Spatial and temporal distribution of organophosphate esters in the atmosphere of the Beijing-Tianjin-Hebei region, China, Environ. Pollut., 2019, 244, 182–189 CrossRef CAS.
- D. Liu, T. Lin, K. Shen, J. Li, Z. Yu and G. Zhang, Occurrence and Concentrations of Halogenated Flame Retardants in the Atmospheric Fine Particles in Chinese Cities, Environ. Sci. Technol., 2016, 50, 9846–9854 CrossRef CAS PubMed.
- Y. Ou, Developments of organic phosphorus flame retardant industry in China, Chem. Ind. Eng. Prog., 2011, 30, 210–215 Search PubMed.
- Q. Zhu, X. Zhang, S. Dong, G. Liu, L. Gao and M. Zheng, Progress on the gas/particle partitioning of persistent organic pollutants in atmosphere, Environ. Chem., 2014, 33, 1629–1636 CAS.
- B. Yaman, Y. Dumanoglu and M. Odabasi, Measurement and Modeling the Phase Partitioning of Organophosphate Esters Using Their Temperature-Dependent Octanol-Air Partition Coefficients and Vapor Pressures, Environ. Sci. Technol., 2020, 54, 8133–8143 CrossRef CAS.
- S. Zhao, L. Tian, Z. Zou, X. Liu and G. Zhang, Probing Legacy and Alternative Flame Retardants in the Air of Chinese Cities, Environ. Sci. Technol., 2021, 55, 9450–9459 CrossRef CAS.
- J. Li, J. Tang, W. Mi, C. Tian, K. C. Emeis, R. Ebinghaus and Z. Xie, Spatial Distribution and Seasonal Variation of Organophosphate Esters in Air above the Bohai and Yellow Seas, China, Environ. Sci. Technol., 2018, 52, 89–97 CrossRef CAS.
- L. Pang, H. Liu, H. Yang, R. Pang and J. Liu, Seasonal variation and affecting factors of organophosphate esters in particulate matter in air: a comparison between measured data and model predictions, Environ. Sci. Pollut. Res., 2021, 28, 36669–36679 CrossRef CAS PubMed.
- Q. Liu, J. Liggio, K. Li, P. Lee and S. M. Li, Understanding the Impact of Relative Humidity and Coexisting Soluble Iron on the OH-Initiated Heterogeneous Oxidation of Organophosphate Flame Retardants, Environ. Sci. Technol., 2019, 53, 6794–6803 CrossRef CAS PubMed.
- J. O. Okeme, T. Rodgers, L. M. Jantunen and M. L. Diamond, Examining the Gas-Particle Partitioning of Organophosphate Esters (OPEs): How Reliable are Air Measurements?, Environ. Sci. Technol., 2018, 52(23), 13834–13844 CrossRef CAS.
- Y. Wang, M. Bao, F. Tan, Z. Qu, Y. Zhang and J. Chen, Distribution of organophosphate esters between the gas phase and PM(2.5) in urban Dalian, China, Environ. Pollut., 2020, 259, 113882 CrossRef CAS.
- L. Zhang, W. Xu, W. Mi, W. Yan, T. Guo, F. Zhou, L. Miao and Z. Xie, Atmospheric deposition, seasonal variation, and long-range transport of organophosphate esters on Yongxing Island, South China Sea, Sci. Total Environ., 2022, 806, 150673–150682 CrossRef CAS.
- Y. F. Li, W. L. Ma and M. Yang, Prediction of gas/particle partitioning of polybrominated diphenyl ethers (PBDEs) in global air: A theoretical study, Atmos. Chem. Phys., 2015, 15, 1669–1681 CrossRef CAS.
- T. Harner and T. F. Bidleman, Octanol-air partition coefficient for describing particle/gas partitioning of aromatic compounds in urban air, Environ. Sci. Technol., 1998, 32, 1494–1502 CrossRef CAS.
- M. Yang, Y. F. Li, L. N. Qiao and X. M. Zhang, Estimating subcooled liquid vapor pressures and octanol-air partition coefficients of polybrominated diphenyl ethers and their temperature dependence, Sci. Total Environ., 2018, 628, 329–337 CrossRef.
- L. N. Qiao, P. T. Hu, R. Macdonald, K. Kannan, A. Nikolaev and Y. F. Li, Modeling gas/particle partitioning of polybrominated diphenyl ethers (PBDEs) in the atmosphere: A review, Sci. Total Environ., 2020, 729, 138962 CrossRef CAS.
- Y.-F. Li, L.-N. Qiao, N.-Q. Ren, E. Sverko, D. Mackay and R. W. Macdonald, Decabrominated Diphenyl Ethers (BDE-209) in Chinese and Global Air: Levels, Gas/Particle Partitioning, and Long-Range Transport: Is Long-Range Transport of BDE-209 Really Governed by the Movement of Particles?, Environ. Sci. Technol., 2017, 51, 1035–1042 CrossRef CAS PubMed.
- W.-L. Li, C.-Y. Huo, L.-Y. Liu, W.-W. Song, Z.-F. Zhang, W.-L. Ma, L.-N. Qiao and Y.-F. Li, Multi-year air monitoring of legacy and current-use brominated flame retardants in an urban center in northeastern China, Sci. Total Environ., 2016, 571, 633–642 CrossRef CAS.
- W. L. Li, L. Y. Liu, W. W. Song, Z. F. Zhang, L. N. Qiao, W. L. Ma and Y. F. Li, Five-year trends of selected halogenated flame retardants in the atmosphere of Northeast China, Sci. Total Environ., 2016, 539, 286–293 CrossRef CAS.
- R. Cao, H. Zhang, L. Zhao, Y. Zhang, N. Geng, M. Teng, L. Zou, Y. Gao, Y. Ni, Q. Fu and J. Chen, Hazy Weather-Induced Variation in Environmental Behavior of PCDD/Fs and PBDEs in Winter Atmosphere of A North China Megacity, Environ. Sci. Technol., 2018, 52, 8173–8182 CrossRef CAS PubMed.
- L. N. Qiao, Z. F. Zhang, L. Y. Liu, W. W. Song, W. L. Ma, N. Z. Zhu and Y. F. Li, Measurement and modeling the gas/particle partitioning of organochlorine pesticides (OCPs) in atmosphere at low temperatures, Sci. Total Environ., 2019, 667, 318–324 CrossRef CAS.
- L. Jiang, W. Gao, X. D. Ma, Y. J. Wang, C. Wang, Y. M. Li, R. Q. Yang, J. J. Fu, J. B. Shi, Q. H. Zhang, Y. W. Wang and G. B. Jiang, Long-Term Investigation of the Temporal Trends and Gas/Particle Partitioning of Short- and Medium-Chain Chlorinated Paraffins in Ambient Air of King George Island, Antarctica, Environ. Sci. Technol., 2021, 55, 230–239 CrossRef CAS PubMed.
- L. N. Qiao, W. L. Ma, L. Y. Liu, Z. F. Zhang, W. W. Song, H. L. Jia, A. N. Nikolaev, R. W. Macdonald and Y. F. Li, Particle/gas partitioning behavior of polychlorinated biphenyls (PCBs) in global atmosphere: Equilibrium or steady state?, Atmos. Environ., 2022, 270, 118926 CrossRef CAS.
- J. F. Pankow, Review and comparative-analysis of the theories on partitioning between the gas and aerosol particulate phases in the atmosphere, Atmos. Environ., 1987, 21, 2275–2283 CrossRef CAS.
- T. F. Bidleman, Atmospheric processes - wet and dry deposition of organic-compounds are controlled by their vapor particle partitioning, Environ. Sci. Technol., 1988, 22, 361–367 CrossRef CAS.
- T. Harner and T. F. Bidleman, Measurement of OctanolAir Partition Coefficients for Polycyclic Aromatic Hydrocarbons and Polychlorinated Naphthalenes, J. Chem. Eng. Data, 1998, 43, 40–46 CrossRef CAS.
- S. Z. Zhao, L. L. Tian, Z. H. Zou, X. Liu, G. C. Zhong, Y. Z. Mo, Y. Wang, Y. K. Tian, J. Li, H. Guo and G. Zhang, Probing Legacy and Alternative Flame Retardants in the Air of Chinese Cities, Environ. Sci. Technol., 2021, 55, 9450–9459 CrossRef CAS PubMed.
- W. W. Zhang, P. Wang, Y. M. Li, D. Wang, J. Matsiko, R. Q. Yang, H. Z. Sun, Y. F. Hao, Q. Zhang and G. B. Jiang, Spatial and temporal distribution of organophosphate esters in the atmosphere of the Beijing-Tianjin-Hebei region, China, Environ. Pollut., 2019, 244, 182–189 CrossRef CAS.
- Y. X. Ma, Y. C. Luo, J. C. Zhu, J. H. Zhang, G. P. Gao, W. Y. Mi, Z. Y. Xie and R. Lohmann, Seasonal variation and deposition of atmospheric organophosphate esters in the coastal region of Shanghai, China, Environ. Pollut., 2022, 300, 118930 CrossRef CAS.
- L. L. Zhang, W. H. Xu, W. Y. Mi, W. Yan, T. F. Guo, F. H. Zhou, L. Miao and Z. Y. Xie, Atmospheric deposition, seasonal variation, and long-range transport of organophosphate esters on Yongxing Island, South China Sea, Sci. Total Environ., 2022, 806, 150673 CrossRef CAS.
- C. Wang, P. Wang, J. P. Zhao, M. Fu, L. Zhang, Y. M. Li, R. Q. Yang, Y. Zhu, J. J. Fu, Q. H. Zhang and G. B. Jiang, Atmospheric organophosphate esters in the Western Antarctic Peninsula over 2014-2018: Occurrence, temporal trend and source implication, Environ. Pollut., 2020, 267, 115428 CrossRef CAS PubMed.
- W. H. Li, Y. Wang and K. Kannan, Occurrence, distribution and human exposure to 20 organophosphate esters in air, soil, pine needles, river water, and dust samples collected around an airport in New York state, United States, Environ. Int., 2019, 131, 105054 CrossRef CAS PubMed.
- A. Moller, Z. Y. Xie, A. Caba, R. Sturm and R. Ebinghaus, Organophosphorus flame retardants and plasticizers in the atmosphere of the North Sea, Environ. Pollut., 2011, 159, 3660–3665 CrossRef PubMed.
- X. D. Ma, Z. Wang, L. M. Yu, W. J. Yao, L. Xiao, Z. W. Yao, G. S. Na, Y. W. W. Wang and G. B. Jiang, Mirror image between gas-particle partitioning and soil-moss distribution of polybrominated diphenyl ethers in the polar regions, Sci. Total Environ., 2019, 656, 1199–1206 CrossRef CAS PubMed.
- P. Wang, W. Meng, Y. Li, Q. Zhang, L. Zhang, J. Fu, R. Yang and G. Jiang, Temporal variation (2011–2014) of atmospheric OCPs at King George Island, west Antarctica, Atmos. Environ., 2018, 191, 432–439 CrossRef CAS.
- F.-J. Zhu, S.-Z.-L. Arina, Z.-F. Zhang, L.-Y. Liu, W.-W. Song, Y. Cheng, J.-M. Liu and W.-L. Ma, Non-equilibrium influence on G/P partitioning of PAHs: Evidence from the diurnal and nocturnal variation, Chemosphere, 2022, 294, 133722 CrossRef CAS.
- L. N. Qiao, W. L. Ma, Z. F. Zhang, L. Y. Liu, W. W. Song, H. L. Jia, N. Z. Zhu, W. L. Li, R. W. Macdonald, A. Nikolaev and Y. F. Li, Slopes and intercepts from log-log correlations of gas/particle quotient and octanol-air partition coefficient (vapor-pressure) for semi-volatile organic compounds: II. Theoretical predictions vs. monitoring, Chemosphere, 2021, 273, 128860 CrossRef CAS PubMed.
- H.-C. Kung, Y.-K. Hsieh, B.-W. Huang, N. K. Cheruiyot and G.-P. Chang-Chien, An Overview: Organophosphate Flame Retardants in the Atmosphere, Aerosol Air Qual. Res., 2022, 22, 220148 CrossRef CAS.
- C. M. G. Salvador, A. D. Alindajao, K. B. Burdeos, M. A. M. Lavapiez, J. R. Yee, A. T. Bautista Vii, P. C. B. Pabroa and R. Y. Capangpangan, Assessment of Impact of Meteorology and Precursor in Long-term Trends of PM and Ozone in a Tropical City, Aerosol Air Qual. Res., 2022, 22, 210269 CrossRef CAS.
- Y. Deng, W. Xu, Q. Zeng, F. Sun, F. Wang and Y. Li, Effects of temperature and relative humidity on soil−air partition coefficients of organophosphate flame retardants and polybrominated diphenyl ethers, Chemosphere, 2022, 291, 132716 CrossRef CAS.
- A. El-Maradny, K. T. Rasiq, A. Turki, Y. A. Shaban, M. Ghandourah and M. Orif, Polycyclic aromatic hydrocarbons volatilized from two polluted lagoons on Red Sea east coast: levels, sources, meteorological effects, and gas-particle partitioning, Environ. Forensics, 2021, 22, 108–119 CrossRef CAS.
- N. Van den Eede, A. C. Dirtu, N. Ali, H. Neels and A. Covaci, Multi-residue method for the determination of brominated and organophosphate flame retardants in indoor dust, Talanta, 2012, 89, 292–300 CrossRef CAS.
- T. Tang, G. N. Lu, W. J. Wang, R. Wang, K. B. Huang, Z. Y. Qiu, X. Q. Tao and Z. Dang, Photocatalytic removal of organic phosphate esters by TiO2: Effect of inorganic ions and humic acid, Chemosphere, 2018, 206, 26–32 CrossRef CAS PubMed.
Footnotes |
| † Electronic supplementary information (ESI) available. See DOI: https://doi.org/10.1039/d4em00531g |
| ‡ Contributed equally as the first author. |
| This journal is © The Royal Society of Chemistry 2025 |