 Open Access Article
A reversed gas diffusion electrode enables collection of high purity gas products from CO2 electroreduction†
Bo
Wu‡
ab,
Lakshmi Devi
Voleti‡
a,
Aidan Q.
Fenwick
cd,
Chao
Wu
e,
Jiguang
Zhang
ab,
Ning
Ling
a,
Meng
Wang
ab,
Yuewen
Jia
a,
Weng Weei
Tjiu
 b,
Mingsheng
Zhang
b,
Zainul
Aabdin
b,
Mingsheng
Zhang
b,
Zainul
Aabdin
 b,
Shibo
Xi
e,
Channamallikarjun S.
Mathpati
f,
Sui
Zhang
a,
Harry A.
Atwater
 cg,
Iftekhar A.
Karimi
 a and
Yanwei
Lum
 *ab
*ab
aDepartment of Chemical and Biomolecular Engineering, National University of Singapore, Singapore, 117585, Republic of Singapore. E-mail: lumyw@nus.edu.sg
bInstitute of Materials Research and Engineering (IMRE), Agency for Science, Technology and Research (A*STAR), 2 Fusionopolis Way, Innovis #08-03, Singapore, 138634, Republic of Singapore
cLiquid Sunlight Alliance, California Institute of Technology, Pasadena, California, USA
dDepartment of Chemistry and Chemical Engineering, California Institute of Technology, Pasadena, California, USA
eInstitute of Sustainability for Chemicals, Energy and Environment (ISCE2), Agency for Science, Technology and Research (A*STAR), 1 Pesek Road, Singapore, 627833, Republic of Singapore
fDepartment of Chemical Engineering, Institute of Chemical Technology, Matunga, Mumbai, India
gDepartment of Applied Physics and Materials Science, California Institute of Technology, Pasadena, California, USA
First published on 14th January 2025
Abstract
Electrochemical CO2 reduction (CO2R) in conventional systems typically generates highly diluted product output streams. This necessitates energy intensive and costly product separation, which potentially decreases the feasibility and economic viability of the process. Here, we describe the design and fabrication of a reversed gas diffusion electrode, which makes use of electrolyte pressure to channel products toward a collection chamber. Importantly, this strategy successfully excludes CO2 and permits gas products to be siphoned off at high purity. We further show that the electrolyte pressure and gas diffusion layer pore size are the key factors which govern the product collection efficiency. Using a nanoporous Au catalyst, we showcase the continuous production of high purity syngas over an extended 76 h period, operating at a full-cell energy efficiency of 37%. Importantly, we also demonstrate that this system is oxygen-tolerant, with no parasitic loss of current towards the oxygen reduction reaction even with a 95% CO2 + 5% O2 gas feed. Taken together, our results introduce a new design approach for CO2R electrolyzer systems.
Broader contextElectrochemical CO2 reduction (CO2R), if powered by renewable electricity, offers a route to net-zero-emission production of value-added chemicals and fuels. A crucial challenge is that the product output is typically very dilute and consists mostly of unreacted CO2. There is therefore a need for costly and energy intensive product separation, which potentially lowers the feasibility and economic viability of the process. Here, we report the design of a ‘reversed’ gas diffusion electrode that successfully enables the continuous generation and collection of high purity gas products. We also demonstrate that our system is capable of oxygen-tolerant CO2R. This is important because industrially relevant waste CO2 streams likely contain significant amounts of O2 impurities. |
Introduction
Due to a continuous increase in global energy demands, it has been projected that CO2 emissions will triple by 2040.1,2 This has led to serious climate change concerns and spurred interest in developing technologies that can efficiently harvest and store renewable energy.3,4 To this end, electrochemical CO2 reduction (CO2R) offers a promising and viable pathway towards the sustainable production of important chemicals and fuels.5–7 If powered by renewable energy sources such as wind and solar, this can help to close the carbon cycle and reduce our overreliance on fossil fuels.8–10Motivated by the need to progress CO2R towards economic viability, recent technoeconomic assessments have identified the key cost contributors to produce molecules such as ethylene,6,11,12 formic acid13–15 and carbon monoxide.16–19 As a result, the majority of studies in the literature focus on developing electrocatalysts with improved faradaic efficiency, current density and energy efficiency.20–23 Besides these performance metrics, separation costs have also been highlighted as a major cost component. For instance, the pressure swing adsorption process that is required to produce carbon monoxide constitutes more than 60% of capital costs.24 There is therefore significant interest in designing CO2R electrolyzer systems that can generate products at high purity to bring down production costs.
For this purpose, Wang and co-workers have developed CO2R electrolyzer systems with porous solid-state electrolytes to output pure concentrated liquid product streams.7,13,25–27 Although this strategy has seen great success, there has not yet been a comparable system to generate gas products at high purity. This is challenging because the CO2 reactant quickly mixes with any generated gas product molecules. Hence, the product output stream is typically very dilute and consists mostly of unreacted CO2.28–30
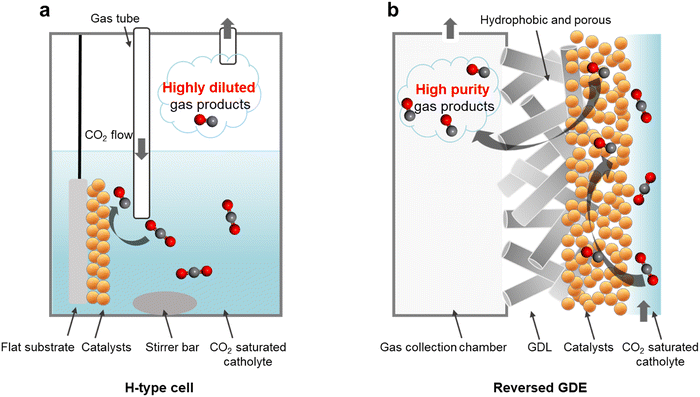
For instance, in a conventional H-type cell configuration (Fig. 1a),31 CO2 is introduced into the reactor by continuous bubbling to maintain a CO2 saturated aqueous electrolyte.32–34 To promote CO2 mass transport to the catalyst surface, a means of forced convection via magnetic stirring is typically included in the system. CO2 conversion then takes place on the catalyst surface, which could for example consist of metal nanoparticles coated onto a conductive substrate such as glassy carbon. In such a configuration, any generated gas product molecules will quickly mix with the CO2 reactant, thus forming a highly diluted output stream.
We postulate that during electrolysis, gas products could nucleate on the catalyst surface with high purity, without significant mixing with CO2. Such a scenario could be possible because regions of high activity on the catalyst surface should in principle be locally depleted of CO2.35 This is due to continuous consumption of CO2 to generate products as well as the expected highly alkaline local pH environment. Corroborating our hypothesis is recent work by Berlinguette and co-workers, where optical coherence tomography imaging revealed the appearance of discrete CO gas product bubbles on the catalyst surface that did not instantly mix with the CO2 reactant.36 Importantly, this presents a window of opportunity to collect these gas product molecules at high purity, provided if a suitable strategy could be developed.
Motivated by this, we reasoned that replacing the flat substrate with a porous hydrophobic membrane could offer an effective collection method (Fig. 1b). One side of the hydrophobic membrane would be coated with the catalyst and the other side would face a gas collection chamber (see Fig. S1, ESI†) at atmospheric pressure.33 The generated gas product molecules would then be driven by the electrolyte pressure through the hydrophobic pores and into the collection chamber.37,38 The system setup configuration is therefore identical to a conventional gas diffusion electrode (GDE) flow cell39,40 (Fig. S2, ESI†). However, in our case the reactant is delivered to the catalyst by saturating the electrolyte with CO2 rather than flowing it through the gas chamber. As such, we term our operating mode as a ‘reversed’ GDE.
Here, we report that this reversed GDE configuration is capable of generating high purity gas products. Importantly, we find that this strategy successfully excludes CO2 and permits gas products to be siphoned off at high purity. We further show that the electrolyte pressure and GDE pore size are key factors that influence the product collection efficiency. Electrolyte pressure is the driving force for gas transportation through the GDE and into the collection chamber. We believe that the expected local alkaline pH and continuous CO2 consumption also helps suppress CO2 flow to the gas chamber, allowing us to collect gas products with high purity. Using a nanoporous Au catalyst,41,42 we demonstrate continuous production of high purity syngas over an extended 76 h period. Finally, we show that this system can operate effectively even with CO2 feedstock that contains significant amounts of O2 impurities.
Results and discussion
We began by selecting porous hydrophobic polytetrafluoroethylene (PTFE) membranes as the substrate of choice for our reversed GDEs (Fig. S3–S5, ESI†). These substrates are identical to those previously employed by Sargent and co-workers to construct conventional GDEs for CO2R.11 Magnetron sputtering was used to deposit 300 nm of Au onto the PTFE substrates with a range of different pore sizes43 from 0.02, 0.1, 0.45, 1.0 and 3.0 μm. Throughout this work, we will refer to these GDEs as Au/PTFE(X), where X is the pore size in μm. Unless otherwise stated, all CO2R experiments in this work were performed in the reversed GDE mode.Firstly, we performed CO2R with Au/PTFE(0.45) through a range of current densities (20–140 mA cm−2) using CO2 saturated 1.0 M KHCO3 electrolyte. Before starting each experiment, the gas collection chamber was purged for at least 10 min with N2 to flush out any air. The flow of N2 was discontinued during the experiment and the gas chamber outlet was vented to the atmosphere. For all current densities, we observed the continuous outflow of gas product from the collection chamber (Video S1 and Fig. S6, ESI†). This indicates that gas product molecules are indeed permeating through the GDE and successfully collected. We qualitatively analyzed the output gas at 80 mA cm−2 using gas chromatography (GC) and observed the presence of only CO and H2 peaks (Fig. S7, ESI†). Importantly, this indicates that our gas output is indeed of high purity, without significant mixing with the CO2 reactant.
To evaluate the CO2R FE, we repeated these experiments with Au/PTFE(0.45) using N2 flow (Fig. S8, ESI†) in the collection chamber. N2 flow was included in these experiments in order to dilute the gas product concentration for quantitative GC analysis. From the results, we found that at current densities above 80 mA cm−2, there is a significant amount of missing FE (Fig. S9a and Table S3, ESI†). This coincides with the appearance of bubbles in the electrolyte, which can be visibly observed in the flow tubing. These observations strongly indicate that a considerable portion of the generated gas product is not being collected.
To study this further, we monitored the catalyst surface using an immersion optical microscope at a current density of 60 mA cm−2 and 100 mA cm−2. At 60 mA cm−2, we did not observe any bubbles on the catalyst surface (Video S2 and Fig. S10, ESI†). However, at 100 mA cm−2 we started to observe the growth and release of bubbles from the catalyst surface (Video S3 and Fig. S11, ESI†). These findings imply that there is a limit to the gas product collection flux, which if exceeded leads to loss of gas product as bubbles to the electrolyte stream.
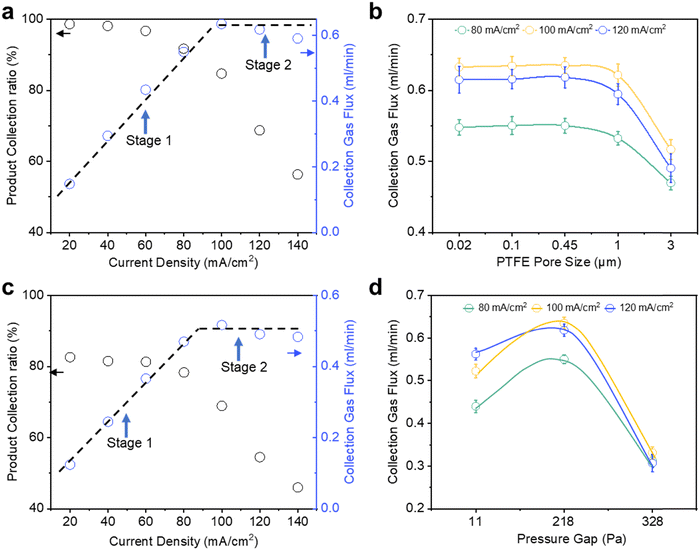
For each current density tested, we calculated the gas product collection flux and collection efficiency by assuming that all the missing FE can be entirely attributed to catholyte bubble loss (Fig. 2a). From 20 to 80 mA cm−2, we observed the gas collection flux to increase linearly with current density and >90% collection efficiency throughout (stage 1). However, the gas collection flux saturates at around 0.63 ml min−1 when current densities of 100 mA cm−2 and higher are applied (stage 2). Concomitantly, this leads to a drop in the gas collection efficiency from 91.7% at 80 mA cm−2 to only 56.3% at 140 mA cm−2. Intrigued by these results, we were thus motivated to understand the critical parameters that influence gas product permeation and collection through the GDE.
We first sought to evaluate the impact of Au/PTFE pore size (0.02, 0.1, 0.45, 1.0 and 3.0 μm) on gas product collection at 80, 100 and 120 mA cm−2. Our initial hypothesis was that a larger GDL pore size would facilitate a higher collection flux and efficiency, due to more facile gas transport. Contrary to this intuition, we found no significant differences in the collection flux and efficiency for pore sizes of 0.02, 0.1 and 0.45 μm (Fig. 2b). In fact, gas product collection even began to decline for the larger pore sizes (1 and 3 μm). We also performed CO2R experiments at a wider current density range (20–140 mA cm−2) with Au/PTFE(3.0). The results demonstrate that the gas collection of Au/PTFE(3.0) is indeed poorer than that of Au/PTFE(0.45) (Fig. 2c, Fig. S9b and Table S4, ESI†). Hence, we find that beyond a certain threshold, a larger pore size is detrimental to gas product collection.
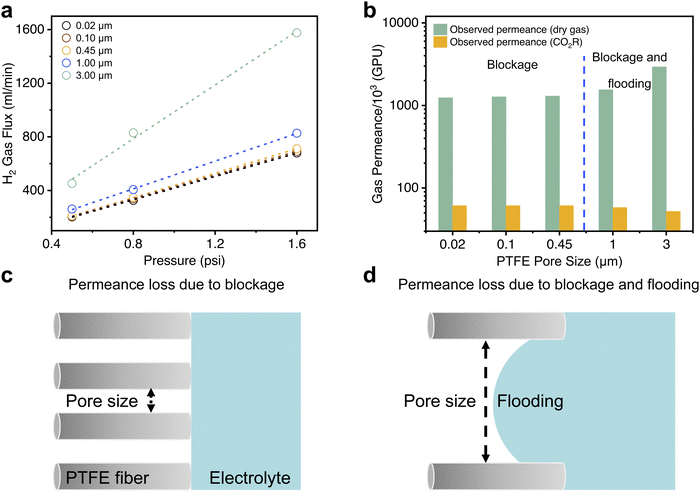
To understand these results, we conducted dry gas permeation experiments (setup schematic shown in Fig. S12, ESI†) to study how gas transport through the GDE varies with the pore size. In these experiments, we exposed H2 gas to the Au coated side of the GDE. The opposite side of the GDE faced a permeation chamber connected to a vacuum pump. The pressure on the H2 side was varied and the resulting gas flux through the GDE measured using a mass flow meter. The observed gas flux values (Fig. 3a) were then used to calculate dry gas permeances (k in GPU) for each PTFE pore size (Fig. 3b and Table S1, ESI†). We observed that dry gas permeance values are consistently around two orders of magnitude higher than that of the gas permeance values in CO2R experiments (Fig. 3b). We postulated that this is due to presence of electrolyte at the pore entrances (pore blockage) for all pore sizes (Fig. 3c) and entry of electrolyte into the pores (pore flooding) for the larger pore sizes (Fig. 3d).
From the results, we found no significant differences in the gas flux and dry gas permeance values for the smaller pore sizes (0.02, 0.1 and 0.45 μm) and is consistent with the gas collection efficiency results in our CO2R experiments. However, at the larger pore sizes, an opposite trend was observed where 1.0 and 3.0 μm yielded higher dry gas permeance values but lower gas product collection efficiency in CO2R experiments. Based on these observations, we reasoned that there are two regimes of ‘reversed’ GDE operation. For the smaller pore sizes, gas transport is likely governed by a combination of Knudsen and molecular diffusion (Supplementary note S1, ESI†) through the partially blocked pores. However, at the larger pore sizes, pore flooding also occurs (Fig. 3d) which results in a decreased gas collection efficiency even though dry gas permeance values are higher. From the results obtained, we estimated flooding to be 20.5% for 1 μm and 62.9% for 3 μm at an applied current density of 120 mA cm−2 (Supplementary note S1, ESI†).
We reasoned that partial flooding in the larger pore sizes is a result of a lower liquid entry pressure (LEP). This can be inferred from the Young–Laplace equation,44 where the LEP is inversely proportional to the pore size:
 | (1) |
To further investigate this, we performed contact angle measurements on both the 0.45 and 3.0 μm PTFE pore size (Fig. S4, ESI†). From the results, we found that the contact angle for Au/PTFE(3.0) is 89°, which is indeed smaller compared to 115° for Au/PTFE(0.45). Hence, these results indicate that partial flooding occurs for Au/PTFE(3.0) due to a lower LEP, which in turn leads to a poorer gas collection performance during CO2R.
Following this, we investigated the effect of the pressure gap between the electrolyte and the gas collection chamber on the gas product collection efficiency, with our preceding CO2R experiments all performed at a pressure gap of 218 Pa (see Supplementary note S2, ESI†). This can be tuned by simply adjusting the electrolyte flow rate through the electrochemical cell (see Supplementary note S2, Fig. S13 and Table S2 for more details, ESI†). Similar CO2R experiments from 20 to 140 mA cm−2 were then conducted with pressure gaps of 11 and 328 Pa. From these results, we found that the product gas flux product at 80 mA cm−2 is around 0.44 ml min−1 (collection efficiency 75%) at 11 Pa, increasing to 0.55 ml min−1 at 218 Pa and decreasing to only 0.31 ml ml−1 at 328 Pa (product collection ratio of 95% and decreasing to only 55%) (Fig. 2d). The poorer product gas collection at 11 Pa is also supported by CO2R experiments over an extended current density range (Fig. S14, S15 and Tables S5, S6, ESI†) with both Au/PTFE(0.45) and Au/PTFE(3.0). We further note that the range of these pressure changes are unlikely to significantly alter the solubility of CO or H2.45
It is expected that a higher pressure gap increases product collection flux, but when the differential is too high, it also forces more electrolyte into the GDL pores leading to partial flooding, which impedes gas transport to the collection chamber. To understand this, we performed calculations to determine the partial flooding for Au/PTFE(3.0) at pressure gaps of 218 Pa and 328 Pa. The calculations show that the flooding for Au/PTFE(3) is 62.9% at 218 Pa, which significantly increases to 94.0% at 328 Pa. Taken together, our experimental results and calculations indicate that there is an optimum, where too high a pressure gap leads to a higher degree of liquid entry into the pores (flooding) and too low a pressure gap leads to insufficient driving force for gas transport through the PTFE membrane (Fig. S16, ESI†).
We also studied the effect of catalyst thickness on the gas collection performance. With a fixed PTFE pore size of 0.45 μm, we sputtered a series of Au catalyst thickness with values of 200, 300 and 500 nm. The results (Fig. S17 and Table S8, ESI†) show that the GDEs with a catalyst thickness of 200 nm and 300 nm have similar product collection efficiencies of ∼95%. However for 500 nm, the production collection efficiency decreases to 90%, which suggests that depositing a catalyst layer that is too thick compromises gas transport. This is supported by performing dry gas permeation experiments, where we find that gas permeability is lowest for the 500 nm case (Fig. S18, ESI†).
Having optimized the operating parameters for gas collection with the reversed GDE, our next goal was to steer the system towards the production of high purity syngas through an appropriate choice of catalyst. Importantly, we identified that a CO FE of 33% must be attained to deliver a H2/CO = 2![[thin space (1/6-em)]](https://www.rsc.org/images/entities/char_2009.gif) :
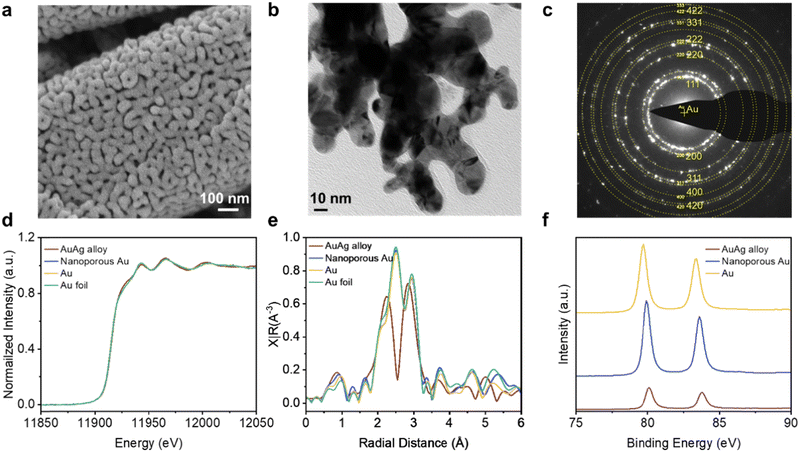
:![[thin space (1/6-em)]](https://www.rsc.org/images/entities/char_2009.gif) 1 syngas ratio. However, we found that Au/PTFE(0.45) exhibits a relatively low CO selectivity when tested in the reversed GDE case, conventional H-cell, and flow cell system (Fig. S19, ESI†). To improve the performance, we fabricated a nanoporous Au catalyst (NP Au/PTFE) through a AgAu dealloying method (Fig. S20, ESI†). We first coated 300 nm of a AgAu alloy onto the 0.45 μm PTFE substrate through electron-beam evaporation (Fig. S21, ESI†). The AuAg alloy was then etched in concentrated HNO3 acid to derive the final NP Au/PTFE catalyst (Fig. S22 and S23, ESI†). Scanning electron microscopy (SEM) (Fig. 4a and Fig. S24, ESI†) and transmission electron microscopy (TEM) images (Fig. 4b) show that the nanoporous structure is uniformly distributed throughout the catalyst. Selected area electron diffraction (SAED) patterns (Fig. 4c and Fig. S25, ESI†) and powder X-ray diffraction (XRD) patterns (Fig. S26, ESI†) of NP Au/PTFE reveal its highly polycrystalline nature Au. L3-edge X-ray absorption spectroscopy (XAS) results (Fig. 4d and e) and Au 4f X-ray photoelectron spectroscopy (XPS) spectra results show that the catalyst consists of Au in the metallic state (Fig. 4f and Fig. S27, ESI†).
1 syngas ratio. However, we found that Au/PTFE(0.45) exhibits a relatively low CO selectivity when tested in the reversed GDE case, conventional H-cell, and flow cell system (Fig. S19, ESI†). To improve the performance, we fabricated a nanoporous Au catalyst (NP Au/PTFE) through a AgAu dealloying method (Fig. S20, ESI†). We first coated 300 nm of a AgAu alloy onto the 0.45 μm PTFE substrate through electron-beam evaporation (Fig. S21, ESI†). The AuAg alloy was then etched in concentrated HNO3 acid to derive the final NP Au/PTFE catalyst (Fig. S22 and S23, ESI†). Scanning electron microscopy (SEM) (Fig. 4a and Fig. S24, ESI†) and transmission electron microscopy (TEM) images (Fig. 4b) show that the nanoporous structure is uniformly distributed throughout the catalyst. Selected area electron diffraction (SAED) patterns (Fig. 4c and Fig. S25, ESI†) and powder X-ray diffraction (XRD) patterns (Fig. S26, ESI†) of NP Au/PTFE reveal its highly polycrystalline nature Au. L3-edge X-ray absorption spectroscopy (XAS) results (Fig. 4d and e) and Au 4f X-ray photoelectron spectroscopy (XPS) spectra results show that the catalyst consists of Au in the metallic state (Fig. 4f and Fig. S27, ESI†).
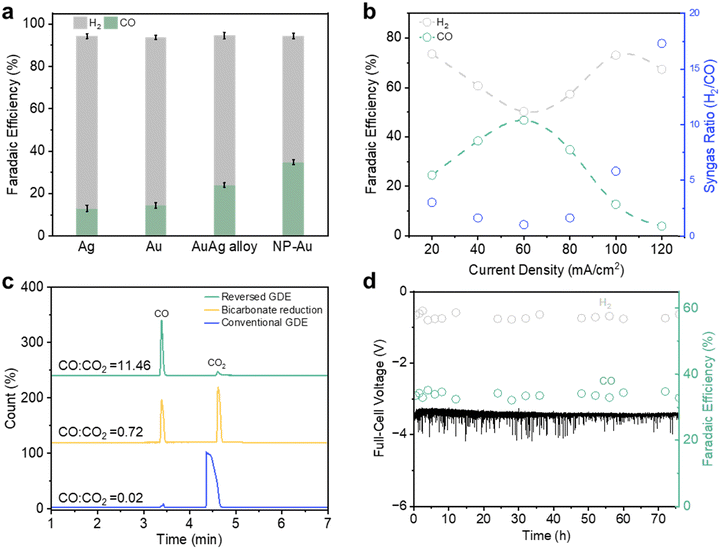
With NP Au/PTFE, we observed a relatively higher CO FE when tested in a conventional H-cell and flow cell system (Fig. S28, ESI†). We then performed CO2R in the reversed GDE configuration and successfully observed a CO FE of 34.8% at 80 mA cm−2 (Fig. 5a, Fig. S29 and Table S8, ESI†). Over an extended current density range (Fig. 5b), we found that the syngas ratio can be tuned from 1![[thin space (1/6-em)]](https://www.rsc.org/images/entities/char_2009.gif) :
:![[thin space (1/6-em)]](https://www.rsc.org/images/entities/char_2009.gif) 1 to 7
1 to 7![[thin space (1/6-em)]](https://www.rsc.org/images/entities/char_2009.gif) :
:![[thin space (1/6-em)]](https://www.rsc.org/images/entities/char_2009.gif) 1 (H2/CO), with the highest FE to CO of 46.7% at 60 mA cm−2. A long-term stability test was also conducted with NP Au/PTFE over a 76 h period at 80 mA cm−2. We found no observable performance decline over this extended duration, maintaining an average CO FE of ∼33.6% and a full-cell voltage ∼3.45 V (Fig. 5d). Notably, this affords a high full-cell energy efficiency of 37% for the continuous production and collection of high purity syngas.
1 (H2/CO), with the highest FE to CO of 46.7% at 60 mA cm−2. A long-term stability test was also conducted with NP Au/PTFE over a 76 h period at 80 mA cm−2. We found no observable performance decline over this extended duration, maintaining an average CO FE of ∼33.6% and a full-cell voltage ∼3.45 V (Fig. 5d). Notably, this affords a high full-cell energy efficiency of 37% for the continuous production and collection of high purity syngas.
We also evaluated the purity of the syngas generated from NP Au/PTFE using a more sensitive gas chromatography mass spectrometry (GCMS) method. The GCMS results (Fig. 5c and Fig. S30, S31, ESI†) indicate the presence of a trace amount of CO2, with a CO![[thin space (1/6-em)]](https://www.rsc.org/images/entities/char_2009.gif) :
:![[thin space (1/6-em)]](https://www.rsc.org/images/entities/char_2009.gif) CO2 peak area ratio of 11.46. For comparison, we also performed CO2R in the ‘conventional GDE’ operating mode where CO2 is flowed through the gas chamber as well as bicarbonate reduction (details available in ESI†). GCMS analysis of their gas outputs showed significantly lower CO
CO2 peak area ratio of 11.46. For comparison, we also performed CO2R in the ‘conventional GDE’ operating mode where CO2 is flowed through the gas chamber as well as bicarbonate reduction (details available in ESI†). GCMS analysis of their gas outputs showed significantly lower CO![[thin space (1/6-em)]](https://www.rsc.org/images/entities/char_2009.gif) :
:![[thin space (1/6-em)]](https://www.rsc.org/images/entities/char_2009.gif) CO2 peak area ratios of only 0.02 and 0.72 for conventional GDE and bicarbonate reduction respectively. Importantly, this exemplifies the success of our reversed GDE strategy, which enables the collection of high purity gas products.
CO2 peak area ratios of only 0.02 and 0.72 for conventional GDE and bicarbonate reduction respectively. Importantly, this exemplifies the success of our reversed GDE strategy, which enables the collection of high purity gas products.
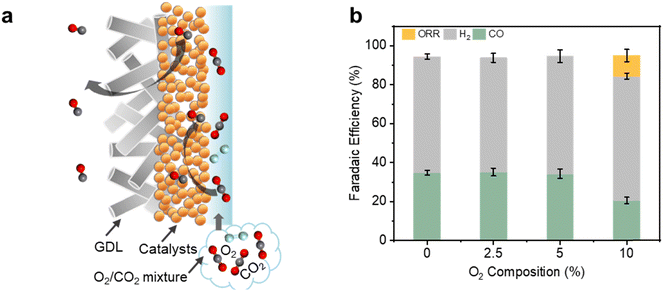
Finally, we demonstrate that our reversed GDE system is also particularly effective at oxygen-tolerant electrochemical CO2 reduction (Fig. 6a). This is important since industrially relevant sources of waste CO2 likely contain significant amounts of O2 impurities.46–48 Strikingly, using NP Au/PTFE at 80 mA cm−2, we found no parasitic loss of current towards the oxygen reduction reaction (ORR). Hence, a CO FE of ∼34.2% could be maintained even with CO2 feedstock containing 2.5% and 5% of O2 (Fig. S32, ESI†). However, at 10% O2 we observed loss of 10.5% of FE towards ORR, with a concomitant drop in the CO FE to 20.6% (Fig. 6b). In contrast, we found poor oxygen-tolerant performance with the conventional GDE operating mode, with less than 2% CO FE using a gas feed containing 5% O2 (Fig. S33 and S34, ESI†).
Conclusions
Performing CO2R in conventional systems typically leads to highly diluted gas product output streams, consisting mainly of unreacted CO2. This then requires energy intensive and costly product separation, which potentially decreases the feasibility and economic viability of the process. Hence, the goal of this work is to develop a CO2R system capable of generating gas products at high purity. We postulate that regions with high catalytic activity are likely to be locally depleted of CO2 due to the expected alkaline pH and rapid reactant consumption. This leads to gas products that are initially generated at high purity without mixing with CO2. Motivated by this, we deposited our catalysts onto a porous hydrophobic PTFE membrane, which channels high purity gas products towards a collection chamber. Through a systematic study, we find that the electrolyte pressure and PTFE pore size are key parameters that control the product collection efficiency. Employing a nanoporous Au catalyst, we achieve continuous production and collection of high purity syngas (H2/CO = 2![[thin space (1/6-em)]](https://www.rsc.org/images/entities/char_2009.gif) :
:![[thin space (1/6-em)]](https://www.rsc.org/images/entities/char_2009.gif) 1) at 80 mA cm−2 over a 76 h extended duration with a full-cell energy efficiency of 37%. Furthermore, we demonstrate that our system is oxygen-tolerant, with no loss of current towards the parasitic oxygen reduction reaction even with a gas feed containing 5% O2. Taken together, our findings introduce a new design approach for CO2R electrolyzer systems for output of high purity gas product streams.
1) at 80 mA cm−2 over a 76 h extended duration with a full-cell energy efficiency of 37%. Furthermore, we demonstrate that our system is oxygen-tolerant, with no loss of current towards the parasitic oxygen reduction reaction even with a gas feed containing 5% O2. Taken together, our findings introduce a new design approach for CO2R electrolyzer systems for output of high purity gas product streams.
Author contributions
Y. L. supervised the project. Y. L. and B. W. conceived the idea and designed the experiments. B. W. carried out all the experimental work. J. Z. carried out all the gas product GCMS analysis. A. Q. F. and H. A. A. performed and supervised the catalyst synthesis respectively. B. W., C. W. and S. X. carried out the XAS experiments. B. W., N. N., and M. W. carried out the bubble growth video capture. Y. J. and S. Z. carried out and supervised the gas flux experiments respectively. B. W., Z. M., Z. A., W. W. T., and M. Z. performed the catalyst characterization and analysis. L. D. V. carried out calculations of pressure gap, permeance and pore flooding. C. S. M. and I. A. K. supervised the calculations. Y. L. and B. W. co-wrote the manuscript. All authors discussed the results and assisted during the manuscript preparation.Data availability
The authors declare that the data supporting the findings of this study are available within the paper and its ESI.† Should any raw data files be needed in another format they are available from the corresponding author upon reasonable request.Conflicts of interest
The authors declare no competing interests.Acknowledgements
Y. L. acknowledges support and funding from the A*STAR (Agency for Science, Technology, and Research) under its LCERFI program (Award No. U2102d2002). Y. L. acknowledges support and funding from the NRF Fellowship (Award No. NRF-NRFF14-2022-0003). We acknowledge use of the XAFCA beamline of the Singapore Synchrotron Light Source (SSLS) for collection of the XAS data used in this work. We thank professor Shamsuzzaman Farooq for help and guidance on the pressure gap and gas transport calculations.References
- O. S. Bushuyev, P. De Luna, C. T. Dinh, L. Tao, G. Saur, J. van de Lagemaat, S. O. Kelley and E. H. Sargent, Joule, 2018, 2, 825–832 CrossRef CAS.
- I. E. Stephens, K. Chan, A. Bagger, S. W. Boettcher, J. Bonin, E. Boutin, A. K. Buckley, R. Buonsanti, E. R. Cave and X. Chang, J. Phys. Energy, 2022, 4, 042003 CrossRef CAS.
- S. Chu, Y. Cui and N. Liu, Nat. Mater., 2017, 16, 16–22 CrossRef PubMed.
- P. De Luna, C. Hahn, D. Higgins, S. A. Jaffer, T. F. Jaramillo and E. H. Sargent, Science, 2019, 364, eaav3506 CrossRef CAS PubMed.
- S. Zhang, P. Kang, M. Bakir, A. M. Lapides, C. J. Dares and T. J. Meyer, Proc. Natl. Acad. Sci. U. S. A., 2015, 112, 15809–15814 CrossRef CAS PubMed.
- J. E. Huang, F. Li, A. Ozden, A. Sedighian Rasouli, F. P. García de Arquer, S. Liu, S. Zhang, M. Luo, X. Wang and Y. Lum, Science, 2021, 372, 1074–1078 CrossRef CAS PubMed.
- C. Xia, P. Zhu, Q. Jiang, Y. Pan, W. Liang, E. Stavitski, H. N. Alshareef and H. Wang, Nat. Energy, 2019, 4, 776–785 CrossRef CAS.
- Z. Chen, T. Wang, B. Liu, D. Cheng, C. Hu, G. Zhang, W. Zhu, H. Wang, Z.-J. Zhao and J. Gong, J. Am. Chem. Soc., 2020, 142, 6878–6883 CrossRef CAS PubMed.
- B. Liu, T. Wang, S. Wang, G. Zhang, D. Zhong, T. Yuan, H. Dong, B. Wu and J. Gong, Nat. Commun., 2022, 13, 7111 CrossRef CAS PubMed.
- Q. Wang, B. Liu, S. Wang, P. Zhang, T. Wang and J. Gong, Proc. Natl. Acad. Sci. U. S. A., 2024, 121, e2316724121 CrossRef CAS PubMed.
- C.-T. Dinh, T. Burdyny, M. G. Kibria, A. Seifitokaldani, C. M. Gabardo, F. P. García de Arquer, A. Kiani, J. P. Edwards, P. De Luna and O. S. Bushuyev, Science, 2018, 360, 783–787 CrossRef CAS PubMed.
- Y. Xie, P. Ou, X. Wang, Z. Xu, Y. C. Li, Z. Wang, J. E. Huang, J. Wicks, C. McCallum and N. Wang, Nat. Catal., 2022, 5, 564–570 CrossRef CAS.
- P. Zhu and H. Wang, Nat. Catal., 2021, 4, 943–951 CrossRef CAS.
- S. Yang, H. An, S. Arnouts, H. Wang, X. Yu, J. de Ruiter, S. Bals, T. Altantzis, B. M. Weckhuysen and W. van der Stam, Nat. Catal., 2023, 6, 796–806 CrossRef CAS.
- W. Fang, W. Guo, R. Lu, Y. Yan, X. Liu, D. Wu, F. M. Li, Y. Zhou, C. He and C. Xia, Nature, 2024, 626, 86–91 CrossRef CAS PubMed.
- X. Liu and M. T. Koper, J. Am. Chem. Soc., 2024, 146, 5242–5251 CrossRef CAS PubMed.
- J. Su, C. B. MusgraveIII, Y. Song, L. Huang, Y. Liu, G. Li, Y. Xin, P. Xiong, M. M.-J. Li and H. Wu, Nat. Catal., 2023, 6, 818–828 CrossRef CAS.
- X. Yuan, L. Zhang, L. Li, H. Dong, S. Chen, W. Zhu, C. Hu, W. Deng, Z.-J. Zhao and J. Gong, J. Am. Chem. Soc., 2019, 141, 4791–4794 CrossRef CAS PubMed.
- Y. Qin, G. Zhan, C. Tang, D. Yang, X. Wang, J. Yang, C. Mao, Z. Hao, S. Wang and Y. Qin, Nano Lett., 2023, 23, 9227–9234 CrossRef PubMed.
- J. Qiao, Y. Liu, F. Hong and J. Zhang, Chem. Soc. Rev., 2014, 43, 631–675 RSC.
- S. Nitopi, E. Bertheussen, S. B. Scott, X. Liu, A. K. Engstfeld, S. Horch, B. Seger, I. E. Stephens, K. Chan and C. Hahn, Chem. Rev., 2019, 119, 7610–7672 CrossRef CAS PubMed.
- R. I. Masel, Z. Liu, H. Yang, J. J. Kaczur, D. Carrillo, S. Ren, D. Salvatore and C. P. Berlinguette, Nat. Nanotechnol., 2021, 16, 118–128 CrossRef CAS PubMed.
- L. Li, X. Li, Y. Sun and Y. Xie, Chem. Soc. Rev., 2022, 51, 1234–1252 RSC.
- H. Shin, K. U. Hansen and F. Jiao, Nat. Catal., 2021, 4, 911–919 Search PubMed.
- T. Zheng, C. Liu, C. Guo, M. Zhang, X. Li, Q. Jiang, W. Xue, H. Li, A. Li and C.-W. Pao, Nat. Nanotechnol., 2021, 16, 1386–1393 CrossRef CAS PubMed.
- P. Zhu, C. Xia, C.-Y. Liu, K. Jiang, G. Gao, X. Zhang, Y. Xia, Y. Lei, H. N. Alshareef and T. P. Senftle, Proc. Natl. Acad. Sci. U. S. A., 2021, 118, e2010868118 CrossRef CAS PubMed.
- L. Fan, C. Xia, P. Zhu, Y. Lu and H. Wang, Nat. Commun., 2020, 11, 3633 CrossRef CAS PubMed.
- Z. Yan, J. L. Hitt, Z. Zeng, M. A. Hickner and T. E. Mallouk, Nat. Chem., 2021, 13, 33–40 CrossRef CAS PubMed.
- K. Xie, R. K. Miao, A. Ozden, S. Liu, Z. Chen, C.-T. Dinh, J. E. Huang, Q. Xu, C. M. Gabardo and G. Lee, Nat. Commun., 2022, 13, 3609 CrossRef CAS PubMed.
- B. Pan, J. Fan, J. Zhang, Y. Luo, C. Shen, C. Wang, Y. Wang and Y. Li, ACS Energy Lett., 2022, 7, 4224–4231 CrossRef CAS.
- Y. Zhao, X. Liu, J. Chen, J. Chen, J. Chen, L. Fan, H. Yang, S. Xi, L. Shen and L. Wang, Proc. Natl. Acad. Sci. U. S. A., 2023, 120, e2218040120 CrossRef CAS PubMed.
- W. Zhu, L. Zhang, P. Yang, C. Hu, H. Dong, Z.-J. Zhao, R. Mu and J. Gong, ACS Energy Lett., 2018, 3, 2144–2149 CrossRef CAS.
- D. Kim, C. Xie, N. Becknell, Y. Yu, M. Karamad, K. Chan, E. J. Crumlin, J. K. Nørskov and P. Yang, J. Am. Chem. Soc., 2017, 139, 8329–8336 CrossRef CAS PubMed.
- H. Mistry, A. S. Varela, C. S. Bonifacio, I. Zegkinoglou, I. Sinev, Y.-W. Choi, K. Kisslinger, E. A. Stach, J. C. Yang and P. Strasser, Nat. Commun., 2016, 7, 12123 CrossRef PubMed.
- E. W. Lees, J. C. Bui, O. Romiluyi, A. T. Bell and A. Z. Weber, Nat. Chem. Eng., 2024, 1–14 Search PubMed.
- X. Lu, C. Zhou, R. S. Delima, E. W. Lees, A. Soni, D. J. Dvorak, S. Ren, T. Ji, A. Bahi and F. Ko, Nat. Chem., 2024, 1–9 Search PubMed.
- X. Wang, I. A. Cechanaviciute, L. Banko, S. Pokharel, T. Quast, A. Ludwig, O. Krysiak and W. Schuhmann, Adv. Funct. Mater., 2024, 2400180 CrossRef CAS.
- L. Zhang, H. Gao, G. Zhang, Y. Dong, K. Huang, Z. Pang, T. Wang, C. Pei, P. Zhang and J. Gong, Chin. Chem. Lett., 2024, 110204 Search PubMed.
- K. Liu, W. A. Smith and T. Burdyny, ACS Energy Lett., 2019, 4, 639–643 CrossRef CAS PubMed.
- L. Chen, J. Chen, L. Fan, J. Chen, T. Zhang, J. Chen, S. Xi, B. Chen and L. Wang, ACS Catal., 2023, 13, 11934–11944 CrossRef CAS.
- B. Wu, B. Wang, B. Cai, C. Wu, W. W. Tjiu, M. Zhang, Z. Aabdin, S. Xi and Y. Lum, J. Am. Chem. Soc., 2024, 146, 29801–29809 CrossRef CAS PubMed.
- A. Q. Fenwick, A. J. Welch, X. Li, I. Sullivan, J. S. DuChene, C. Xiang and H. A. Atwater, ACS Energy Lett., 2022, 7, 871–879 CrossRef CAS.
- S. B. Dolmanan, A. Böhme, Z. Fan, A. J. King, A. Q. Fenwick, A. D. Handoko, W. R. Leow, A. Z. Weber, X. Ma and E. Khoo, J. Mater. Chem. A, 2023, 11, 13493–13501 RSC.
- M. Rezaei, D. M. Warsinger, M. C. Duke, T. Matsuura and W. M. Samhaber, Water Res., 2018, 139, 329–352 CrossRef CAS PubMed.
- Q. Chen and J. M. Trusler, Chem. Eng. Sci., 2024, 293, 120038 CrossRef CAS.
- H.-J. Zhu, D.-H. Si, H. Guo, Z. Chen, R. Cao and Y.-B. Huang, Nat. Commun., 2024, 15, 1–11 CAS.
- L.-Y. Liu, Q. Wu, H. Guo, L. Han, S. Gao, R. Cao and Y.-B. Huang, J. Mater. Chem. A, 2024, 12, 9486–9493 RSC.
- M. Wang, B. Wang, J. Zhang, S. Xi, N. Ling, Z. Mi, Q. Yang, M. Zhang, W. R. Leow and J. Zhang, Nat. Commun., 2024, 15, 1218 CrossRef CAS PubMed.
Footnotes |
| † Electronic supplementary information (ESI) available. See DOI: https://doi.org/10.1039/d4ey00253a |
| ‡ These authors contributed equally to this work. |
| This journal is © The Royal Society of Chemistry 2025 |

