
 Open Access Article
 This Open Access Article is licensed under a Creative Commons Attribution-Non Commercial 3.0 Unported Licence
Heat and moisture transport in okra cylinders with shrinkage effects under solar drying: a multiphysics-based simulation approach
Nnaemeka
Nwakuba
 *ab,
Nnaemeka
Ezeanya
a,
Ibiba Taiwo
Horsfall
c,
Victor
Okafor
a,
Chibuike
Ononogbo
d,
Macmanus
Ndukwu
c,
Marlin
Simo-Tagne
e and
Sabbas
Asoegwu
a
*ab,
Nnaemeka
Ezeanya
a,
Ibiba Taiwo
Horsfall
c,
Victor
Okafor
a,
Chibuike
Ononogbo
d,
Macmanus
Ndukwu
c,
Marlin
Simo-Tagne
e and
Sabbas
Asoegwu
a
aDepartment of Agricultural Engineering, School of Engineering and Engineering Technology, Federal University of Technology, P.M.B. 1526 Owerri, Nigeria. E-mail: nrnwakuba@gmail.com; nnaemeka.nwakuba@futo.edu.ng
bDepartamento de Engenharia Agrícola, Universidade Federal de Viçosa, Viçosa, MG, Brazil
cDepartment of Agricultural and Bioresources Engineering, Michael Okpara University of Agriculture, Umudike, Nigeria
dDepartment of Mechanical Engineering, Imo State University of Agricultural and Environmental Sciences, Umuagwo, Nigeria
eNancy-Metz Academy, 54035, 2 Rue Philippe de Gueldres, 54000 Nancy, France
First published on 20th January 2025
Abstract
The study of the heat and moisture transport of plant-based materials is of considerable value to the agri-food sector as the in-depth insight provided facilitates the development of better-performing, sustainable, and quality-driven drying techniques and optimized process conditions. This work reports the findings of the experimental tests conducted on a passive mixed-mode solar dryer with okra cylinders of varying thicknesses of 5, 10, and 15 mm with a uniform diameter of 12 ± 0.25 mm. The convective heat and mass transport coefficients were analysed with shrinkage and no-shrinkage impact integrated into the models to accurately predict the drying behaviour, and enhance drying efficiency by considering the geometrical and structural alterations. The results obtained reveal that shrinkage incorporation magnifies the mean values of the convective heat transfer coefficient in the range of 72.29 ≤  ≤ 78.45%, whereas without accounting for shrinkage in the mass transfer, the effective diffusion and mass transfer coefficients range between 74.86 ≤
  ≤ 83.14% and 52.68 ≤ hm ≤ 58.83%, respectively for the range of the studied sample thickness. The cylinder thickness remarkably impacted the heat and moisture transport coefficients. Empirical correlations of hc-values with Nusselt and Reynolds numbers were developed for each sample thickness. The COMSOL Multiphysics finite element technique was used to numerically model the structural behaviour of the okra cylinder in terms of transient heat and moisture distribution during the drying operation. The predicted cylinder temperature with shrinkage effect and moisture ratio results exhibited a strong correlation with the experimental data with very low error values.
Sustainability spotlightThis study highlights the critical role of sustainable food preservation techniques in reducing post-harvest losses and enhancing food security. By employing a multi-physics simulation to investigate heat and moisture transport in okra during solar drying, the research emphasizes the importance of renewable energy for efficient dehydration processes. The inclusion of shrinkage effects ensures accurate modeling, addressing challenges in drying performance and quality retention. Solar drying, powered by abundant natural resources, minimizes environmental impact and promotes energy-efficient practices, aligning with global sustainability goals. This work not only advances the scientific understanding of food drying dynamics but also supports the adoption of eco-friendly preservation methods, contributing to a resilient and sustainable food supply chain. |
1 Introduction
Since the beginning of time, solar drying has been utilized to dry food materials as well as other plant-based products. In an effort to take advantage of the sun's abundant and inexpensive renewable energy, multiple attempts have been made recently to develop solar drying, predominantly for the preservation of food crops and forest-based products. The ongoing quest for an alternate energy source in response to the projected apprehension of fossil fuel depletion and scarcity is its driving factor. The emphasis on the adoption of solar drying especially for low-thermal drying operations has increased even further due to the current rise in the price of fossil fuels in most developing nations like Nigeria together with the upsurge in the production cost of dried food products and the harmful ecological effects. Solar drying has evolved as a popular and economical technique to preserve agri-food products, especially in locations with ample sunshine and limited accessibility to traditional energy supplies. In addition to its practical benefits, this method provides substantial support to worldwide sustainable development goals. In addition to improving the preservation of foods, boosting the efficiency of solar drying operations for food crops such as okra supports global sustainability initiatives. However, Nigeria sits within the high-solar irradiance band of the world receiving an average solar flux of 5.535 kW h m−2 annually and a maximum sunshine time of 9 hours daily which advantageously facilitates the productive use of the thermal energy of the sun for crop processing and other useful energy functions.1 The utilization of the sun's energy for crop drying spans between open-air drying and solar dryers. The former is predominantly practised in hinterland areas of developing economies which are burdened with some bottlenecks ranging from gross product loss as a result of incomplete drying and low quality due to infestation by pests and diseases. In contrast, the latter offers the merits of reduction in drying duration and improvement in product quality, low investment costs, design simplicity, and renewable, non-polluting and cost-free energy sources amongst others.2,3 Amongst the various kinds of solar dryers that have been utilized over the last 30 years for proper food crop drying, mixed-mode solar dryers are discovered to be the most effective in achieving high effectiveness in crop drying vis-à-vis drying time reduction and drying cost.4 According to Jiang et al.,5 these makes of dryers possess the characteristics of the direct and indirect versions of solar dryers. In these dryers, crops are subjected to simultaneous dehydration by direct radiation (through the glazing part of the cabinet) and the hot air generated by the solar air heater.Drying is a pre-historic approach to boosting the storability of agrifood products with the primary goal of scaling up the finished products at minimal cost and utmost efficiency. In most food processing industries, hot air drying is the most extensively used technique for maintaining dried products' quality.5 Heat and moisture transport in the food matrix takes place by conduction and diffusion, respectively based on the working fluid temperature and moisture concentration differential.4,5 The study of the transient heat and moisture transfer process during drying implies the linking of the heat transfer diffusion model with an expression of the moisture transfer rate. Knowledge of the heat transfer mechanism allows for an appropriate study of the drying behaviour of various products. The heat transfer characteristics of food products during the drying process are evaluated by the convective heat transfer coefficient.4 It is, thus, a key aspect of dryer design, energy reduction and optimization of the process settings of solar dryers. During the drying process, moisture transport from the intercellular and intracellular spaces to the periphery tends to cause substantial micro-structural deformation of the food material and uneven volumetric variations of moisture-laden products. This volumetric drop in the dried products is referred to as shrinkage. Drying generally results in shrinkage and deformation of food products in which product tissue loses its structural integrity and form due to moisture extraction, which also causes turgor pressure loss, heat and hygro-stresses, and cell rupture. For this reason, shrinkage degrades the morphological quality of dried food products and end-users' satisfaction. Additionally, it is an important variable that can influence the drying kinetics and rate.
Previously, most reported works in the mathematical modeling of food products were predicted under the assumption of negligible shrinkage,6–8 whereas in practice, most food products shrink substantially. This rendered it unfeasible to simulate the process with accuracy. It is, therefore, indispensable to fathom the processes that drive the aforementioned structural alterations for better process control and higher-quality products. It is significant to remark that shrinkage should be factored into computational models when estimating the temperature and moisture characteristics of food products undergoing the drying process since this variable has a greater influence on the final product quality.4,5 Similarly, some researchers, according to Jiang et al.,5 have reported works on models predicting the shrinkage effect during heat and mass transfer in food crops such as potatoes, apples, pears, and blackberries in addition to the reports of2 and4 using convective mixed-mode solar dryers with varying sample cylinder thicknesses and fixed length. Jiang et al.5 reported on the numerical simulation of heat and mass transfer during carrot slices' convective drying, considering and neglecting shrinkage effects.
The results of these computational studies indicated that more information on the heat and mass transfer kinetics can be provided during the drying process and can be tailored to other crop drying systems. Akpinar9 examined the coefficients of heat transfer of some agrifood products dried by forced airflow. The existing data on the heat transfer coefficient remains insufficient, particularly for solar drying situations, due to the diverse range of food products with varying geometries, sizes, process conditions, and estimating methodologies. Published literature, however, reveals that the scarcity of data on the heat transfer coefficient for most food crops compels researchers to utilize heat transfer associations based on the Nusselt number for designing their heat transfer situations, often neglecting considerations of correctness and appropriateness.2,9–11
Modeling the heat and moisture transport in the solar drying of okra is essential for increasing drying efficiency, enhancing product quality, and minimizing energy usage. It provides a more comprehensive understanding of the impact of temperature gradients, moisture loss, and shrinkage on the food product's drying dynamics. Dhalsamant et al.4 noted that the finite element approach was a widely utilized modeling tool for heat and mass transfer studies in agrifood items. It was established from the literature that the heat and mass transfer that occurs when plant-based materials are dried could be simulated using the COMSOL Multiphysics program.3–5 On the other hand, it was discovered that there had been no publicly accessible documentation on the physics-based simulation of the convective heat transfer and mass transport coefficients affecting the moisture extraction dynamics, given shrinkage during the course of okra's mixed-mode solar drying. This served as the study's motivational foundation. As stated earlier, exploring the underlying process of shrinkage of okra cylinders that results from concurrent heat and moisture transport operations is incredibly important.
Through the use of renewable energy for crop drying, this study advances Sustainable Development Goal (SDG) 7 (Access to Clean and Affordable Energy) and SDG 12 (Sustainable Consumption and Production Patterns) by reducing postharvest losses and thereby increasing the utilization of resources in food systems. It also addresses SDG 13 (Action to Combat Climate Change and its Impact) by minimizing dependence on non-renewable energy. Therefore, the objectives of this present study were to: (i) determine the influence of shrinkage on the modeling of the concurrent heat and mass transport processes of okra cylinders of varying thicknesses; (ii) model the coupled heat and mass transfer operations of okra cylinders with shrinkage impact during mixed-mode solar drying using the COMSOL Multiphysics tool. The novelty of this study lies in its inclusion of shrinkage implications into drying models, which are generally ignored alongside the use of a multi-physics modeling approach that integrates heat transport, mass transfer, and structural alterations in a single model. This gives the simulation more realism and increases its applicability to real-world drying situations. Furthermore, the emphasis on cylindrical okra shapes offers a more realistic and practical description of the drying process in comparison to generalized flat/circular shapes typically used in drying simulations. In general, the uniqueness of this work rests on filling the gaps between sustainability, real-world applications, and theoretical models by improving drying simulation methods, encouraging the use of energy from renewable sources, and boosting technologies for food processing and storage. These characteristics situate this research at the nexus of agricultural innovation, sustainable plant-based product processing, and computational modeling.
2 Materials and methods
2.1 Preparation of sample
Samples of freshly harvested okra (Abelmoschus esculentus) of the Nwaidu variety, prevalent in Southeastern Nigeria, were obtained from a municipal market in Owerri, Imo State, Nigeria. The product was categorised by size (length and diameter) and morphology, rinsed and distributed on a glazed surface to facilitate surface water evaporation. Taking into account the natural morphology of okra and the standard slicing method employed in Nigeria, the suitable samples were sectioned into a cylindrical form with an average diameter of 1.2 ± 0.25 cm and different thicknesses of 5, 10, and 15 mm, utilising a slicer and electronic vernier calliper (±0.001 mm; VLASOV, China) (Fig. 1). A designated batch size of 300 g of okra cylinders was utilized for thin-layer solar drying experiments. The average initial moisture content (88% wet basis) and the bone-dry mass of the representative samples were ascertained using the standard AOAC method.12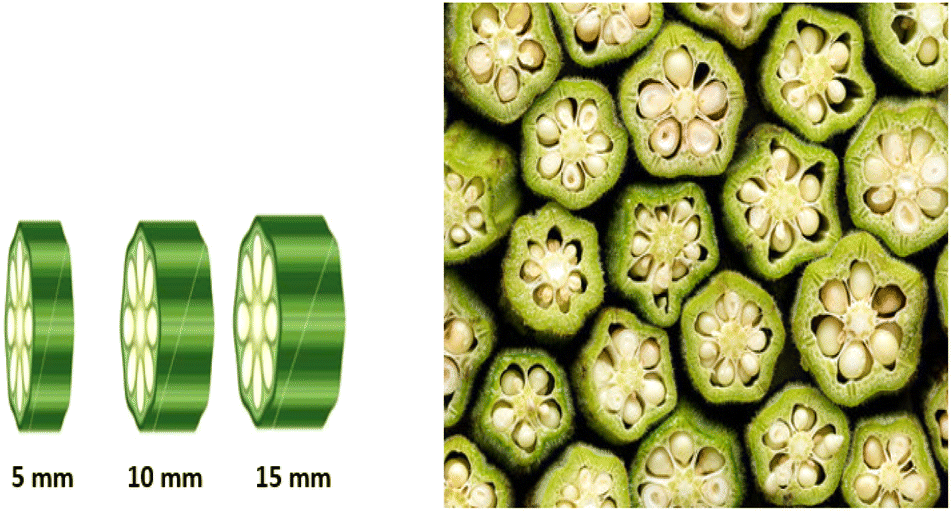 | ||
| Fig. 1 Fresh cut okra cylinders: (a) different sample thicknesses; (b) thin-layer batch solar drying arrangement. | ||
The moisture content of the dried okra samples was established by weighing the empty drying rack and subsequently measuring the mass of the drying rack with the samples at 20 minutes intervals. The moisture content was subsequently calculated based on mass loss. This method enables the observation of moisture content variations in the okra cylinders during solar drying. The drying tests concluded when stability in the mass of the dried sample was achieved, indicated by the last three mass-loss measurements differing by 0.1 g.
2.2 Experimental arrangement
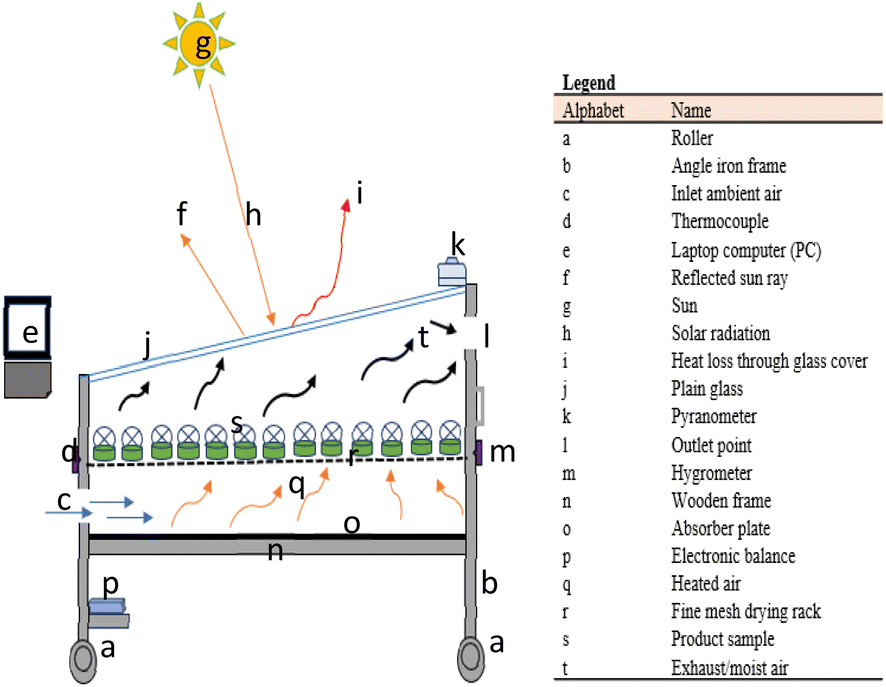 | ||
| Fig. 2 Schematic representation of the combined-mode solar drying of okra cylinders. | ||
The dryer component was fashioned by an NBF laminated speciality wooden board. A 3 mm thick glazing material was provided to cover the top of the dryer assembly and a rubber gasket was put right under the simple glass to achieve a hermetic state. Three opposed circular air vents (50 mm diameter) were constructed at the input and outflow sites for the natural circulation of air and to increase the efficiency of operation. The air vents at the input and output positions of the dryer produce a pressure differential in the drying compartment for convective heat movement. The absorbed heat in the plenum raises the enthalpy and vapour pressure of the working fluid, thereby decreasing the relative humidity in the chamber for product moisture extraction in the top plenum (drying rack) and subsequently expelling the moist air. The entire set-up was mounted on a roller-primed mild steel angle frame.
The drying studies spanned from 9:30 to 17:10 hours per day and continued the following day for an incomplete batch. At the end of each day for an unfinished batch of drying, the samples were taken from the drying compartment and placed in a polyethene material to avoid reabsorption of moisture. The entrance, exit, and drying chamber air temperatures were measured using calibrated K-type thermocouples (chrome-alumen, T-52) with an accuracy of ±0.015 °C coupled to a data collecting system (HH1147; Omega, USA) with an accuracy of ±0.1 °C. The sun radiation intensity was measured and recorded with a calibrated pyranometer (Apogee MP-200, serial No. 1250, USA). The relative humidity in the drying unit and of the ambient air was monitored using a Lutron humidity meter (Model: HT-305, accuracy ± 0.5%) and the sample mass loss was measured using a precision electronic balance (Camry Instruments Ltd, China; accuracy ± 0.01 g, Model: ACS-ZC41G).
Throughout the drying period, the experimental observations of the product mass and moisture evaporation as well as other process parameters were regularly observed and recorded at 20 minutes intervals. The field tests were done at drying ambient air temperatures and relative humidity of 21.2 °C ≤ T ≤ 32.8 °C and 48.4% ≤ Rh ≤ 82.4%, respectively, whereas the collector outlet temperature was in the range of 34.7 °C ≤ T ≤ 52.5 °C. The sample size and shrinkage of the dried okra cylinders were measured by getting the mean of caliper measurements as well as their displaced volume at sequential drying periods for each of the three thickness groups. The drying procedure was terminated when the moisture continent readings had no apparent variation after two subsequent mass measurements. It is desirable to remark that in all measurements, a marginal difference of <5% between replications was recorded.
2.3 Theoretical analysis
 | (1) |
 M and Mi are moisture content at any time and initial moisture content (% wb), respectively.
2.3.2.1 The moisture diffusion coefficient
 .
The coefficient of moisture diffusion is an important physical and transport attribute of food materials especially fruits and vegetables whose expression is a function of the product form, moisture content, and temperature.14 This predominant drying mechanism which happens in the falling rate phase is governed by the internal water differential of the isotropic food product.15 Therefore, diffusive transport processes can be utilized to simulate drying as a more practical physical technique, considering its widespread usage, especially for food and wood items. Based on the cutting geometry of the okra samples which are assimilated to an infinite cylinder, the numerical simulation of the moisture transfer in two-dimensional cartesian (2D) and cylindrical coordinates for an infinite cylinder according to Fick's diffusion law in addition to moisture evaporation is expressed as:
.
The coefficient of moisture diffusion is an important physical and transport attribute of food materials especially fruits and vegetables whose expression is a function of the product form, moisture content, and temperature.14 This predominant drying mechanism which happens in the falling rate phase is governed by the internal water differential of the isotropic food product.15 Therefore, diffusive transport processes can be utilized to simulate drying as a more practical physical technique, considering its widespread usage, especially for food and wood items. Based on the cutting geometry of the okra samples which are assimilated to an infinite cylinder, the numerical simulation of the moisture transfer in two-dimensional cartesian (2D) and cylindrical coordinates for an infinite cylinder according to Fick's diffusion law in addition to moisture evaporation is expressed as: | (2) |
 is the moisture diffusivity (m2 s−1); ρo is the density of the porous okra sample (kg m−3).
Along a cylinder, there is a predominant radial internal water diffusion path. Therefore, eqn (2) simplifies to:
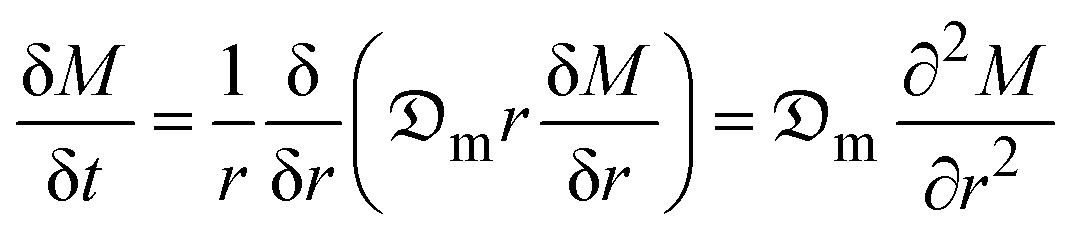 | (3) |
Generally, an even distribution of the initial moisture content in the food matrix is taken into account, given as:
| At time t = 0: M(r, 0) = M0 | (4) |
For the center symmetry moisture differential consideration, the boundary condition can be given as:
 | (5) |
The superficial convective drying boundary condition is expressed as:
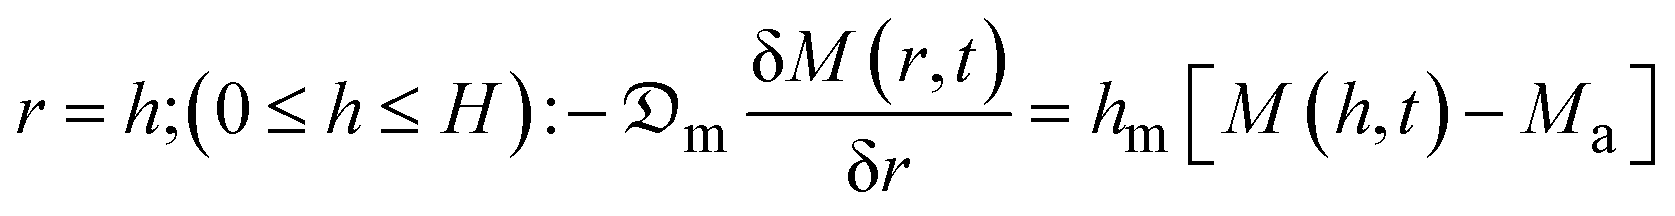 | (6) |
Given the complexity of the analytical solutions of the moisture diffusion model, simplifications are made by reducing to 1D cartesian expression and considering the boundary conditions (eqn (4)–(6)), the final Fickian solution for an infinite cylinder geometry can be expressed as:16
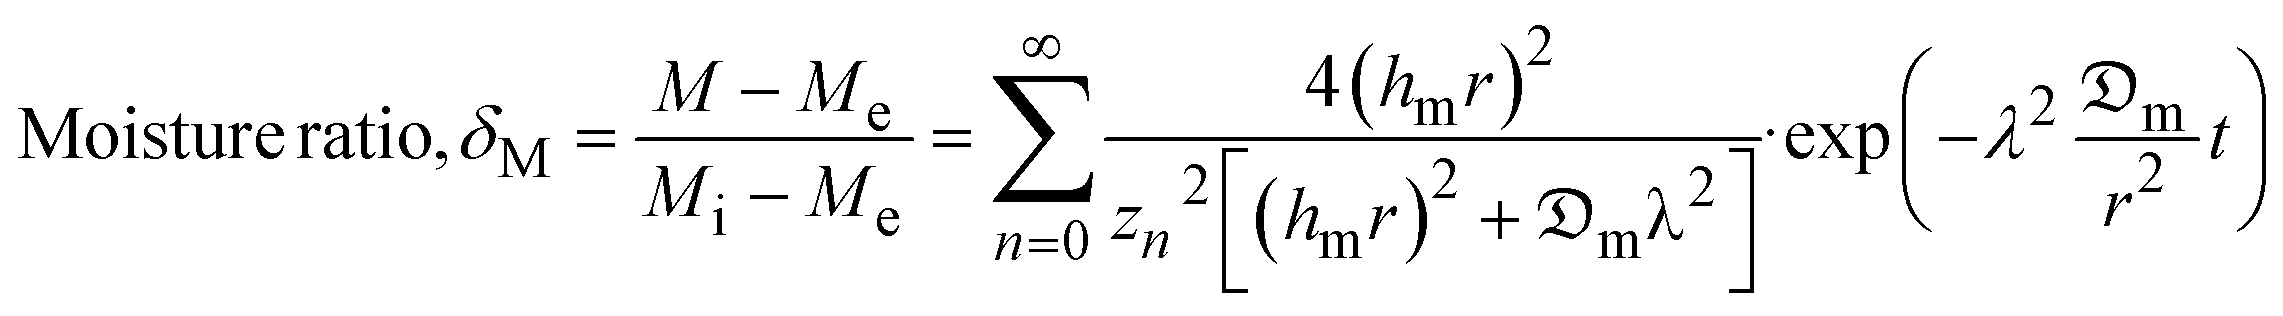 | (7) |
Eqn (7) can further be simplified as:
 | (8) |
 | (9) |
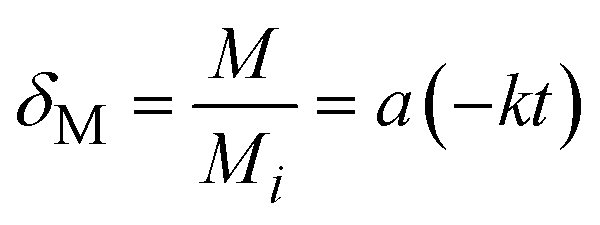
Considering the shrinkage influence on the effective moisture diffusion for a cylinder form and selecting the third term of the series in eqn (7), the Fickian solution yields:
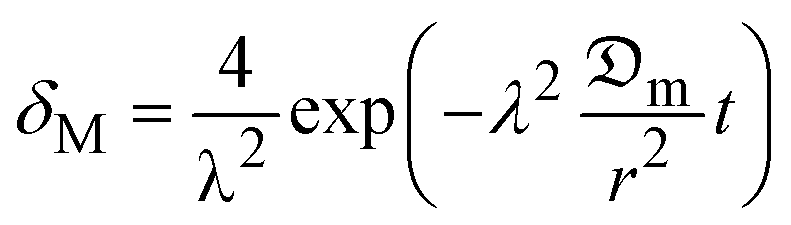 | (10) |
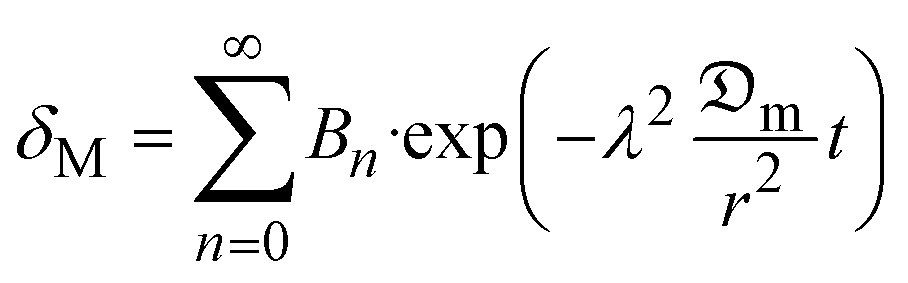
Linearizing eqn (10) gives a simple solution of the form:
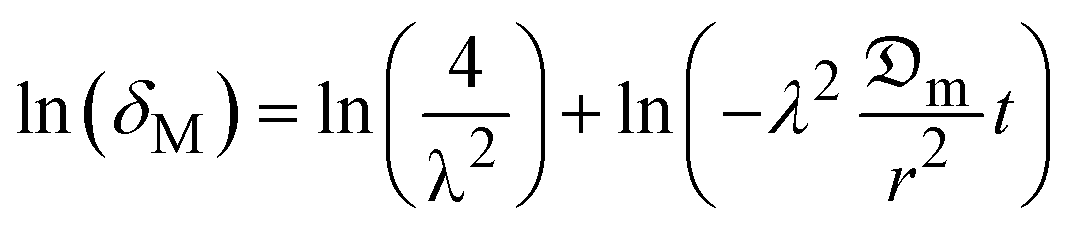 | (11) |
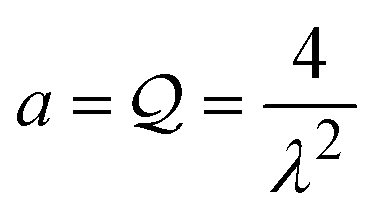
The logarithmic form of eqn (11) reduced to the 3rd parameter conceded a linear function between ln(δM) and drying time (t), from which the value of  was estimated as the slope (
 ), given as:
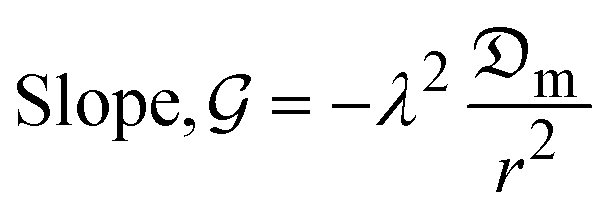 | (12) |
The coefficient of moisture diffusion,  , is established by the following:
Calculating δM-values from the experimental data at each time, t.
Plotting the curve of ln(δM) against time and obtaining the linear function 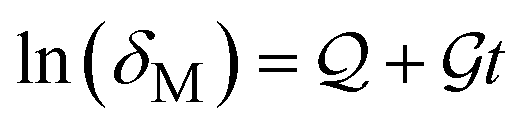 , where
  and
and  are the intersection and slope, respectively.
The root of the characteristic equation, λ2, is estimated from the intersection,  , and then reinstated into the slope,
  , for computation of the diffusion coefficient.
2.3.2.2 Coefficient of mass transfer, hm. Estimation of the convective mass transfer coefficient (hm) for okra cylinders undergoing a thin-layer drying process is established on the assumption that variations in moisture loss are related to specified parameters such as the drying constant, k (s−1), or the dimensionless delay variable, a. The cumulative impact of several transport phenomena during drying was considered. Given the analytical eqn (10), the Henderson & Pabis drying model defined by eqn (13) is comparable.
 | (13) |
 and k =
 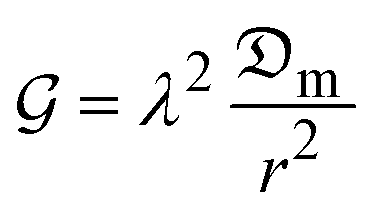 .
.
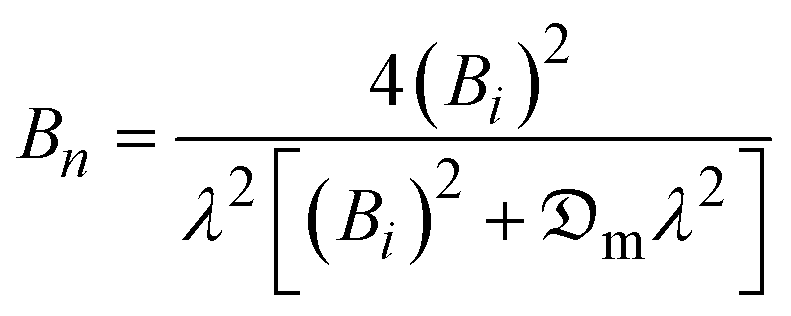
The values of a and k will be substituted to obtain hm. Consequently, the convective mass transfer coefficient, hm, and moisture diffusion coefficient,  , are related by the dimensionless mass transfer Biot number, which is a function of the product geometry which signifies the ratio of the resistance to heat transfer from the food matrix to the product surface expressed as:
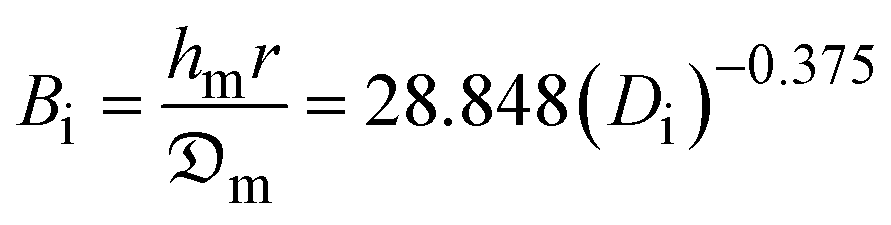 | (14) |
 | (15) |
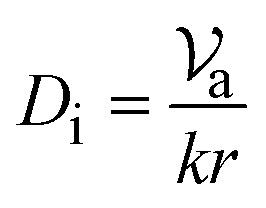
Eqn (14) is valid for Bi > 0.1 (i.e., 0 ≤ Bi ≤ 1) and allows estimation of hm for a known Bi-value (Ouedrago et al., 201714,23).where  is the velocity of the ambient air (m s−1); Di is Dincer's number.
The estimation of the mass transfer parameters was done by the following steps:
(i) Determination of the  value at each drying time of the experimental data.
(ii) Obtaining a and k values by combining eqn (10) and (14).
(iii) Calculating the Dincer and Biot numbers using eqn (15) and (14), respectively.
(iv) Deducing from eqn (14) the coefficient of mass transfer, hm.
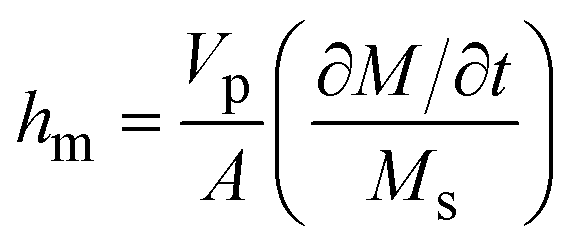
To evaluate the shrinkage effect on hm, the straightforward equation given by Dhalsamant et al.4 considering the product volume and exposed area is adopted thus:
 | (16) |
2.3.2.3 Shrinkage parameter for evaluating hc and hm. As stated earlier in this study, shrinkage is an occurrence that manifests during the convective drying of food materials. It accounts for the most noticeable visual changes in food quality apart from colour. During the drying process, there is always a contraction of the viscoelastic matrix of the food sample resulting in the collapse of intracellular water-holding tissues leading to volume decrease and distinctive dimensions of the product. Dhalsamant et al.4 and Llave et al.17 hypothesized that an incessant decline in product volume produced by shrinkage deformation in the course of drying is proportional to moisture shortages. However, in the vast majority of studies addressing okra drying, shrinkage is not taken into account.18–23 Consequently, in the examination of shrinkage influence during the process of simultaneous transfer of heat and moisture, the methodology of per cent sample shrinkage adopted by Nwakuba et al.24 is stated as the ratio of product volume per given time to the original product volume:
 | (17) |
 is the product shrinkage (%);
  denote product volume at any given drying time and at the initial time, respectively.
Experimental variations in the radial and longitudinal dimensions of the okra sample were recorded by taking measurements of the cylinder heights (sample thickness) and diameter with the use of a vernier caliper. This was carried out at consistent intervals of 20 minutes during the drying period. Afterwards, the radial and axial (longitudinal) deformation parameters of shrinkage in the visco-elastic food material were stated in terms of sample diameter and height as  , respectively. Di and Hi are the initially measured values of the cylinder diameter and height, respectively. The proportion of shrinkage at each dying interval was computed by eqn (17). Given the product moisture loss, the shrinkage velocity (
 ) was estimated by taking into account the resultant shrinkage deformation (
 ) in radial and axial directions as a function of drying time as indicated in eqn (18):
 | (18) |
2.3.2.4 Thermophysical parameters. The estimation of the thermophysical correlations such as the specific heat capacity, thermal conductivity, latent heat of vaporization, density etc. for combined-mode solar drying simulation of heat and mass transfer processes in okra samples is presented in Table 1.
| Parameter | Expression/value | Unit | References |
|---|---|---|---|
| Sp. heat capacity of okra, Co |
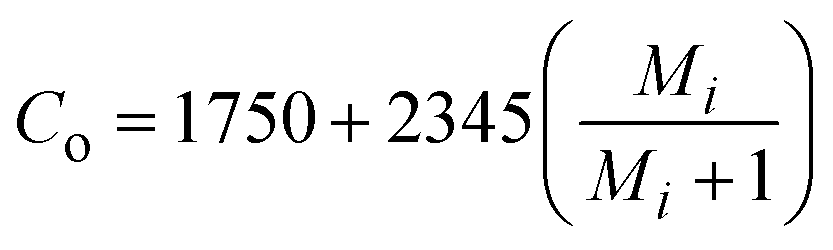
|
J kg−1 K | 5 |
| Thermal conductivity of okra | k = 0.49 − 0.443e−0.206Mi | W m−1 K | 5 |
| Thermal conductivity of air | 0.0287 | W m−1 K | 23 |
| Average density of okra | ρ = 440.001 + 90Mi | Kg m−3 | 5 |
| Initial moisture content | M i = 87.99 | % wb | Experimental |
| Final moisture content | M = 9.99 | % wb | Experimental |
| Density of air | ρ a = 1.073 | Kg m−3 | 14 |
| Specific heat capacity of air | Cpa = 1005.04 | J kg−1 K | 14 |
| Avg. initial & final air temp. | T i = 27.82 & Tf = 53.43 | oC | Experimental |
| Avg. ambient air velocity |
|
m s−1 | Experimental |
| Avg. solar radiation intensity | I g = 412.20 | W m−2 | Experimental |
| Solar irradiation | 416.55 | W m−2 | Experimental |
| Velocity of air | 1.33 | m s−1 | Experimental |
| Initial product temp. | 27.82 | oC | Experimental |
| Final product temp. | 53.6 | oC | Experimental |
| Max. Time for drying | 7 | h | Experimental |
| Avg. Sample diameter | 12 | mm | Experimental |
2.4 Error analysis
Errors and uncertainties may arise through instrument use, calibration, measurement of experimental variables etc.2 This study entailed different specific measurements like air temperature, mass of moisture loss, product temperature, solar flux, sample dimensions, etc. The instruments used for these variable measurements have their accuracies which lead to uncertainties (errors) in the determination of the coefficient of heat transfer, hc. The experimental uncertainties are calculated using the principle of uncertainty propagation. The uncertainty was taken to be equal to the standard deviation as recommended by the International Organization for Standardization.25 An uncertainty analysis was conducted for the experimental data by solving the partial derivatives and inputting the values of the measured variables to determine the magnitude of this uncertainty. The complete expression of the error analysis is given in the works of Tripathy and Kumar2 and Dhalsamant et al.4 The statistical errors are given by eqn (19)–(22):Maximum possible error in hc:
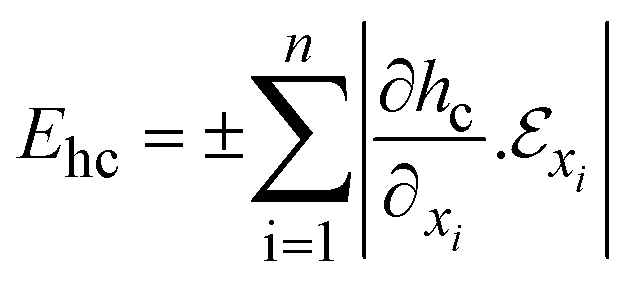 | (19) |
The statistical limit error (uncertainty) in heat transfer coefficient, hc, is expressed as:
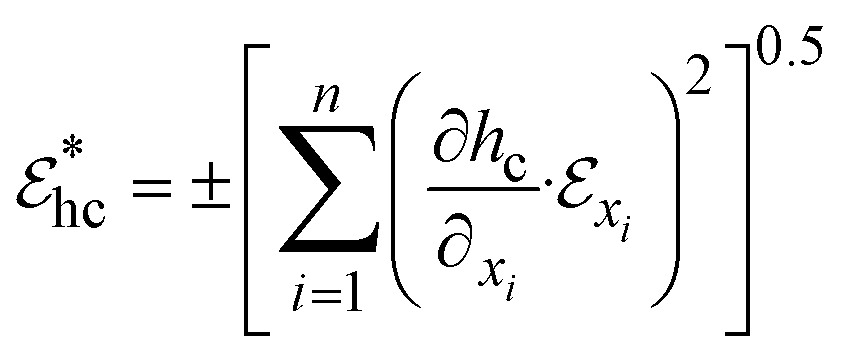 | (20) |
 denotes error in measuring hc, x and xi represent the directly measured variables and n-measured variables influencing hc, respectively. The limit error and statistical limit error values for estimation of hc are given respectively by:
 | (21) |
 | (22) |
2.5 Statistical tests and validation
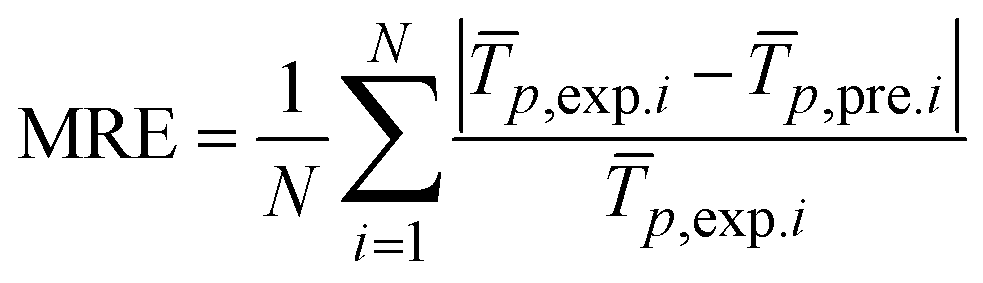
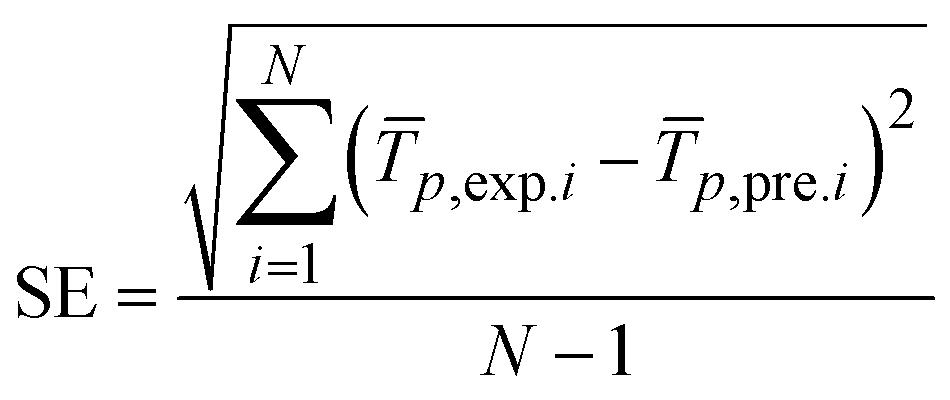
The reliability of the results of this study was validated by comparing the simulated and experimental transient dryer temperatures and moisture ratio profiles of the 10 mm thick okra cylinder. The prediction capability of the model was verified by the generally adopted statistical test-mean absolute error (MAE) and the standard error (SE) expressed in eqn (23)–(25) as: | (23) |
 | (24) |
 | (25) |
![[T with combining macron]](https://www.rsc.org/images/entities/i_char_0054_0304.gif) p,exp.i and p,pre.i denote the mean experimental and predicted product temperatures for the ith observation, respectively; N represents the number of observations.
p,exp.i and p,pre.i denote the mean experimental and predicted product temperatures for the ith observation, respectively; N represents the number of observations.
2.6 Numerical approach: COMSOL simulation
 | ||
| Fig. 3 (a) Computational domain and (b) meshing of an okra cylinder. | ||
The analysis of okra cylinder temperature during drying was conducted using heat transfer in the solid module and simulation of the mass transfer was conducted using the transport of diluted species. The shrinkage effect that took place throughout the drying process was interpreted using a moving mesh module. After all the parametric equations had been appropriately defined, the heat and mass equations were coupled in the COMSOL study interphase by concurrently selecting ‘heat transfer in solids; surface-to-surface radiation’ in the heat transfer module, ‘Transport of diluted species’ and ‘general form of PDE’.
In this study, the arbitrary Lagrangian–Eulerian (ALE) approach was utilized for more accurate sample deformation prediction with higher precision to account for the influence of sample shrinkage. This work used a time-dependent study to examine the variance of time between 0 and 6 hours of sunshine. Runs of the numerical simulation were conducted on a personal computer with an Intel® Core™ i5 at 2.90 GHz and 16 GB RAM using a Microsoft Windows 10 (64 bit) PC. Fig. 4 displays the simulation process and implementation.
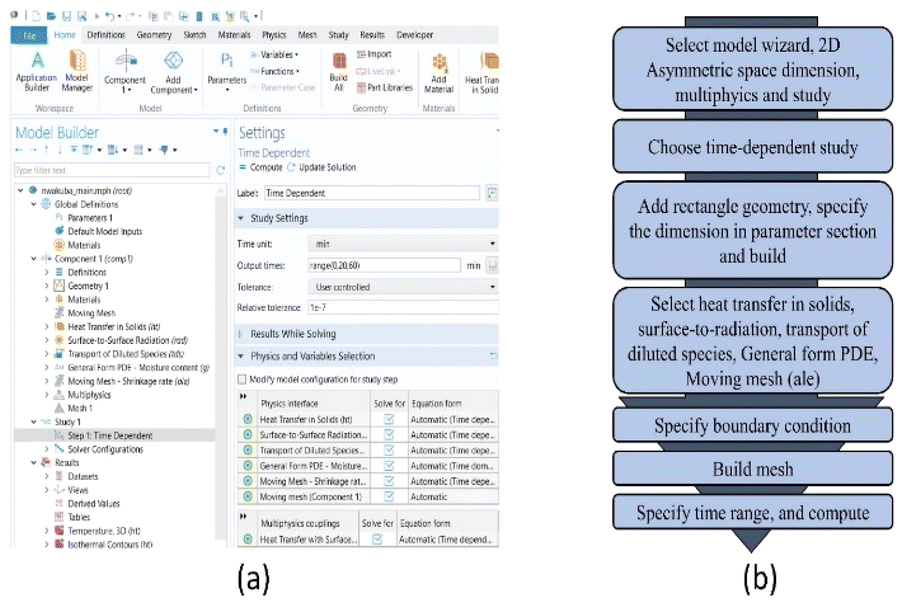 | ||
| Fig. 4 Numerical simulation procedure and implementation in COMSOL Multiphysics; (a) screenshot of model parameters; (b) flowchart. | ||
(a) An okra cylinder is a nonfinite and dense object.
(b) There is a continuous intra-cellular shrinkage of the isotropic food product.
(c) Solar radiation is the only source of air heating and as such gives the total heat transfer.
(d) Diffusion is the dominant mode of moisture transport in the food sample.
(e) There is a uniform distribution of moisture and temperature in the entire sample at the early phase of the drying process.
3 Results and discussion
The effectiveness of a combined-mode solar crop dryer rests predominantly on the air collector exit temperature which hinges on ambient conditions such as solar flux, prevailing air temperature, and relative humidity. These environmental parameters, in turn, can influence the air temperature within the solar-air heater (collector), which has a substantial impact on the rate of moisture extraction from food samples. Consequently, it is of the utmost importance to study the performance of the solar-air heater by exploring the changes in the collector exit air temperature throughout the drying cycle for a specific test set-up. This variable plays a crucial role in determining the acceptability of the dried food product, as the quality of the majority of dried agro-based materials is highly dependent on drying air temperature and depreciates at temperatures above the permissible threshold.Fig. 5 displays the hourly change in the intensity of the solar radiation, outlet temperature of the air collector and the relative humidity of the drying chamber with respect to the duration of the drying process during the combined-mode solar drying of 10 mm diameter okra cylinders. There was moderate fluctuation in temperature data, as seen by the mean temperature of 45.51 °C with a standard deviation of 6.15 throughout all experiments. The continuous rise in the collector temperature which varied between 34.74 °C ≤ Tc ≤ 52.9 °C for a total drying time of 500 minutes resulted in a commensurate decline in the samples' moisture content, while the relative humidity of the drying chamber pendulated between 53.3% ≤ Rh ≤ 82.4%, with a mean value of 65.1% and a standard deviation of 11.08 indicating higher variations. The mean collector output temperature, however, depended upon the intensity of the incident solar flux which changes with drying time and ambient drying conditions (air temperature, relative humidity, wind speed etc.). Diminution of the solar intensity owing to weather interference such as precipitation, sun dispersion by vapour molecules, etc. reduces the moisture-carrying capacity of drying air, which negatively impacts the dryer system's thermal efficiency.
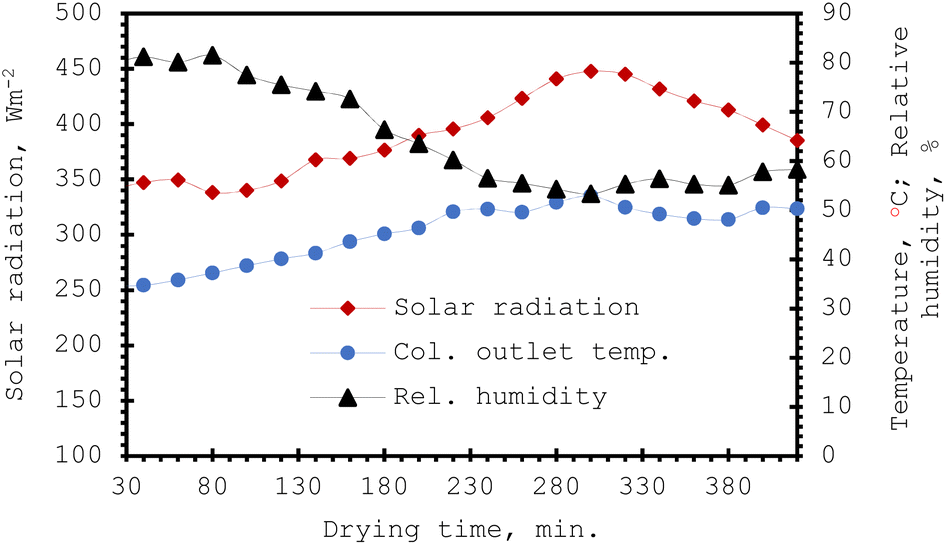 | ||
| Fig. 5 Variations of air conditions and solar radiation intensity with drying time during combined-mode solar drying of 10 mm diameter okra cylinders. | ||
As drying time advanced, the mean quantity of solar radiation grew to an utmost value of 447.8 W m−2 at 13:40 hours (300 min) and began to decline. This relative increase in the solar flux with the collector outlet air temperature generated a water vapour upsurge in the drying air and a fall in air relative humidity, and thus boosted the rate of specific moisture removal. The relative humidity of the integral unit varied inversely with the intensity of the incident radiation. The reports of Nwakuba et al.24 and Uzoma et al.26 corroborated a comparable pattern. However, the relative humidity of the drying air recorded a maximum value of 82.4% after 80 min and followed a declining trend (to a minimum value of 385.3 W m−2 at 420 min) as the solar flux and drying time increased, resulting in a gross drop in the enthalpy of the collector outlet temperature. The measured solar radiation had a considerably lower variability than relative humidity, with a mean of 381.27 W m−2 and a standard deviation of 38.46 W m−2. The results suggest that the process outcomes under investigation are significantly influenced by temperature and solar radiation (P < 0.05). The lack of significance in relative humidity may have been triggered by its very large variability (standard deviation of 11.08). These findings are consistent with earlier research showing the complementary effects of solar irradiation and air temperature in agricultural drying operations. A similar pattern was observed for the 5 mm and 10 mm okra sample thickness. The mean collector outlet temperature values of the 5, 10, and 15 mm diameter okra samples were respectively obtained thus: 44.17 °C, 46.28 °C, and 42.36 °C, respectively, whereas their corresponding solar intensity values were: 408.74, 411.32, and 416.55 W m−2, respectively; ambient air temperature: 26.13, 25.66, and 27.24 °C, respectively; the ambient relative humidity ranged between 51.2% and 74.1% during the experimental period.
The impact of air temperature, relative humidity, and solar radiation on each trial was evaluated using an analysis of variance (ANOVA) test. The variance between the means of the experimental variables (collector outlet temperature, relative humidity, and solar radiation) is statistically significant (P-value < 0.00031) at an α-level of 0.05. This statistically implies that one of the treatment means (variables) varies greatly from the others in terms of their impacts.4,26 Therefore, a post-hoc test (Tukey's Honestly Significant Difference, HSD, test) was conducted to ascertain the variable or variable combination that differs most significantly. The collector outlet temperature and relative humidity statistically differ, whereas no statistical difference between relative humidity and solar radiation existed. The substantial discrepancy between collector outlet temperature and relative humidity results from their inverse relationship, whereby rising temperatures reduce relative humidity because of the air's increased ability to hold moisture. On the other hand, the correlation between solar radiation and relative humidity implies that constant solar irradiation levels minimize fluctuation by stabilizing relative humidity. This demonstrates how temperature and relative humidity have a stronger thermodynamic connection during drying, although sun radiation has an indirect effect on both.
3.1 Influence of sample thickness on the drying behaviour of okra cylinders
A passive integral-type solar dryer was used to dry cylindrical okra samples of varying thicknesses (5, 10, and 15 mm) with a mean initial and final moisture content of 87.99% wb and 9.99% wb, respectively. The drying behaviour of the varying thicknesses of the okra cylinders is illustrated in Fig. 6. Continual reduction in moisture ratio indicates that moisture diffusion controls both the inter and intra-cellular mass transfer. The drying curve, therefore, showed a course typical for drying agri-food products and denoted an initial upsurge in moisture removal rate, accompanied by a moisture drop in the successive phases, and asymptotically tending towards the equilibrium moisture ratio values.15 It can be remarked that an increase in sample thickness results in a corresponding rise in drying duration, which signifies a reduction in the mean rate of moisture loss due to the increased distance of capillary transport of diffused water in thicker (15 mm) samples. In addition, a total drying time of 320 minutes, 420 minutes, and 500 minutes was needed to safely dry the okra samples to the desired moisture content level of 9.9% wb for the studied sample thicknesses. Notably, a higher drying rate is achieved with the sample of increased exposed surface area per unit volume. This is exhibited by the 5 mm thickness samples.4,15 Statistical analyses show that the MR standard deviation values were found to be 0.27 for a thickness of 5 mm, 0.38 for a thickness of 10 mm, and 0.42 for a thickness of 15 mm. According to this pattern, variability rises with sample thickness. More uniform drying is suggested by the comparatively low variability for thinner samples, whereas the higher variability for thicker samples might be the consequence of an uneven moisture distribution in which the surface dries more quickly than the inside. This emphasizes the increased challenge of ensuring uniform drying in thicker samples under similar test conditions. The ANOVA test showed that the sample thickness had a statistically significant effect (P = 0.002) on the measured moisture ratio values at a 5% level of probability. Significant variations in the moisture ratio (MR) values between the sample thickness groups were found by post-hoc analysis using Tukey's HSD test. The largest difference was found between 5 mm and 15 mm, with the latter exhibiting significantly greater moisture ratio values. This reveals that sample thickness plays a crucial role since, under the same conditions, thinner samples dry more quickly.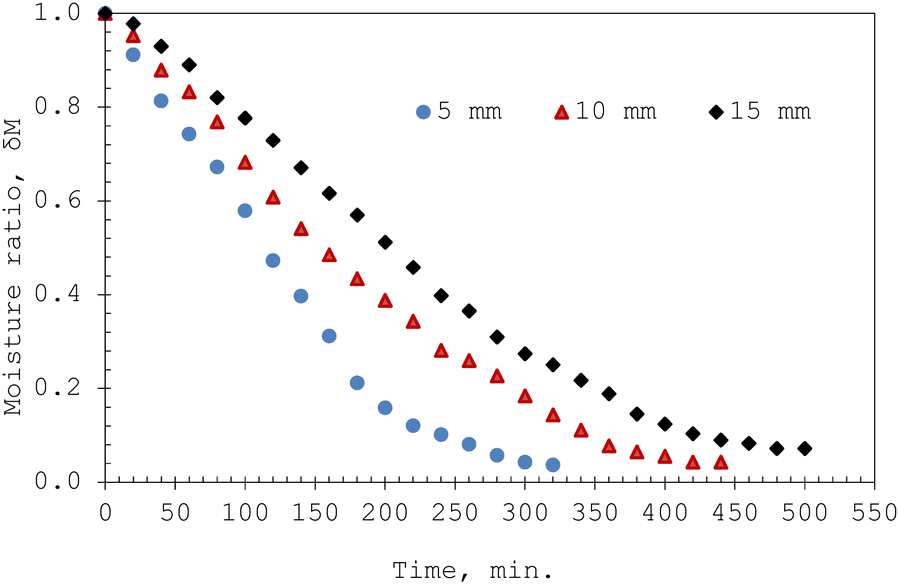 | ||
| Fig. 6 Drying behaviour of varying okra cylinders in an integral-type solar dryer. | ||
3.2 Convective heat transfer coefficient, hc
Fig. 7 presents the change in the heat transfer coefficient, hc, of okra cylinders at varying thicknesses with drying time with and without the shrinkage influence. From Fig. 7a, hc increased for each sample thickness as the drying duration increased when product shrinkage was considered. In addition, it was observed that higher hc values were obtained for the 5 mm thickness samples followed by 10 and 15 mm sample thicknesses. This is attributed to the larger exposed surface area per unit volume of the sample associated with a swift moisture extraction rate.2 Dhalsamant et al.4 reported a similar trend for potato cylinders dried in a mixed-mode solar dryer. Similarly, without considering the influence of shrinkage on the convective heat transfer coefficient, Fig. 7b shows a reduction in the hc-values with drying time for all the sample thicknesses. This is because, during the falling-rate phase, there was a gross reduction in the water extraction rate as the moisture content declined. This drying phase, which is suggestive of higher mass transfer resistance, exists when there is no surface water and has only evaporated water diffusing from the product matrix.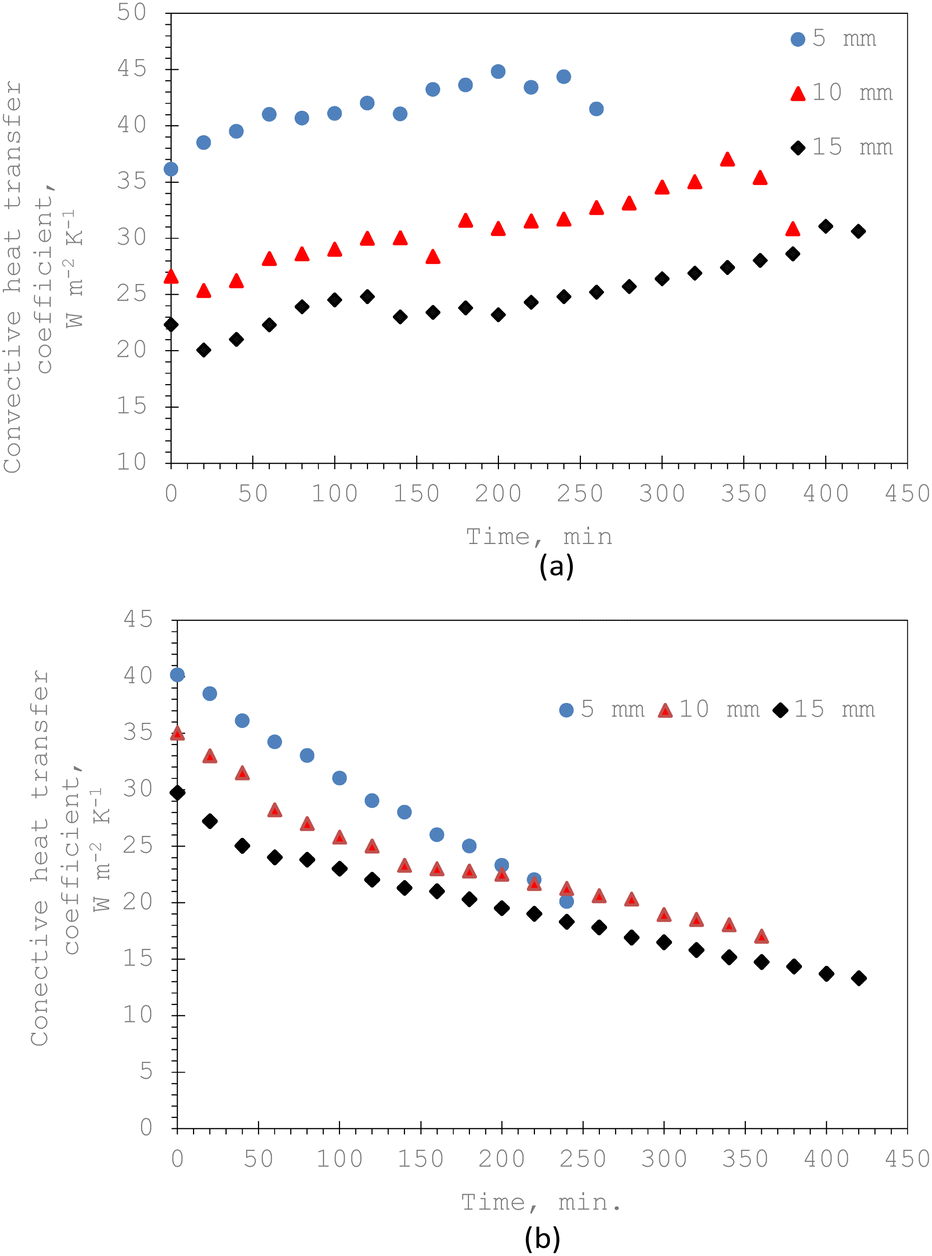 | ||
| Fig. 7 Variation of the heat transfer coefficient of 5, 10, and 15 mm thickness okra cylinders during integral-type solar drying: (a) with shrinkage and (b) without shrinkage. | ||
Also, the mean values of the convective heat transfer coefficient,  , at different thicknesses of the sample with and without shrinkage impact are given in Table 2 and are within the range of those published in the literature.2,27 These average quantities of heat flux that transcend the food matrix per unit area for a temperature rise under the influence of a gradient of one unit is considerable in the 5 mm thickness for both considerations as earlier stated. It is evident that including the shrinkage effect in drying different thicknesses of okra cylinders overshoots the
  estimation in the range of 72.29 to 78.45%. This is an expected outcome since product shrinkage gives rise to a reduction in the sample's linear dimension (thickness) with time, thereby boosting the rate of moisture loss which necessitates higher hc-values. Similar experimental reports have corroborated this observation.2,4,28 The convective heat transfer coefficients were statistically analyzed, and the results showed that under both shrinkage and non-shrinkage circumstances, variability, as measured by standard deviation, rises with sample thickness. The standard deviations for shrinkage were 0.38 (5 mm), 0.7 (10 mm), and 0.9 (15 mm), indicating that thicker samples had more variation in heat transfer coefficients. The standard deviations for non-shrinkage were 0.24 (5 mm), 0.5 (10 mm), and 0.66 (15 mm), indicating a comparable pattern but less overall variability because there were no dimensional changes. For both shrinkage and non-shrinkage circumstances, the P-value results verified statistically significant differences in heat transfer coefficients between the thickness groups (P < 0.05). For both situations, the 5 mm and 15 mm samples showed the highest statistical difference (P < 0.01), highlighting the crucial role that thickness plays in affecting the dynamics of heat transfer.
| Sample thickness (mm) | Convective heat transfer coefficient, hc (W m−2 K−1) | |
|---|---|---|
| Shrinkage | No shrinkage | |
| 5 | 41.56 | 29.73 |
| 10 | 30.84 | 23.87 |
| 15 | 25.06 | 19.66 |
Fig. 8 describes the test results of hc with and without shrinkage consideration for the 15 mm okra cylinder sample thickness. By considering the shrinkage influence, the sample thickness exhibited a somewhat linear shrinkage behaviour. The same phenomenon was observed for other studied sample thicknesses (5 and 10 mm). The obtained hc-values were 35.52% higher than the no-shrinkage hc-values at 240 min drying time and amounted to 62.29% (>1½ times) at 420 min of drying process termination. A comparable trend was noticed for 5 mm and 10 mm sample thicknesses. The mean heat transfer coefficient investigation for the 15 mm sample thickness under shrinkage (23.93 W m−2 K) and non-shrinkage (18.21 W m−2 K) circumstances showed that shrinkage causes a 35.52% rise in the mean hc, which is explained by an increase in surface area for heat transmission. The variability for shrinkage was higher (standard deviation = 0.8) than for non-shrinkage (standard deviation = 0.5), indicating that the shrinkage process is dynamic as it induces changes in the morphology of the samples, whilst non-shrinkage yields a more regular heat permeation. The strong impact of shrinkage on heat transfer ability was further demonstrated by statistical analysis (F = 2.12, P = 0.003), which further indicated a measurable and significant difference (P < 0.01) in hc values between the two situations.
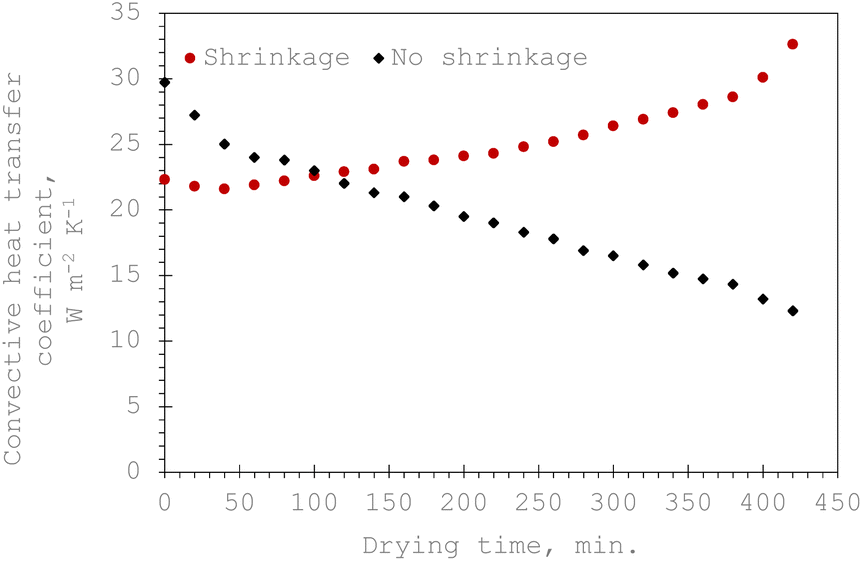 | ||
| Fig. 8 Comparison of the convective heat transfer coefficient during integral-type solar drying of a 15 mm thickness okra cylinder with and without shrinkage effects. | ||
The results of the experimental convective heat transfer coefficients during integral-type solar drying of okra cylinders with deformation effects were correlated through dimensionless parameters given by the general equations:2,29
 | (26) |
 | (27) |
 | (28) |
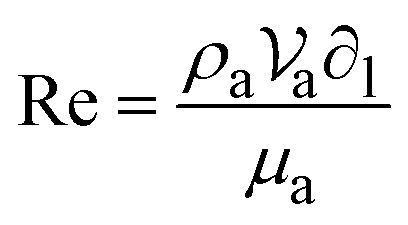
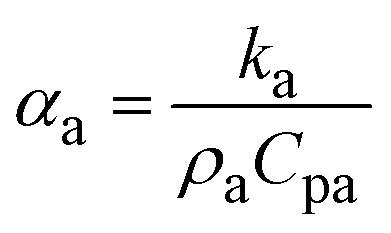
Experimental data for the mean drying air temperature (Ta) and air properties such as density (ρa), viscosity (μa), velocity ( ), thermal conductivity (ka), and specific heat capacity (Cpa) were computed (using the Engineering Software: Physical Properties Calculator and Cheresources: Thermodynamics – ChE) for the estimation of the Reynolds number values. C and n are constants, whose values hinge on the surface shape and flow pattern, respectively; ∂l is the typical length of the surface of interest (dryer length); αa is the thermal diffusivity of air (m2 s−1). The values of hc and air properties in eqn (26) are linearly regressed to obtain the values of c and n. The following empirical correlation between Nusselt and Reynolds numbers is obtained:
| Nu = 0.37Re0.65 [R2 = 0.9822; for 5 mm thickness] | (29) |
| Nu = 0.43Re0.68 [R2 = 0.9736; for 10 mm thickness] | (30) |
| Nu = 0.41Re0.66 [R2 = 0.9917; for 15 mm thickness] | (31) |
The slight differences in the values of c and n can be attributed to the degree of shrinkage in varying thicknesses of the product samples resulting in the change in the rate of moisture deficit during the drying process. These values, however, follow a related trend for food crops dried in an integral-type solar dryer.2,4,27
The uncertainties (statistical errors) in the experimental hc due to measurement errors are estimated using error analysis (Table 3). It can be seen that the statistical errors in  of okra cylinders (eqn (19)) are between 1 and 3.5% for the studied sample thicknesses.
| Error | Sample thickness | |||||
|---|---|---|---|---|---|---|
| 5 mm | 10 mm | 15 mm | ||||
| Shrinkage | No shrinkage | Shrinkage | No shrinkage | Shrinkage | No shrinkage | |
|
41.56 ± 0.35 | 29.73 ± 0.37 | 30.84 ± 0.29 | 23.87 ± 0.31 | 25.06 ± 0.59 | 19.66 ± 0.64 |
|
41.56 ± 0.31 | 29.73 ± 0.35 | 30.84 ± 0.27 | 23.87 ± 0.27 | 25.06 ± 0.54 | 19.66 ± 0.59 |
|
±0.012 | ±0.020 | ±0.019 | ±0.024 | ±0.026 | ±0.039 |
|
±0.011 | ±0.021 | ±0.018 | ±0.023 | ±0.025 | ±0.037 |
3.3 Mass transport coefficient
 and hm parameters.
In Fig. 9, ln(δM) versus time is plotted for different okra cylinder thicknesses. The values of the diffusion coefficient were estimated by linearization of eqn (13) and obtaining its variables (slope,
and hm parameters.
In Fig. 9, ln(δM) versus time is plotted for different okra cylinder thicknesses. The values of the diffusion coefficient were estimated by linearization of eqn (13) and obtaining its variables (slope,  , and intercept,
  ) with the regression coefficient tending towards unity (R2 > 0.98) as shown in Table 4.
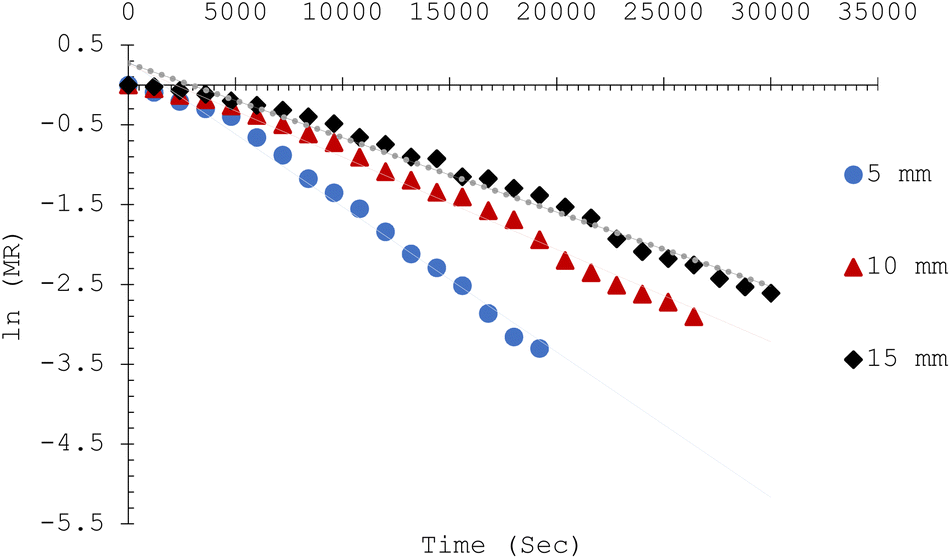 | ||
| Fig. 9 Linearization of ln(δM) = f(t) of the okra cylinders with shrinkage consideration. | ||
 and hm with shrinkagea
| Sample thickness (mm) | Slope,
|
Intersect,
|
λ 2 | K | a | R 2 | B i | D i × 106 |
|---|---|---|---|---|---|---|---|---|
| a λ = characteristic root of the drying equation; k = drying constant; a = dimensionless delay variable; R2 = coefficient of correlation; Bi = Biot number; Di = Dincer number. | ||||||||
| 5 | −1.84 × 10⁻⁴ | 0.24 | 16.67 | 1.843 × 10⁻⁴ | 0.24 | 0.9859 | 0.144 | 1.3616 |
| 10 | −1.26 × 10⁻⁴ | 0.32 | 12.50 | 1.259 × 10⁻⁴ | 0.32 | 0.9862 | 0.125 | 1.9932 |
| 15 | −9.27 × 10⁻⁵ | 0.39 | 10.26 | 9.269 × 10⁻⁵ | 0.39 | 0.9857 | 0.112 | 2.7073 |


The diffusion coefficients of the samples were computed using the correlation of the Biot–Dincer number (Table 4). The influence of the thickness of the okra cylinders on the mean values of the moisture diffusion coefficient ( ) and convective mass transfer coefficient (hm) is shown in Table 5. As the thickness of the samples increased, the
  -values increased from 3.913 × 10⁻¹⁰ to 8.129 × 10⁻¹⁰ m2 s−1 for the shrinkage consideration and from 5.106 × 10⁻¹⁰ to 9.521 × 10⁻¹⁰ m2 s−1 when no structural contraction is taken into account. This implies that more internal water diffuses across a unit area of sample per second under the effect of a potential difference. It further illustrates that more time is required by sample moisture to diffuse thicker samples at constant process conditions. However, these
  -values agree well with the range (10−11 ≤
  ≤ 10−8 m2 s−1) reported in the literature for food materials.30
 and hm at varying sample thicknesses with and without shrinkage effects
| Sample thickness, mm | Shrinkage | No shrinkage | ||
|---|---|---|---|---|
|
|
h m (m s−1) |
|
h m (m s−1) | |
| 5 | 3.913 × 10⁻¹⁰ | 6.927 × 10⁻⁸ | 5.106 × 10⁻¹⁰ | 8.467 × 10⁻⁸ |
| 10 | 4.197 × 10⁻¹⁰ | 5.310 × 10⁻⁸ | 7.387 × 10⁻¹⁰ | 6.686 × 10⁻⁸ |
| 15 | 8.129 × 10⁻¹⁰ | 4.156 × 10⁻⁸ | 9.521 × 10⁻¹⁰ | 5.347 × 10⁻⁸ |


In the tinier samples, the chemical potential of the internal water which primes moisture diffusion is affected by the volume reduction per unit sample and surface hardening, thus establishing an additional resistance to intracellular transport.4 A comparable trend was reported for other food products like bananas, cassava, tomatoes, and potatoes.4,31–33 It can also be observed that the  -value for the thickest sample is about 51.86% and 46.37% higher than that obtained for the thinnest sample for the shrinkage and no shrinkage conditions, respectively.
For the range of the studied thickness, the mass transfer coefficient, hm, varies inversely with the sample thickness. The diminishing effect of sample thickness on hm-values is because of the reduction in the area of exposed surface per unit mass at higher thickness values, which leads to a declined moisture extraction rate. The maximum and minimum hm-values obtained are 6.927 × 10⁻⁸ m2 s−1 and 4.156 × 10⁻⁸ m s−1 for 5 mm and 15 mm thicknesses, respectively when shrinkage is considered, whereas, for no shrinkage, it is 8.467 × 10⁻⁸ m s−1 and 5.347 × 10⁻⁸ m s−1. This indicates that the thickness of the samples has a noticeable influence on the samples' hm-parameter.
 and hm parameters.
Consideration of shrinkage impact in the estimation of the coefficients of effective moisture diffusivity and mass transfer for varying thicknesses of plant-based materials yields fascinating outcomes as remarkably seen in Table 5. Also, the mechanism of moisture movement from the intracellular spaces to the superficial region of the samples under structural and no structural deformation (shrinkage) for the 10 mm okra thickness is described in Fig. 10 by considering the variation of moisture diffusion coefficient with moisture ratio. The coefficient of moisture diffusion increases with moisture ratio reduction when no shrinkage effect is considered. A higher rate of moisture movement is an indication of a higher moisture extraction rate and increased surface area of samples and would result in reduced drying duration and substantial energy savings. Similarly, when structural changes (shrinkage) were considered, a different trend was observed.
and hm parameters.
Consideration of shrinkage impact in the estimation of the coefficients of effective moisture diffusivity and mass transfer for varying thicknesses of plant-based materials yields fascinating outcomes as remarkably seen in Table 5. Also, the mechanism of moisture movement from the intracellular spaces to the superficial region of the samples under structural and no structural deformation (shrinkage) for the 10 mm okra thickness is described in Fig. 10 by considering the variation of moisture diffusion coefficient with moisture ratio. The coefficient of moisture diffusion increases with moisture ratio reduction when no shrinkage effect is considered. A higher rate of moisture movement is an indication of a higher moisture extraction rate and increased surface area of samples and would result in reduced drying duration and substantial energy savings. Similarly, when structural changes (shrinkage) were considered, a different trend was observed.
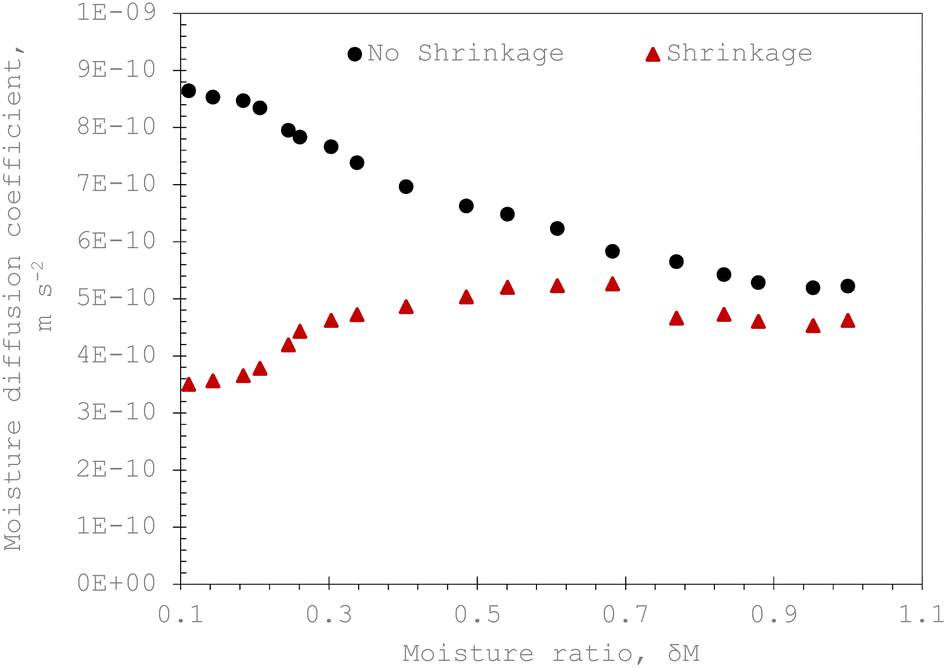 | ||
| Fig. 10 Influence of moisture ratio on the coefficient of moisture diffusion of okra cylinders under shrinkage and no shrinkage conditions. | ||
There is a considerable reduction in the moisture diffusion coefficient toward the end of the drying process. This is indicative of turgor pressure deficit, thermal and hygro-stresses, and cell collapse, with a resultant effect of structural and geometric loss which in all pose a resistance to effective moisture transport. Generally, it was observed that the mean  -values under no shrinkage conditions were double those with shrinkage consideration. This observation is in line with the findings of Dhalsamant et al.4 and Bennamoun et al.11 during convective solar drying of single cherry tomato and potato cylinders, respectively. A similar trend of
  variation with δM was observed for the 5 mm and 15 mm thicknesses of the studied sample. However, the statistical study confirmed the significant
  patterns under various situations. Based on the moisture transport properties of the product, the results are essential for enhancing their performance metrics. In the absence of shrinkage, the moisture diffusion coefficient (
 ) falls as the moisture ratio rises, most likely as a result of shorter diffusion routes. The results are statistically significant (P = 0.001, F = 12.34) and exhibit substantial variability (standard deviation: 0.05–0.12). On the other hand, under shrinkage conditions,
  rises as the moisture ratio rises, which is explained by microcracks or increased porosity. This results in greater variability (standard deviation: 0.10–0.20) and significant outcomes (P = 0.0005, F = 15.78). These patterns demonstrate the impact of product conditions on moisture transport and offer insightful information for improving product performance and design.
The change in the mass transfer coefficient with drying time under product shrinkage and no-shrinkage conditions is shown in Fig. 11. The convective mass transfer coefficient increased with the drying time as a result of increased hydrodynamic flow in the food sample matrix resulting from a higher thermal gradient (between the convective air and the product samples) and air enthalpy as the drying time and hourly solar radiation intensity increased. A similar observation was recorded for 5 mm and 15 mm thick samples. These observations conform with the works of Dhalsamant et al.4 and Queiroz and Nebra34 on the drying of potatoes and bananas, respectively.
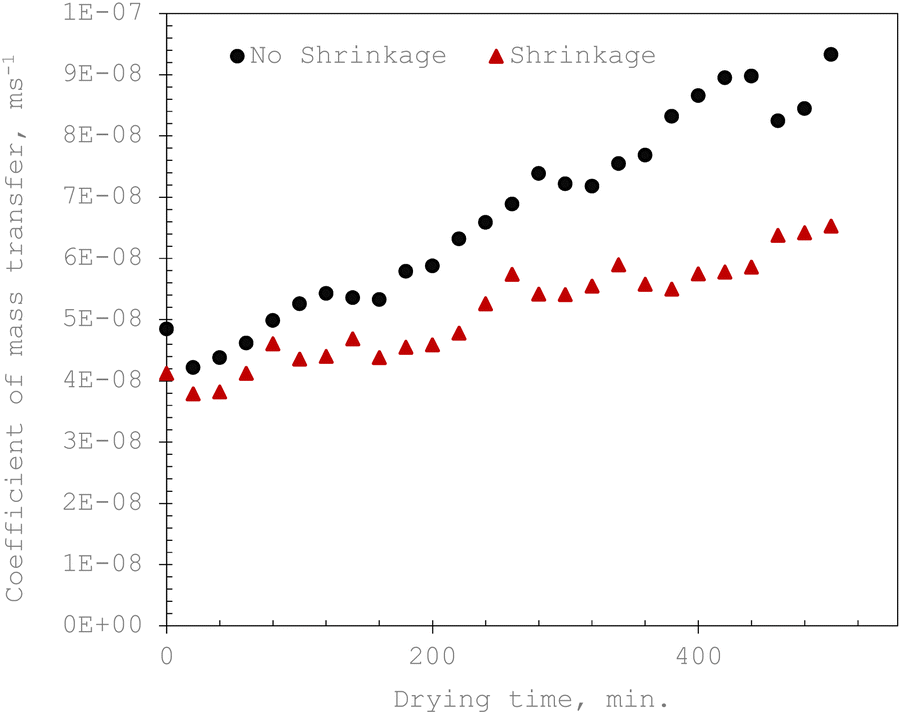 | ||
| Fig. 11 Variation of mass transfer coefficients of okra cylinders with drying time under shrinkage and no-shrinkage conditions. | ||
Lower hm-values were observed in the early stage of the drying process due to low solar radiation intensity which resulted in a gross reduction in the kinetic energy for rapid rate of heat and moisture transport in the okra samples. The marginal amount of heat generated by the solar dryer at this stage was taken in for surface moisture evaporation and was inadequate for mass transfer. Ignoring the influence of sample shrinkage in the analysis of mass transfer overrates the  and hm-values which span from 74.86 to 83.14% and 52.68 to 58.83%, respectively for the range of the studied sample thicknesses. As a result, it is critical to investigate the impact of shrinkage on dried food products to accurately estimate moisture transfer variables needed for drying model development and computer simulations.
Results for the non-shrinkage condition showed a P-value of 0.001 and an F-value of 12.34, which were statistically significant. In contrast,  rises when the moisture ratio rises under shrinkage conditions, which is explained by tiny fractures or increased porosity. This results in greater variation (standard deviation: 0.10–0.20) and significant effects (P = 0.0005, F = 15.78). Although the high F-values show that the independent variables (drying time or moisture ratio) strongly clarify the differences in the dependent variables, the low P-values (<0.05) affirm that the observed patterns for both
  and hm under shrinkage and non-shrinkage situations are statistically significant and not by random chance. This reinforces the findings' robustness and reliability and emphasizes the significance of taking shrinkage and non-shrinkage effects into account in moisture transport studies.
3.4 Activation energy, 
High water molecule bonding in food materials prevents moisture diffusion from taking place. Different food materials have varying degrees of bonding that result in more energy to overcome them. Activation energy, therefore, is the minimum energy requirement of water molecules in food materials to overcome the energy barrier due to water molecule bonding during product intra-cellular capillary transport. Larger sample moisture diffusion is caused by decreased activation energy, given by an upsurge in the value of the kinetic energy of water molecules.35 Activation energy governs the rate at which product moisture diffuses from the food matrix to the surface for eventual evaporation. The higher the 
 -value, the slower the water transport (at constant air temperature), because diffusion of water molecules begins only when they have attained the peak of the
  -barrier.36 It is, therefore, dependent upon the drying air temperature and moisture diffusion coefficient.
The determined  -values with and without shrinkage deformation were fitted into the modified Arrhenius equation to show their relative association with the solar collector outlet temperature expressed in eqn (32).
 | (32) |
 is the activation energy for moisture diffusion with the product matrix and mass transfer at the product-air boundary, respectively (kJ mol−1); Tc is the absolute temperature of the collector outlet air (K); Rg is the global gas constant (8.3144 kJ mol−1 K−1);
  and
and  are pre-exponential constants.
These parameters alongside the slope,  and coefficients of correlation are presented in Table 6.
| Sample condition |
|
|
R 2 | |
|---|---|---|---|---|
| 5 mm | Shrinkage | 1.2 × 10⁻¹⁸ | 48.63 | 0.8842 |
| No shrinkage | 21.2 × 10⁻⁶ | 20.19 | 0.9282 | |
| 10 mm | Shrinkage | 2.2 × 10⁻¹⁵ | 18.34 | 0.9150 |
| No shrinkage | 27.3 × 10⁻⁴ | 21.86 | 0.9843 | |
| 15 mm | Shrinkage | 6.1 × 10⁻¹² | 14.72 | 0.9311 |
| No shrinkage | 34.3 × 10⁻¹ | 23.25 | 0.9731 | |
The logarithm of the linearized expression of  (i.e.,
 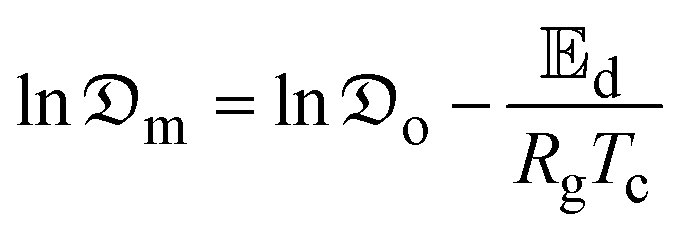 ) was plotted against
  and the
  -values deduced from
  . By substituting
  of the linearized function, the
  -values of the okra samples became
  . Therefore, the
  -values for the shrinkage and no-shrinkage conditions as well as the pre-exponential factor and corresponding correlation coefficients are given in Table 6. Moisture transport in okra cylinders requires activation energy in the range of 14.72 ≤
  ≤ 48.63 kJ mol−1 and falls within the
  -limit for fruits and vegetables.4,37 The correlation coefficients which ranged between 0.88 ≤ R2 ≤ 0.98 show a good Arrhenius model fitting and strong pact between diffusion coefficients
  and the collector outlet temperature at different cylinder thicknesses, as well as its capability to explain up to 98% of the variations in the moisture diffusion coefficients at varying collector outlet temperatures. Generally, rapid moisture transport occurs at increased diffusion and mass transfer coefficients.22 When the shrinkage effect is considered, more energy is required for effective moisture diffusion due to more microstructural deformation that impedes capillary flow. Therefore, increasing the product thickness when the shrinkage effect is considered reduces activation energy due to an increased number of pore spaces per unit volume of sample. In contrast, a reverse trend is observed in the no-shrinkage condition. However, the
  -values obtained without shrinkage effects are close to those reported in the literature for okra.19,20,32
3.5 Simulation of product temperature and moisture distribution
The results of the 3D simulation of temperature and moisture distribution in okra cylinders of varying thicknesses were likened to the experimental data to study the significance of the shrinkage occurrence on the drying behaviour of okra cylinders in a mixed-mode solar dryer. The model geometries were built and the boundary conditions were set to obtain the final result. The 3D temperature and moisture distribution profiles for the 10 mm sample thickness are given in Fig. 12 and 13, respectively. Heat distributions in the samples with shrinkage and no-shrinkage effects at the early drying stage and after an increase in the okra temperature are shown. The impact of the shrinkage parameter (Fig. 12a–c) on the heat distribution in the samples was quite evident as the surface absolute temperatures of the okra cylinder were 300, 301, and 310 K after 20, 30, and 60 minutes, respectively. In contrast, the inner/center cylinder/product temperature ranged between 298 ≤ Tp ≤ 308 K. This rise in cylinder temperature is attributed to the combined effects of the convective and radiative heat flow to the sample which constantly surged the sample temperature until the desired final moisture level of 9.99% wb was reached. As the drying duration is elongated, the shrinkage effect causes a substantial reduction in the cylinder volume. This phenomenon, therefore, hastened heat conveyance from the product surface to the midpoint, leading to a swift rise in sample temperature. Similarly, 5 and 15 mm thick samples exhibited an identical temperature distribution profile. | ||
| Fig. 12 3D plots of temperature distribution of okra slices after drying for 20 min, 30 min, and 60 min for shrinkage and no-shrinkage effects. | ||
On the other hand, when shrinkage is neglected, no visible change in material temperature and volume was observed at varying drying times (Fig. 12). This has the following key implications: (i) the no-product temperature change is an indication of a slow drying process which can impair the overall quality attributes of the product; (ii) the drying mechanism will probably be sluggish with constant product temperature, resulting in insufficient moisture extraction. A temperature rise is a catalyst for evaporated moisture; so, if the okra's temperature remains unchanged, the energy supplied may be inadequate for efficient drying. Disregarding the shrinkage effect may lead the heat and mass transfer model to overestimate the drying rate, as shrinkage generally boosts crop density, diminishes the internal water diffusion pathway, and modifies heat transfer; (iii) overlooking shrinkage may result in erroneous drying time estimations. Shrinkage influences the food product's exterior area and volume, which further influences the rate of heat and mass distribution. Omitting shrinkage from the heat transfer model may lead to an overestimation of the efficiency of the drying process, since the model may not account for the diminished drying rate resulting from the reduction in surface area exposed to air caused by cell deformation.
The moisture distribution profiles of the 10 mm thick okra cylinder at varying drying durations of 20 to 60 min are given in Fig. 13. The findings indicate that drying rates were higher at the surface where the ambient air and solar flux directly impact the sample leading to swifter evaporation of unbound moisture and subsequent greater structural deformation due to the moisture-laden nature of okra. Thus, the moisture content at the interior of the dried sample was substantially more than that at the exterior. Fig. 13 show that the predicted moisture content at the product's surface for shrinkage consideration diminished far more rapidly than that predicted with no consideration of shrinkage. As the drying duration extended, the rate of capillary transport increased and a marginal difference in the product moisture was noticed between the interior and the exterior parts, as the exterior moisture content remained in equilibrium with the moisture content of the drying air. The moisture differential continues to increase as a result of the reduction in moisture diffusion and a rise in the product's exterior temperature, and thus there is a considerable amount of structural deformation in the food sample. Moreover, after 60 minutes of drying, the interior moisture content of the dried sample was measured as 0.65 kg kg−1 d.b, whereas that of the exterior was 0.54 kg kg−1 d.b. This, therefore, suggests a considerable moisture gradient in the dried okra cylinder. At the end of the drying period, the moisture content prediction with the shrinkage effect was lower than the non-shrinkage effect. This is so because generally, the porosity of okra is greatly affected by micro-structural deformation which inhibits capillary movement at the beginning of the drying phases, whereas in the subsequent drying phases, shrinkage facilitated moisture transport and shortened moisture movement/capillary channels. These findings align with the reports of Jiang et al.5 and Ratti.38
 | ||
| Fig. 13 3D plots of moisture distribution of okra after drying for 20 min, 30 min and 60 min for shrinkage and no-shrinkage effects. | ||
3.6 Finite element (FE) model validation
A comparison of the predicted and actual temperature values of the 10 mm thick okra cylinder was carried out to evaluate the dependability of the experimental hc (Fig. 14). As observed, the model adequately simulates the field test results. Furthermore, the model's prediction power can be supported by commonly adopted statistical evaluation techniques given in eqn (23)–(25), with values of 0.239, 0.001, and 0.053 for mean absolute error (MAE), mean relative error (MRE), and standard error (SE), respectively. These low error values suggested that the developed physics-based model was capable of making satisfactorily accurate predictions. | ||
| Fig. 14 Validation plot of the predicted product temperature profile for a 10 mm thick okra cylinder. | ||
In predicting the moisture ratio profile (Fig. 15), the experimental data was used to validate the moisture transfer model developed by COMSOL Multiphysics. It is evident that the simulated results closely match the experimental findings. The model's prediction potential is tested using the error statistical expressions (eqn (23)–(25)). The corresponding values for MAE, MRE, and SE are 0.08, 0.19, and 0.03, respectively. The relatively low values of these error parameters suggest a stronger prediction potential of the physics-based model.
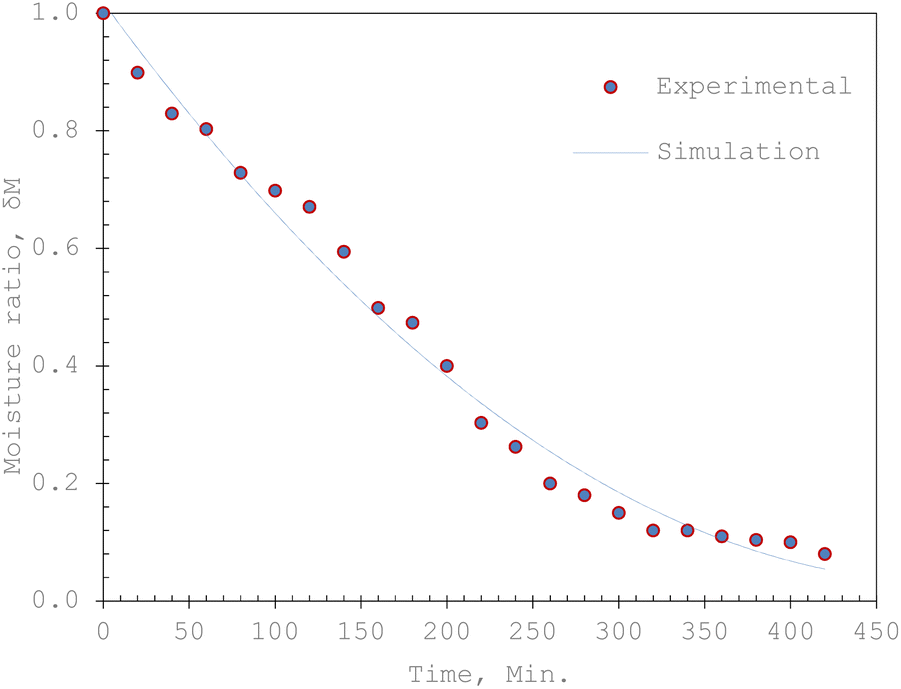 | ||
| Fig. 15 Plot of empirical validation of moisture transport simulation results for solar drying of okra cylinders. | ||
4 Conclusion
A numerical simulation of the heat and moisture transport in okra cylinders with shrinkage impact subjected to a mixed-mode solar drying operation was conducted using a physics-based approach. The results obtained reveal that the product temperature and moisture ratio fitted adequately into the physics-based models with low mean relative error values of 0.001 and 0.19, respectively. The COMSOL Multiphysics FE model exhibited a strong prediction potential in estimating the transient heat and moisture distribution during the drying phase. The following are the key insights drawn from this study:(i) The performance of the studied mixed-mode solar crop dryer hinged largely on the collector outlet temperature which varied between 34.74 °C ≤ Tc ≤ 52.9 °C; (ii) the convective heat transfer coefficient, hc, was considerably affected by shrinkage at decreasing cylinder thickness; (iii) the cylinder thickness gave an insight into the substantial impact on the drying behaviour of the product samples, as an increase in cylinder thickness resulted in a decrease in the mean moisture removal rate due to increased capillary distance; (iv) shrinkage consideration in okra cylinder drying overshoots the  estimation in the range of 72.29 to 78.45% for the studied sample thickness; (v) the activation energy to overcome high-water molecule bonding was obtained in the range of 14.72 ≤
  ≤ 48.63 kJ mol−1. An increase in the product thickness had a reduction effect on the
  -value when shrinkage is considered; (vi) the moisture diffusion coefficient,
  , demonstrates a corresponding increasing pattern with the cylinder thickness, while the mass transfer coefficient, hm, varies inversely with the cylinder thickness when structural contraction (shrinkage) is considered. Ignoring the impact of sample shrinkage in the analysis of mass transfer overrates the
  and hm-values from 74.86 to 83.14% and 52.68 to 58.83%, respectively for the range of the studied sample thicknesses.
The physics-based mode provides insightful knowledge of temperature-sensitive drying phases, aiding in the optimization of drying duration and energy utilization, and establishing key stages in the drying cycle where modifications in process conditions could enhance moisture extraction. Shrinkage inclusion offers information about the alterations in size and form of okra and other food products over time and their implications for heat and moisture transfer. It is worthy of note that the result of this study will offer the development of commercial-scale solar dryers for tropical climates as well as adaptability across varying food crops and process variables. It also supports the Sustainable Development Goals of the UN by highlighting the potential of solar drying as a sustainable means of agricultural product processing. The findings promote SDG 7 (Access to Clean and Affordable Energy), SDG 12 (Ensure Sustainable Consumption and Production Patterns), and SDG 13 (Action to Combat Climate Change and its Impact) by increasing energy efficiency, decreasing food waste and utilizing energy from renewable sources, all of which help to create more resilient and sustainable food systems.
Future works may consider the influence of varying okra geometries and dryer configurations on the heat and mass transfer process of okra undergoing a mixed-mode drying process to optimize the design of the drying chamber. Studies on the integration of sensors for precise measurement of real-time temperature, relative humidity, weight loss, and shrinkage deformation to the predictive potential of the model(s) are of great importance.
Data availability
All datasets supporting this article are made available herein. Further information required is available from the corresponding author upon reasonable request and with permission of the co-authors.Author contributions
Nnaemeka Nwakuba: conceptualization; formal analysis; methodology; supervision; validation; writing-original draft; writing-review & editing. Nnaemeka Ezeanya: formal analysis; investigation; methodology; writing-review & editing. Ibiba Horsfall: conceptualization; software/model development. Victor Okafor: formal analysis; experimentation/investigation; methodology. Chibuike Ononogbo: draft writing; data collation; methodology. Macmanus Ndukwu: model development and validation. Sabbas Asoegwu: draft writing and review. Marlin Simo-Tagne: methodology, model development & validation.Conflicts of interest
We the authors hereby declare that there is no conflict of interest in this work.Acknowledgements
The authors acknowledge the support of the final-year students and technical staff of the AGE Department, FUT Owerri who helped in arranging the experimental set-up and collation of field data.Notes and references
- N. R. Nwakuba, M. C. Ndukwu, G. U. Asonye, S. N. Asoegwu and G. I. Nwandikom, Environmental sustainability analysis of a hybrid heat source dryer, Polytechnica, 2020, 3, 99–114, DOI:10.1007/s41050-020-00026-2.
- P. P. Tripathy and S. Kumar, Modeling of heat transfer and energy analysis of potato slices and cylinders during solar drying, Appl. Therm. Eng., 2009, 29, 884–891 CrossRef.
- M. C. Ndukwu, I. T. Horsfall, D. I. Onwude, M. Simo-Tagne and F. I. Abam, Physics-based numerical simulation of heat and moisture transport in red chilli subjected to mix-mode solar drying with phase change energy storage, Energy Storage, 2021, 3, 2–12 CrossRef.
- K. Dhalsamant, P. P. Tripathy and S. L. Shrivastava, Moisture transfer modeling during solar drying of potato cylinders considering shrinkage, Int. J. Green Energy, 2018, 10, 107–121, DOI:10.1080/15435075.2016.1256290.
- D. Jiang, C. Li, Z. Lin, Y. Wu and H. Pei, Experimental and numerical study on the shrinkage-deformation of carrot slices during hot air drying, Int. J. Agric. Biol. Eng., 2023, 16, 260–272 Search PubMed.
- N. Wang and J. G. Brennan, A mathematical model of simultaneous heat and moisture transfer during drying of potato, J. Food Eng., 1995, 24, 47–60 CrossRef.
- H. Yang, N. Sakai and M. Watanabe, Drying model with non-isotropic shrinkage deformation undergoing simultaneous heat and mass transfer, Drying Technol., 2001, 19, 1441–1460 CrossRef.
- X. L. Yu, M. Zielinska, H. Y. Ju, A. S. Mujumdar, X. Duan and Z. J. Gao, Multistage relative humidity control strategy enhances energy and exergy efficiency of convective drying of carrot cubes, Int. Commun. Heat Mass Transfer, 2020, 14, 119231, DOI:10.1016/j.ijheatmasstransfer.2019119231.
- E. K. Akpinar, Experimental determination of convective heat transfer coefficient of some agricultural products in forced convection drying, Int. J. Heat Mass Transfer, 2004, 31, 585–595 Search PubMed.
- L. Mayor and A. M. Sereno, Modelling shrinkage during convective drying of food materials: a review, J. Food Eng., 2004, 61, 373–386 CrossRef.
- L. Bennamoun, R. Khama and A. Leonard, Convective drying of a single cherry tomato: Modeling and experimental study, Food Bioprod. Process., 2015, 94, 114–123 CrossRef.
- AOAC, Official Methods of Analysis, Association of Official Analytical Chemists, Arlington, VA, 15th edn, 2002 Search PubMed.
- M. G. Higazy, Analysis and accuracy of experimental methods, Int J Petrochem Res., 2019, 3, 262–268 CrossRef.
- D. I. Onwude, N. Hashim, K. Abdan, R. Janius, G. Chen and C. Kumar, Modeling of coupled heat and mass transfer for combined infrared and hot-air drying of sweet potato, J. Food Eng., 2018, 228, 12–24, DOI:10.1016/j.jfoodeng.2018.02.006.
- N. R. Nwakuba, S. Ndukwe and T. Paul, Influence of product geometry and process variables on drying energy demand of vegetables: An experimental study, Int. J. Pet. Eng., 2021, e13684, DOI:10.1111/jfpe.13684.
- D. I. Onwude, N. Hashim, R. B. Janius, N. M. Nawi and K. Abdan, Modeling the thin-layer drying of fruits and vegetables: a review, Compr. Rev. Food Sci. Food Saf., 2016, 15, 599–618, DOI:10.1111/1541-4337.12196.
- Y. Llave, K. Takemori, M. Fukuoka, T. Takemori, H. Tomita and N. Sakai, Mathematical modeling of shrinkage deformation in eggplant undergoing simultaneous heat and mass transfer during convection-oven roasting, J. Food Eng., 2016, 178, 124–136 CrossRef.
- U. S. Shivhare, A. Gupta, A. S. Bawa and P. Gupta, Drying characteristics and product quality of okra, Drying Technol., 2000, 18, 409–419 CrossRef.
- I. Doymaz, Drying characteristics and kinetics of okra, J. Food Eng., 2005, 69, 275–279 CrossRef.
- L. V. Mana, T. Orikasab, Y. Muramatsuc and A. Tagawaa, Impact of microwave drying on the quality attributes of okra fruit, J. Food Process. Technol., 2012, 3, 1–7, DOI:10.4172/2157-7110.1000186.
- D. Kumar, S. Prasad and G. S. Murthy, Optimization of microwave-assisted hot air drying conditions of okra using response surface methodology, J. Food Sci. Technol., 2014, 51, 221–232 CrossRef.
- G. W. P. Ouedraogo, B. Kabore, S. Kam and D. J. Bathiebo, Determination of physical and chemical properties of okra during convective solar drying, Int. J. Eng. Adv. Technol., 2017, 7, 76–80 Search PubMed.
- G. W. Ouedraogo, B. Kabore, N. Bado, V. Zoma, S. Kam and D. J. Bathiebo, Simulation of the okra drying process in a solar tower dryer, Int. J. Adv. Res., 2022, 19, 53–61, DOI:10.21474/IJAR01/14011.
- N. R. Nwakuba, V. C. Okafor and O. O. Okorafor, Techno-economic analysis of a hybrid solar-electric dryer, Energy Sources Part A Recover Util Environ. Eff., 2020, 1–25, DOI:10.1080/15567036.2020.1782537.
- International Organization for Standardization, Guide to the Expression of Uncertainty in Measurement, Report No.: ISO/AG4/WG, International Organization for Standardization, Geneva, 1992, vol. 3 Search PubMed.
- S. Uzoma, N. Nwakuba and K. Anyaoha, Response surface optimization of convective air-drying process in a hybrid PV/T solar dryer, Turk. J. Agr. Eng. Res., 2020, 1, 111–130 Search PubMed.
- S. I. Anwar and G. N. Tiwari, Evaluation of convective heat transfer coefficient in crop drying under open sun drying, Energy Convers. Manage., 2001, 42, 627–637 CrossRef.
- D. Kumar, S. Prasad and G. S. Murthy, Optimization of microwave-assisted hot air-drying conditions of okra, J. Food Sci. Technol., 2011, 51, 221–320, DOI:10.1007/s13197-011-0487-9.
- I. Golpour, R. P. Guine, S. Poncet, H. Golpour, R. A. Chayjan and J. A. Parian, Evaluating the heat and mass transfer effective coefficients during the convective drying process of paddy (Oryza sativa L.), Int. J. Pet. Eng., 2021, 44, e13771, DOI:10.1111/jfpe.13771.
- T. J. Afolabi, T. Y. Akintunde and O. J. Oyelade, Influence of drying conditions on the effective moisture diffusivity and energy requirements of ginger slices, J. Food Res., 2014, 5, 103–112 CrossRef.
- M. H. Nguyen and W. E. Price, Air-drying of banana: influence of experimental parameters, slab thickness, banana maturity, and harvesting season, J. Food Eng., 2007, 79, 200–207 CrossRef.
- W. J. N. Fernando, H. C. Low and A. L. Ahmad, Dependence of the effective diffusion coefficient of moisture with thickness and temperature in convective drying of sliced materials: A study on slices of banana, cassava and pumpkin, J. Food Eng., 2011, 102, 310–316 CrossRef.
- B. Dianda, M. Ousmane, S. Kam, T. Ky and D. J. Bathiebo, Experimental study of the kinetics and shrinkage of tomato slices in convective drying, Afr. J. Food Sci., 2015, 9, 262–271 CrossRef.
- M. R. Queiroz and S. A. Nebra, Theoretical and experimental analysis of the drying kinetics of bananas, J. Food Eng., 2001, 47, 127–132 CrossRef.
- S. Celen, Effect of microwave drying on the drying characteristics, colour, microstructure, and thermal properties of Trabzon persimmon, Foods, 2019, 8, 84, DOI:10.3390/foods8020084.
- N. R. Nwakuba and V. C. Okafor, Energy indices and drying behaviour of alligator pepper pods (Aframomum melegueta) as influenced by applied microwave power, J. Energy Technol. Environ., 2020, 2, 74–93, DOI:10.37933/nipes.e/2.2020.8.
- N. P. Zogza, Z. B. Maroulis and D. Marinos-Kouris, Moisture diffusivity data compilation in foodstuffs, Drying Technol., 1996, 14, 2225–2253 CrossRef.
- C. Ratti, Shrinkage during drying of foodstuffs, J. Food Eng., 1994, 23, 91–105 Search PubMed.
| This journal is © The Royal Society of Chemistry 2025 |