
 Open Access Article
 This Open Access Article is licensed under a Creative Commons Attribution-Non Commercial 3.0 Unported Licence
Selective adsorption of unmethylated DNA on ZnO nanowires for separation of methylated DNA†
Marina
Musa‡
*a,
Zetao
Zhu
 *b,
Hiromi
Takahashi
a,
Wataru
Shinoda
c,
Yoshinobu
Baba
*ade and
Takao
Yasui
*bd
*b,
Hiromi
Takahashi
a,
Wataru
Shinoda
c,
Yoshinobu
Baba
*ade and
Takao
Yasui
*bd
aDepartment of Biomolecular Engineering, Graduate School of Engineering, Nagoya University, Furo-cho, Chikusa-ku, Nagoya 464-8603, Japan
bDepartment of Life Science and Technology, Tokyo Institute of Technology, Nagatsuta 4259, Midori-ku, Yokohama 226-8501, Japan. E-mail: zhu.z.ag@m.titech.ac.jp
cResearch Institute for Interdisciplinary Science, Okayama University, Okayama, 700-8530, Japan
dInstitute of Nano-Life-Systems, Institutes of Innovation for Future Society, Nagoya University, Furo-cho, Chikusa-ku, Nagoya 464-8603, Japan. E-mail: yasuit@life.isct.ac.jp
eInstitute of Quantum Life Science, National Institutes for Quantum Science and Technology (QST), Anagawa 4-9-1, Inage-ku, Chiba 263-8555, Japan
First published on 10th January 2025
Abstract
DNA methylation is a crucial epigenetic modification used as a biomarker for early cancer progression. However, existing methods for DNA methylation analysis are complex, time-consuming, and prone to DNA degradation. This work demonstrates selective capture of unmethylated DNAs using ZnO nanowires without chemical or biological modifications, thereby concentrating methylated DNA, particularly those with high methylation levels that can predict cancer risk. We observe varying affinities between methylated and unmethylated DNA on ZnO nanowires, which may be influenced by differences in hydrogen bonding strength, potentially related to the effects of methylation on DNA strand behavior, including self-aggregation and stretching inhibition. As a result, the nanowire-based microfluidic device effectively collects unmethylated DNA, leading to a significantly increased ratio of methylated to unmethylated DNA, particularly for collecting low-concentration methylated DNA. This simplified microfluidic device, composed of ZnO nanowires, enables direct separation of specific methylated DNA, offering a potential approach for DNA methylation mapping in clinical disease diagnostics.
Introduction
DNA methylation is a crucial epigenetic modification that plays a significant role in disease detection and diagnosis.1–3 This process involves adding methyl groups to cytosine residues in DNA, without altering the underlying DNA sequence.4–6 Aberrant DNA methylation patterns have been observed as symptoms of various diseases, including cancer and neurological disorders, making it a valuable biomarker for disease detection.7–10 In cancer cases, global hypomethylation and hypermethylation of specific CpG islands are associated with activating oncogenes and silencing tumor suppressor genes, respectively.11–13 Detecting these methylation changes in specific genes or regions can serve as early indicators of disease development and aid in identifying potential therapeutic targets.14,15 In particular, the percentage of methylation assesses cancer risk by measuring the fraction of methylated cytosines at specific CpG sites. Over 70% indicates high risk, 30–70% suggests elevated risk, and under 30% is typical for normal tissues.16–18 Furthermore, advancements in technology, such as high-throughput sequencing and microarray-based methylation profiling, have facilitated the exploration of DNA methylation patterns on a genome-wide scale, further enhancing its utility as a diagnostic tool in various diseases.19,20Current research progress in the collection and separation of methylated DNA has led to significant advancements in the field of epigenetics and disease detection.16,21,22 Non-invasive sampling methods, such as liquid biopsies using blood, urine, and saliva, have emerged as valuable sources of cell-free DNA containing epigenetic information, including DNA methylation patterns.23–25 Such samples offer a convenient and accessible means of capturing methylated DNA for early disease detection and monitoring. Researchers are also exploring novel techniques to separate methylated DNA regions from complex genomic mixtures selectively.26–28 For example, DNA methylation assays have been widely studied using methods such as bisulfite sequencing,29 methylation-sensitive restriction enzyme (MSRE),30,31 methylated DNA immunoprecipitation (MeDIP),32 and emerging approaches for low-input analysis, including reduced representation bisulfite sequencing (MID-RRBS),33 droplet-based bisulfite sequencing (Drop-BS),34 MeDIP-seq,35 and single-nucleus methylome sequencing (snmC-seq2).36 These methods provide powerful tools for genome-wide epigenomic profiling, with applications ranging from tissue-specific methylation analysis to single-cell resolution studies. However, these methods often involve the use of specific binding proteins or antibodies that recognize methylated cytosine residues.37,38 Many of these techniques are resource-intensive and may not be suitable for detecting specific methylated fragments in low-concentration, non-invasive samples such as liquid biopsies. Moreover, advancements in microfluidic devices and high-throughput sequencing techniques have enabled rapid and efficient separation and analysis of methylated DNA.39–43 The continuous development of such technologies holds great promise for expanding researchers' understanding of epigenetic regulation and its potential application in personalized medicine and disease diagnostics.
In this study, we found that unmethylated DNA exhibits a higher affinity for ZnO nanowires compared to methylated DNA, which is attributed to differences in the strength of hydrogen bonding with the ZnO surface. (MD) simulations confirmed that methylated DNA tends to self-aggregate, reducing its ability to adsorb onto the ZnO surface. The ZnO nanowire-based microfluidic device effectively separates single-stranded DNA (ssDNA) with varying methylation levels, especially at higher methylation levels (>30 percent), which are linked to cancer risk. As a result, using this device increases the ratio of methylated to unmethylated DNA, suggesting its potential for isolating and collecting methylated DNA from body fluids. Our findings on the different interactions between methylated and unmethylated DNA on ZnO surfaces could have important implications for epigenetics, disease diagnostics, and personalized medicine.
Experimental
Fabrication of PDMS microchannel
Details of the fabrication process of the ZnO nanowire-based microfluidic device can be found in our previous papers;44–48 the process flow is shown schematically in Fig. S1 and S2.† A microchannel mold was fabricated by patterning an SU-8 layer on a silicon wafer (Fig. S1†). A 3-inch N-type silicon wafer (Advantech Co., Ltd.) was used as the substrate (Fig. S1a†) and it was coated with SU-8 photoresist (Nippon Kayaku Co., Ltd.) (Fig. S1b†). The coated wafer underwent a photolithography process with a UV energy of 200 mJ cm−2 to make two microchannels. Afterward, the silicon wafer was baked at 65 °C and 95 °C for 1 and 2 min, respectively. The wafer was then developed using SU-8 developer (Nippon Kayaku Co., Ltd.), rinsed with isopropyl alcohol (IPA) (Kanto Chemical Co., Inc.), and subjected to a silanization treatment using trichloro (1H,1H,2H,2H-perfluorooctyl) silane (Merck KGaA) for 2 h (Fig. S1c†). The fabricated mold was used to make the microchannels on polydimethylsiloxane (PDMS) substrate by mixing Silpot184 (Dow Corning Toray Co., Ltd.) and curing agent Catalyst Silpot184 (Dow Corning Toray Co., Ltd.) at a ratio of 10![[thin space (1/6-em)]](https://www.rsc.org/images/entities/char_2009.gif) :1, respectively (Fig. S1d†). The resulting PDMS substrate with two microchannels (each with dimensions of 10 mm length, 5 mm width, and 10 μm height) was then punctured using a 0.5 mm hole puncher (Harris Uni-Core) to make the inlet and outlet holes.
:1, respectively (Fig. S1d†). The resulting PDMS substrate with two microchannels (each with dimensions of 10 mm length, 5 mm width, and 10 μm height) was then punctured using a 0.5 mm hole puncher (Harris Uni-Core) to make the inlet and outlet holes.
Fabrication of ZnO nanowires
ZnO nanowires were fabricated using the pre-optimized method we reported previously;46–49 a schematic flow of the fabrication is shown in Fig. S2.† A pre-cleaned fused silica substrate, 20 mm × 20 mm × 0.5 mm in size (Crystal Base Co., Ltd.) (Fig. S2a†) was spin-coated with 1,1,1,3,3,3-hexamethyldisilazane (OAP, Tokyo Ohka Kogyo Co., Ltd.) followed by OFPR-8600 (Tokyo Ohka Kogyo Co., Ltd.) (Fig. S2b and c,† respectively). Next, photolithography was performed to make two nanowire-fabricated patterns on one silica substrate, each with a length and width of 10 mm and 5 mm, respectively. The substrate was then immersed in NMD-3 solution (Tokyo Ohka Kogyo Co., Ltd.) to develop the patterns (Fig. S2d†). A seed layer of ZnO (thickness, 130 nm) was sputtered on the substrate for 10 min using an RF-sputtering machine (SC-701Mk Advance, Sanyu Electron Co., Ltd.) (Fig. S2e†), followed by hydrothermal growth of the nanowires by immersing the substrate into a mixture of 40 mM hexamethylenetetramine (HMTA, Wako Pure Chemical Industries, Ltd.) and 40 mM zinc nitrate hexahydrate (Thermo Fisher Scientific Inc.). The mixture was then heated at 95 °C for 3 h (Fig. S2f†), followed by the removal of the OFPR-8600 photoresist (Fig. S2g†).Atomic layer deposition of the ZnO layer
After the fabrication of ZnO nanowires, an atomic layer deposition (ALD) system (Savannah G2, Ultratech Inc.) was utilized to deposit a thin layer of ZnO with an approximate thickness of around 5–6 nm (Fig. S2h†). The conditions used were: diethylzinc (DEZ) and H2O as precursors; a temperature of 100 °C; and 55 ALD cycles.Fabrication of oxide nanowire microfluidic devices
The final fabrication step of the microfluidic device involved the surface treatment of the PDMS substrate and the fused silica substrate with grown nanowires using a plasma etching apparatus (Meiwafosis Co. Ltd.) at 180 °C for 2 min (Fig. S2i†). Next, a polyetheretherketone (PEEK) tube, 0.26 mm inner diameter × 0.5 mm outer diameter (Institute of Microchemical Technology Co. Ltd.), was then inserted into the inlet hole and the outlet hole (Fig. S2j†).Characterizations of nanowires
Surface morphologies of ZnO nanowires and ZnO/ZnO core/shell nanowires were observed using a field emission scanning electron microscope (FESEM) (SUPRA 40VP, Carl Zeiss AG). The contact angle for the ZnO film and ZnO nanowires was measured with a contact angle meter (Kyowa Interface Science.) using the FAMAS analysis software in sessile drop mode. The FTIR analysis was performed using the Nicolet™ iS50 FTIR spectrometer (Thermo Fisher Scientific Inc.) in the wavenumber range of 4000–550 cm−1. All spectra were recorded with a minimum of 64 scans. For the study of interactions, a 10000 μM solution of each polycytosine (PolyC, PolyCm, CmCmCmCC, CmCCCmCm, CmCCmCCm, and CCmCmCmC) was prepared and allowed to interact with the ZnO nanowires prior to FTIR analysis in the transmission mode. Attenuated total reflection (ATR) was used to record the spectra of each polycytosine in powder form.
Molecular dynamics (MD) simulations
All MD simulations were carried out using GROMACS 2021 software.50 The force field used for the simulations can be found in our previous paper.44 In this work, ZnO nanowires were modeled as a simple planar substrate with the surface of the (1111) plane. We used polycytosine (CCCCC) as the unmethylated DNA model and methylated polycytosine (CmCmCmCmCm) as the methylated DNA model. The unmethylated and methylated DNA were dispersed in an aqueous solution. In the initial configuration, we put the DNA at a distance of 2 nm from the ZnO surface. ZnO segments were treated as frozen substrates. After the energy minimization, MD simulations were carried out in the NVT ensemble. The periodic boundary condition was used in the x–y direction. Basically, the ZnO surface was wet by the aqueous solution, though the other side of the aqueous solution was treated as a free surface. A repulsive wall potential was established to limit the evaporation of water molecules. The temperature was controlled at 300 K using the velocity rescaling method.51 Lennard-Jones interaction was smoothly truncated by applying the smooth force switching function in the distance range from 1 to 1.2 nm. Electrostatic interaction was evaluated using the 2-dimensional particle mesh Ewald method.52 All bonds involving hydrogen atoms were kept constrained by the LINCS.53 The timestep of 1 fs was used to integrate equations of motion. We carried out 200 ns MD simulations for each system and stored the trajectory data every 1 ps.Capture experiment for DNA using nanowire microfluidic device
The DNA, primers, and probes used in the capture experiment were obtained from Invitrogen, Thermo Fisher Scientific, Inc. and the sequences of the DNA are shown in Table S3.† All the DNA solutions were prepared by dissolving the stock DNA in Millipore water. For the capture experiment using a mixture, 1 ng μL−1 and 50 ng μL−1 DNA mixtures were prepared by mixing the unmethylated DNA with the DNA bearing 50% methylation level at the dispersed position to get the mmeth:munmeth mixtures of 75%:25%, 50%:50% and 25%:75%. The capture experiment was performed using a syringe pump system (KDS-200, KD Scientific Inc.) at a flow rate of 5 μL min−1. Initially, 50 μL of Millipore water was introduced to remove any possible contaminations. Then, 50 μL of DNA solution was introduced into the inlet of the microfluidic device, and the recovered amount was collected in a 1 mL centrifuge tube.
Quantifications of DNA
The concentration of recovered DNA was analyzed using the PIKOREAL 96 quantitative polymerase chain reaction (qPCR) system (Thermo Fisher Scientific Inc.). A mixture containing 1 μL DNA solution, 3.5 μL Millipore water, 5 μL TaqMan® Gene Expression Master Mix (Applied Biosystems, Thermo Fisher Scientific Inc.), and 0.5 μL Custom TaqMan® Gene Expression Assays (Applied Biosystems, Thermo Fisher Scientific Inc.) was pipetted into a 96-well reaction plate, sealed with an optical seal (Applied Biosystems, Thermo Fisher Scientific) and ran for qPCR. The protocol for qPCR was done using the cycling conditions: 2 min at 50 °C; 10 min at 95 °C; 50 cycles of 15 s at 95 °C; and 1 min at 60 °C. The capture efficiency was calculated using the equation below.44,47,48min: amount of input DNA; mout: amount of output DNA.
Results and discussion
Separation of methylated and unmethylated DNA using ZnO nanowire device
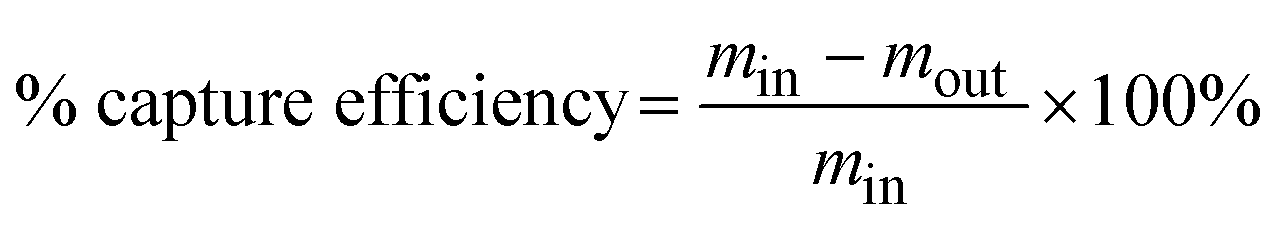
First, we present the ZnO nanowire-based microfluidic device designed to separate methylated and unmethylated DNA based on their different affinities on the ZnO nanowire surface. The device was fabricated by embedding a ZnO/ZnO nanowire array in a PDMS channel (Fig. 1a and b, S1–S3†). The nanowire shape was chosen for this microfluidic device not only to enhance the effective surface area but also because the specific crystallographic orientation of ZnO nanowires plays a critical role in the adsorption function. The side surfaces of vertically oriented ZnO nanowires (a-plane: (1010)) exhibit alternating arrangements of Zn and O atoms, whereas flat ZnO substrates (c-plane: (0001)) present surfaces dominated by either Zn or O atoms. This difference in atomic arrangement significantly affects surface energy, chemical reactivity, and bonding interactions.44,46 The suitability of the device for analyzing biomolecules in solution was confirmed by the substantially smaller contact angles compared to thin films which indicated close contact between the solution and the nanowire surface (Fig. S4†). The ZnO/ZnO nanowires were selected for the device to facilitate the electrostatic adsorption of negatively charged DNA (−50.8 mV), as their zeta potential (23.78 mV) obtained through ALD of a ZnO layer is more positively charged than that of the ZnO nanowires (8.54 mV) (Table S1†). Additionally, a comparison between cytosine and methylated cytosine revealed different capture amounts of unmethylated and methylated DNA after passing through the device (Fig. 1c and d). This trend was consistent with both 20CG (cytosine–guanine) and 20MCG (methylated cytosine–guanine) targets to further confirm the device's capability to separate methylated DNA. These initial characterizations and pre-analysis of methylated and unmethylated DNA validate the feasibility of collecting methylated DNA using the ZnO nanowire-based microfluidic device.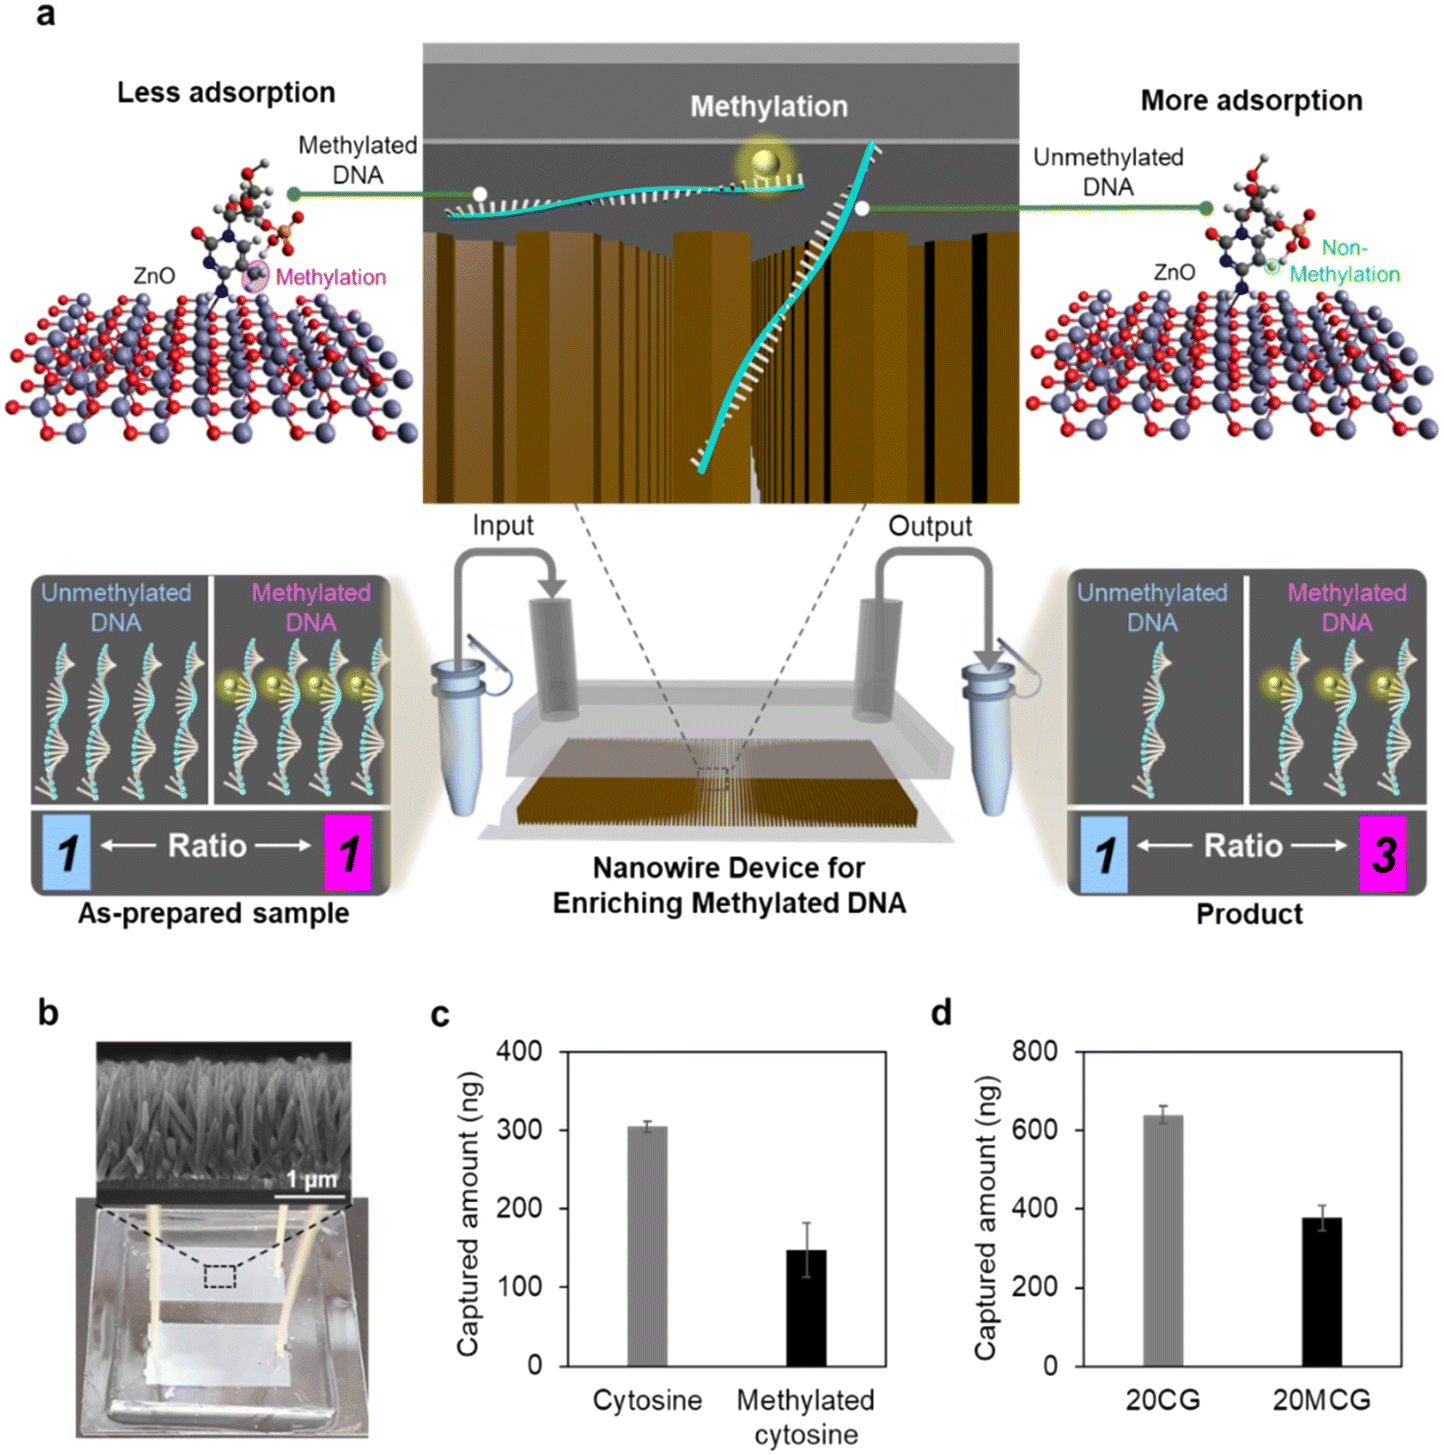 | ||
| Fig. 1 Separation of methylated and unmethylated DNA with a ZnO nanowire-based microfluidic device. (a) Schematic representation of the microfluidic device utilizing ZnO nanowires for collecting methylated DNA, based on the differential capture efficiencies of methylated and unmethylated DNA on the nanowire surface. (b) Microscope image of the fabricated microfluidic device and a scanning electron microscope (SEM) image showcasing the integrated ZnO nanowires within the device. (c) Apparent capture amounts of cytosine and methylated cytosine when equal quantities of cytosine samples are introduced into the device. (d) Apparent capture amounts of unmethylated and methylated DNA with the 20CG (cytosine–guanine) sequence by the device when using equal quantities of DNA samples. All error bars are derived from three measurements. | ||
Interactions of methylated and unmethylated DNA with ZnO nanowires
Next, to understand how the device works to separate methylated and unmethylated DNA, we assessed the capture efficiency of CpG-rich ssDNA with varying methylation levels using our nanowire microfluidic device. Here, the selection of DNA with different methylation levels as targets was based on their role as indicators of cancer stage and it reflected the association between aberrant methylation and disease progression.54–56 The varying methylation levels were represented by methylation numbers: 0 (0 percent methylation), 1 (6.3 percent methylation), 2 (12.5 percent methylation), 4 (25 percent methylation), 8 (50 percent methylation), and 16 (100 percent methylation), as illustrated in Fig. 2a. The capture efficiency decreased with an increase in the methylation number, where unmethylated DNA, 0 methylation number, exhibited the highest capture efficiency (76.4 percent). As the methylation number increased, the capture efficiency decreased successively (Fig. 2b): 1 methylation number (74.2 percent), 2 methylation number (72.8 percent), 4 methylation number (52.0 percent), 8 methylation number (25.7 percent), and 16 methylation number (5.4 percent). This finding indicates that DNA with lower methylation levels are more readily captured by our ZnO nanowire device. Additionally, this device enables efficient collection of the DNA with higher methylation levels in the product, which are associated with cancer risk.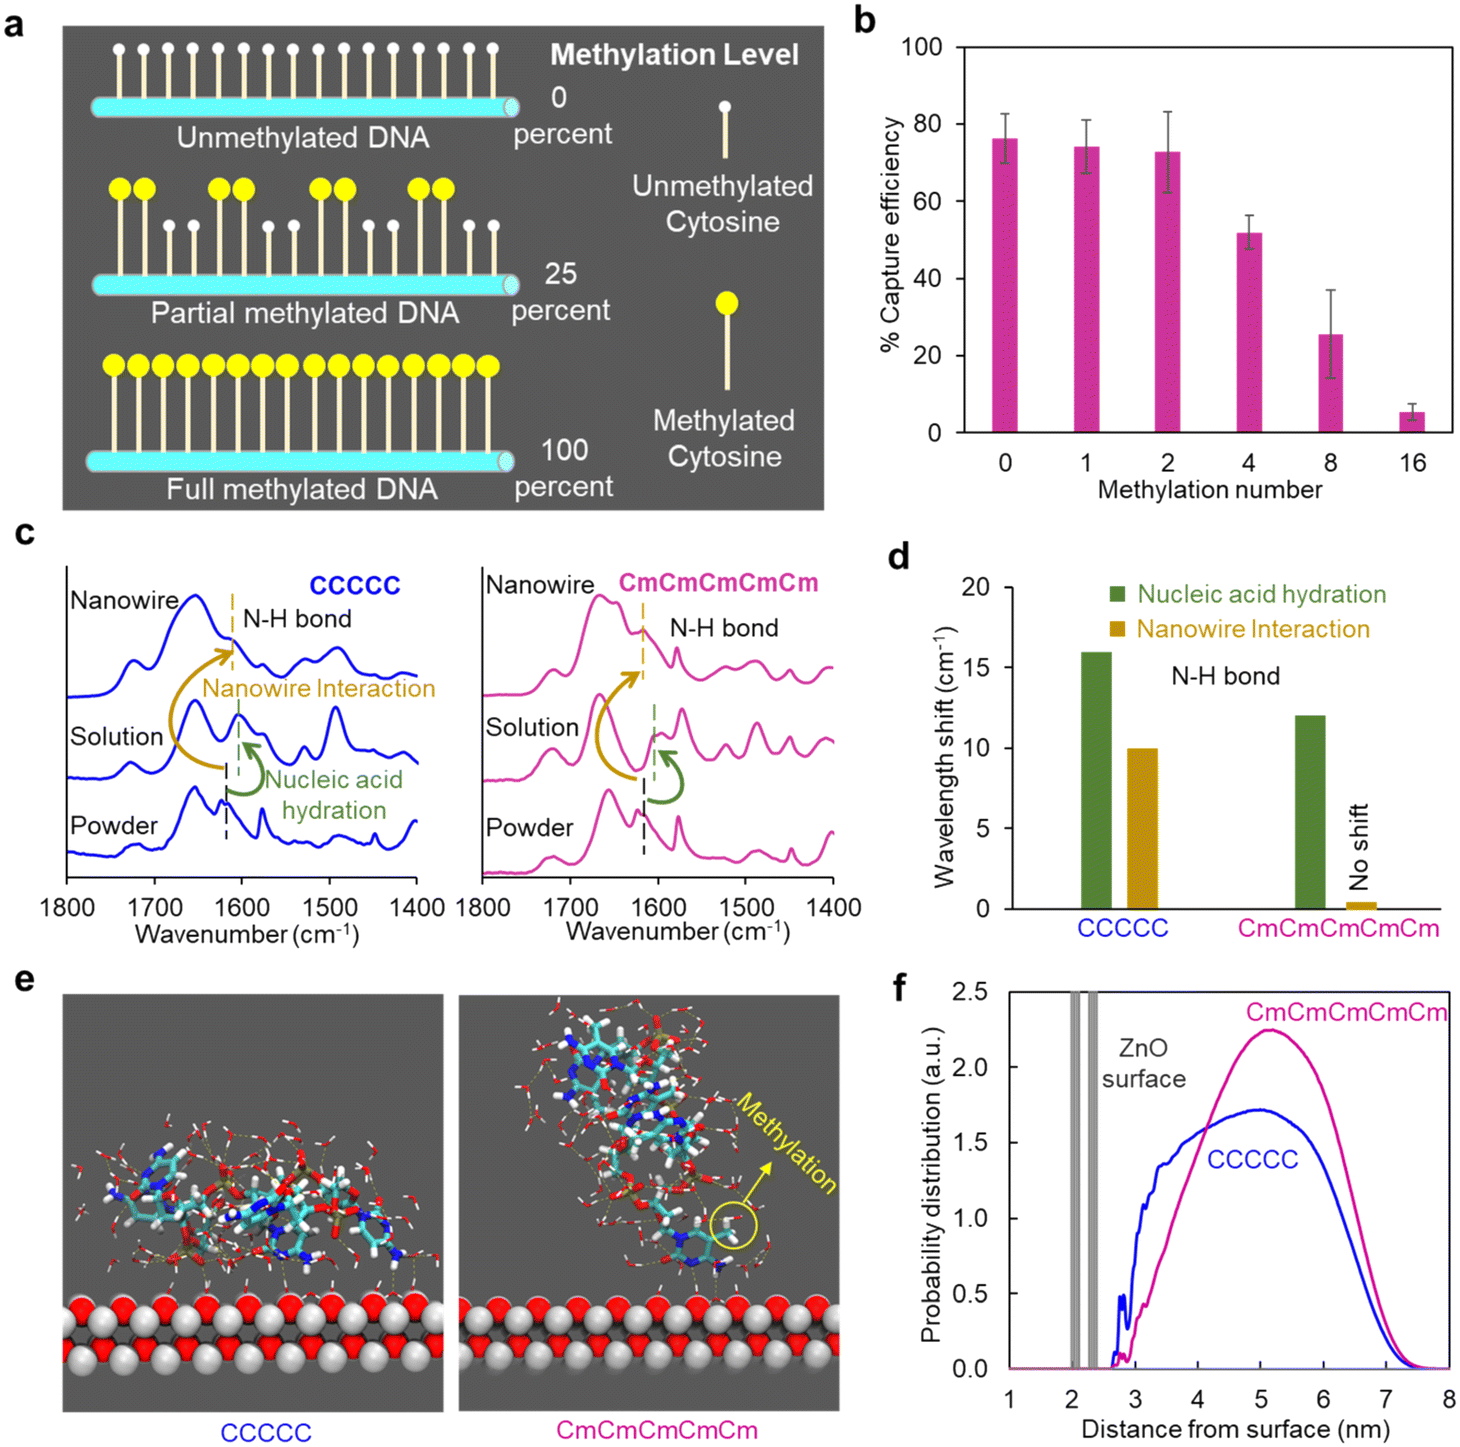 | ||
| Fig. 2 Interactions of methylated and unmethylated DNA with ZnO nanowires. (a) Schematic illustration of the DNA with varying methylation levels. (b) Capture efficiencies of DNA with different methylation levels using the ZnO nanowire-based device. All error bars are derived from three measurements. (c) FTIR spectra of unmethylated (CCCCC) and methylated (CmCmCmCmCm) DNA in powder form, dispersed in aqueous solution and adsorbed on ZnO nanowires. (d) Wavelength shift of N–H bond in different states, as extracted from (c). (e) MD simulation of the adsorption of unmethylated (CCCCC) and methylated (CmCmCmCmCm) DNAs on ZnO surface. DNA (thick lines) with the neighboring water (thin lines) contacted on ZnO surface (spheres) are shown. (f) Probability distribution of the unmethylated and methylated DNA expressed against the distance from ZnO surface. | ||
To investigate the reason behind the varying capture efficiencies of differently methylated DNA, we used FTIR spectroscopy to analyze the interactions between DNA and nanowires (Fig. 2c, and Table S2†). The 5-mer length polycytosines with no methylation (PolyC) and methylated polycytosines (PolyCm) were introduced to interact with the nanowires for 1 hour before FTIR analysis. The significant spectral shifts were observed for PolyC when dispersed in aqueous solution and adsorbed on nanowires, compared to their powder form. The wavelength shift from 1620 cm−1 (N–H bending) to 1604 cm−1 in aqueous solution indicated hydrogen bond formation during nucleic acid hydration and the further shift to 1610 cm−1 upon adsorption onto ZnO nanowires. As the wavelength of this peak, related to hydrogen bonding, shifted between the powder form and the dispersed aqueous solution, this interaction between PolyC molecules and the ZnO surface can be attributed to hydrogen bonding, consistent with our previous results.47 In contrast, the lack of shift in the peak at 1618 cm−1 for PolyCm in both the powder form and when adsorbed on the nanowire surface suggests no hydrogen bonding interactions between PolyCm and the nanowires (Fig. 2d). In other words, the interaction between methylated DNA and ZnO nanowires appears to be weaker. The DNA adsorption on ZnO nanowires is influenced by both electrostatic interactions and hydrogen bonding. Electrostatic interactions between the negatively charged DNA backbone and the positively charged ZnO surface may facilitate the initial attachment of DNA molecules, providing a stable interface for adsorption. However, the observed selectivity for unmethylated DNA arises primarily from hydrogen bonding. Unmethylated DNA offers exposed functional groups capable of forming hydrogen bonds with the hydroxyl groups on the ZnO surface. In contrast, methylated DNA, with methyl groups reducing hydrogen bond donor/acceptor availability, exhibits weaker interactions. This dual mechanism ensures robust adsorption while maintaining selectivity, as reflected in the FTIR spectra and adsorption efficiency data. These findings indicate that PolyC forms stronger hydrogen bonds with the ZnO nanowires than the PolyCm, leading to higher capture efficiencies for unmethylated DNA.
To gain insights into the reasons for the distinct interactions of methylated and unmethylated DNA on ZnO nanowires, we conducted molecular dynamics (MD) simulations. MD simulations were conducted using the same surface orientation as the a-plane of (1010) of ZnO nanowires, supporting the hypothesis that the single-crystalline aspect and specific orientation are essential for the observed adsorption performance. The simulation results indicated that unmethylated DNA (CCCCC) offered more hydrogen bonding sites on the ZnO surface compared to methylated DNA (CmCmCmCmCm) (Fig. 2e). Additionally, the higher probability distribution of unmethylated DNA on adjacent regions of the ZnO surface indicated the presence of more adsorption sites on the nanowires (Fig. 2f). The greater number of adsorption sites for unmethylated DNA resulted in stronger adsorption strength; this suggests a strong affinity for the nanowires. In contrast, the presence of fewer adsorption sites for methylated DNA exhibited weaker affinity due to the self-aggregation of the DNA strands caused by methylation, which inhibited DNA stretching. The self-aggregation phenomenon observed during the DNA methylation process is documented by other researchers as well.57 Based on these comprehensive findings, we attributed the different capture efficiencies of methylated and unmethylated DNA to their distinct interaction affinities with the nanowires. In other words, these differential affinities result from the effect of methylation on DNA strand self-aggregation and stretching.
DNA with different methylation positions on ZnO nanowires
To further demonstrate the analytical capability of our ZnO nanowire device, we investigated the analysis of targets with more subtle differences, specifically DNA with different methylation positions. We selected 25 percent DNA methylation templates with different DNA methylation positions (Fig. 3a and Table S3†): 4D (dispersed methylation position), 4E (end methylation position), 4C (centered methylation position), and 4LR (2 methylations on each right and left end). We found that there was less capturing of DNA with centered methylation positions (4C) on the nanowire device compared to DNA with end and dispersed methylation positions (4E and 4D) (Fig. 3b). Additionally, a similar trend was found in the shift of wavelength numbers for N–H bond in different targets compared to the change in capture efficiency (Fig. 3c and S5†). The wavelength shift indicated that CCmCmCmC had weaker interactions with the ZnO nanowires compared to CmCCmCCm, CmCmCmCC, and CmCCCmCm, since the N–H bonding played a role in the formation of hydrogen bonding between the DNA and the ZnO surface. Taking into account the self-aggregation effect caused by methylation, our hypothesis suggests that DNA with a centralized methylation position are more prone to aggregation compared to those with dispersed methylation positions. This aggregation tendency hinders the formation of active hydrogen bonding sites available for adsorption on the ZnO surface. Consequently, DNA featuring a centralized methylation position exhibits a weaker interaction with the ZnO surface and that leads to diminished capture efficiency. | ||
| Fig. 3 DNA with different methylation positions on ZnO nanowires. (a) Schematic illustration of the 25 percent (4 sites) methylated DNA with different methylation positions. (b) Capture efficiencies of 25 percent methylated DNA with different methylation positions using the ZnO nanowire-based device. The gray shaded area represents the capture efficiency of methylated DNA with methylation levels between 12.5 percent and 50 percent. (c) Wavelength shift of DNA of N–H bond with different methylation positions before and after being captured on the ZnO nanowire as extracted from FTIR spectra. (d) Capture efficiencies of 12.5 percent (2 sites) methylated DNA with different methylation positions. (e) Capture efficiencies of methylated DNA with different fragment lengths. For Fig. 3d and e, the statistical analysis yielded p-values of approximately 0.79 and 0.61, respectively. All error bars are derived from three measurements. | ||
Furthermore, we discussed the limitations of our method concerning methylation levels. For DNA with a lower methylation level of 12.5 percent (two methylated cytosines) and varying methylation positions, the capture efficiency showed only a slight trend compared to DNA with a higher methylation level of 25 percent (four methylated cytosines) (Fig. 3d). Statistical analysis (one-way ANOVA) yielded a p-value of ∼0.79, indicating that differences among methylation positions were not statistically significant. This suggests that our method exhibits a limitation in capture efficiency for DNA with a methylation level of about 12.5 percent. This may be due to the already high capture efficiency (around 70%) for such DNA, making it challenging to differentiate capture amounts. However, as DNA with a low methylation level (12.5 percent) is generally associated with a lower risk of cancer-related diseases, this limitation appears sufficient for future liquid biopsy applications, where methylation levels are typically higher (>30 percent).
Additionally, we tested DNA with varying fragment lengths at a methylation level of 25 percent and found that fragment length had a negligible effect on capture efficiency (Fig. 3e). Statistical analysis (one-way ANOVA) yielded a p-value of ∼0.61. This indicates that our device maintains stable capture efficiency for DNA with a methylation level of approximately 25 percent. Overall, while our device has limitations in selectively capturing DNA with a methylation level of 12.5 percent, this does not significantly affect its utility for analyzing methylated DNA in liquid biopsy applications (>30 percent). Moreover, the device demonstrates stable capture efficiency for DNA with higher methylation levels, such as 25 percent.
Collection of methylated DNA from a mixed DNA
Next, we assessed the performance of the nanowire-based microfluidic device in collecting methylated DNA from mixed samples containing both methylated and unmethylated DNA (Fig. 4a). By analyzing the capture efficiency of samples with different proportions, we extracted the ratios of methylated and unmethylated DNA in the produced mixtures (Fig. 4b and c). The ratio of methylated and unmethylated DNA increased from 1:3, 1:1, and 3:1 in the as-prepared samples, to 1.1:1, 3:1, and 3.3:1 in the produced samples, respectively. The observed upper limit of the enrichment factor, reaching a threefold enhancement, is likely attributed to the saturation of available adsorption sites on the ZnO nanowires. This effect is evident as the collection efficiency is higher for DNA with a lower ratio of methylated to unmethylated DNA. To improve separation efficiency and reduce the capture of methylated DNA, several potential strategies including 1) surface functionalization; 2) optimization of flow conditions; and 3) improvement of washing protocols could be explored. Next, to further investigate the impact of adsorption site saturation, we introduced DNA at a higher concentration of 50 ng μL−1. The results showed that the enrichment ratio in the product increased from 1:1 to 2.07:1 (a twofold enhancement), which is lower than the collection efficiency observed for low-concentration DNA (Fig. 4d and e). These findings suggest that our nanowire-based device is more effective for collecting methylated DNA from low-concentration samples rather than high-concentration samples. This highlights its potential suitability for collecting methylated DNA typically found in body fluids rather than in organs, making it a promising candidate for liquid biopsy-related applications.
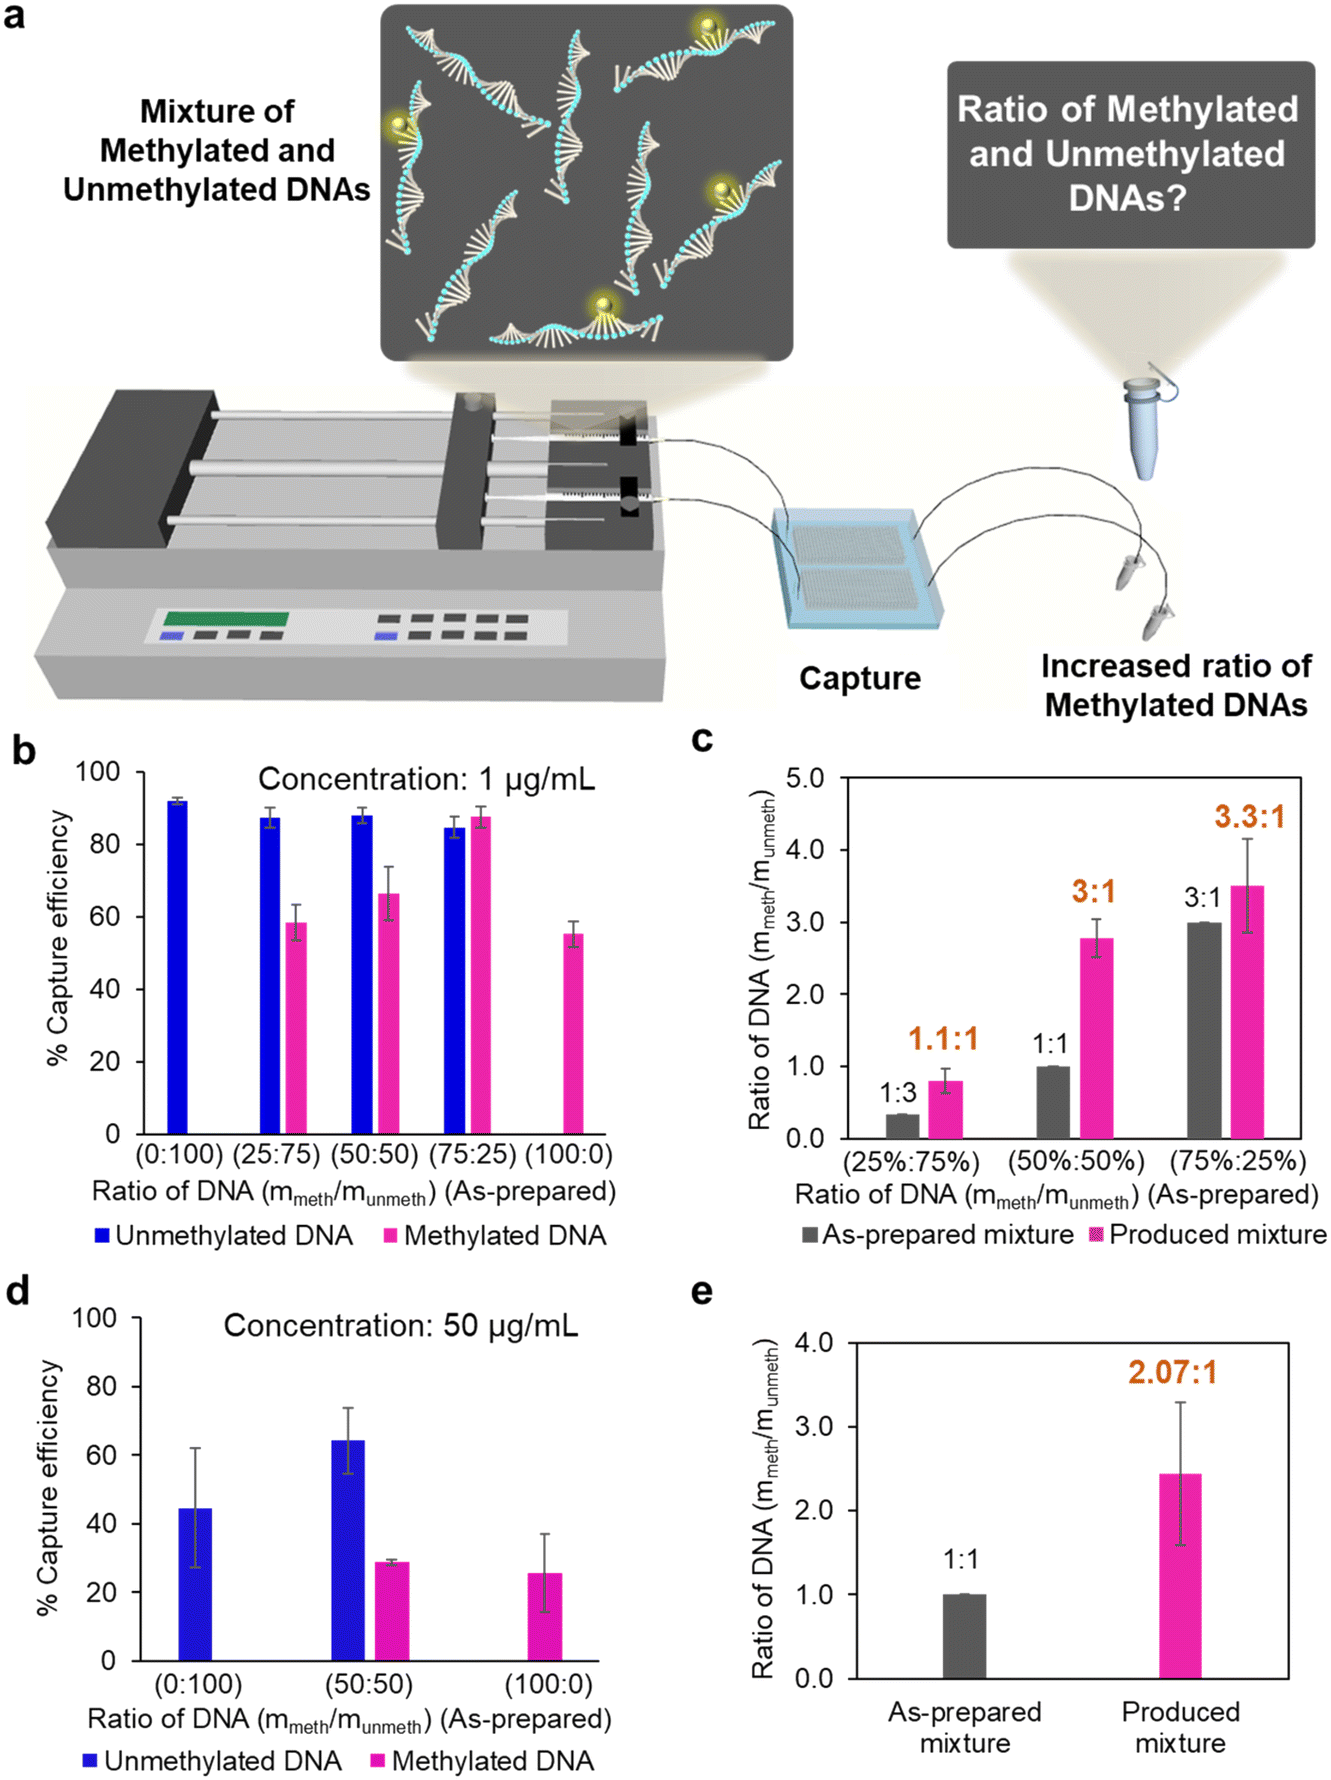 | ||
| Fig. 4 Collection of methylated DNA from a mixed DNA. (a) Schematic illustration of the collecting process using the nanowire-based microfluidic device from a mixture of unmethylated and methylated samples. (b) Capture efficiencies of unmethylated and methylated DNA with different mass ratios at a concentration of 1 ng μL−1. (c) Ratio of the methylated and unmethylated DNA before and after introduction into the microfluidic device, as extracted from (b). (d) Capture efficiencies of unmethylated and methylated DNA with different mass ratios at a high concentration of 50 ng μL−1. (e) Ratio of the methylated and unmethylated DNA before and after introduction into the microfluidic device, as extracted from (d). All error bars are derived from three measurements. | ||
Finally, we have discussed the potential specialized application of our method compared to existing approaches, focusing on the targeted samples and application scenarios. Current approaches, such as the methylation-sensitive restriction enzyme (MSRE), methylated DNA immunoprecipitation (MeDIP), and bisulfite sequencing, focus on analyzing genomic DNA for genome-wide methylation profiling.58,59 These methods are well-suited for understanding epigenetic regulation on a broader scale, such as in tissue-specific or organ-level analyses. For example, microfluidic MeDIP-seq enables low-input epigenomic analyses with as little as 0.5 ng of DNA, providing genome-wide methylation data suitable for studying cancer development and progression.60 In contrast, our method focuses on selectively collecting methylated oligonucleotide DNA, offering several distinct advantages. By targeting disease-relevant methylation fragments, our device provides high specificity for biomarker detection, enhanced sensitivity for early disease diagnostics in non-invasive samples, and reduced complexity for targeted analysis. This makes it particularly promising for precision medicine applications, such as detecting epigenetic biomarkers in liquid biopsies. Unlike genomic DNA-based methods, which aim to profile global methylation patterns, our approach focuses on actionable epigenetic modifications, enabling its application in settings requiring rapid and specific detection of methylation changes.
Conclusions
In summary, this study presented a ZnO nanowire-based microfluidic device that can selectively capture unmethylated DNA on the nanowires while allowing methylated DNA to be collected in the fluidic product. The separation of these two DNA types was based on the reduced hydrogen bonding strength of methylated DNA on ZnO nanowires, potentially linked to self-aggregation and stretching inhibition of DNA strands during the methylation process. Furthermore, different types of methylated DNA, including those with varying methylation levels, positions, and fragment lengths, exhibited specific interaction affinities and capture efficiencies. Moreover, the ZnO nanowire device significantly increased the ratio of methylated to unmethylated DNA of the mixed DNA, indicating excellent collection capabilities, particularly for collecting low-concentration methylated DNA. These findings represent a pioneering approach using a ZnO nanowire-based microfluidic device for DNA methylation mapping and determination of DNA methylation cancer biomarkers in tumor-related genes.Data availability
All data supporting the findings of this study are included in the manuscript and its ESI.†Author contributions
Conceptualization, M. M., Z. Z., Y. B., and T. Y.; methodology, M. M., H. T., Z. Z., and T. Y.; investigation, M. M., and W. S.; writing – original draft, M. M., Z. Z., and W. S.; writing – review & editing, M. M., Z. Z., and T. Y.; funding acquisition, Y. B., and T. Y.; supervision, Y. B., and T. Y.Conflicts of interest
There are no conflicts to declare.Acknowledgements
This research was supported by the Japan Agency for Medical Research and Development (AMED) Grant No. JP21he2302007, the Moonshot Research and Development Program (Grant No. 22zf0127004s0902 and JP22zf0127009) from the AMED, the New Energy and Industrial Technology Development Organization (NEDO) JPNP20004, the Japan Science and Technology Agency (JST) AIP Acceleration Research (JPMJCR23U1), and the JSPS Grant-in-Aid for Scientific Research (A) 24H00792.References
- C. G. Lian, Y. Xu, C. Ceol, F. Wu, A. Larson, K. Dresser, W. Xu, L. Tan, Y. Hu, Q. Zhan, C. Lee, D. Hu, B. Q. Lian, S. Kleffel, Y. Yang, J. Neiswender, A. J. Khorasani, R. Fang, C. Lezcano, L. M. Duncan, R. A. Scolyer, J. F. Thompson, H. Kakavand, Y. Houvras, L. I. Zon, M. C. Mihm, U. B. Kaiser, T. Schatton, B. A. Woda, G. F. Murphy and Y. G. Shi, Cell, 2012, 150, 1135–1146 CrossRef CAS PubMed.
- T. K. Kelly, D. D. De Carvalho and P. A. Jones, Nat. Biotechnol., 2010, 28, 1069–1078 CrossRef CAS PubMed.
- P. W. Laird, Nat. Rev. Cancer, 2003, 3, 253–266 CrossRef CAS PubMed.
- T. H. Bestor and G. L. Verdine, Curr. Opin. Cell Biol., 1994, 6, 380–389 CrossRef CAS PubMed.
- L. D. Moore, T. Le and G. Fan, Neuropsychopharmacology, 2013, 38, 23–38 CrossRef CAS PubMed.
- A. Rottach, H. Leonhardt and F. Spada, J. Cell. Biochem., 2009, 108, 43–51 CrossRef CAS PubMed.
- M. Esteller and J. G. Herman, J. Pathol., 2002, 196, 1–7 CrossRef CAS PubMed.
- R. Lister, M. Pelizzola, Y. S. Kida, R. D. Hawkins, J. R. Nery, G. Hon, J. Antosiewicz-Bourget, R. O'Malley, R. Castanon, S. Klugman, M. Downes, R. Yu, R. Stewart, B. Ren, J. A. Thomson, R. M. Evans and J. R. Ecker, Nature, 2011, 471, 68–73 CrossRef CAS PubMed.
- A. Meissner, T. S. Mikkelsen, H. Gu, M. Wernig, J. Hanna, A. Sivachenko, X. Zhang, B. E. Bernstein, C. Nusbaum, D. B. Jaffe, A. Gnirke, R. Jaenisch and E. S. Lander, Nature, 2008, 454, 766–770 CrossRef CAS PubMed.
- P. A. Jones and S. B. Baylin, Nat. Rev. Genet., 2002, 3, 415–428 CrossRef CAS PubMed.
- R. A. Irizarry, C. Ladd-Acosta, B. Wen, Z. Wu, C. Montano, P. Onyango, H. Cui, K. Gabo, M. Rongione, M. Webster, H. Ji, J. B. Potash, S. Sabunciyan and A. P. Feinberg, Nat. Genet., 2009, 41, 178–186 CrossRef CAS PubMed.
- A. Lujambio, G. A. Calin, A. Villanueva, S. Ropero, M. Sánchez-Céspedes, D. Blanco, L. M. Montuenga, S. Rossi, M. S. Nicoloso, W. J. Faller, W. M. Gallagher, S. A. Eccles, C. M. Croce and M. Esteller, Proc. Natl. Acad. Sci. U. S. A., 2008, 105, 13556–13561 CrossRef CAS PubMed.
- A. Lujambio, Cell Cycle, 2007, 6, 1454–1458 CrossRef.
- H. Yin, X. Zhang, P. Yang, X. Zhang, Y. Peng, D. Li, Y. Yu, Y. Wu, Y. Wang, J. Zhang, X. Ding, X. Wang, A. Yang and R. Zhang, Nat. Commun., 2021, 12, 1394 CrossRef CAS PubMed.
- W. J. Locke, D. Guanzon, C. Ma, Y. J. Liew, K. R. Duesing, K. Y. C. Fung, R. A. Gardiner, M. K. Gandhi, R. J. Scott, D. Korbie and M. Trau, Nat. Commun., 2019, 10, 1150 CrossRef CAS PubMed.
- A. Bird, Genes Dev., 2002, 16, 6–21 CrossRef CAS PubMed.
- M. Esteller, N. Engl. J. Med., 2008, 358, 1148–1159 CrossRef CAS PubMed.
- M. Frommer, L. E. McDonald, D. S. Millar, C. M. Collis, F. Watt, G. W. Grigg, P. L. Molloy and C. L. Paul, Proc. Natl. Acad. Sci. U. S. A., 1992, 89, 1827–1831 CrossRef CAS PubMed.
- S. J. Cokus, S. Feng, X. Zhang, Z. Chen, B. Merriman, C. D. Haudenschild, S. Pradhan, S. F. Nelson, M. Pellegrini and S. E. Jacobsen, Nature, 2008, 452, 215–219 CrossRef CAS PubMed.
- G. Ficz, M. R. Branco, S. Seisenberger, F. Santos, F. Krueger, T. A. Hore, C. J. Marques, S. Andrews and W. Reik, Nature, 2011, 473, 398–402 CrossRef CAS PubMed.
- A. F. Fernandez, L. Valledor, F. Vallejo, M. J. Cañal and M. F. Fraga, Methods Mol. Biol., 2018, 1708, 49–58 CrossRef CAS PubMed.
- K. Watanabe, K. Taniguchi and T. Akutsu, Forensic Sci. Int.:Genet., 2018, 37, 227–234 CrossRef CAS PubMed.
- M. Widschwendter, M. Zikan, B. Wahl, H. Lempiäinen, T. Paprotka, I. Evans, A. Jones, S. Ghazali, D. Reisel, J. Eichner, T. Rujan, Z. Yang, A. E. Teschendorff, A. Ryan, D. Cibula, U. Menon and T. Wittenberger, Genome Med., 2017, 9, 116 CrossRef PubMed.
- Y. M. D. Lo, D. S. C. Han, P. Jiang and R. W. K. Chiu, Science, 2021, 372, eaaw3616 CrossRef CAS PubMed.
- S. Y. Shen, R. Singhania, G. Fehringer, A. Chakravarthy, M. H. A. Roehrl, D. Chadwick, P. C. Zuzarte, A. Borgida, T. T. Wang, T. Li, O. Kis, Z. Zhao, A. Spreafico, T. Medina, Y. Wang, D. Roulois, I. Ettayebi, Z. Chen, S. Chow, T. Murphy, A. Arruda, G. M. O'Kane, J. Liu, M. Mansour, J. D. McPherson, C. O'Brien, N. Leighl, P. L. Bedard, N. Fleshner, G. Liu, M. D. Minden, S. Gallinger, A. Goldenberg, T. J. Pugh, M. M. Hoffman, S. V. Bratman, R. J. Hung and D. D. De Carvalho, Nature, 2018, 563, 579–583 CrossRef CAS PubMed.
- T. Swift-Scanlan, A. Blackford, P. Argani, S. Fackler and M. Jo, Sukumar, BioTechniques, 2006, 40, 210–219 CrossRef CAS PubMed.
- A. Murrell, S. Heeson and W. Reik, Nat. Genet., 2004, 36, 889–893 CrossRef CAS PubMed.
- A. B. Crujeiras, A. Diaz-Lagares, J. M. Moreno-Navarrete, J. Sandoval, D. Hervas, A. Gomez, W. Ricart, F. F. Casanueva, M. Esteller and M. Fernandez-Real, Transl. Res., 2016, 178, 13–24 CrossRef CAS PubMed.
- T. Gong, H. Borgard, Z. Zhang, S. Chen, Z. Gao and Y. Deng, Small Methods, 2022, 6, 2101251 CrossRef PubMed.
- P. Pataer, P. Zhang and Z. Li, Anal. Chem., 2024, 96, 13335–13343 CrossRef CAS PubMed.
- R. J. Nell, D. van Steenderen, N. V. Menger, T. J. Weitering, M. Versluis and P. A. van der Velden, Hum. Mutat., 2020, 41, 2205–2216 CrossRef CAS PubMed.
- M. Pelizzola, Y. Koga, A. E. Urban, M. Krauthammer, S. Weissman, R. Halaban and A. M. Molinaro, Genome Res., 2008, 18, 1652–1659 CrossRef CAS PubMed.
- F. Krueger, B. Kreck, A. Franke and S. R. Andrews, Nat. Methods, 2012, 9, 145–151 CrossRef CAS PubMed.
- Q. Zhang, S. Ma, Z. Liu, B. Zhu, Z. Zhou, G. Li, J. J. Meana, J. González-Maeso and C. Lu, Nat. Commun., 2023, 14, 4672 CrossRef CAS PubMed.
- O. Taiwo, G. A. Wilson, T. Morris, S. Seisenberger, W. Reik, D. Pearce, S. Beck and L. M. Butcher, Nat. Protoc., 2012, 7, 617–636 CrossRef CAS PubMed.
- H. Liu, Q. Zeng, J. Zhou, A. Bartlett, B.-A. Wang, P. Berube, W. Tian, M. Kenworthy, J. Altshul, J. R. Nery, H. Chen, R. G. Castanon, S. Zu, Y. E. Li, J. Lucero, J. K. Osteen, A. Pinto-Duarte, J. Lee, J. Rink, S. Cho, N. Emerson, M. Nunn, C. O'Connor, Z. Wu, I. Stoica, Z. Yao, K. A. Smith, B. Tasic, C. Luo, J. R. Dixon, H. Zeng, B. Ren, M. M. Behrens and J. R. Ecker, Nature, 2023, 624, 366–377 CrossRef CAS PubMed.
- L. M. Johnson, M. Bostick, X. Zhang, E. Kraft, I. Henderson, J. Callis and S. E. Jacobsen, Curr. Biol., 2007, 17, 379–384 CrossRef CAS PubMed.
- M. Ito, A. Koike, N. Koizumi and H. Sano, Plant Physiol., 2003, 133, 1747–1754 CrossRef CAS PubMed.
- D. Takeshita, D. Onoshima, H. Hiroshi, T. Yasui, N. Kaji and Y. Baba, MicroTAS, 2014, 2348–2350 Search PubMed.
- T. Sano, Y. Okamoto, N. Kaji, M. Tokeshi and Y. Baba, MicroTAS 2011, 299–301 Search PubMed.
- Y. Okamoto, T. Sano, N. Kaji, M. Tokeshi and Y. Baba, MicroTAS 2012, 1939–1941 Search PubMed.
- Z. Cao and C. Lu, Anal. Chem., 2016, 88, 1965–1972 CrossRef CAS PubMed.
- R. Kurita and O. Niwa, Lab Chip, 2016, 16, 3631–3644 RSC.
- H. Takahashi, T. Yasui, M. Hirano, K. Shinjo, Y. Miyazaki, W. Shinoda, T. Hasegawa, A. Natsume, Y. Kitano, M. Ida, M. Zhang, T. Shimada, P. Paisrisarn, Z. Zhu, F. Ohka, K. Aoki, S. Rahong, K. Nagashima, T. Yanagida and Y. Baba, Biosens. Bioelectron., 2023, 234, 115318 CrossRef CAS PubMed.
- T. Suwatthanarak, I. A. Thiodorus, M. Tanaka, T. Shimada, D. Takeshita, T. Yasui, Y. Baba and M. Okochi, Lab Chip, 2021, 21, 597–607 RSC.
- T. Yasui, T. Yanagida, S. Ito, Y. Konakade, D. Takeshita, T. Naganawa, K. Nagashima, T. Shimada, N. Kaji, Y. Nakamura, I. A. Thiodorus, Y. He, S. Rahong, M. Kanai, H. Yukawa, T. Ochiya, T. Kawai and Y. Baba, Sci. Adv., 2017, 3, e1701133 CrossRef PubMed.
- M. Musa, T. Yasui, K. Nagashima, M. Horiuchi, Z. Zhu, Q. Liu, T. Shimada, A. Arima, T. Yanagida and Y. Baba, Anal. Methods, 2021, 13, 337–344 RSC.
- M. Musa, T. Yasui, Z. Zhu, K. Nagashima, M. Ono, Q. Liu, H. Takahashi, T. Shimada, A. Arima, T. Yanagida and Y. Baba, Anal. Sci., 2021, 37, 1139–1145 CrossRef CAS PubMed.
- K. Chattrairat, T. Yasui, S. Suzuki, A. Natsume, K. Nagashima, M. Iida, M. Zhang, T. Shimada, A. Kato, K. Aoki, F. Ohka, S. Yamazaki, T. Yanagida and Y. Baba, ACS Nano, 2023, 17, 2235–2244 CrossRef CAS PubMed.
- M. J. Abraham, T. Murtola, R. Schulz, S. Páll, J. C. Smith, B. Hess and E. Lindahl, SoftwareX, 2015, 1, 19–25 CrossRef.
- G. Bussi, D. Donadio and M. Parrinello, J. Chem. Phys., 2007, 126, 014101 CrossRef PubMed.
- U. Essmann, L. Perera, M. L. Berkowitz, T. Darden, H. Lee and L. G. Pedersen, J. Chem. Phys., 2015, 103, 8577–8593 CrossRef.
- B. Hess, H. Bekker, H. J. C. Berendsen and J. G. E. M. Fraaije, J. Comput. Chem., 1997, 18, 1463–1472 CrossRef CAS.
- S. A. Selamat, J. S. Galler, A. D. Joshi, M. N. Fyfe, K. D. Siegmund, K. M. Kerr and I. A. Laird-Offringa, PLoS One, 2011, 6, e21443 CrossRef CAS PubMed.
- C. Jerónimo, R. Henrique, M. O. Hoque, E. Mambo, F. R. Ribeiro, G. Varzim, J. Oliveira, M. R. Teixeira, C. Lopes and D. Sidransky, Clin. Cancer Res., 2004, 10, 8472–8478 CrossRef PubMed.
- S. Ogino, K. Nosho, G. J. Kirkner, T. Kawasaki, A. T. Chan, E. S. Schernhammer, E. L. Giovannucci and C. S. Fuchs, J. Natl. Cancer Inst., 2008, 100, 1734–1738 CrossRef CAS PubMed.
- A. A. I. Sina, L. G. Carrascosa, Z. Liang, Y. S. Grewal, A. Wardiana, M. J. Shiddiky, R. A. Gardiner, H. Samaratunga, M. K. Gandhi, R. J. Scott, D. Korbie and M. Trau, Nat. Commun., 2018, 9, 4915 CrossRef PubMed.
- G. Koetsier and E. Cantor, A practical guide to analyzing nucleic acid concentration and purity with microvolume spectrophotometers, New England Biolabs Inc., 2019, 1–8.
- S. Kint, W. De Spiegelaere, J. De Kesel, L. Vandekerckhove and W. Van Criekinge, PLoS One, 2018, 13, e0199091 CrossRef PubMed.
- Y. Zhu, Z. Cao and C. Lu, Analyst, 2019, 144, 1904–1915 RSC.
Footnotes |
| † Electronic supplementary information (ESI) available. See DOI: https://doi.org/10.1039/d4lc00893f |
| ‡ Current address: Department of Chemistry, School of Science, The University of Tokyo, 7-3-1 Hongo, Bunkyo-ku, Tokyo 113-0033, Japan. |
| This journal is © The Royal Society of Chemistry 2025 |