 Open Access Article
Synthetic molecular communication through microfluidic oscillating droplets for intrabody physiological data transmission
Fabrizio
Pappalardo
ad,
Carla
Panarello
b,
Salvo
Quattropani
bd,
Laura
Galluccio
bd,
Antonino
Licciardello
 ac,
Roberta
Ruffino
c,
Giovanni
Li-Destri
 ac,
Alfio
Lombardo
bd,
Giacomo
Morabito
bd and
Nunzio
Tuccitto
 *ac
*ac
aCSGI Consorzio Interuniversitario per lo sviluppo dei Sistemi a Grande Interfase, Via della Lastruccia 3, Firenze, Italy
bDIEEI, Dipartimento di Ingegneria Elettrica, Elettronica e Informatica, Università di Catania, Viale Andrea Doria, 6, 95125 Catania, Italy
cDSC, Dipartimento di Scienze Chimiche, Università di Catania, Viale Andrea Doria, 6, 95125 Catania, Italy. E-mail: nunzio.tuccitto@unict.it
dCNIT, Consorzio Nazionale Interuniversitario per le Telecomunicazioni, Research Unit at University of Catania, Italy
First published on 25th February 2025
Abstract
We explore the capabilities of a microfluidic-based synthetic molecular communication (SMC) system for the transmission of physiological data within the human body. The system employs oscillating water droplets as a means of transmitting information through pressure variations. The validity of this approach for binary communications is validated through a combination of simulations and experiments. A case study focused on monitoring gastroesophageal reflux disease (GERD) has been considered. The prototype platform demonstrated the capacity to transmit both synthetic raw esophageal pH values and severity classifications (e.g. acid reflux) through oscillating droplets. This finding underscores the promise of SMC for real-time physiological monitoring, paving the way for enhanced disease diagnosis and personalized treatment in medicine. Despite the need for miniaturization to facilitate in vivo use, this research establishes a robust foundation for the development of microfluidic SMC devices for medical diagnostics and physiological monitoring.
Introduction
Synthetic molecular communication (SMC) represents a revolution in the field of information transfer because it overcomes the well-known limitations of traditional methods based on electromagnetic waves and, instead, uses the transfer of matter as the communication methodology.1,2 This innovative approach is based on the interaction between molecules or particles, exploiting the physical and chemical properties of materials to transmit signals and data. SMC has potential applications in a wide range of fields, from biomedical engineering to robotics, from nanotechnology to information technology. In implantable medical devices, for example, SMC can enable data information to be exchanged between implanted intrabody sensors and external devices without the use of radio waves or cables, reducing the risk of electromagnetic interference and improving system safety and reliability.The advantages of SMC over standard communication technologies are numerous. First, SMC is not affected by the limitations of electromagnetic waves, such as signal attenuation and environmental interference, enabling the transmission of information in potentially inaccessible or hostile environments. In addition, SMC can be implemented with small low-power devices, making it particularly suitable for medical and nano-technological applications. Finally, SMC provides a high level of security and privacy, as information transfer occurs through the controlled movement of specific particles or molecules, reducing the risk of eavesdropping or privacy violations.
Since SMC has been theorized,3 various prototypes have been developed, typically using molecules in a liquid medium to transmit data. Early testbeds utilized acidic and basic solutions for binary communication or fluorescent quantum dots for biomedical applications. Magnetic nanoparticles (SPIONs) emerged as promising candidates for intrabody SMC due to their long-range capabilities. Advanced designs incorporated ssDNA-coated electrodes and graphene-based bioFETs for nanoscale communication. Glucose molecules, NaCl, and coloured pigments have also been explored as messengers, highlighting diverse approaches. However, these methods face challenges such as scalability, miniaturization, and integration, motivating the need for innovative systems for physiological data transmission.4–11 Droplet-based microfluidic platforms enable precise control over droplet generation and manipulation.12 The design of microfluidic devices and the flow regimes required to produce droplets are well known and very well characterised in the literature.13 Droplets can be manipulated with extreme precision, even in three dimensions,14 enabling drug screening,15 cell sorting,16 and cell analysis in general.17 The implementation of droplet-based microfluidics, using discrete droplets to encode and transmit information proposed by Galluccio et al.18 paved the way to microfluidic-based synthetic molecular communication systems. This approach encapsulates signalling molecules within droplets, which are then transported through microfluidic channels to their destination. However, these approaches rely on the continuous transmission of information packets encapsulated within droplets, a requirement that imposes significant constraints on their applicability in the biomedical field. This limitation arises mainly from the need for uninterrupted fluid flow, and from challenges such as high energy consumption and the potential signal degradation over time, all of which hinder their integration into real-time and resource-constrained biomedical systems. To overcome these limitations, in this paper we propose a platform based on a tube, several decimetres long, with a diameter in the order of fractions of micrometres, filled with oil. The transmitter (TX) applies a square wave of pressure difference, appropriately modulated, at the ends of the tube. A small water droplet is inserted into the oil near the receiver (RX). The oscillations of the water droplet, induced by the pressure gradient exerted on the fluid by the TX, replace the oscillations of the electromagnetic field. Current SMC systems are often limited by the complexity of their encoding schemes or the need for specialized molecules as messengers. Our approach uses oscillating droplets to encode binary data, enabling the transmission of physiological information such as pH levels or biomarker concentrations. This simplifies the encoding process while maintaining flexibility for various applications. The lack of the requirement for continuous flow and constant production of new droplets significantly has been demonstrated to engender a substantial reduction in resource consumption (in terms of both devices and energy). This enhancement makes the entire system more efficient and sustainable, especially in miniaturized or biomedical environments where liquid availability may be limited. The elimination of complex flow control and the necessity for repeated droplet generation, which would require meticulous management of volume, speed and frequency for each droplet, is a further benefit. This reduction in mechanical complexity and potential failure rate is a significant benefit. Unlike many existing SMC platforms, our droplet-based approach is conceptually compatible with miniaturized microfluidic devices. This makes it a promising candidate for in vivo integration, where space and biocompatibility constraints are critical. The single-droplet, closed-loop approach facilitates even greater miniaturization, paving the way for potential future applications in portable devices, lab-on-a-chip, or integrated systems implanted in biological tissues. The objective of our research is to utilize this device for communication between medical devices implanted in the human body and suitable for the determination of physical physiological parameters (temperature, pressure, mechanical stress, etc.), chemical parameters (pH, glucose, tumour biomarkers, etc.), or biological parameters (incipient infections, presence of microorganisms, exudates, etc.) and devices capable of decoding message exchange in the proximity of the body (e.g.: smartwatches or wearable electronics in general).
Results and discussion
Theoretical simulations
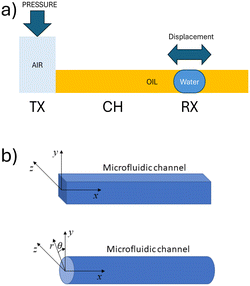
As illustrated schematically in Fig. 1, the system comprises a water droplet that, though only a few microliters in size, fully occupies the microfluidic tube, thereby creating two interfaces between oil and water. A pressure difference (or vacuum) is applied cyclically at the extremities of the tube, thus generating a pressure gradient that drives the fluid motion. Given the small size of the water droplet in relation to the total volume of fluid within the channel, it is assumed that the viscosity and density difference between the droplet and the continuous phase are negligible. Consequently, the droplet's motion is modelled based on the flow of the whole fluid in the pipe.To model the motion of the fluid in the microfluidic tube, we can use the Navier–Stokes equation for incompressible fluids:
 | (1) |
| ∇·v = 0 | (2) |
![[small nu, Greek, vector]](https://www.rsc.org/images/entities/i_char_e0ea.gif) is the velocity field,
is the velocity field, ![[g with combining right harpoon above (vector)]](https://www.rsc.org/images/entities/i_char_0067_20d1.gif) is the gravity acceleration, P is the fluid pressure and μ is the fluid viscosity. The fluid pressure and velocity field are functions of the position
is the gravity acceleration, P is the fluid pressure and μ is the fluid viscosity. The fluid pressure and velocity field are functions of the position ![[r with combining right harpoon above (vector)]](https://www.rsc.org/images/entities/i_char_0072_20d1.gif) and time t, i.e. P = P(
and time t, i.e. P = P(![[r with combining right harpoon above (vector)]](https://www.rsc.org/images/entities/i_char_0072_20d1.gif) , t) and
, t) and ![[small nu, Greek, vector]](https://www.rsc.org/images/entities/i_char_e0ea.gif) =
= ![[small nu, Greek, vector]](https://www.rsc.org/images/entities/i_char_e0ea.gif) (
(![[r with combining right harpoon above (vector)]](https://www.rsc.org/images/entities/i_char_0072_20d1.gif) , t). We consider the reference system of coordinates oriented according to Fig. 1b, with its origin placed at the beginning of the microfluidic channel and centered with respect to the channel section. The notation (D(
, t). We consider the reference system of coordinates oriented according to Fig. 1b, with its origin placed at the beginning of the microfluidic channel and centered with respect to the channel section. The notation (D(![[small nu, Greek, vector]](https://www.rsc.org/images/entities/i_char_e0ea.gif) ))/Dt refers to the total derivative, i.e.:
))/Dt refers to the total derivative, i.e.: | (3) |
![[small nu, Greek, vector]](https://www.rsc.org/images/entities/i_char_e0ea.gif) . For the scope of this work, we can simplify the above equations by considering the following assumptions.
. For the scope of this work, we can simplify the above equations by considering the following assumptions.
The channel is placed horizontally along the x-axis, so along the z-axis gravity is balanced by the hydrostatic pressure. Therefore, we can neglect the term ρ![[g with combining right harpoon above (vector)]](https://www.rsc.org/images/entities/i_char_0067_20d1.gif) . The flow is assumed to be laminar. The cross-section of the microfluidic channel in the plane yz is constant along the x-axis. This implies that: the movement of the fluids in the channel is only affected by the pressure difference applied at the channel ends. The pressure gradient is constant along the x-axis and equal to ΔP/L, being L the length of the channel. Since the flow is laminar, the velocity vector has only the x-component vx, which does not depend on the variable x. For readability reasons, in the following the x-component of the velocity will be indicated as v, without the x indication. Therefore, we have: vy = vz = 0 and (∂v_x)/∂x
. The flow is assumed to be laminar. The cross-section of the microfluidic channel in the plane yz is constant along the x-axis. This implies that: the movement of the fluids in the channel is only affected by the pressure difference applied at the channel ends. The pressure gradient is constant along the x-axis and equal to ΔP/L, being L the length of the channel. Since the flow is laminar, the velocity vector has only the x-component vx, which does not depend on the variable x. For readability reasons, in the following the x-component of the velocity will be indicated as v, without the x indication. Therefore, we have: vy = vz = 0 and (∂v_x)/∂x ![[triple bond, length as m-dash]](https://www.rsc.org/images/entities/char_e002.gif) ∂v/∂x = 0, thus the total derivative in eqn (3) coincides with the temporal derivative of the x component of the velocity.†
∂v/∂x = 0, thus the total derivative in eqn (3) coincides with the temporal derivative of the x component of the velocity.†
Accordingly, eqn (1) becomes:
 | (4) |
![[r with combining right harpoon above (vector)]](https://www.rsc.org/images/entities/i_char_0072_20d1.gif) = (x, r, θ), where r and θ, are the radial distance and polar angle of the position vector in the yz-plane (Fig. 1b). For the assumptions above, the x component of the velocity depends on the radial distance, without depending on the polar angle. Thus eqn (4) becomes:
= (x, r, θ), where r and θ, are the radial distance and polar angle of the position vector in the yz-plane (Fig. 1b). For the assumptions above, the x component of the velocity depends on the radial distance, without depending on the polar angle. Thus eqn (4) becomes: | (5) |
 | (6) |
As shown in Fig. 3, the pressure gradient can be used to control the amplitude of the water droplet oscillations. To illustrate this, the ON–OFF keying (OOK) modulation in the SMC can be considered. In this scenario, the transmitter generates a pressure square wave in synchrony with the bits to be transmitted. Specifically, a high-pressure square wave is generated to represent a bit 1, which is then interrupted to indicate a bit 0. The droplet oscillates with a larger amplitude when the square wave is present, and the amplitude of the oscillations reduces to zero when the square is absent, as illustrated in Fig. 3a. Alternatively, the amplitude shift keying (ASK) method utilizes two distinct amplitudes of the pressure square wave to encode the respective bits: a low amplitude for bit 0 and high amplitude for bit 1, as shown in Fig. 3b.
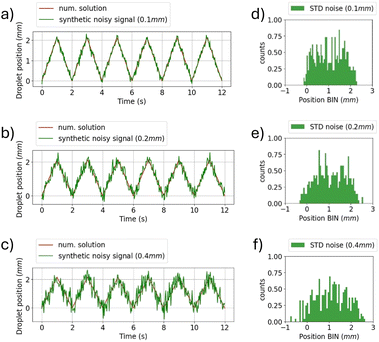
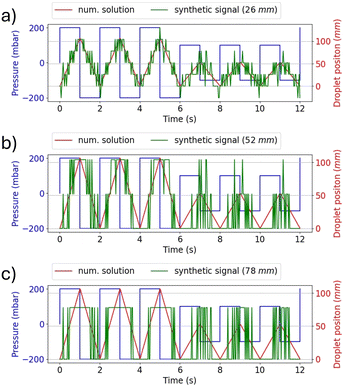
On the receiver side, detecting the amplitude of the water droplet oscillations allows decoding the transmitted bits. However, the threshold to discriminate between the two states must be chosen by considering possible noisy conditions, which could introduce decoding errors. Fig. 4 shows the effect of noise on the determination of the oscillation amplitude. White noise has been added assuming the RX has a sampling rate of 30 measurements per second. Fig. 4(a)–(c) show the droplet position when a sequence of bits equal to 1 is transmitted considering a variable noise power level. Fig. 4(d)–(f) present the histogram analysis of the positions of the oscillating droplet. As the noise power level increases, the spread of the data becomes significant, which makes the identification of the correct amplitude of oscillation more challenging. It is imperative to consider the minimum resolution in displacement detection when analysing RX. Fig. 5 shows the variation in the synthetic signal when considering different RX resolution values, expressed in terms of minimum detectable displacement. It is noteworthy that, at low resolutions (greater than half of the minimum oscillation amplitude), the symbol related to bit 1 is indistinguishable from bit 0.
Experimental results
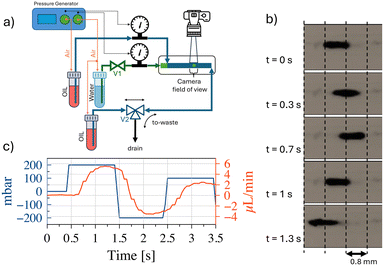
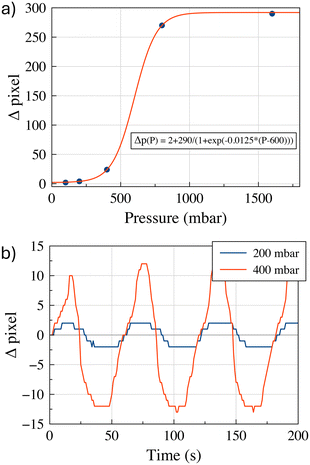
Fig. 6(a) shows a schematic representation of the experimental setup made for in-operando verification of oscillating droplet-based SMC. The testbed is designed to operate in two modalities, one able to produce microfluidic water-in-oil droplets, and the second to enable the oscillating droplet-based SMC. In the operating mode capable of microdroplet production, valve V1 is open and the 3-way valve V2 is placed in the ‘to-waste’ position. The pressure generator is responsible for generating overpressure within the headspace of water and oil containers. Utilising a feedback system, driven by two flowmeters placed in the circuit, it is capable of producing the appropriate pair of fluid flow rates, thereby ensuring the establishment of the fluid-dynamic conditions they are suitable for the production of microdroplets of water, in the microfluidic chip, which is positioned downstream of the circuit. In SMC mode, the pressure generator operates from TX. Valve V1 is closed and valve V2 is placed in the ‘to-oil’ position. Thus configuration enables the TX to alternating pressure fluctuations at the terminal points of the circuit, thereby inducing droplet oscillation. The RX comprises of a micro-camera that records the displacement of the droplets. Fig. 6(b) shows a few frames of the video illustrating the oscillating displacement induced on the droplets. A trained machine learning algorithm analyses the frames of the video captured by the camera and decodes the message that the TX intended to convey. We omit a detailed description of microfluidic droplet production since this operational mode has been extensively documented in the literature,20–22 and no novel developments have been made for our specific purposes. In the SMC mode, to achieve droplet oscillation from the RX side, the TX applies an alternating positive square pressure wave in counterphase at the two ends of the circuit. The net effect of this is that the water droplet, placed at the RX, undergoes a zero mean square wave, which is consistent with the numerical simulations. This phenomenon was substantiated through the deployment of a flowmeter in close proximity to the RX, thus verifying the efficacy of the oscillatory mechanism. This apparatus enables continuous regulation of the process and facilitates the requisite experimental optimization operations. Fig. 6c shows the flow velocity trend as a function of time, together with the pressure wave set by the generator.The system has been developed for the purpose of remote detection of the TX-induced oscillation. In real-life applications, the flowmeter is intended to be replaced with non-invasive detection device. In fact, a variety of remote detection methods can be readily implemented in wearable devices. For instance, microelectronic optical sensors could detect the oscillations of coloured droplets oscillating in catheters placed under the skin, similar to the heartbeats analysis performed by modern smartwatches. Alternatively, induction sensors could detect oscillations if the water droplet is enriched with magnetic nanoparticles. For the purpose of expediency in this study, the RX consists of a video recording micro camera, placed at the RX to detect the water droplet. To the purpose, coloured water is used to produce the droplet. The microfluidic droplet identification process is based on the implementation of dedicated image analysis algorithms designed to detect and delineate contours based on variations in pixel colours. The system incorporates techniques for high-precision image stabilization, ensuring that recorded frames remain stable and focused. This stabilization is particularly relevant when dealing with micro-scale objects, such as droplets, where even marginal movements can have a significant impact on the accuracy of the analysis. In addition to image stabilization, the system incorporates algorithms for dynamic pixel tracking of identified objects between successive frames. This process provides a detailed representation of droplet motion patterns within microfluidic channels. Operating at a frame rate of 30 frames per second (fps), the algorithm implements real-time evaluation of pixel displacement, resulting in a highly granular and dynamic measurement of droplet motion. This temporal resolution facilitates the acquisition of detailed information reading the behaviour of the droplets, thereby enabling a comprehensive understanding of their interactions and characteristics within the microfluidic system. The combination of all these features renders RX capable of precise and reliable identification of droplets within the microfluidic environment. As illustrated in Fig. 7(a), a non-linear nonlinear relationship has been derived through experimental means between the applied pressure and the droplet displacement. This behaviour can be attributed to the experimental setup, which involves the presence of air between the pressure generator and the oil. Small pressure variations are absorbed by air compression, preventing the full transmission of pressure to the oil. As higher-pressure variations are imposed, the resistance to air compression increases and more pressure is released to the oil, causing more significant and accelerated movement of the droplet. At even higher-pressure variations, the fluid viscosity and adhesion forces to the channel walls counteract any further increase in velocity, limiting further acceleration. Fig. 7(b) shows the superposition between the square wave applied by the TX and the oscillation detected by the RX for two distinct pressure difference values, namely 200 mbar and 400 mbar.
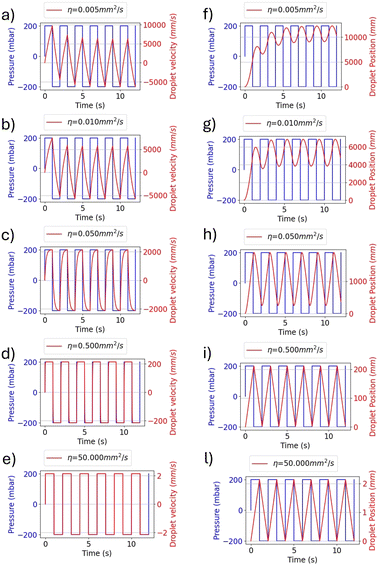
The experimental curves are similar to those obtained from the numerical solution of eqn (3), as shown in Fig. 2. In fact, the experimental results in Fig. 7(b) show droplet displacements of a few pixels, which according to the camera resolution, corresponds to an oscillation amplitude in the order of millimetres (1 pixel = 0.027 mm). This result is in accordance with the model solution in Fig. 2(l), where the kinematic viscosity η = 50 mm2 s−1 is close to the value of η = 54 mm2 s−1 of the oil used in the experimental setup. Small differences between the model solutions and the experimental results are due to the presence of air between the pressure generator and oil, as explained for Fig. 7(a), whose effects are not included in the model. The modelling approach adopted in this paper intentionally incorporates simplifications, including the assumption of 1D flow dynamics and rigid body behaviour of the droplet. These simplifications were made with careful consideration of the specific objectives of the study, namely predicting the qualitative behaviour of the droplet dynamics and providing information on key influencing parameters to guide the design of the experimental setup. The decision to use a simplified model is supported by the operating conditions of the system. In the described setup, the channel geometry remains linear and uniform, and the Reynolds number is consistently low (in the order of 0.1 or less), due to the kinematic fluid viscosity and applied pressure gradients. Under such conditions, inertial forces are negligible, turbulence does not occur, and the effects of droplet deformation are minimal. These factors ensure that the simplified assumptions accurately reflect the dynamics of the system without compromising the reliability of the results.23–27
If the two values of pressure shown in Fig. 7(b), are associated with the two symbols bit 0 and bit 1, the RX must be able to recognize the two waveforms. For this purpose, a specific decoding method based on artificial intelligence (AI) has been implemented. The process of training the artificial intelligence model is a critical step to ensure that the system can correctly interpret the pixel variations related to the different binary symbols (0 and 1) represented by the drop oscillation. To perform the training, it is necessary to provide the model with sufficient input data, i.e., the known binary symbol sequences and the associated pixel variations observed during the drop oscillation. In the training phase, the artificial intelligence model “learns” to identify patterns and relationships between the input data (the pixel variations) and the desired outputs (the binary symbols). This process is accomplished through the application of machine learning algorithms based on random forest, that analyse the training data and iteratively update the model parameters to minimize prediction error. During the training process, the model attempts to identify the distinctive features of pixel variations associated with each binary symbol. For instance, it learns that a specific type of drop oscillation corresponds to a 0 bit, while another type of oscillation is associated with a 1 bit. This learning process enables the model to generate a “map” of the relationships between pixel variations and binary symbols, which is then used to make predictions on new input data.
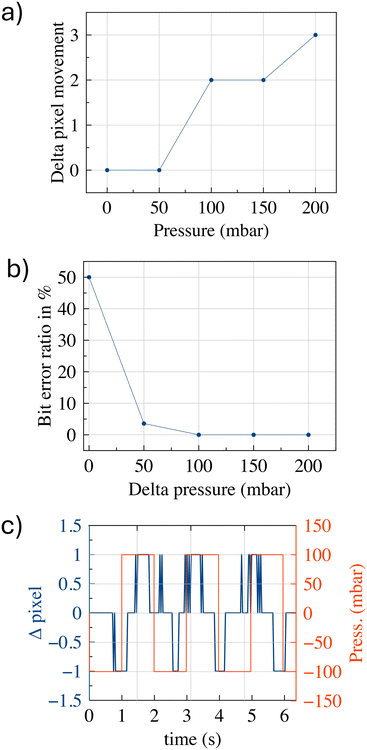
Upon completion of the training phase and successfully minimization of the recognition parameters, the artificial intelligence model is deemed ready for utilization in the decoding of binary sequences from water droplet oscillations within the microfluidic device. The employment the trained model facilitates the real-time processing of drop oscillations videos, enabling the precise determination of binary symbol (0 or 1) represented by each observed pixel variation. The implementation of a machine learning detection algorithm ensures enhanced robustness and adaptability in comparison with traditional threshold-based methods. While thresholding can identify amplitude differences under ideal conditions, it frequently fails in the presence of noise, pressure fluctuations or system variability. The algorithm utilizes multiple signal features in addition to amplitude, such as velocity and displacement trends, to ensure reliable bit classification. This approach is also in line with our long-term objectives to enhance the system's scalability, enabling more complex bit encoding schemes in the future by analysing patterns of droplet dynamics, including both displacement and velocity. Fig. 8(a) shows the minimum pressure variation that the TX must apply to allow the RX to detect a change in the drop's position or at least its significant deformation. The data indicate that at 100 mbar, there is a minimum distinguishable induced displacement (equal to 2 pixels). By employing a single-threshold binary modulation, where bit 0 is associated with no change and bit 1 with a perceptible oscillation, we can define the corresponding pressure variation as the minimum one for such SMC to occur. Fig. 8(b) shows an analysis of the bit error ratio (BER), evaluated in terms of numbers of bits, as a function of distinct pressure differences. The system was implemented with a two-threshold binary modulation, where bit 0 is associated with 100 mbar while bit 1 corresponds to a different distinguishable oscillation. The data demonstrate that a pressure difference of +50 mbar signifies the second minimum threshold required to differentiate between two different oscillations associated with the two binary symbols. Fig. 8(c) shows the signal (superimposed on the square pressure wave) when operating at the minimum detectable limit. It is noteworthy that, despite the displacement being challenging to discern under these conditions, the shift to positive delta values is more readily experienced by the droplet. This may be due to the non-perfectly symmetrical oscillations operating in these extreme conditions. The pressure difference values (100 mbar = 75 mmHg and 150 mbar = 112.5 mmHg) used in the experiment of Fig. 8, are very close to the typical diastolic and systolic pressures experienced in the human circulatory system. This suggests the potential existence of an operating condition in which the source of energy required to achieve in vivo SMC is provided by the heartbeat, although the results are still far from this condition.
Synthetic case study
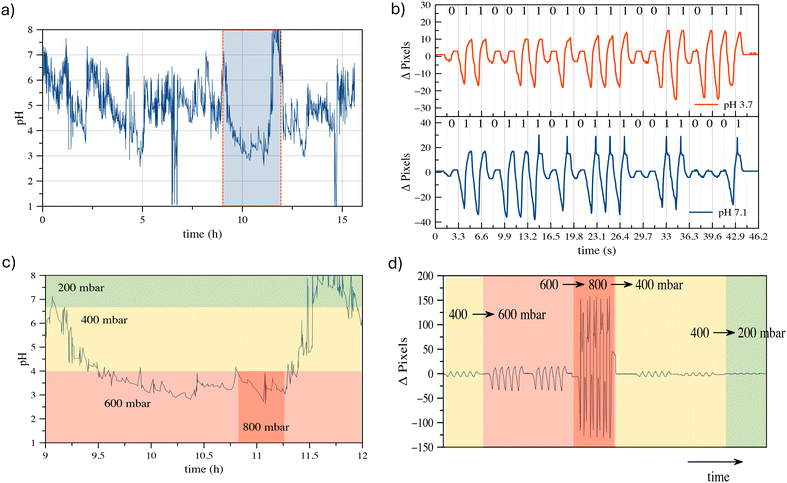
Although the development of an SMC device operating in vivo is beyond the scope of this study, one of the most promising applications of our proposed SMC system, based on water droplet oscillation, lies in the transmission of physiological parameters directly within the human body. This innovative approach offers an effective means for continuous health monitoring, enabling earlier diagnosis and more accurate management of medical conditions. Our results demonstrate the potential of oscillating droplet-based SMC to transmit information related to intracorporeal pressure, biomarker concentrations, interstitial pH, fluid viscosity, and more. Such an approach allows for reliable data transmission in environments where standard electromagnetic wave-based communication may be compromised or detrimental, due to the complex properties of biological tissues. This capability opens pathways for numerous medical applications, including remote chronic patient monitoring, early disease diagnosis, and personalized treatment guidance. To explore the feasibility of this concept, we selected a case study and developed a prototype platform simulating the in vitro transmission of esophageal pH values by the transmitter (TX). The testbed used for this study corresponds to the setup depicted in Fig. 6. While the esophageal canal device remains conceptual, the in vitro testbed provides a controlled environment for validating the encoding and transmission capabilities of the proposed system.The conceptual setup involves an implantable device in the esophageal canal equipped with a pH sensor capable of 24 hour continuous monitoring, taking readings every minute. In the current testbed implementation, synthetic pH data are used to mimic real trends widely reported in the literature,28,29 as illustrated in Fig. 9(a). These data simulate pH variations associated with gastroesophageal reflux disease (GERD). This synthetic approach was chosen due to the early-stage nature of our research, which focuses on establishing the fundamental principles of droplet-based synthetic molecular communication (SMC) rather than the immediate development of a fully operational in vivo device. The TX in the testbed operates in two functional modes: i) transmitting the measured pH values, or ii) transmitting the severity of the reflux event. In the first mode, the measured pH value is encoded in ASCII format and transmitted using an OOK (On–Off keying) binary-encoded bit sequence. Fig. 9(b) shows examples of pH value communications, where the synthetic pH values are converted into ASCII-7b code and transmitted using the oscillating droplet-based platform. The pressure difference values used to code bit 0 and bit 1 are 200 and 400 mbar, respectively. At these pressure values, excellent signal quality is evident to the reader's eye. Although using lower values makes it harder to discriminate between the two binary symbols, AI-trained algorithms have demonstrated that zero BER (bit error ratio) is achieved even when operating at the minimum detectable pressures. The communication speed aligns with the pH sampling rate, as the value is transmitted within one minute. It is widely accepted in the relevant medical literature23 that there are four subcategories of reflux based on the esophageal pH detected during reflux: (A) acid reflux, reflux episodes that reduce the basal esophageal pH below 4; (B) superimposed acid reflux (acid re-flux), reflux events occurring during an interval of acid clearing, before esophageal pH has recovered to above 4 after acid reflux; (C) weakly acid reflux, that result in esophageal pH value between 4 and 7; and (D) weakly alkaline reflux, pH remains neutral or rises above 7. Operating in ‘reflux severity’ mode, the TX sends the information according to the following correlation table:
• If case (A) occurs, acid reflux induces a decrease in pH below 4, the TX sends oscillations by applying a square wave with 800 mbar pressure difference;
• If case (B) occurs, acid reflux is superimposed (acid re-flux), the TX sends oscillations applying a square wave with 600 mbar pressure difference;
• If case (C) occurs, weakly acid reflux, the TX sends oscillations by applying a square wave with 400 mbar pressure difference;
• If case (D) occurs, weakly alkaline reflux, the TX sends oscillations applying a square wave with 200 mbar pressure difference.
As demonstrated in Fig. 9(a), a significant reflux event is observed between 9 h and 12 h, as illustrated in Fig. 9(c) where regions with pH values the exceed the reference thresholds are highlighted.
These events trigger the TX to adjust the square wave pressure to signal the transition. Fig. 9(d) reports the effects of such transitions on the drop-induced oscillation at the RX, clearly showing how the pressure changes, as applied by the TX, result in different oscillation amplitudes. This outcome is of considerable significance, as it demonstrates the system's capability to accurately and timely communicate different reflux conditions. For a potential in vivo implementation, we envision a miniaturized pH sensor linked to a micro actuator capable of generating oscillations, such as a piezoelectric or MEMS-based device. The pH values could be translated into oscillatory patterns by modulating the frequency or amplitude of pressure variations based on the measured pH levels. This concept provides a pathway to integrate real-time pH monitoring with droplet-based signal transmission. For in vivo detection of droplet oscillations, non-invasive near-infrared (NIR) sensors could be placed externally, such as on a smartwatch-like device. Coloured droplets oscillating under the skin could be monitored by detecting changes in light absorption or reflection enabling non-invasive readout. The capability to transmit real-time data on alterations in physiological conditions has the potential to bring about a paradigm shift in the continuous monitoring and individualized treatment of patients with disease, thus significantly improving their quality of life and reducing the risks associated with late diagnosis or inadequate treatment.
Despite the fact that the testbed employed in this research does not yet reach the size required for effective miniaturization and practical in vivo application, the results are extremely encouraging. Full-scale implementation would require additional bioengineering efforts to reduce the device's size and ensure the biocompatibility necessary for safe application within the human body. The results reported here provide a solid foundation for the future development of interconnected microfluidic devices according to oscillating drop-based SMC. The present work establishes a foundation for further research that could lead to the effective miniaturization of the system, thus enabling the application of this innovative molecular communication technology directly within the human body for physiological and diagnostic monitoring.
Experimental
Simulations were conducted using custom Python scripts. Authors can share the code upon request. Open-source libraries NumPy, SciPy, and Matplotlib were used for numerical computations and data visualization. Additionally, Magicplot was employed for some graphical representations. A specially designed prototype platform was used for this research. The OB1 device (Elveflow, France) provided pressure and flow control. A Y-shape microfluidic chip (Chipshop, Germany) made of polycarbonate was used. To generate the droplets, sunflower seed oil and microfiltered water coloured with liquid food colouring was used for the oil and water phases, respectively. Droplet movement was detected by analysing images acquired with a Pro digital microscope with a 200× zoom capability (RS Components). This camera has a resolution of 2 megapixels and a frame rate of 30 FPS. To accurately train the model, enough input data was required. This data consisted of known binary symbol sequences along with the corresponding pixel variations observed during the drop oscillation. The training process was conducted using the random forest method, with a data split of 80% for training and 20% for testing. The machine learning model was developed using the Python programming language, leveraging specific machine learning libraries such as scikit-learn. A supervised approach was adopted for training. During this phase, the AI model “learns” to identify patterns and relationships between the input data (pixel variations) and the desired outputs (binary symbols). This learning process involves the application of machine learning algorithms based on random forest, which analyse the training data and iteratively update the model parameters to minimize prediction errors. During training, the model aims to identify distinctive features of pixel variations associated with each binary symbol. For instance, it learns that a certain type of drop oscillation corresponds to a bit 0, while another type is associated with a bit 1. This learning process enables the model to generate a “map” of the relationships between pixel variations and binary symbols, which is then used to make predictions on new input data. Random forest is an ensemble learning algorithm that combines the predictions of multiple decision trees to improve the accuracy and robustness of the model. Each tree in the forest was trained on a random subset of the training data and a random subset of features. This approach reduces the risk of overfitting and enhances the model's ability to well generalize on test data. Additionally, random forest is particularly effective at handling datasets with a high number of variables and can manage both numerical and categorical data, making it suitable for cases like ours where pixel variations can exhibit high complexity. For the creation of the training data, extensive data acquisition was performed over multiple measurement campaigns. Specifically, 20 measurement campaigns were conducted for bit 1 and 20 for bit 0, measuring the pixel deviations accordingly. Once an acceptable standard deviation of about 1 pixel was achieved, the dataset was created by averaging the obtained values and labelling the results for both bit 0 and bit 1. The accuracy achieved at the end of the training was 98%, indicating a high capability of the model to correctly predict binary symbols based on pixel variations.Conclusions
In this study, we propose a SMC based on oscillating drops for transmitting physiological data within the human body. The simplified modelling approach effectively balances predictive accuracy and practical applicability, serving as a solid basis for the exploration and validation of synthetic molecular communication via oscillating droplets. While future research may address more complex flow dynamics, the current framework sufficiently fulfils the objectives of this study and provides a pathway for further investigation. Through the development and analysis of a prototype SMC platform, we have demonstrated the feasibility and potential of the proposed approach. Specifically, it has been demonstrated that reliable encoding and transmission of information pertaining to physiological parameters, including esophageal pH levels, which are indicative of gastroesophageal reflux events, is achievable through the utilization of oscillations induced by pressure changes.The capability to communicate real-time data on physiological conditions offers significant promise for revolutionizing medical monitoring and personalized treatment. By providing timely insights into changes in health status, this technology could enable earlier diagnosis, more effective management of medical conditions, and ultimately, improved patient outcomes. While further research and development are needed to translate this technology into practical clinical applications, the findings reported here lay a solid foundation for future advancements in the field of SMC and microfluidic communication systems.
Data availability
Python and Magicplot were used to data treatment and to prepare figures. Last version of Python can be download from https://www.python.org/downloads/. A free trial version of Magicplot can be downloaded from https://magicplot.com/index.php#download.Author contributions
Nunzio Tuccitto (conceptualization: lead; data curation: equal; formal analysis: equal; funding acquisition: equal; investigation: equal; methodology: equal; supervision: lead; visualization: equal; writing – original draft: equal; writing – review & editing: lead) Fabrizio Pappalardo (conceptualization: equal; data curation: equal; methodology: equal) Salvo Quattropani (conceptualization: equal; data curation: equal; formal analysis: equal; investigation: equal; methodology: equal; software: equal) Laura Galluccio (conceptualization: equal; data curation: equal; formal analysis: equal; funding acquisition: equal; software: equal; writing – original draft: equal; writing – review & editing: equal) Antonino Licciardello (data curation: supporting;writing – original draft: supporting) Roberta Ruffino (data curation: supporting; writing – original draft: supporting) Giovanni Li-Destri (data curation: equal; formal analysis: equal; writing – original draft: equal; writing – review & editing: equal) Carla Panarello (conceptualization: equal; data curation: equal; formal analysis: equal; investigation: equal; methodology: equal; software: equal; visualization: equal; writing – original draft: equal; writing – review & editing: equal) Alfio Lombardo (conceptualization: equal; formal analysis: equal; supervision: equal; validation: equal; writing – original draft: equal; writing – review & editing: equal) Giacomo Morabito (conceptualization: equal; methodology: equal; supervision: equal; writing – original draft: equal; writing – review & editing: equal).Conflicts of interest
There are no conflicts to declare.Acknowledgements
The research was partially supported also by the PIACERI project “SICURI” and by the European Union under the Italian National Recovery and Resilience Plan (NRRP) of NextGenerationEU, partnership on “Telecommunications of the Future” (PE0000001 – program) “RESTART”.Notes and references
- N. Farsad, H. B. Yilmaz, A. Eckford, C. B. Chae and W. Guo, IEEE Commun. Surv. Tutor., 2016, 18, 1887–1919 Search PubMed.
- S. Lotter, L. Brand, V. Jamali, M. Schäfer, H. M. Loos, H. Unterweger, S. Greiner, J. Kirchner, C. Alexiou, D. Drummer, G. Fischer, A. Buettner and R. Schober, IEEE Nanotechnol. Mag., 2023, 17, 42–53 Search PubMed.
- S. Hiyama and Y. Moritani, Nano Commun. Netw., 2010, 1, 20–30 CrossRef.
- N. Farsad, D. Pan and A. Goldsmith, Proceedings - IEEE Global Communications Conference, GLOBECOM, 2017, 2018-January, pp. 1–6 Search PubMed.
- N. Tuccitto, G. Li-Destri, G. M. L. Messina and G. Marletta, J. Phys. Chem. Lett., 2017, 8(16), 3861–3866 CrossRef CAS PubMed.
- N. Tuccitto, G. Li-Destri, G. M. L. Messina and G. Marletta, Phys. Chem. Chem. Phys., 2018, 20(48), 30312–30320 RSC.
- M. Bartunik, M. Lübke, H. Unterweger, C. Alexiou, S. Meyer, D. Ahmed, G. Fischer, W. Wicke, V. Jamali, R. Schober and J. Kirchner, Proceedings of the 6th ACM International Conference on Nanoscale Computing and Communication, NANOCOM, 2019, DOI:10.1145/3345312.3345483.
- W. Wicke, H. Unterweger, J. Kirchner, L. Brand, A. Ahmadzadeh, D. Ahmed, V. Jamali, C. Alexiou, G. Fischer and R. Schober, IEEE Trans. Mol. Biol. Multi-Scale Commun., 2022, 8, 56–71 Search PubMed.
- M. Kuscu, H. Ramezani, E. Dinc, S. Akhavan and O. B. Akan, Sci. Rep., 2021, 11(1), 1–20 CrossRef PubMed.
- S. Angerbauer, M. Hamidovic, F. Enzenhofer, M. Bartunik, J. Kirchner, A. Springer and W. Haselmayr, IEEE Trans. Mol. Biol. Multi-Scale Commun., 2023, 9, 191–206 Search PubMed.
- L. Galluccio, A. Lombardo, G. Morabito, F. Pappalardo and S. Quattropani, IEEE Trans. Mol. Biol. Multi-Scale Commun., 2024, 10, 164–174 Search PubMed.
- S. Y. Teh, R. Lin, L. H. Hung and A. P. Lee, Lab Chip, 2008, 8, 198–220 RSC.
- L. Nan, H. Zhang, D. A. Weitz and H. C. Shum, Lab Chip, 2024, 24, 1135–1153 RSC.
- M. Sun, B. Sun, M. Park, S. Yang, Y. Wu, M. Zhang, W. Kang, J. Yoon, L. Zhang and M. Sitti, Sci. Adv., 2024, 10, 1439 CrossRef PubMed.
- C. Parent, K. R. Melayil, Y. Zhou, V. Aubert, D. Surdez, O. Delattre, C. Wilhelm and J. L. Viovy, Lab Chip, 2023, 23, 5139–5150 RSC.
- M. E. Blaha, S. Hasan, C. Dusny and D. Belder, Lab Chip, 2022, 22, 1604–1614 RSC.
- P. Chen, S. Li, Y. Guo, X. Zeng and B. F. Liu, Anal. Chim. Acta, 2020, 1125, 94–113 CrossRef CAS PubMed.
- L. Galluccio, A. Lombardo, G. Morabito, S. Palazzo, C. Panarello and G. Schembra, IEEE Trans. Commun., 2018, 66, 194–208 Search PubMed.
- G. R. Wang, F. Yang and W. Zhao, Lab Chip, 2014, 14, 1452–1458 RSC.
- P. Zhu and L. Wang, Lab Chip, 2016, 17, 34–75 RSC.
- L. Y. Yeo, H. C. Chang, P. P. Y. Chan and J. R. Friend, Small, 2011, 7, 12–48 CrossRef CAS PubMed.
- C. M. Svensson, O. Shvydkiv, S. Dietrich, L. Mahler, T. Weber, M. Choudhary, M. Tovar, M. T. Figge and M. Roth, Small, 2019, 15, 1802384 CrossRef PubMed.
- N. Boruah and P. Dimitrakopoulos, J. Colloid Interface Sci., 2015, 453, 216–225 CrossRef CAS PubMed.
- D. J. E. Harvie, J. J. Cooper-White and M. R. Davidson, J. Non-Newton. Fluid Mech., 2008, 155, 67–79 CrossRef CAS.
- D. J. E. Harvie, M. R. Davidson, J. J. Cooper-White and M. Rudman, Int. J. Multiphase Flow, 2007, 33, 545–556 CrossRef CAS.
- S. Narayan, D. B. Moravec, A. J. Dallas and C. S. Dutcher, Phys. Rev. Fluids, 2020, 5, 113603 CrossRef.
- Y. Wang and P. Dimitrakopoulos, Theor. Comput. Fluid Dyn., 2012, 26, 361–379 CrossRef CAS.
- Y. K. Cho, J. Neurogastroenterol. Motil., 2010, 16, 327 CrossRef PubMed.
- Y. Xiao, J. C. Y. Wu, C. L. Lu, P. H. Tseng, L. Lin, X. Hou, Y. Li, D. Zou, B. Lv, X. Xiang, N. Dai, X. Fang and M. Chen, J. Gastroenterol. Hepatol., 2022, 37, 812–822 CrossRef PubMed.
Footnote |
| † In the scope of this paper, the model is aimed at predicting a qualitative behaviour of the proposed system. However, the assumptions introduced so far, of laminar flow and no gravitational effects, although in some context may oversimplify the model, do not affect either the design or the performance analysis of the experimental setup. In the configuration described later in this paper and used to produce the experimental results, the kinematic viscosity of the fluids, the operating pressure gradients and their temporal variations guarantee Reynolds numbers in the order of 10−1 and lower. In such conditions, other (strong and high frequency) body forces than the pressure term alone are necessary to surpass the viscous force and produce a large inertial term that generates turbulence.19 This legitimates the model simplifications. |
| This journal is © The Royal Society of Chemistry 2025 |

