
 Open Access Article
 This Open Access Article is licensed under a Creative Commons Attribution-Non Commercial 3.0 Unported Licence
Microfluidic cell unroofing for the in situ molecular analysis of organelles without membrane permeabilization†
Yuki Umedaa,
Shinya Yamahirab,
Koki Nakamura a,
Tomoko Takagic,
Tomoko Suzukic,
Kae Satoc,
Yusuke Hirabayashia,
Akimitsu Okamotoa and
Satoshi Yamaguchi*b
a,
Tomoko Takagic,
Tomoko Suzukic,
Kae Satoc,
Yusuke Hirabayashia,
Akimitsu Okamotoa and
Satoshi Yamaguchi*b
aDepartment of Chemistry and Biotechnology, Graduate School of Engineering, The University of Tokyo, 7-3-1 Hongo, Bunkyo-ku, Tokyo 113-8656, Japan
bSANKEN, Osaka University, 8-1 Mihogaoka, Ibaraki-shi, Osaka 567-0047, Japan. E-mail: syamaguchi@sanken.osaka-u.ac.jp
cDepartment of Chemical and Biological Sciences, Japan Women's University, 2-8-1 Mejirodai, Bunkyo-ku, Tokyo 112-8681, Japan
First published on 19th February 2025
Abstract
Molecular networks of organelle membranes are involved in many cell processes. However, the nature of plasma membrane as a barrier to various analytical tools, including antibodies, makes it challenging to examine intact organelle membranes without affecting their structure and functions via membrane permeabilization. Therefore, in this study, we aimed to develop a microfluidic method to unroof cells and observe the intrinsic membrane molecules in organelles. In our method, single cells were precisely arrayed on the bottom surface of microchannels in a light-guided manner using a photoactivatable cell-anchoring material. At sufficiently short cell intervals, horizontal stresses generated by the laminar flow instantly fractured the upper cell membranes, without significantly affecting some organelles inside the fractured cells. Subsequently, nucleus and other organelles in unroofed cells were observed via confocal fluorescence and scanning electron microscopy. Furthermore, distribution of the mitochondrial membrane protein, translocase of outer mitochondrial membrane 20, on the mitochondrial membrane was successfully observed via immunostaining without permeabilization. Overall, the established cell unroofing method shows great potential to examine the localization, functions, and affinities of proteins on intact organelle membranes.
Introduction
Membrane biomolecules, such as membrane proteins and signaling lipids, play crucial roles in intracellular signal transduction by interacting with their corresponding ligands and receptor molecules.1,2 As these signals initiate various cellular responses, elucidation of the molecular networks close to the plasma and organelle membranes is essential for molecular biology,3–5 drug discovery,6,7 and diagnostic advancements.8 Although various analytical tools, such as antibodies for immunostaining, are used to investigate the distribution of membrane molecules, they are often only applicable to those molecules on the plasma membrane accessible from extracellular regions.9,10 This is because most analytical molecules cannot penetrate the plasma membrane owing to its barrier function. While various methods have been developed to cross the plasma membrane,11 conventional methods rely on membrane permeabilization using chemical reagents to deliver the analytical molecules to the cell. However, this approach possibly damages the entire biomembrane, including the plasma and organelle membranes. Therefore, novel methods are urgently needed to examine intact intracellular biomembranes.Recently, a technique called “unroofing” has been developed to analyze membrane molecules by disrupting the top surface of the plasma membrane using ultrasound, thereby exposing the bottom cytoplasmic surface of the plasma membrane.12–16 However, random bubble rupture caused by ultrasound irradiation exerts pressure on the plasma membrane, possibly damaging it. To overcome these issues, we previously developed a microfluidics-based cell fracture method to expose the cytoplasmic surface of the plasma membrane.17 In our method, cells are anchored to the bottom of the microchannel using a cell-anchoring material composed of polyethylene glycol (PEG)-lipids.18 Subsequently, laminar flow inside the channel exerts horizontal stress on the cells, leaving only the bottom plasma membrane attached to the channel in a sheet-like form, with the cytoplasmic surface exposed. Importantly, this process only exerts mild horizontal stress on the bottom plasma membrane, without significantly damaging the remaining cell membrane. Unroofing methods, including ours, facilitate the direct examination of biomolecules on the bottom plasma membrane; however, to date, no studies have specifically investigated the biomolecules on organelle membranes.
In this study, we aimed to develop a microfluidic unroofing system to examine the organelle biomembranes. Recently, we developed a photoactivatable cell-anchoring surface by modifying a substrate with PEG-lipid 1, which transitioned from a dual-lipid to single-lipid moiety via photocleavage (Fig. 1a).19 Dual-lipid moieties aggregated on this surface owing to their high hydrophobicity before light exposure (Fig. 1b, left). Upon light-induced cleavage of one lipid, the resulting single-lipid moiety with low hydrophobicity interacted with the cell membrane, enabling cell anchoring (Fig. 1b). The cells were selectively anchored to the light-irradiated regions, facilitating the preparation of a single-cell array (Fig. 1c and d). Using this light-induced cell-anchoring surface, we precisely controlled the cell array interval and identified the optimal unroofing conditions for organelle preservation under which laminar flow stress was applied to the uppermost surface of the cells (Fig. 1e). Confocal laser scanning microscopy (CLSM) and scanning electron microscopy (SEM) revealed that several organelles remained in the unroofed cells (Fig. 1f). Additionally, translocase of outer mitochondrial membrane 20 (TOMM20), a membrane protein on the outer mitochondrial membrane, was successfully imaged upon unroofing, without cell permeabilization (Fig. 1g).
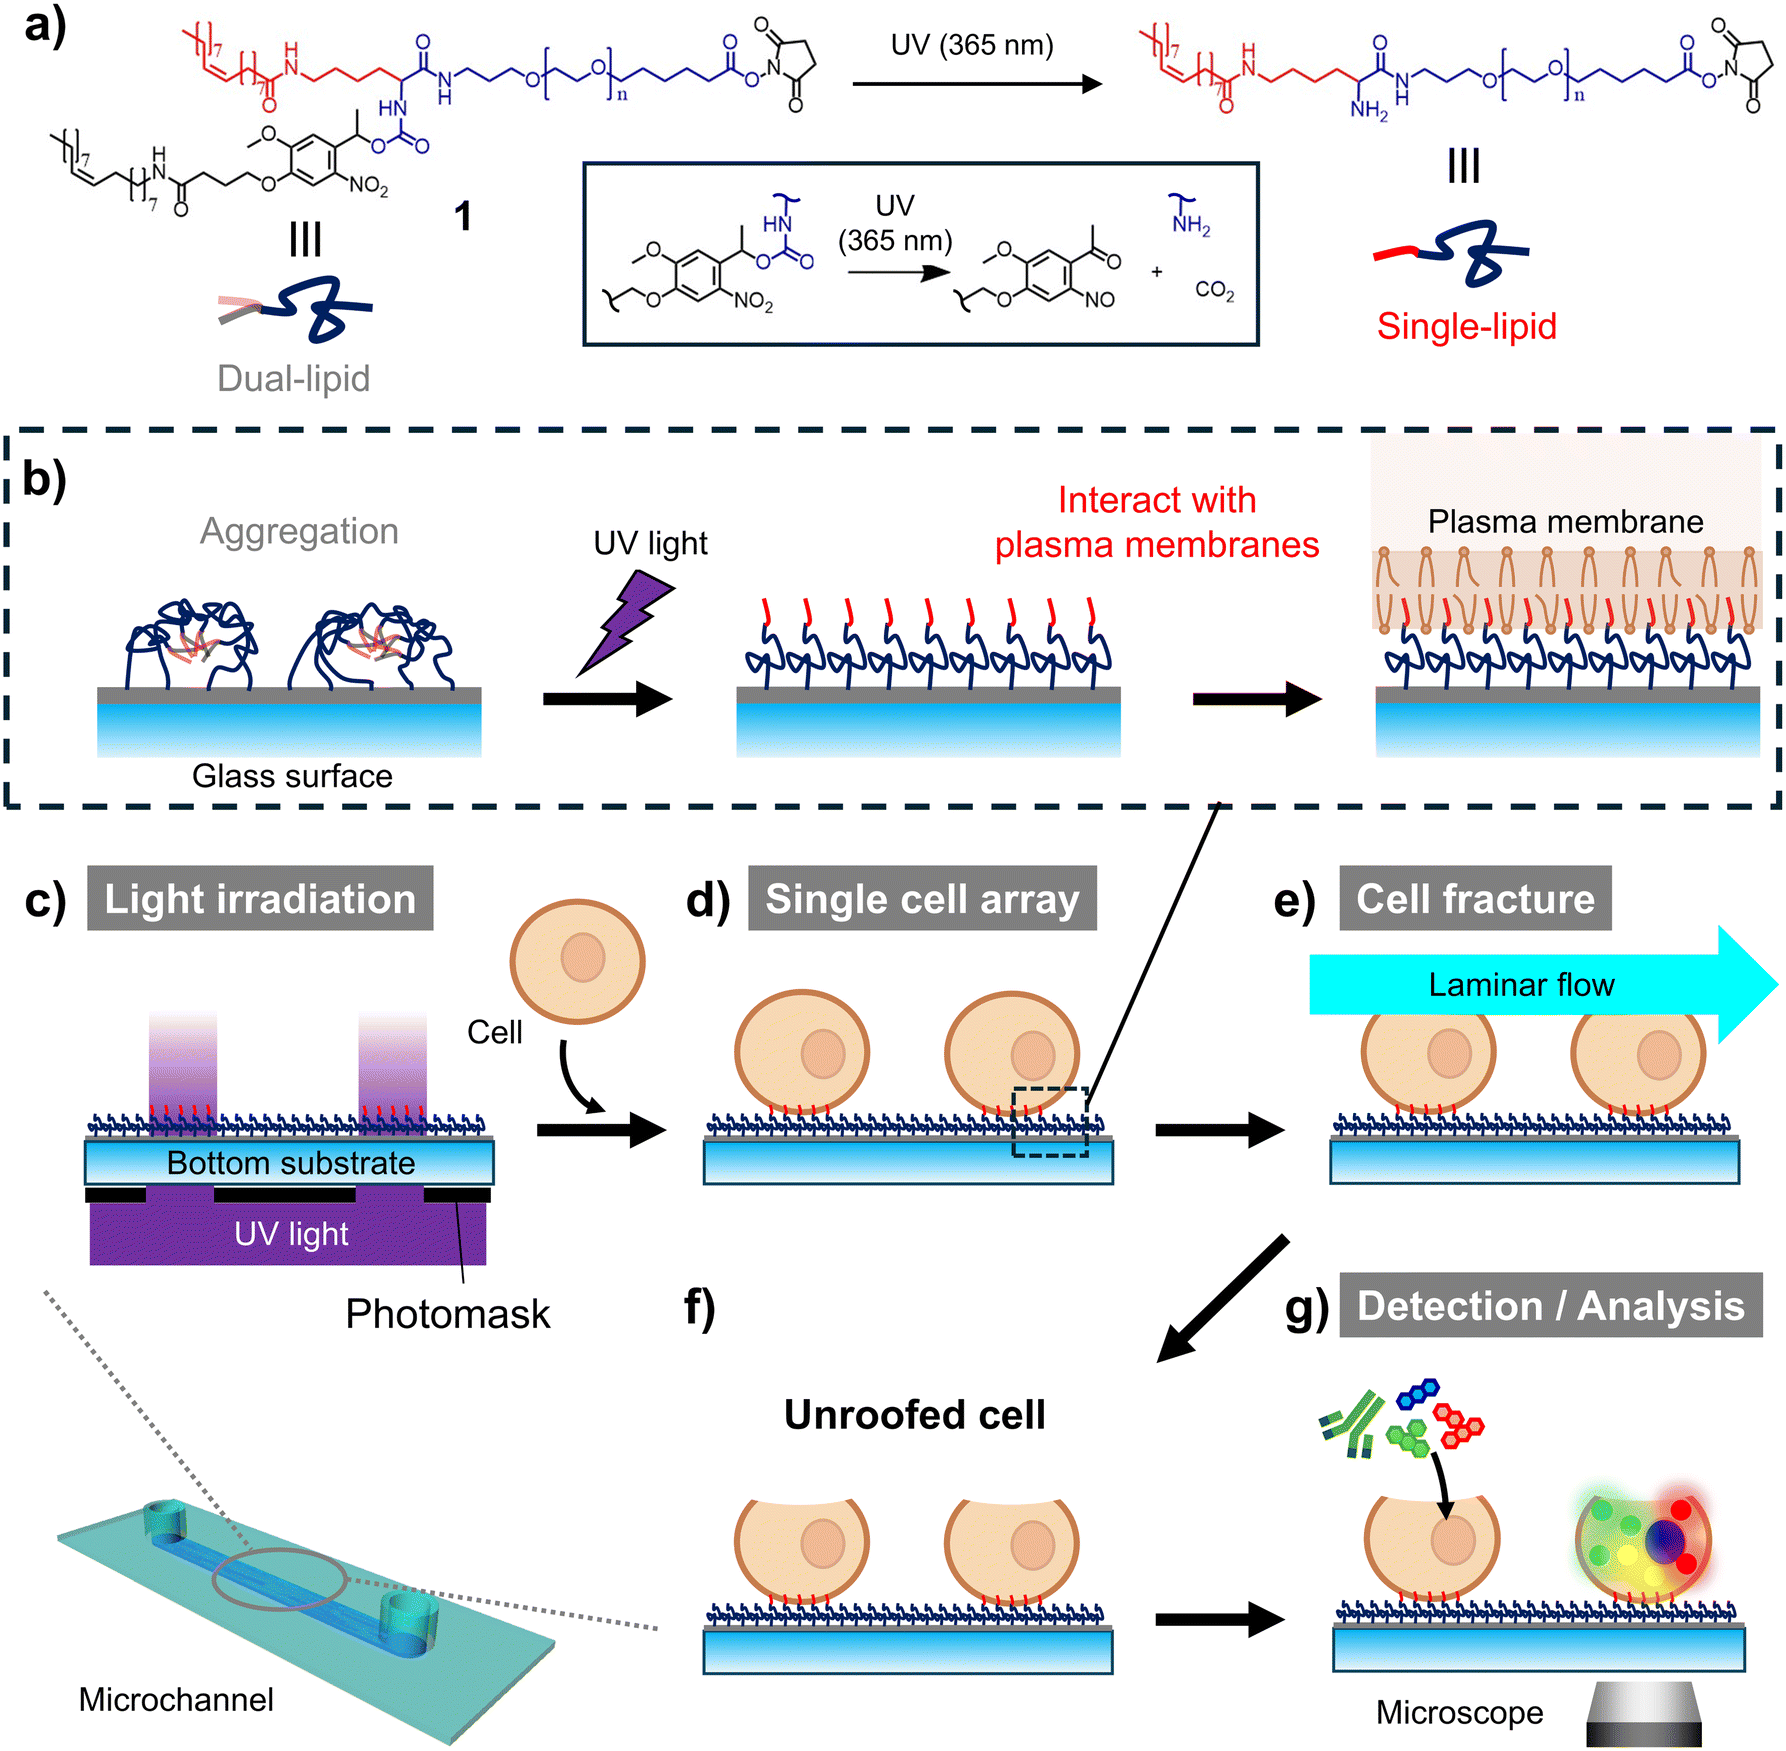 | ||
| Fig. 1 Schematic diagram of cell unroofing for the detection and analysis of organelle membrane proteins. (a) Chemical structures of photoactivatable polyethylene glycol (PEG)-lipid 1 before and after photoirradiation. (b) Schematic diagram of PEG-lipid 1-modified surface photoactivation and subsequent interaction with the plasma membrane. (c–g) Schematic diagram of the experimental process. (c) Photoirradiation of the photoactivatable PEG-lipid-modified surface. (d) Introduction of cells into the microchannel and immobilization in an array. (e) Application of horizontal stress on cells via laminar flow. (f) Partial fracture and unroofing of cells. (g) Application of molecular tools for the detection and analysis of organelle membrane proteins. | ||
Experimental
Materials
Slide glass and sticky Slide 0.1 Luer (ib10812 and ib81128) were purchased from ibidi GmbH (Gräfelfing, Germany). Collagen (Cellmatrix Type A) was from Nitta Gelatin Co. Ltd. (Osaka, Japan). MilliQ water was from Nihon Millipore Ltd. (Tokyo, Japan). Dulbecco's phosphate-buffered saline (PBS) was from Shimadzu Diagnostics (Tokyo, Japan). Dimethyl sulfoxide (DMSO), bovine serum albumin (BSA), RPMI-1640, penicillin–streptomycin, and paraformaldehyde (PFA) were from Fujifilm Wako Pure Chemical Corp. (Osaka, Japan). 25% glutaraldehyde in aqueous solution was from Electron Microscopy Sciences (Hatfield, PA). 4% aqueous osmium tetroxide (OsO4) in aqueous solution were from Nisshin EM Co. Ltd. (Tokyo, Japan). Fetal bovine albumin (FBS) was from Nichirei Bioscience (Tokyo, Japan). Recombinant mouse interleukin-3 (IL-3), 1,1′-dioctadecyl-3,3,3′,3′-tetramethylindocarbocyanine perchlorate (DiI) and anti-rabbit IgG (H+L) secondary antibody, Alexa Fluor 488 labeled were from Thermo Fisher Scientific K. K. (Tokyo, Japan). Calcein-AM, Hoechst 33342 and MT-1 (with MitoMP Detection kit) were from Dojindo Laboratory (Kumamoto, Japan). Anti-TOMM20 antibody was from Abcam Japan (Tokyo, Japan). Triton X-100 (TX-100) was from Sigma-Aldrich Japan (Tokyo, Japan). Photoactivatable PEG-lipid was synthesized same as described in previous report.19Microfluidic device and photoactivatable cell anchoring surface
Microfluidic devices and photoactivatable cell anchoring surfaces were prepared as reported in our previous work.19 Briefly, slide glasses were first washed with an alkaline solution and organic solvents and then incubated in a collagen solution (0.3 mg ml−1, pH 3) overnight at room temperature. After rinsing with MilliQ water and air drying, the collagen-coated glass was combined with a sticky-slide, establishing a microfluidic device that holds a microchannel with a width, length and height of 5 mm, 48.5 mm and 0.1 mm. The microfluidic device was securely fastened with a handmade clip to prevent solution leakage (Fig. S1†). Then, the collagen-coated bottom surface of the channel was modified with photoactivatable PEG-lipid 1 via the amine coupling reaction by the treatment of a phosphate-buffered saline (PBS) solution of 1 (100 μM compound 1, including 50% DMSO). After incubation for 3 h at 37 °C with light shielded, the microchannel was washed with PBS.Light-induced cell anchoring
Light-induced cell anchoring was performed as described in our previous work.19 IL-3-dependent mouse pre-B-cell line Ba/F3 was obtained from the JCRB Cell Bank (Osaka, Japan). Briefly, Ba/F3 cells were collected from the culture medium (RPMI-1640 medium supplemented with 10% FBS and 1 ng ml−1 IL-3) by centrifugation and washed with RPMI-1640 medium without any supplement (RPMI (FBS-)) by resuspension and centrifugation. Finally, cells were suspended in RPMI (FBS-) to prepare cell suspensions at the desired concentrations. In parallel, spots of ultraviolet (UV) light (wavelength: 365 ± 5 nm, light dose: 1.5 J cm−2) was irradiated using a UV irradiator (Rex-250, from Asahi Spectra, Japan) on the modified surface through a contacted photomask, on which an array of transmissive spots (various diameters: 8, 10, 14 μm, various grid sizes: from 25 μm × 25 μm to 200 μm × 200 μm) was printed. After washing the microchannel, a cell suspension (over 1 × 10⁷ cells per mL, in RPMI (FBS-)) was loaded into the microchannel. After incubation for 10 min at room temperature, non-anchored cells were removed by washing with RPMI (FBS-). Preparation of single cell arrays with intended various intervals was confirmed by observing with a fluorescence microscope (IX83, from Olympus Co., Tokyo, Japan) (Fig. S2†).Microfluidic unroofing
Microfluidic unroofing was performed as reported in our previous work.17 Briefly, the microchannel was connected to a syringe pump (YSP-301, from YMC Ltd., Kyoto, Japan) after preparation of single-cell arrays. PBS was injected into the flow path at velocities of 50 mL min−1, for 1 min, to induce cell fracture via laminar flow. The Reynolds number of this microchannel is less than 500, indicating a laminar regime even at the maximum flow rate of 50 mL min−1.17 Cells were fluorescently stained with DiI for biomembrane, calcein-AM for cytoplasm and Hoechst 33342 for nucleus according to the manufacturer's protocol. These multiple stained cells were observed before and after unroofing with a fluorescence microscope equipped with 4× objective lenses and with a confocal laser-scanning microscope equipped with 63× objective lenses (TCS SP8, from Leica Microsystems, Wetzlar, Germany). Image analysis was conducted using the open-source software Fiji, which is just ImageJ (NIH, Bethesda). The cell position was identified as 15 μm-diameter circles with TrackMate of Fiji plugin.20,21 The red fluorescence images of cell membrane were employed for the identification of cell position. The statistical analysis was performed by Tukey–Kramer test using GraphPad Prism version 10 (GraphPad Software Inc., Boston, MA).Fluorescence microscopy imaging of mitochondrial membrane potential
Cells were simultaneously stained with calcein-AM, Hoechst 33342 and MT-1. The protocol followed the manufacturer's manual, except for MT-1, where the concentration was reduced to one-tenth of the specified amount, and the treatment time was shortened to half of the recommended duration. As a control, the permeabilized sample was prepared by treating the anchored cells with fixation and permeabilization instead of unroofing. Fixation was conducted by loading 3% PFA in PBS into the microchannel for 15 minutes and washing with PBS. Permeabilization was conducted by loading 1% TX-100 in PBS into the microchannel for 15 minutes and washing with PBS. After each treatment, the solution in the microchannels were exchanged to the imaging buffer of MitoMP Detection Kit. Finally, cells were observed by confocal fluorescence microscopy as described above.Fluorescence microscopy imaging of mitochondrial membrane proteins
Cells were fluorescently stained with Hoechst 33342 as described above. After unroofing, TOMM20 on the mitochondria was immunostained using a primary anti-TOMM20 rabbit polyclonal antibody and a secondary anti-rabbit IgG (H+L) donkey polyclonal antibody AF488 conjugate. To block nonspecific binding, cells were pre-incubated with a 2% BSA solution in RPMI (FBS-), followed by successive treatments of the primary and secondary antibody solutions. Each antibody treatment lasted for 5 min. The doubly stained cells were then observed by confocal fluorescence microscopy as described above.Computational fluid dynamics simulation
The computational fluidic dynamics (CFD) simulation was performed using the Flowsquare software22 (Nora Scientific, Japan) to model the flow direction and rate during the cell fracture. The models comprised a rigid wall representing the top cover of the microchannel and the glass bottom, through which the laminar flow get through from left to right. The simulations were performed for simplification in two dimensions on a cross-section parallel to the flow direction, passing through the center of the arrayed cells. The cells were regarded as solid circles with a diameter of 15 μm, placed on the bottom glass. The model dimensions were set to a height of 100 μm to match the actual length and 200 μm along the axis of flow. The mesh size of the models in any direction was 0.39 μm, and they contained approximately 131![[thin space (1/6-em)]](https://www.rsc.org/images/entities/char_2009.gif) 000 active cells. The fluid density of the CFD experiment was set to 1000 kg m−3, and the velocity was calculated from the liquid volume pushed out by the syringe. The delta t factor and time step were set as 100 and 400 respectively.
000 active cells. The fluid density of the CFD experiment was set to 1000 kg m−3, and the velocity was calculated from the liquid volume pushed out by the syringe. The delta t factor and time step were set as 100 and 400 respectively.
SEM observation
Unroofed cells were prepared as described above, and after washing with PBS, they were chemically fixed with 2.5% glutaraldehyde in PBS at room temperature for 1 h. After washing again with PBS, the glass slides at the bottom of the microchannel were cut out using a glass cutter. The unroofed cells on the glass pieces were then fixed with 1% OsO4 in phosphate buffer (75 mM, pH 7.4) at room temperature for 1 h. After washing with the same buffer and distilled water, the samples were dehydrated stepwise in series of gradient alcohol solutions. Subsequently, they were dried with a critical point dryer (EM CPD 300, from Leica Microsystems, Wetzlar, Germany) and coated with OsO4 using an osmium coater (Neoc-Pro, from Meiwafosis Co., Ltd., Tokyo, Japan). Samples were subsequently observed with a scanning electron microscope (SU8220, from Hitachi Ltd, Tokyo, Japan).Results and discussion
Cell unroofing: effects of cell intervals
Recently, we developed a microfluidic cell unroofing method, in which anchored cells are rapidly fractured by the laminar flow in the microchannel.17 In the previous study, cells are randomly anchored at low densities on the bottom surface modified with PEG-lipid to prevent overlapping between them, thus facilitating the single-cell analysis of the cytoplasmic surface of unroofed cells in a low-throughput manner. To overcome the limitations of the established method, initially, this study simply aimed to facilitate high-throughput analysis of unroofed cells by arraying the cells at a high density using photoactivatable PEG-lipid 1. Microfluidic devices with microchannel width, length, and height of 5, 48.5, and 0.1 mm, respectively, were prepared as described in our previous study (Fig. S1†).17 The collagen-coated bottom surface of the microchannel was modified with PEG-lipid 1 following established protocols (see ESI†).19 As previously reported,1,7 Ba/F3 mouse pre-B-cell line was used as a model, and the cells were fluorescently stained to assess the remaining cellular components, with the cell membrane labeled with 1,1′-dihexadecyl-3,3,3′,3′-tetramethylindocarbocyanine perchlorate (DiI) and cytoplasm labeled with calcein-AM. The dual-stained cells were positioned in a single-cell array, where the cell interval was varied in steps of 200, 100, 50, and 25 μm by adjusting the interval of irradiated light spots on the photoactivatable cell-anchoring surface (Fig. S2†). Fluorescent and phase-contrast images of single-cell arrays were microscopically observed before and after the injection of phosphate-buffered saline (PBS) into the microchannel to induce cell fracture via laminar flow (Fig. 2a–d). Additionally, fluorescence intensity and phase-contrast brightness of the images were quantified via image analysis (Fig. 2e–g).20,21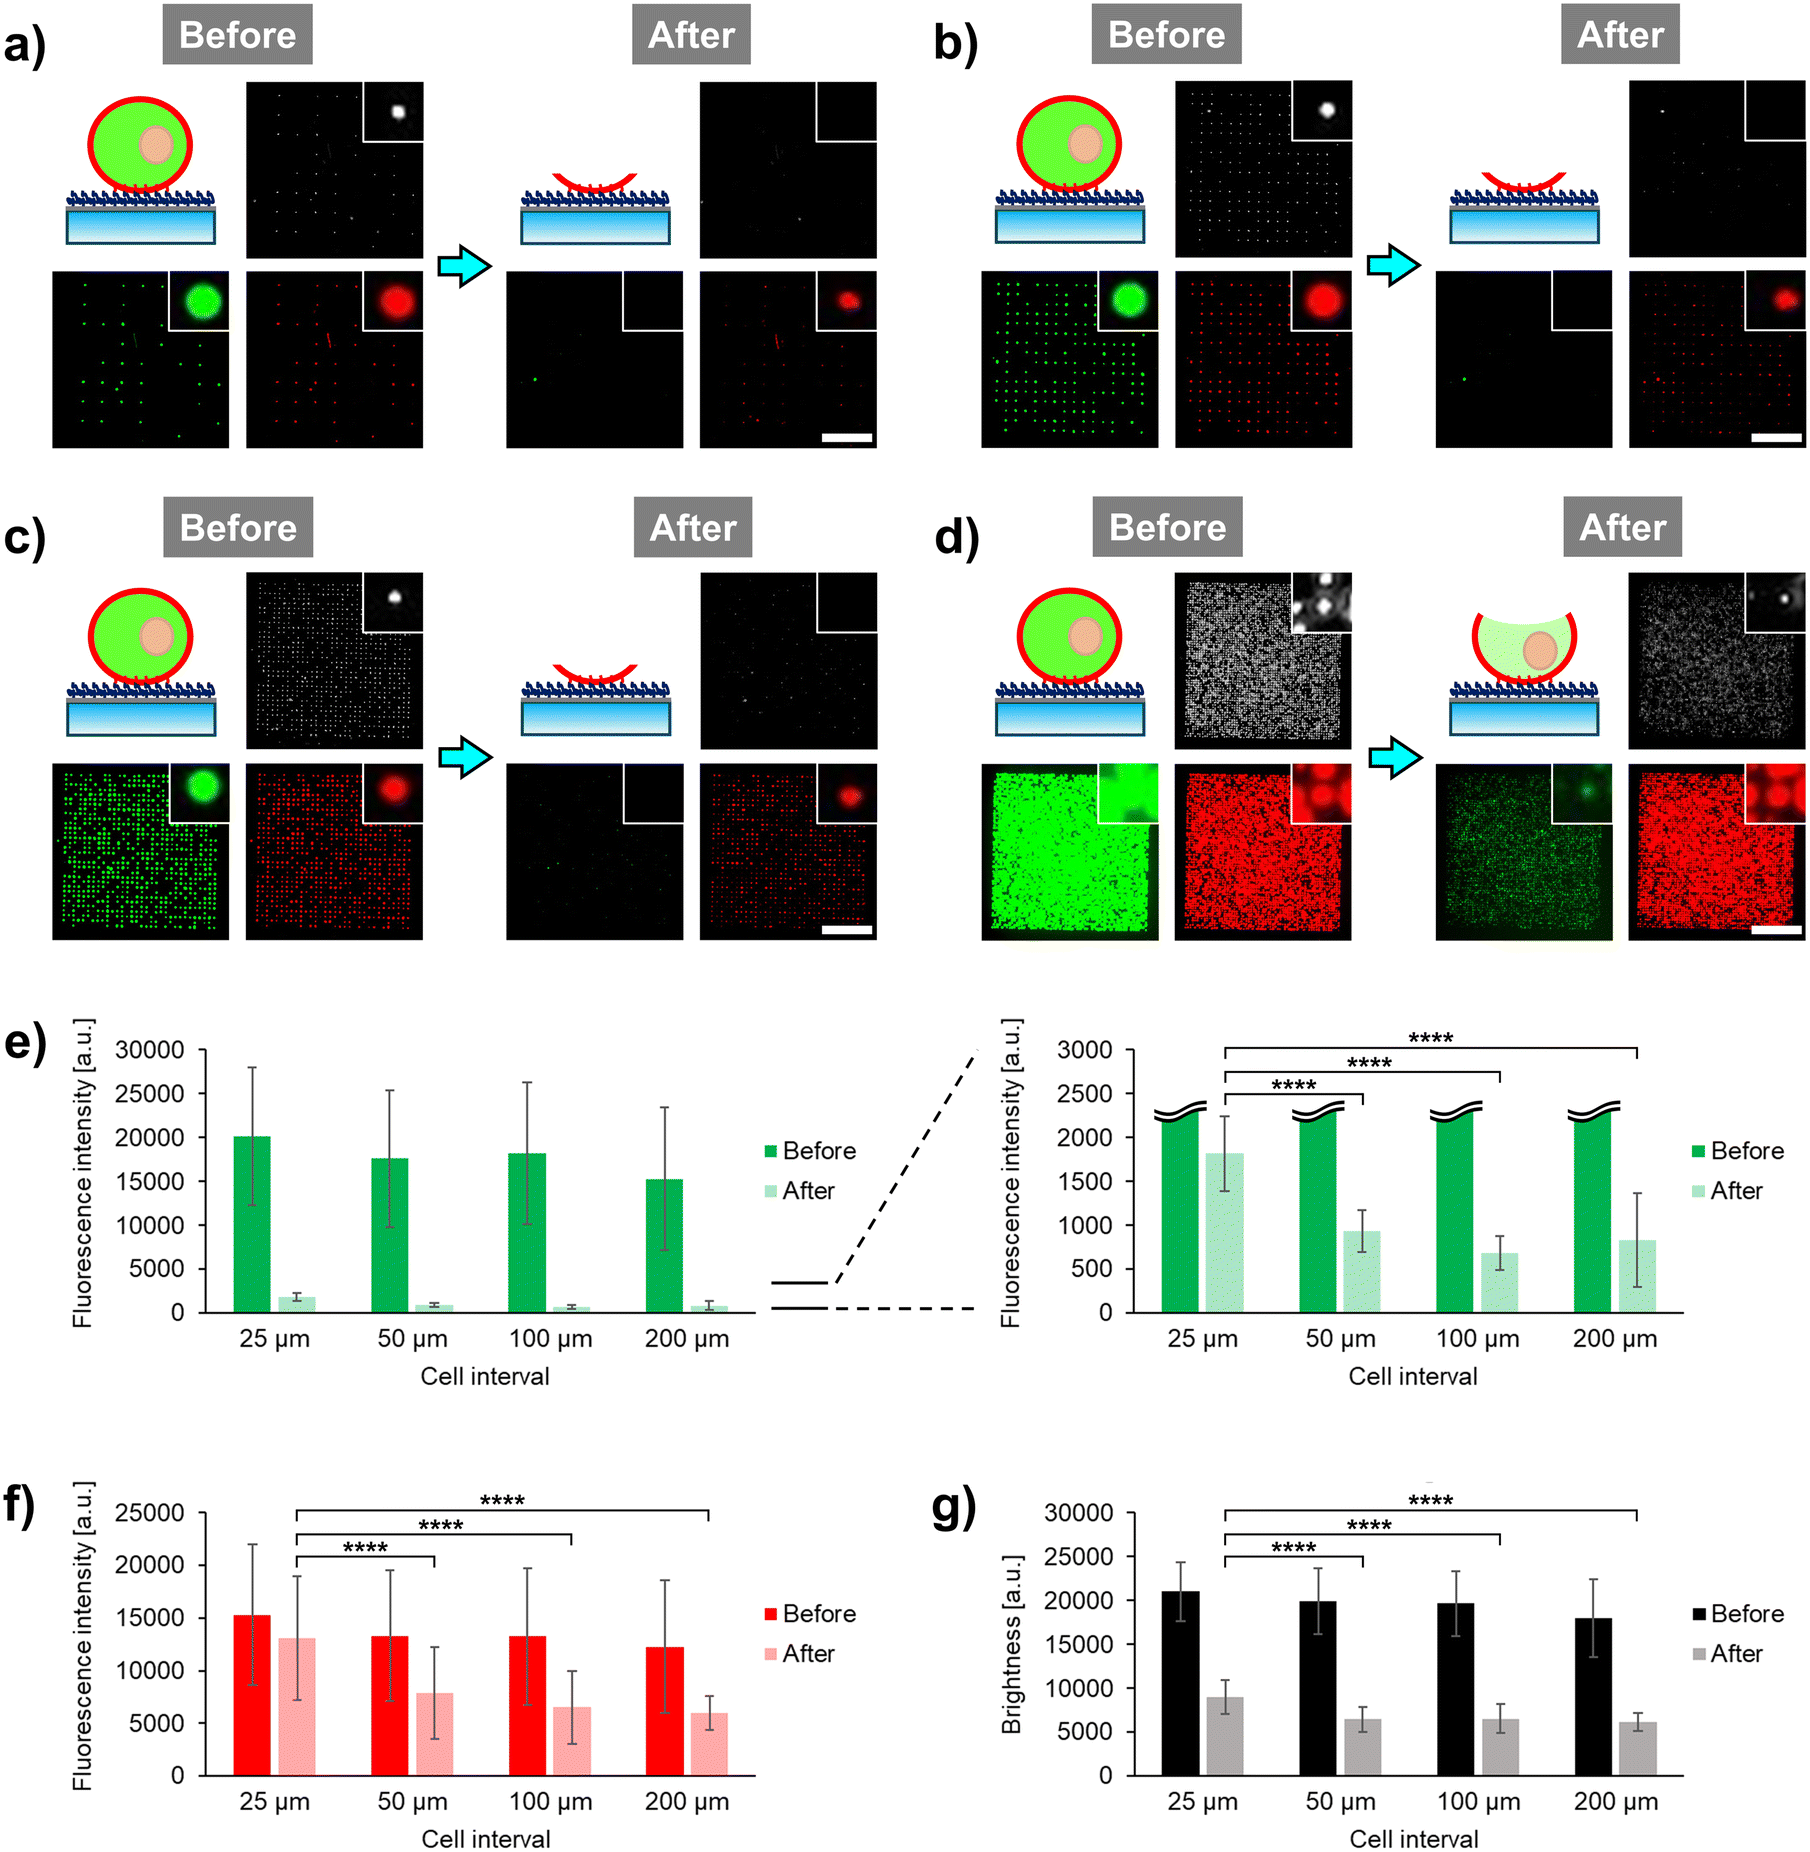 | ||
| Fig. 2 Cell interval dependency of unroofed cell array formation. (a–d) Illustration of anchored cells and observed microscopic images of phase-contrast, green fluorescence (cytoplasm stained with calcein) and red fluorescence (cell membrane stained with 1,1′-dihexadecyl-3,3,3′,3′-tetramethylindocarbocyanine perchlorate [DiI]) before and after cell fracture at (a) 200, (b) 100, (c) 50, and (d) 25 μm cell intervals. Diameter of photoirradiated spots is 14 μm. Scale bars, 500 μm. (e–g) Quantitative evaluation of (e) green fluorescence intensity, (f) red fluorescence intensity, and (g) brightness of phase-contrast images before and after cell fracture in each cell. Values are represented as the mean ± standard deviation (n ≥ 17). ****P ≤ 0.0001 (Tukey–Kramer test). | ||
Compared to the fluorescence observed before cell fracture, green fluorescence of calcein-AM disappeared and red fluorescence of DiI significantly decreased at 200 μm intervals after cell fracture (Fig. 2a). This suggests that nearly all cytoplasmic components and most biomembranes were removed by the laminar flow. In our previous study, where similar fluorescence alterations were observed after microfluidic cell fracture under the same conditions, CLSM and SEM confirmed that the cells had transformed into plasma membrane sheets.17 Therefore, the arrayed cells at 200 μm interval were considered to have been fully unroofed and transformed into plasma membrane sheets (Fig. 2a, illustration). No green fluorescence was observed at 100 and 50 μm intervals (Fig. 2b and c); however, marked green fluorescence was observed at 25 μm interval (Fig. 2d). Therefore, we further explored the green fluorescence at 25 μm interval. Image analysis quantitatively indicated that the difference in green fluorescence levels between the 25 μm and longer intervals was significant (Fig. 2e), with some green fluorescent dyes remaining in the cytoplasm even after cell fracture at the 25 μm interval. Free green fluorescent cytoplasmic dye rapidly diffused outside the cells through the fractured regions of the plasma membrane. Therefore, the remaining green fluorescent dye was possibly not free but rather confined within specific structures in the cytoplasm at the 25 μm interval.
Similarly, compared to the results before cell fracture, red fluorescence of DiI in the membranes was higher at 25 μm interval than that at longer intervals (Fig. 2a–d). Quantitative analysis showed that the red fluorescence intensity decreased by only about 10% at the 25 μm interval but by approximately 50% at longer intervals (Fig. 2f). Therefore, only some membrane components were lost through the cell fracture at the 25 μm interval, with a much smaller region of the cell membrane fractured at this interval compared to that fractured at longer intervals. This indicates that most biomembranes, including organelle membranes, remain intact in the plasma membrane. As the green fluorescent cytoplasmic dye persisted even after cell fracture, it possibly permeated into the organelles and remained there even after fracture. These results indicate the presence of some intact organelles in partially fractured cells at the 25 μm interval.
In the phase-contrast images after fracture, many bright spots were observed at the cell-anchored positions only at the 25 μm interval (Fig. 2a–d). Quantitative analysis of these bright spots showed that the brightness after fracture was significantly higher at the 25 μm interval compared to that at longer intervals (Fig. 2g). Bright spots in phase-contrast images are due to the phase shift of light caused by differences in the refractive index between the object and surrounding medium. Therefore, these spots are possibly derived from cell components composed of lipids and proteins, which have a higher refractive index than water.22 Based on fluorescence observations, these bright spots were considered to be organelles, with the remaining plasma membrane being large as the regions on the sides of the cells also remained intact. When cell fracture was performed at the 25 μm interval, microscopic images differed significantly from those taken at longer intervals, consistent with our previous report on the formation of plasma membrane sheets.17 This suggests that the cells undergo partial unroofing at sufficiently short intervals, allowing the organelles to remain intact and observable. Based on these novel findings, we focused on the development of a cell unroofing technique to examine the proteins on intact organelle membranes.
Fluidic and molecular dynamic simulations
Fluid simulation was performed to understand the mechanisms by which the single-cell array cell interval affects cell fracture. Computational fluid dynamics simulations were performed using commercially available software23 to model the flow direction and rate during cell fracture (see ESI†). We modeled the microchannels and cells in the lateral direction and simulated them in two dimensions (Fig. 3a). Cell fracture is primarily caused by shear stress, along with other stresses, which are dependent on the flow velocity. According to the experimental conditions (see ESI†), the pump flow rate was 50 mL min−1, resulting in a calculated mean velocity of 1.7 m s−1 for laminar flow in the microfluidic channel. Under these conditions, simulation analysis revealed relatively high flow velocity at the space between cells (>0.5 m s−1) at the 50 μm interval, which induced stress on the sides of cells (Fig. 3b). In contrast, flow velocity was low at the space between cells at the 25 μm interval, with the velocity being high only at the top of the cells (Fig. 3c). These results suggest that the stress is only applied on the upper surface of cells at the 25 μm interval.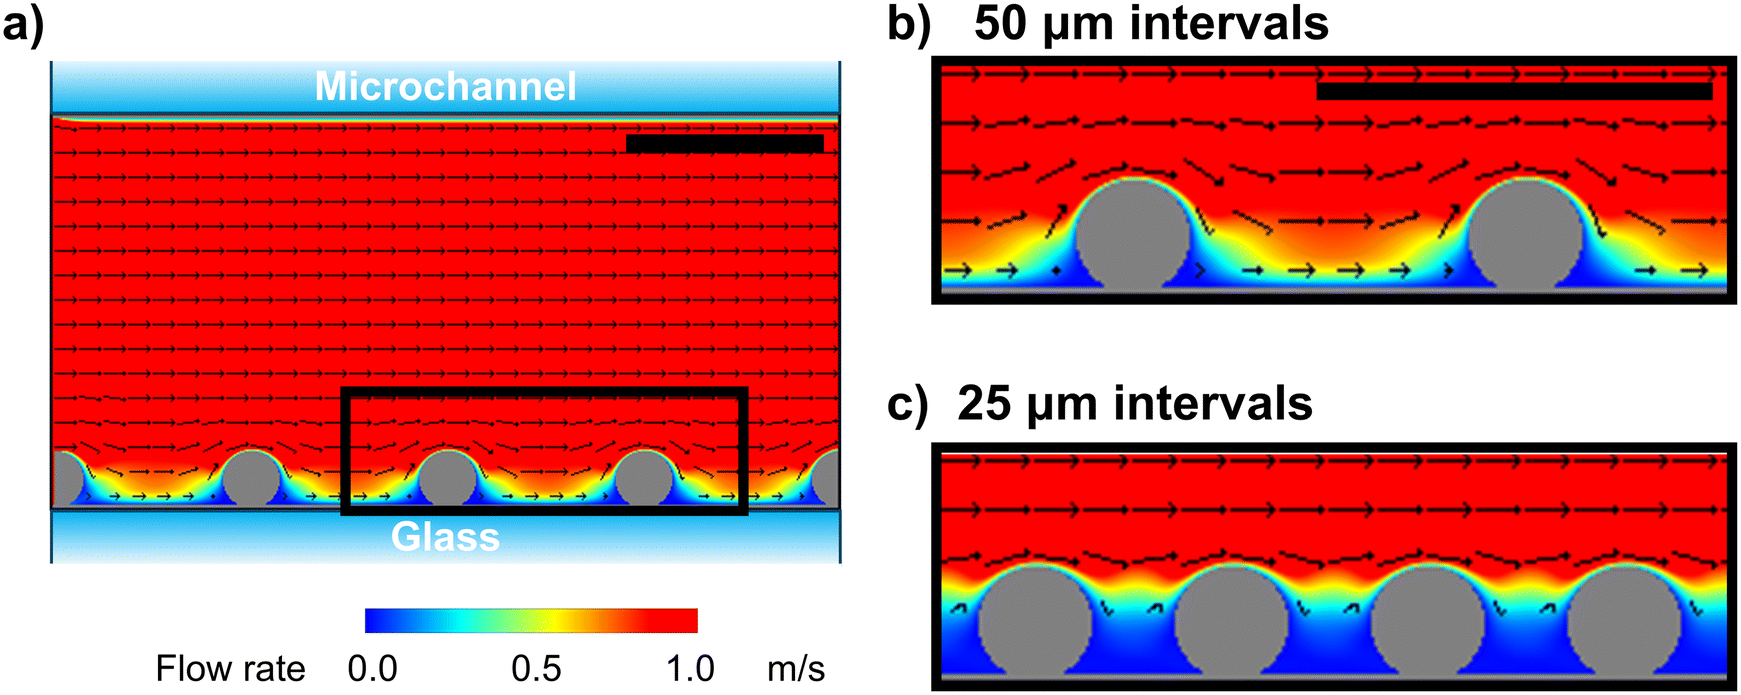 | ||
| Fig. 3 Physical simulation of the flow rate around arrayed cells. (a) Whole image of the microchannel from the side view with size and flow rate conforming to the real scale. (b and c) Enlarged view of the black square region in (a) under the following conditions: (b) flow rate = 1.7 m s−1 and cell interval = 50 μm and (c) flow rate = 1.7 m s−1 and cell interval = 25 μm. Model cells are set as immovable solid spheres. Flow direction is left to right. Scale bars, 50 μm. | ||
In a previous study on the instability of phospholipid bilayers under shear stress, molecular dynamics simulation showed that the lipid membrane consisting of dipalmitoyl phosphatidylcholine was disrupted at a velocity difference of approximately 14 m s−1 between the inside and outside of the lipid membrane in a 75.6 × 25.2 nm xz space.24 Since the estimated flow rate was inversely proportional to the 3/2 power of the simulation size, the lipid membrane was disrupted at a velocity of approximately 0.3 m s−1 at the micrometer single-cell scale. Based on this value, our simulation indicated that membrane ruptured at the long 50 μm interval on the lower side of cells near the bottom surface of the channel (Fig. 3b). Furthermore, only limited top surface area of the cells was fractured at the short 25 μm interval (Fig. 3c). Considering that the cell membrane is more rigid than the model liposome membrane owing to the presence of the cytoskeleton and membrane components, such as cholesterol, high flow velocity is necessary to puncture the cell membrane by laminar flow. Notably, simulation results were roughly consistent with the experimental observations, where the cells anchored at the 25 μm interval were partially unroofed, exposing the intracellular components (Fig. 2). Overall, fluid simulation revealed that the cell surface area exposed to the high flow velocity can be controlled by simply varying the cell interval, thereby facilitating the partial unroofing of cells.
Microscopy of unroofed cells
To confirm that the organelles remained intact in the unroofed cells, we observed the cell array after cell fracture via CLSM. Cytoplasm and biomembranes were fluorescently labeled green and red, respectively. Additionally, nucleus was labeled with Hoechst 33342 (blue) for visualization. These multi-labeled cells were arrayed at the 25 μm interval and fractured under the same conditions described above. Fluorescence images revealed two types of cells after fracture: cells with uniformly distributed cytoplasmic dye (white arrowheads, Fig. 4a) and those in which the fluorescent area of the cytoplasm was reduced to dot-like regions (yellow arrowheads, Fig. 4a). In the latter, fluorescence was retained in the nucleus and cell membrane. These cells appeared oval in the flow direction, with fuzzy outlines in the differential interference contrast images. In the XZ cross-sectional images, these cells appeared relatively flattened, with significantly reduced fluorescence intensity in the apical plasma membrane (Fig. 4b) compared to that in intact cells (white arrowheads, Fig. 4c). Therefore, free cytoplasmic components possibly flowed away due to the partial removal of the apical plasma membrane, leaving only the intact nucleus and other green-labeled organelles in the cells. Moreover, loss of the apical plasma membrane possibly reduced the membrane tension from above, causing the relaxed membrane oval shape. Overall, CLSM confirmed that the established method facilitated the partial unroofing of cells, with leaving the organelles.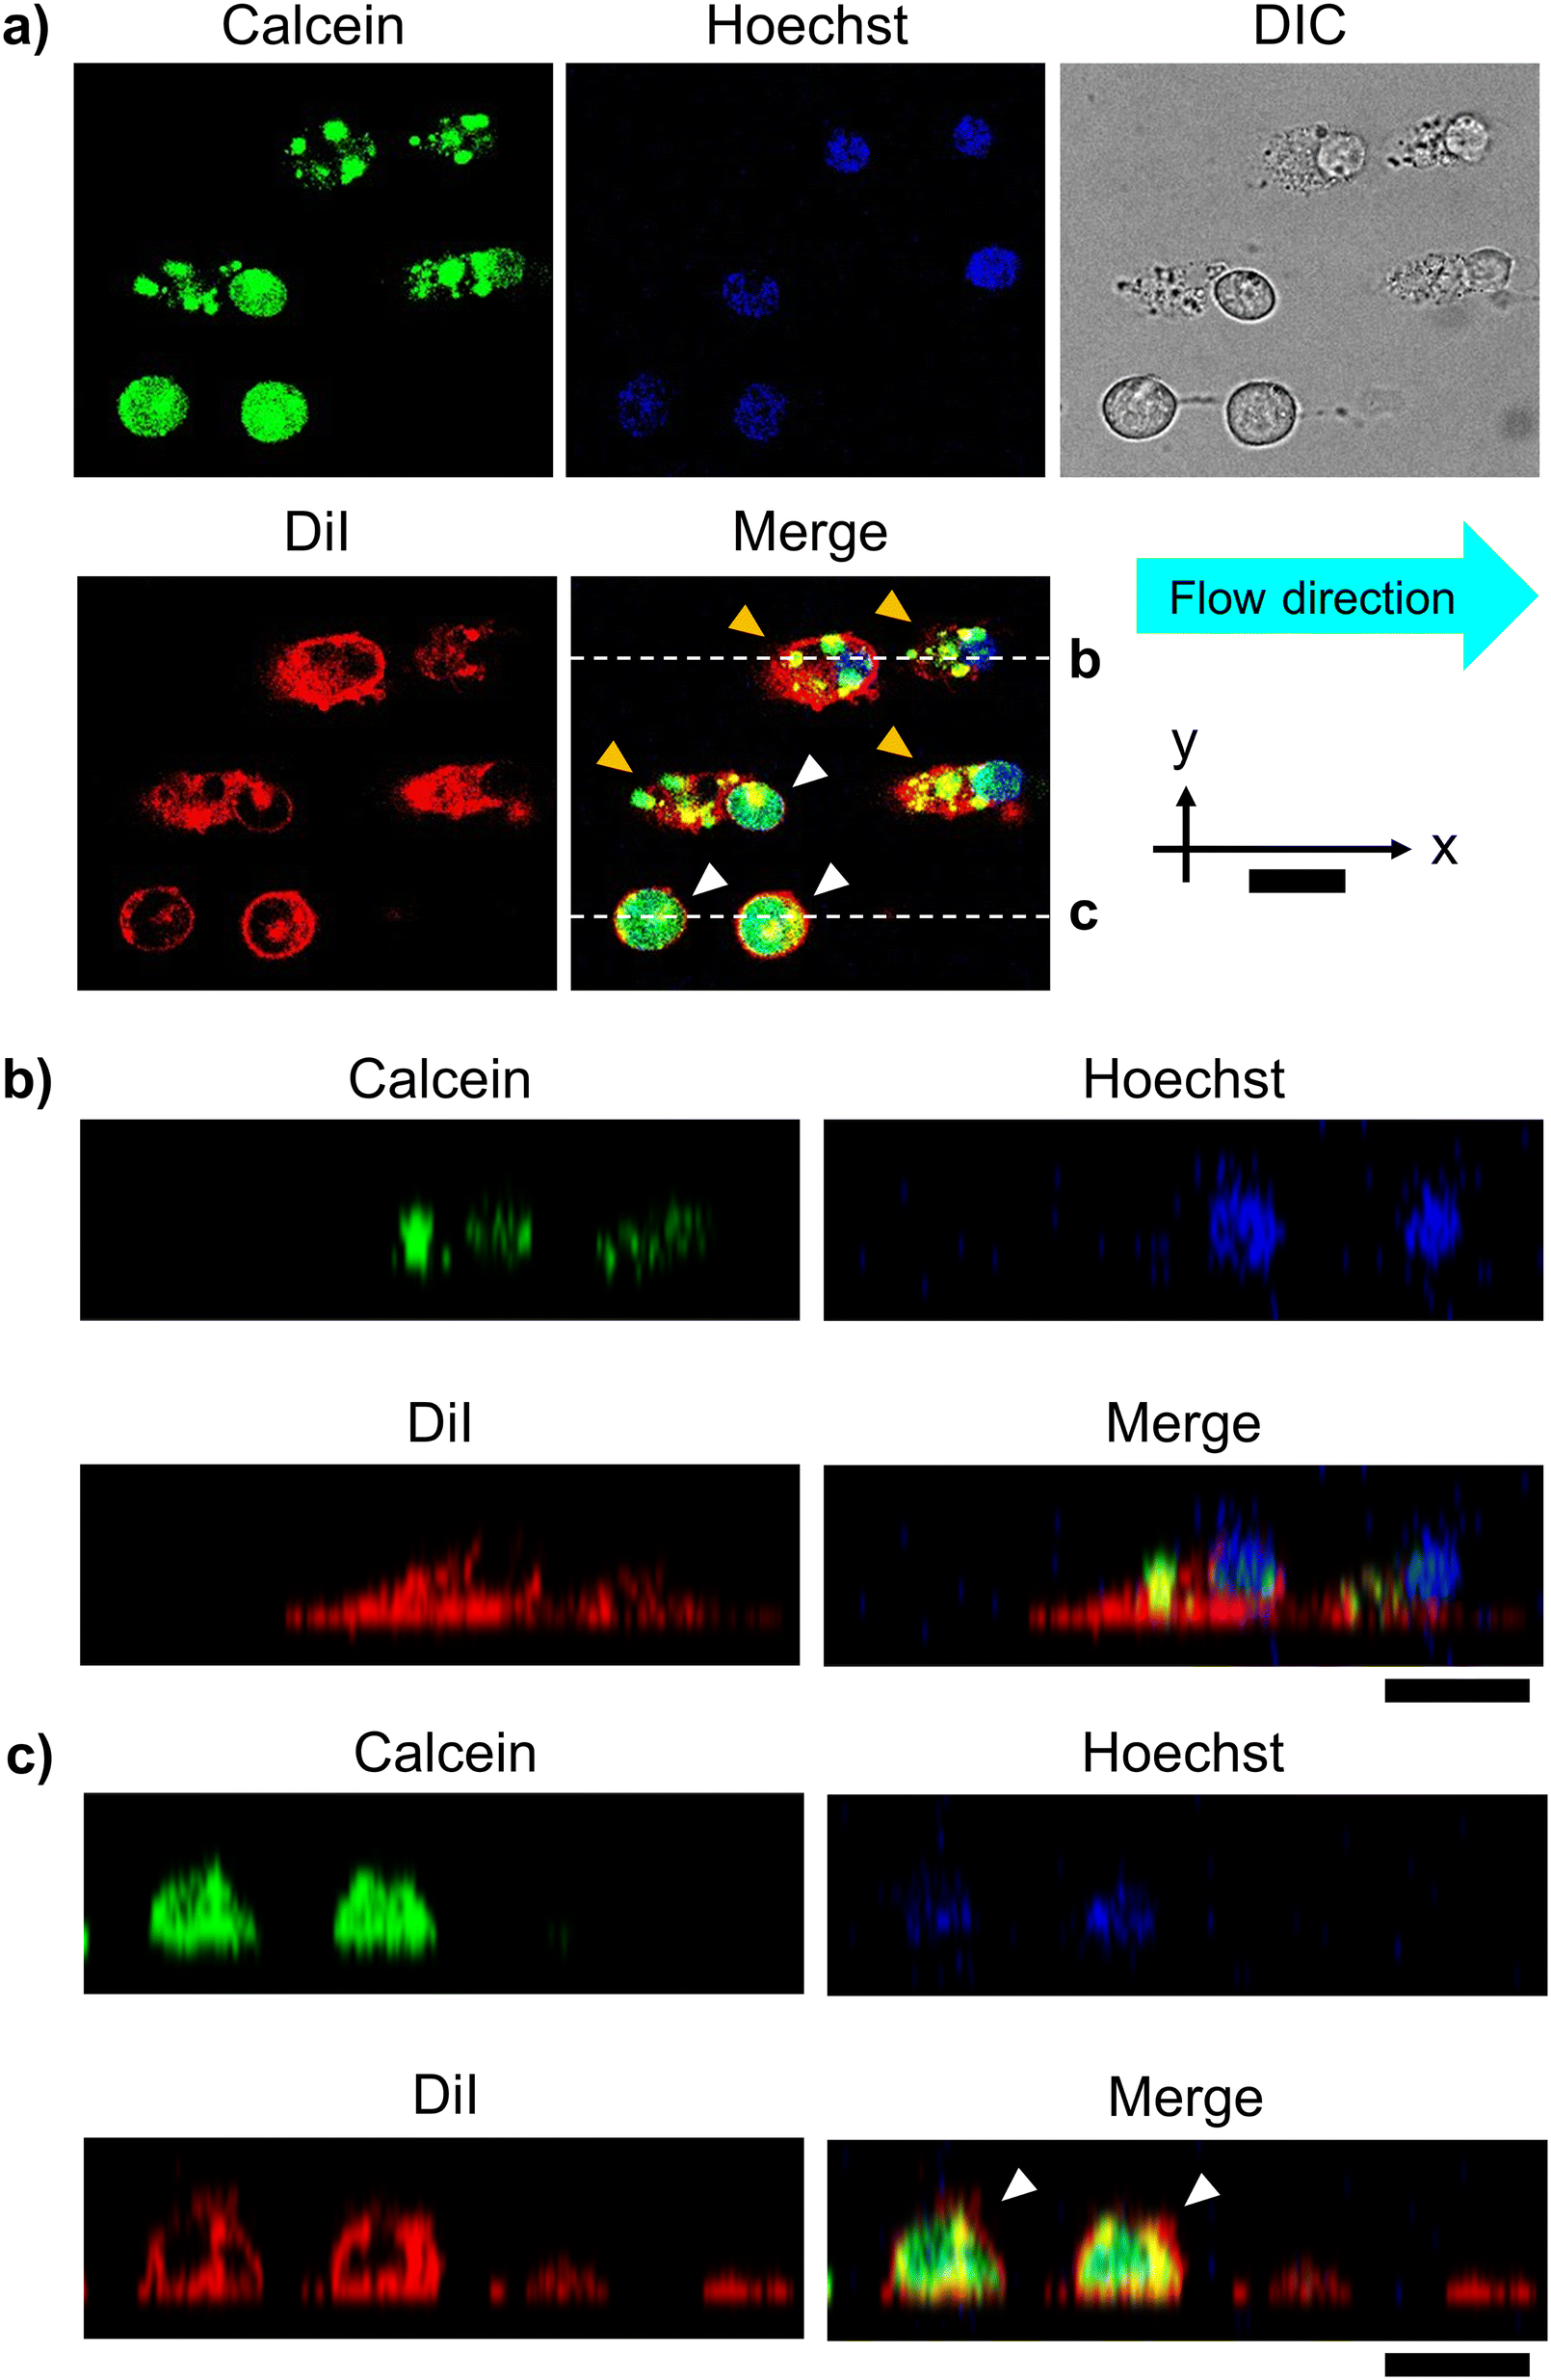 | ||
| Fig. 4 Confocal microscopic images of the unroofed cells after microfluidic cell fracture. (a) Fluorescence and differential interference contrast (DIC) images in the XY cross-section. Non-fractured (intact) and partially fractured (unroofed) cells are indicated by white and yellow arrowheads, respectively. Cells were stained with calcein-AM (green), DiI (red), and Hoechst 33342 (blue) for the cytoplasm, cell membrane, and nucleus, respectively. Cells were fractured by laminar flow of 1.7 m s−1 from left to right. (b and c) XZ side-view images of the (b) unroofed and (c) intact cells (white arrowheads) and fully fractured cells (only bottom membranes). Scale bars, 20 μm. | ||
Next, unroofed cells were observed via SEM. Unroofed cell images are shown in Fig. 5a, differing significantly from those of intact cells (Fig. S3†), with the nucleus remaining intact on the cell membrane sheets (Fig. 5a). In the SEM image, unlike the illustrations in Fig. 1g and 2d, it is assumed that the plasma membranes on the sides of the cells did not remain intact. This is likely because they collapsed from the openings of the fractured cells during the preparation of the SEM sample, such as dehydration and critical point drying, unlike the whole intact cells and nucleus, where the membranes remained closed without openings. As a result, the components of the side portions of the plasma membranes are assumed to have diffused and disappeared, while only the bottom part of the plasma membranes, along with the nucleus and some organelles, were observed in the SEM image due to attachment onto the substrate. Moreover, high magnification observation of the nuclear surface revealed the presence of mitochondria with a morphology consistent with that reported in a previous study25 (white arrowheads, Fig. 5b). Further magnified observation of the nucleus and plasma membrane revealed that the nucleus was anchored to the plasma membrane primarily by filaments, presumably composed of actin (white arrowheads, Fig. 5c). Overall, SEM confirmed that the established method facilitated the observation of organelles, including the interactions among different organelles.
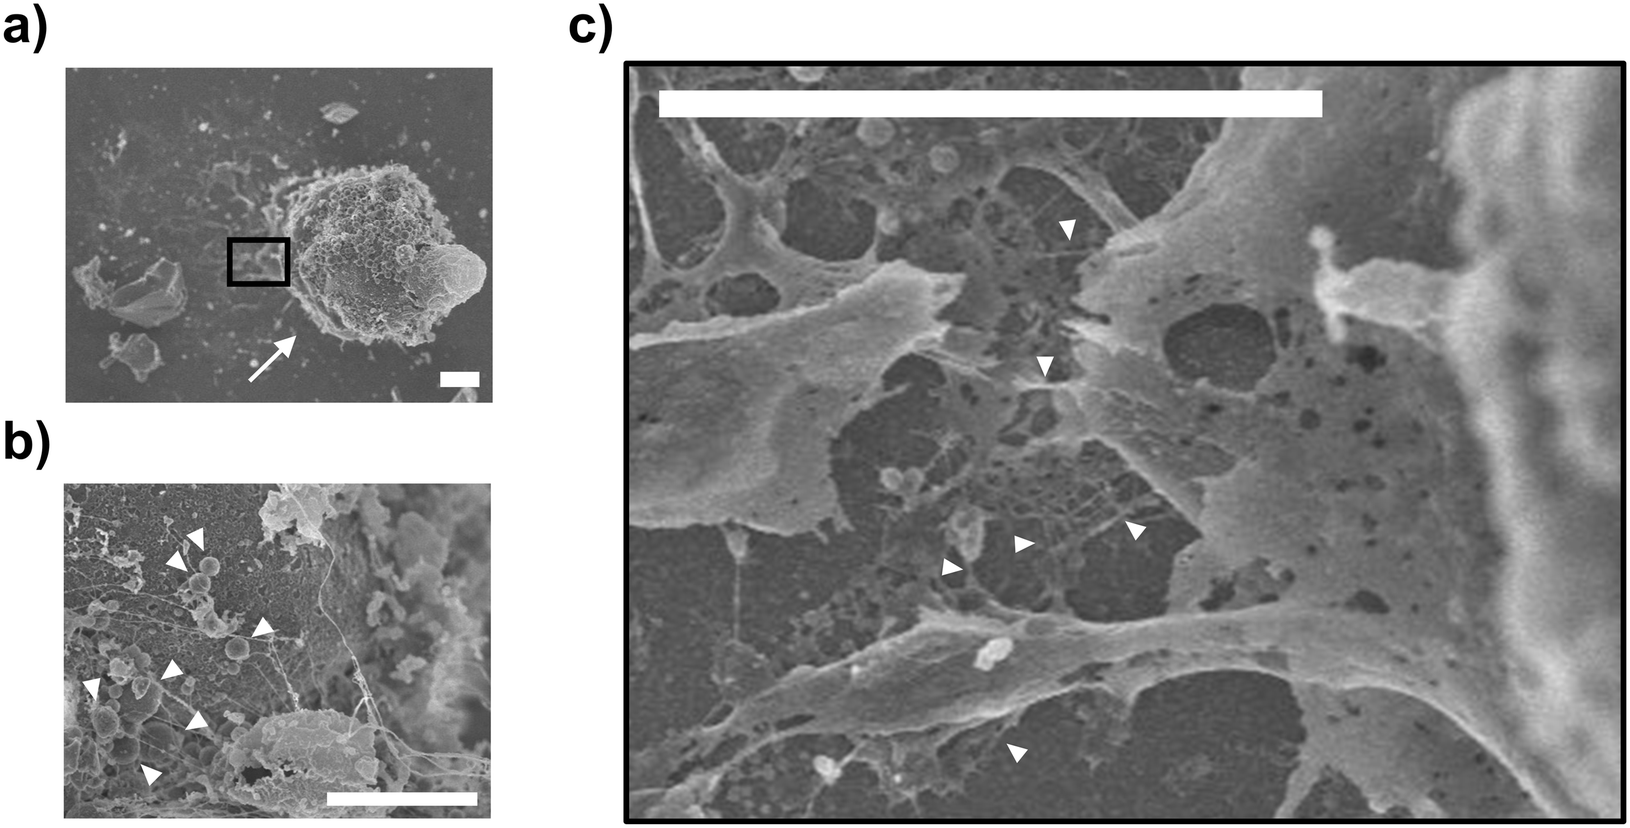 | ||
| Fig. 5 Scanning electron microscopy (SEM) images of the unroofed cells. (a) Enlarged image of the nucleus (white arrow) on the plasma membrane of unroofed cells. (b) Further enlarged image of mitochondria (white arrowheads) on the nucleus in (a). (c) Further enlarged image of filaments, possibly composed of actin (white arrowheads), between the nucleus and plasma membrane in the black square in (a). Scale bars, 3 μm. | ||
Imaging of the mitochondrial membrane protein
We fluorescently stained mitochondria using the commercially available MT-1 to confirm their retention after cell unroofing at the 25 μm interval. MT-1 is a mitochondria-specific fluorescent dye that accumulates in the mitochondria based on its membrane potential, facilitating mitochondrial activity tracking.26,27 In intact cells, which were arrayed in the microchannel without microfluidic fracture, the nucleus, cytoplasm, and mitochondria were fluorescently stained with Hoechst 33342, calcein-AM, and MT-1, respectively, in both XY (Fig. 6a) and XZ (Fig. 6b) confocal microscopic cross-sections. Under the same conditions, unroofed cells exhibited calcein-AM fluorescence in a dot-like pattern (Fig. 4), with MT-1 fluorescence being partially co-localized with calcein fluorescence (yellow arrowheads, Fig. 6). Moreover, no MT-1 fluorescence was observed in the control cells not stained with MT-1 (Fig. 6). These results clearly indicated the presence of mitochondria in the unroofed cells. Notably, MT-1 fluorescence was detectable even after unroofing, strongly suggesting that the mitochondria retained their membrane potential. In contrast, MT-1 fluorescence was completely absent in the cells treated with conventional permeabilization methods instead of unroofing (Fig. 6). Therefore, our unroofing method caused significantly less damage to the mitochondria than permeabilization. Furthermore, other cytosolic components exhibiting only calcein fluorescence in the unroofed cells (green arrowheads, Fig. 6). These components were possibly calcein-stainable organelles other than mitochondria. Collectively, these results confirmed the presence of intact organelles, including mitochondria, in the cells unroofed using the established method, without any significant damage.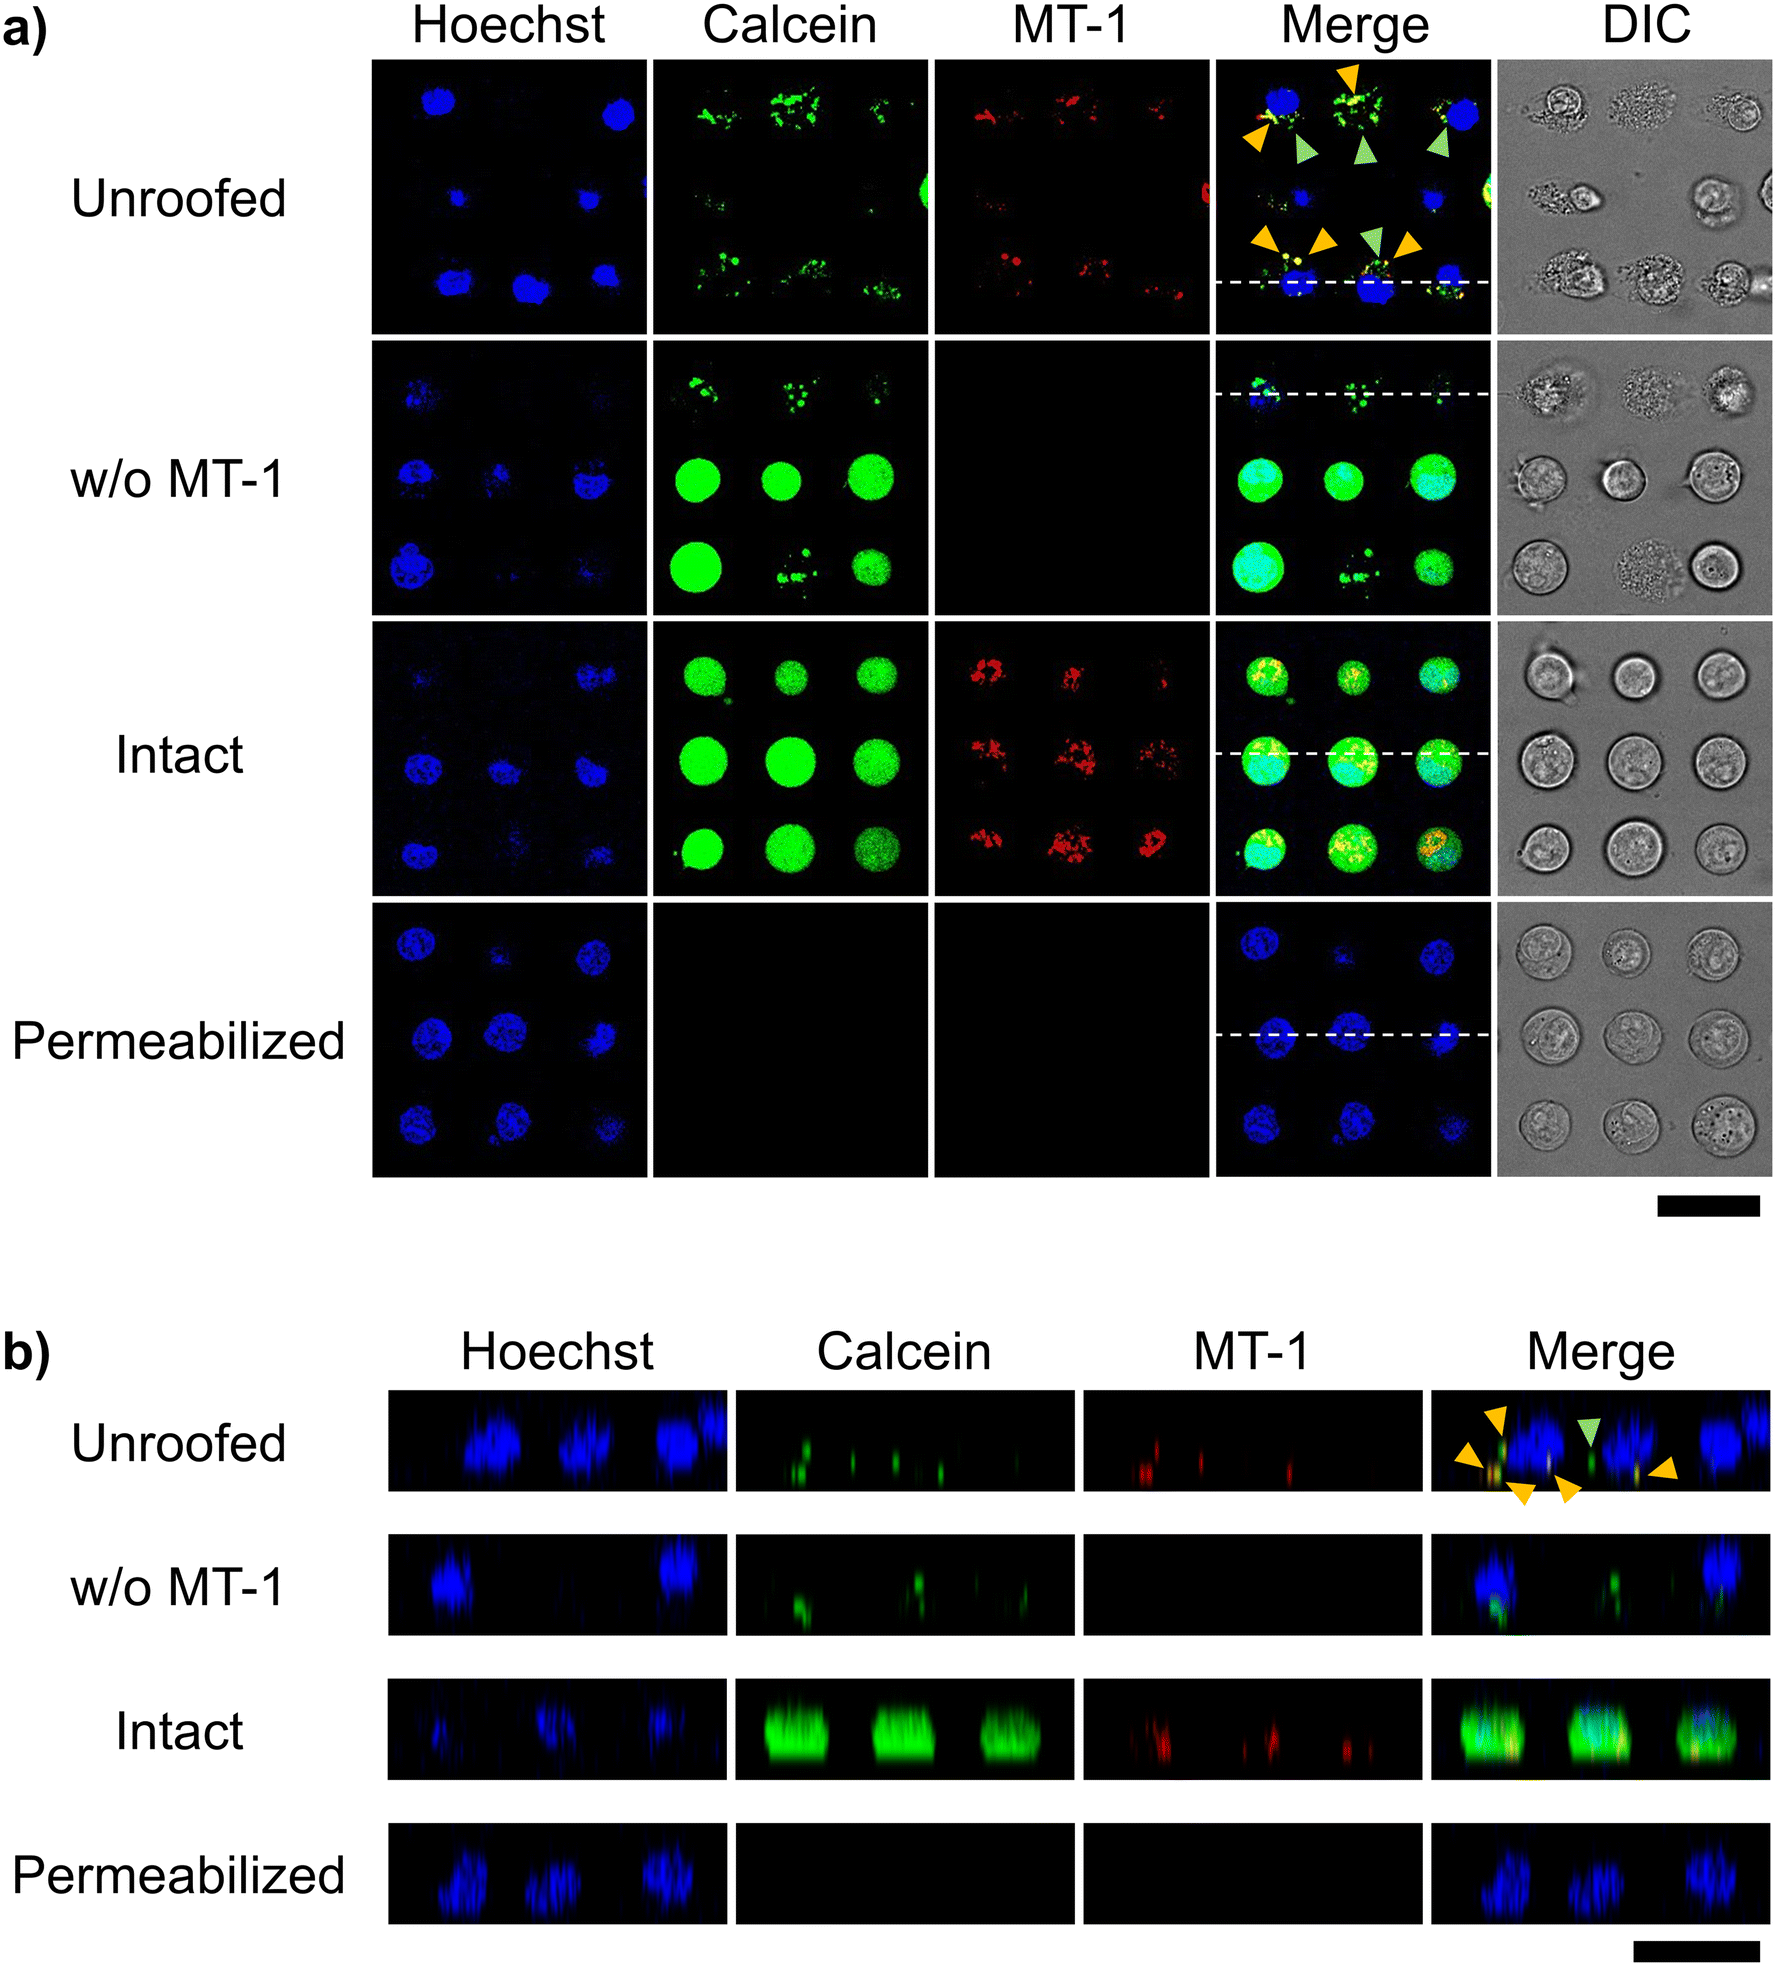 | ||
| Fig. 6 Confocal microscopic images of mitochondria-staining cells. Cells were stained with Hoechst 33342 (blue), calcein-AM (green), and MT-1 (red) for the nucleus, cytoplasm, and mitochondria, respectively. (a) XY and (b) XZ cross-section images were obtained after the following treatments: staining and partial fracture (unroofed), staining without MT-1 and partial fracture (w/o MT-1), only staining (intact), and staining and permeabilization (permeabilized). In the merged image of the unroofed cells, organelles stained yellow with calcein-AM and MT-1 and those stained green with calcein-AM are indicated by yellow and green arrowheads, respectively. White dotted line in each merge image of (a) corresponds to the position of XZ cross-section in (b). Scale bars, 30 μm. | ||
Next, we examined whether membrane proteins on organelle membranes can be observed via immunostaining with antibodies, without any permeabilization. Mitochondrial membrane protein TOMM20 was selected as the target protein. TOMM20 plays critical roles in many mitochondrial functions, including energy production, metabolism, and apoptosis regulation, as it facilitates the import of proteins from the cytoplasm into the mitochondria. It is ubiquitously distributed across the entire outer mitochondrial membrane.28 In this study, unroofed, intact, and permeabilized cells were immunostained with the anti-TOMM20 antibody under the above-mentioned conditions and observed via confocal microscopy. Only the unroofed cells were labeled with the anti-TOMM20 antibody in green (Fig. 7). However, the non-unroofed cells, identified by their clear edges and round shape in the differential interference contrast images, exhibited no antibody-derived fluorescence in the same microscopic frame (white arrowhead, Fig. 7a). Similarly, no antibody-derived fluorescence was detected in images of intact cells (Fig. 7). Furthermore, green fluorescence was distributed in a network pattern in unroofed cells, consistent with previous reports on TOMM20 immunostaining of leukocytes.28 These results suggest that partial unroofing allowed the antibodies to access TOMM20 in the mitochondria. In contrast, no antibody-derived fluorescence was observed in the images of the permeabilized control cells. In this study, staining with both primary and secondary antibodies was performed only for 5 min each, which is much shorter than that indicated in a typical protocol (at least 30 min each). This suggests that only a small amount of the antibody entered the cells through the permeabilized plasma membrane. Subsequently, brightness and contrast of the images in Fig. 7 were adjusted to obtain enhanced antibody-derived fluorescence images, which revealed fluorescence in the permeabilized cells, but not in the intact cells even after the same adjustment (Fig. S4†). This indicates that the unroofing method facilitated stronger immunostaining in a shorter period by removing a part of the plasma membrane compared to the conventional permeabilization method. Therefore, microfluidic cell fracture on an interval-controlled single-cell array enables rapid and highly sensitive immunostaining of organelle membranes under mild conditions, with minimal damage to the organelles.
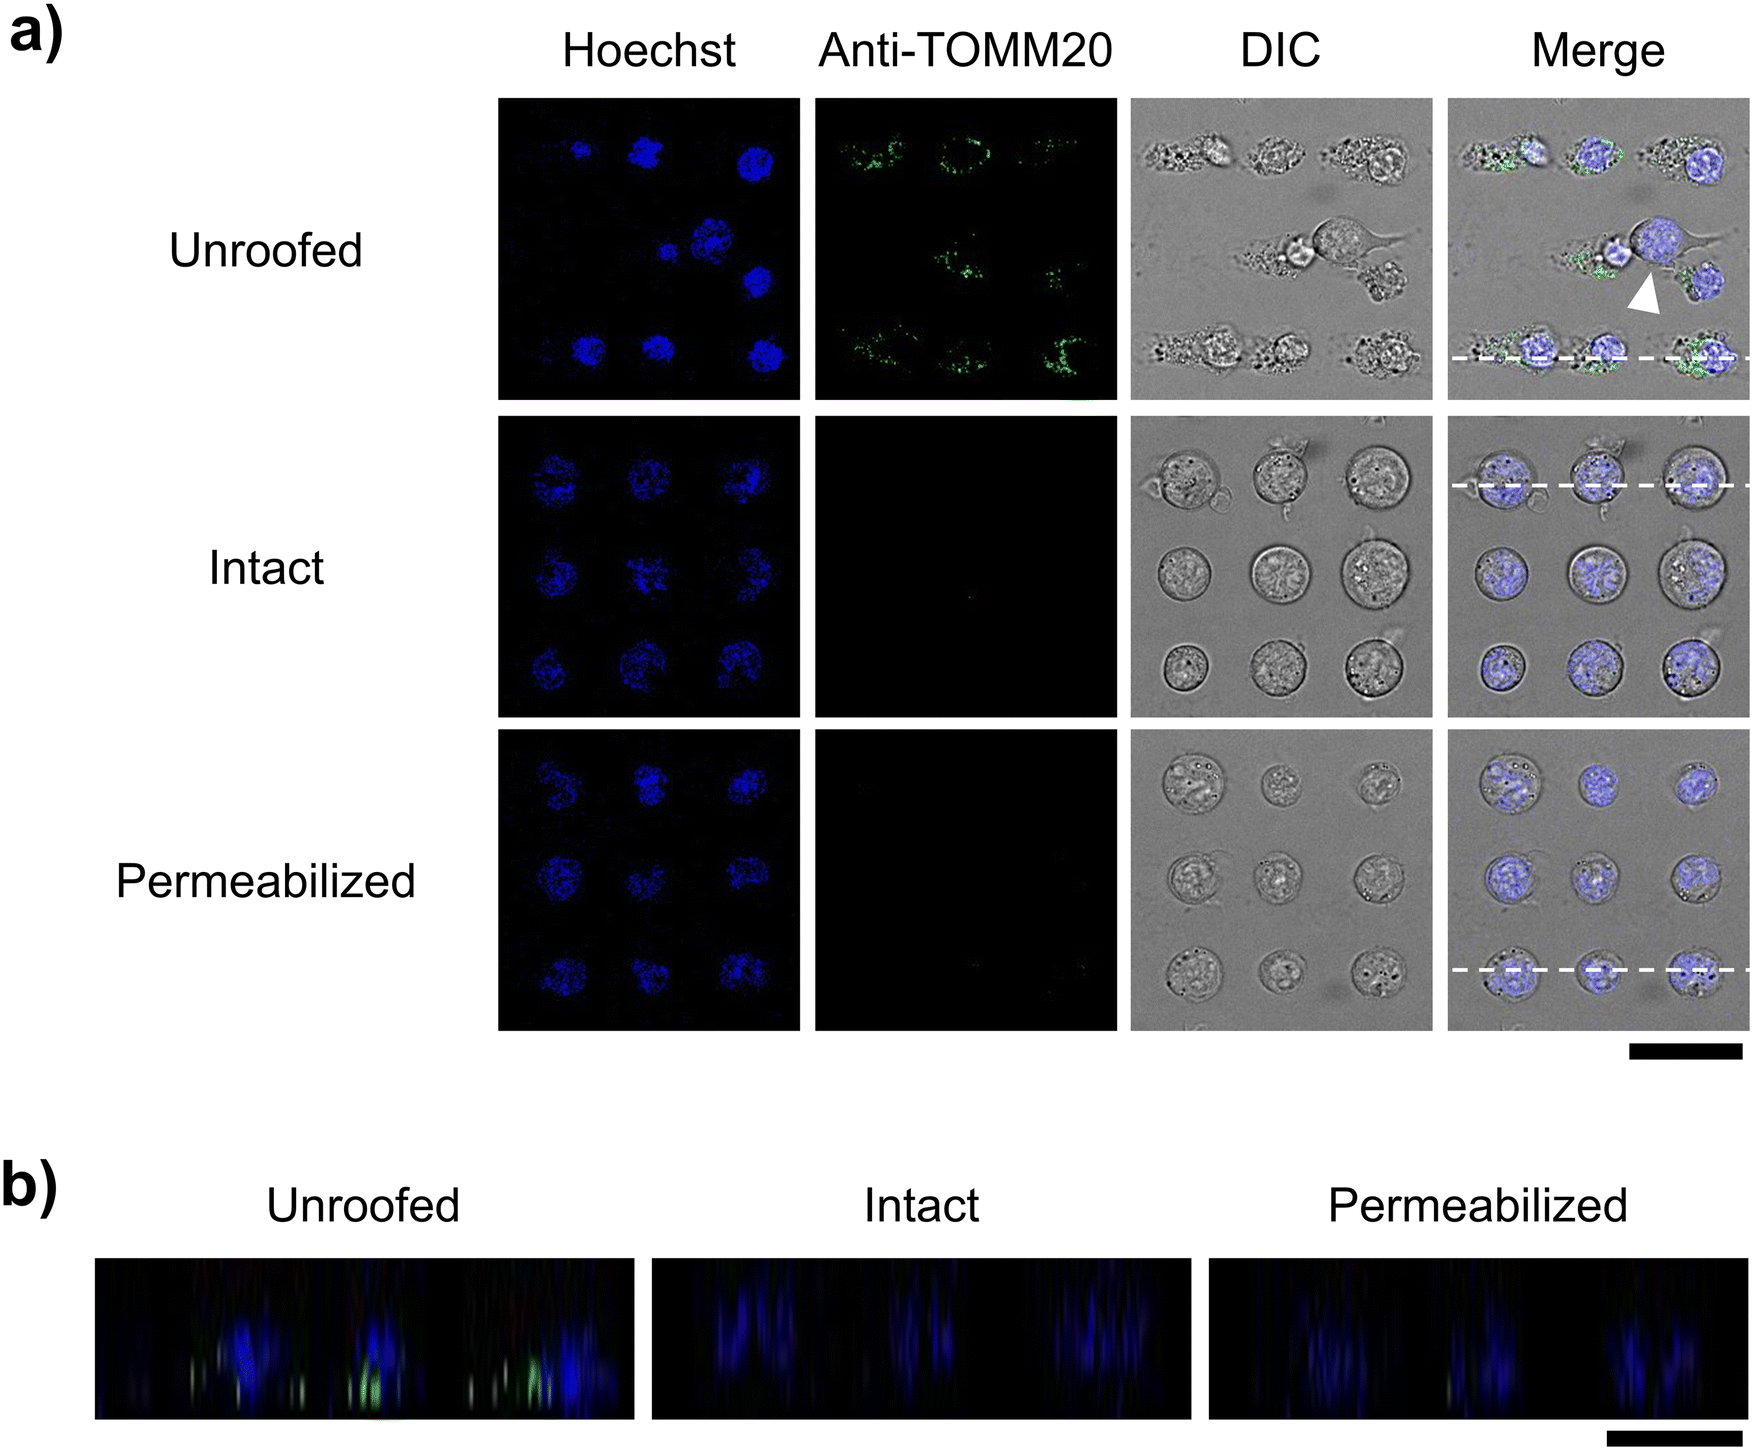 | ||
| Fig. 7 Confocal microscopic images of the immunostained cells. (a) XY cross-section images of the unroofed, intact, and permeabilized cells. Cells were stained with Hoechst 33342 (blue) and AF488-conjugated anti-TOMM20 antibody (green). White arrowhead indicates a cell not stained with the anti-TOMM20 antibody. (b) XZ cross-section images corresponding to the position of each white dotted line in the merge image in (a). Scale bars, 30 μm. | ||
Conclusions
In this study, a microfluidic unroofing method was established to examine the intact biomembranes of organelles without permeabilization. In this method, single-cell arrays were precisely prepared on the bottom surface of the microchannels with sufficiently short cell intervals using a photoactivatable cell-anchoring surface (Fig. 2). By generating a laminar flow, the arrayed cells were rapidly fractured (Fig. 2 and 4), leaving organelles, such as the nucleus and mitochondria, intact in the unroofed cells, without any significant damage (Fig. 5 and 6). Using this method, a protein on the outer mitochondrial membrane was rapidly visualized with high sensitivity via immunostaining without permeabilization (Fig. 7). Permeabilization of the plasma membrane for immunostaining is widely used for intracellular molecular imaging. However, detergents used for permeabilization can affect the structures and functions of organelle membranes.11 Indeed, mitochondrial membrane potential was lost following permeabilization in this study (Fig. 6). In contrast, our microfluidic unroofing method caused no significant damage to the mitochondria (Fig. 6). Fluid dynamics simulations revealed that this was possibly because strong fluidic stress was selectively applied to the uppermost surface of the cells by shortening the cell intervals. Conventional ultrasonic unroofing methods, even with thin sonication probes, cannot facilitate precise site-specific unroofing.12 Unlike a probe-based device with a small target area, our microfluidic device treated tens of thousands of cells simultaneously across the entire bottom surface of the microchannel in a uniform manner (Fig. S2†). Moreover, the unroofing process was extremely rapid (≤1 min), allowing microscopic observations before and immediately after unroofing by simply placing the microchannels on the microscope stage. Consequently, our method enabled the examination of organelles in live cells. By immediately introducing labeled drug candidates or ligands into the microfluidic channel, their binding to molecules on the exposed intact organelle surfaces can be investigated. Additionally, by detaching the microchannel from the bottom substrate, the shape and molecular composition of organelle surfaces can be examined via high-speed atomic force microscopy29 and various probe microscopy methods.30 Overall, the developed unroofing method can aid in the acquisition of previously unattainable organelle data, contributing to various research fields, from fundamental molecular biology to drug discovery.Data availability
The data supporting this article have been included as part of the ESI.†Author contributions
Sa. Y. and Y. U. conceptualized the study. Sa. Y., Y. U., Sh. Y., K. N., T. T., T. S., K. S. and Y. H. designed the methodology. Y. U., Sh. Y., K. N. and T. T. performed the experiments. Y. U. analysed the data. Sa. Y. and A. O. administered and supervised the study. Sa. Y. and Y. U. wrote the original draft. Sh. Y., K. N., T. T., T. S., K. S., Y. H. and A. O. reviewed and edited the paper. Sa. Y. acquired fundings.Conflicts of interest
There are no conflicts to declare.Acknowledgements
This work was supported by the Ministry of Education, Culture, Sports, Science, and Technology of Japan Grant-in-Aid for Challenging Research (Exploratory; 19K22079) and PRESTO Japan Science and Technology Agency (JST; grant number 16815021). Part of this work was supported by The Research Foundation for Opto-Science and Technology, the Iketani Science and Technology Foundation, the Izumi Science and Technology Foundation, and a Research Grant of the Uehara Memorial Foundation. Y. U. was supported by JST SPRING (grant number JPMJSP2108).Notes and references
- K. Hinterding, D. Alonso-Díaz and H. Waldmann, Angew. Chem., Int. Ed., 1998, 37, 688–749 CrossRef CAS PubMed.
- C. Schultz, Acc. Chem. Res., 2023, 56, 1168–1177 CrossRef CAS PubMed.
- C. Zihni, C. Mills, K. Matter and M. S. Balda, Nat. Rev. Mol. Cell Biol., 2016, 17, 564–580 CrossRef CAS PubMed.
- Y. Hirabayashi, S.-K. Kwon, H. Paek, W. M. Pernice, M. A. Paul, J. Lee, P. Erfani, A. Raczkowski, D. S. Petrey, L. A. Pon and F. Polleux, Science, 2017, 358, 623–630 CrossRef CAS PubMed.
- A. Lee, Y. Hirabayashi, S.-K. Kwon, T. L. Lewis Jr and F. Polleux, Curr. Opin. Physiol., 2018, 3, 82–93 CrossRef PubMed.
- P. Imming, C. Sinning and A. Meyer, Nat. Rev. Drug Discovery, 2006, 5, 821–834 CrossRef CAS PubMed.
- A. S. Hauser, M. M. Attwood, M. Rask-Andersen, H. B. Schiöth and D. E. Gloriam, Nat. Rev. Drug Discovery, 2017, 16, 829–842 CrossRef CAS PubMed.
- W. Xu, Z. Zeng, J.-H. Jiang, Y.-T. Chang and L. Yuan, Angew. Chem., Int. Ed., 2016, 55, 13658–13699 CrossRef CAS PubMed.
- S. H. Shi, Y. Hayashi, R. S. Petralia, S. H. Zaman, R. J. Wenthold, K. Svoboda and R. Malinow, Science, 1999, 284, 1811–1816 CrossRef CAS PubMed.
- S. A. Sundberg, Curr. Opin. Biotechnol., 2000, 11, 47–53 CrossRef CAS PubMed.
- D. J. Stephens and R. Pepperkok, Proc. Natl. Acad. Sci. U. S. A., 2001, 98, 4295–4298 CrossRef CAS.
- E. Usukura, A. Narita, A. Yagi, S. Ito and J. Usukura, Sci. Rep., 2016, 6, 27472 CrossRef CAS.
- S. E. Gordon, E. N. Senning, T. K. Aman and W. N. Zagotta, J. Gen. Physiol., 2016, 147, 189–200 CrossRef CAS PubMed.
- K. A. Sochacki and J. W. Taraska, Methods Mol. Biol., 2017, 1663, 219–230 CrossRef CAS PubMed.
- U. Kaur and J. C. Lee, Proc. Natl. Acad. Sci. U. S. A., 2020, 117, 18977–18983 CrossRef CAS PubMed.
- M. R. Sponholtz and E. N. Senning, ACS Chem. Neurosci., 2021, 12, 2072–2078 CrossRef CAS PubMed.
- S. Izuta, S. Yamaguchi, R. Misawa, S. Yamahira, M. Tan, M. Kawahara, T. Suzuki, T. Takagi, K. Sato, M. Nakamura, T. Nagamune and A. Okamoto, Sci. Rep., 2017, 7, 14962 CrossRef PubMed.
- K. Kato, K. Umezawa, D. P. Funeriu, M. Miyake, J. Miyake and T. Nagamune, BioTechniques, 2003, 35, 1–6 CrossRef PubMed.
- S. Yamahira, R. Misawa, T. Kosaka, M. Tan, S. Izuta, H. Yamashita, Y. Heike, A. Okamoto, T. Nagamune and S. Yamaguchi, J. Am. Chem. Soc., 2022, 144, 13154–13162 CrossRef CAS PubMed.
- J. Schindelin, I. Arganda-Carreras, E. Frise, V. Kaynig, M. Longair, T. Pietzsch, S. Preibisch, C. Rueden, S. Saalfeld, B. Schmid, J. Y. Tinevez, D. J. White, V. Hartenstein, K. Eliceiri, P. Tomancak and A. Cardona, Nat. Methods, 2012, 9, 676–682 CrossRef CAS PubMed.
- D. Ershov, M. S. Phan, J. W. Pylvänäinen, S. U. Rigaud, L. L. Le Blanc, A. Charles-Orszag, J. R. W. Conway, R. F. Laine, N. H. Roy, D. Bonazzi, G. Duménil, G. Jacquemet and J. Y. Tinevez, Nat. Methods, 2022, 19, 829–832 CrossRef CAS PubMed.
- Y. Minamoto, 2013, http://flowsquare.com.
- M. Umezawa, S. Haruguchi, R. Fukushima, S. Sekiyama, M. Kamimura and K. Soga, RSC Adv., 2019, 9, 15269–15276 RSC.
- T. Shigematsu, K. Koshiyama and S. Wada, Phys. Rev. E, 2020, 102, 022408 CrossRef CAS PubMed.
- M. Picard, K. White and D. M. Turnbull, J. Appl. Physiol., 2013, 114, 161–171 CrossRef PubMed.
- R. Inoue, T. Tsuno, Y. Togashi, T. Okuyama, A. Sato, K. Nishiyama, M. Kyohara, J. Li, S. Fukushima, T. Kin, D. Miyashita, Y. Shiba, Y. Atobe, H. Kiyonari, K. Bando, A. J. Shapiro, K. Funakoshi, R. N. Kulkarni, Y. Terauchi and J. Shirakawa, iScience, 2022, 25, 104603 CrossRef CAS PubMed.
- H. Gu, Y. Zhu, J. Yang, R. Jiang, Y. Deng, A. Li, Y. Fang, Q. Wu, H. Tu, H. Chang, J. Wen and X. Jiang, Adv. Sci., 2023, 10, 2302136 CrossRef CAS PubMed.
- Z. Fang, G. C. Corbizi Fattori, T. McKerrell, R. H. Boucher, A. Jackson, R. S. Fletcher, D. Forte, J. E. Martin, S. Fox, J. Roberts, R. Glover, E. Harris, H. R. Bridges, L. Grassi, A. Rodriguez-Meira, A. J. Mead, S. Knapper, J. Ewing, N. M. Butt, M. Jain, S. Francis, F. J. Clark, J. Coppell, M. F. McMullin, F. Wadelin, S. Narayanan, D. Milojkovic, M. W. Drummond, M. Sekhar, H. ElDaly, J. Hirst, M. Paramor, E. J. Baxter, A. L. Godfrey, C. N. Harrison and S. Méndez-Ferrer, Nat. Commun., 2023, 14, 7725 CrossRef CAS.
- M. Shibata, H. Yamashita, T. Uchihashi, H. Kandori and T. Ando, Nat. Nanotechnol., 2010, 5, 208–212 CrossRef CAS.
- Y. Takahashi, A. I. Shevchuk, P. Novak, B. Babakinejad, J. Macpherson, P. R. Unwin, H. Shiku, J. Gorelik, D. Klenerman, Y. E. Korchev and T. Matsue, Proc. Natl. Acad. Sci. U. S. A., 2012, 109, 11540–11545 CrossRef CAS PubMed.
Footnote |
| † Electronic supplementary information (ESI) available. See DOI: https://doi.org/10.1039/d5lc00102a |
| This journal is © The Royal Society of Chemistry 2025 |