 Open Access Article
Reaction intermediates recognized by in situ FTIR spectroscopy in CO2 hydrogenation over the Cu/ZnO/SPP-zeolite catalyst†
Xiaolong
Liu
abc,
Guangying
Fu
*bc,
Qiaolin
Lang
bc,
Ruiqin
Ding
bc,
Qiangsheng
Guo
d,
Ke
Liang
e,
Shuman
Gao
bc,
Xiaobo
Yang
 bc and
Bing
Yu
*a
aCollege of Chemistry and Chemical Engineering, Qingdao University, 266071 Qingdao, China. E-mail: yubing198@qdu.edu.cn
bKey Laboratory of Photoelectric Conversion and Utilization of Solar Energy, Qingdao Institute of Bioenergy and Bioprocess Technology, Chinese Academy of Sciences, 266101 Qingdao, China. E-mail: fugy@qibebt.ac.cn
cShandong Energy Institute, 266101 Qingdao, China
dSchool of Chemical and Environmental Engineering, Shanghai Institute of Technology, 201418 Shanghai, China
eTianjin Passion Advanced Material Technology LLC, TEDA, 300280 Tianjin, China
First published on 21st September 2024
Abstract
Cu/ZnO nanoparticles embedded in zeolites possess smaller particle sizes than those in the conventional Cu/ZnO/Al2O3 catalyst. Therefore, they exhibit a distinctive manner of interaction with the reactants in the catalytic hydrogenation of CO2 to methanol. The present paper uses in situ FTIR spectroscopy to recognize the introduction and removal of various carbonates, carbonyl, formates and water species adsorbed on the surface of a Cu/ZnO/SPP-zeolite catalyst in reactive flows. Together with other characterization results, such as quasi-in situ XPS, it was revealed that the Cu surfaces have an uneven electronic distribution and that constant carbonate coverage, low water adsorption, and fast consumption of carbonyls and formates are associated with the high conversion frequency of CO2 over the Cu/ZnO/zeolite material.
Introduction
The catalytic hydrogenation of CO2 to methanol and other chemicals is under intensive study with respect to the utilization of captured CO2 (CCUS) and the storage of volatile renewable energies in liquids.1 An industrial project has been in operation in Iceland since 2002 at 2000 MT per an to convert CO2 to methanol using a catalyst with Cu/ZnO/Al2O3 composition and has successfully demonstrated the importance of the process in reducing the carbon footprint per unit of energy production.2 However, the technology is not yet competitive against the conventional syngas-to-methanol process due to several reasons. Firstly, the CO2 conversion and CH3OH yields are thermodynamically restricted when CO2 becomes the main carbon feed instead of CO. Secondly, equimolar H2O is produced per CO2 conversion, which accelerates metal sintering and shortens the catalyst's lifetime. Therefore, new catalysts with high activity and high sintering resistance are still desired to achieve higher space–time yields of methanol and to extend the catalyst lifetime.3,4 Modifications of Cu-based catalysts, including the addition of promoters, changes in the preparation processes and the replacement of Al2O3 supports as well as explorations of catalysts of new compositions, are being investigated.5–7 This work presents a study of a composite material with Cu/ZnO nanoparticles entrapped in the mesopores of the self-pillared pentasil (SPP) zeolite, which shows an improved catalytic activity.Reducing the particle size is generally an effective way of improving the activity of metal catalysts.8,9 Moreover, zeolites are a type of microporous crystalline material with typical pore diameters of 0.4–1.0 nm, which are used as supports to confine and stabilize ultra-small metal particles.8,10 Metal species are loaded into the micropores of zeolites through diverse preparative routes, such as ion-exchange, chemical deposition, and impregnation.11–13 Metal particles larger than 1 nm can be embedded in zeolite crystals with hierarchical micropore and mesopore systems.14 For example, Hu et al. used a Cu/Zn binary metal–organic framework material as a precursor and grew Na-ZSM-5 zeolite around it.15 After calcination in air, the MOF precursor was converted to about 2 nm Cu/ZnO particles enclosed in the zeolite crystals. The material exhibited a significantly higher methanol space–time-yield than that of the Cu/ZnO/Al2O3 catalyst. Ding et al. prepared 2–5 nm Cu particles in Na-beta zeolite through another procedure.16 The mesopores of a Na-beta zeolite with a hierarchical porous system were impregnated with a Cu salt precursor. Then, a microporous protective shell was grown on the crystal surfaces. After calcination and reduction, the metal nanoparticles remain immobilized in the crystals. In the catalytic test, the desorption of C1 intermediates out of the zeolite was hindered, and the subsequent reactions forming ethanol were promoted, obtaining significant yields.
In a recent study, ultra-fine Cu particles of 1–2 nm size were entrapped in the grain boundaries of a silicalite-1 zeolite,17 which has a morphology of ca. 100 nm spheres made of ∼20 nm grains.17,18In situ FTIR spectroscopy was useful to monitor the generations and transformations of the reaction intermediates.
Adsorbed carbonyls, carbonates, formates and formic species were observed, implying that CO2 was converted on the ultra-fine Cu particles through both the formate pathway and reversed water-gas-shift pathway, similar to that of the conventional Cu/ZnO/Al2O3 catalyst,19,20 which typically have Cu particles sizes in the range of 10–20 nm.21 However, the formate intermediates were converted faster than carbonyl intermediates over the smaller Cu particles, indicating that the formate pathway was preferential for this catalyst and improved the methanol selectivity.
Through the addition of ZnO, the zeolite-supported smaller Cu particles can be further optimized. The role of ZnO in the Cu/ZnO/Al2O3 catalyst has been extensively investigated. It is known that ZnO serves as an electronic modifier,20,22–24i.e., the oxide plays multiple roles to fine-tune the surface charges of Cu particles, acting as a bulky support and overlayers and with a small amount of Zn atoms alloyed into the Cu particles. These species cause electronic deficiency on Cu surfaces, which enhances the adsorption of the reactants.
SPP zeolite has been chosen as the support to accommodate the Cu/ZnO composite particles in the present study. SPP zeolite is available as ellipsoidal particles in sizes of several hundred nanometers. The particles have a “house of cards” structure built up of ∼2 nm thick nanosheets of the MFI-type zeolite. The nanosheets penetrate each other perpendicularly, forming chambers with 2–8 nm edges.25–27 There are several works demonstrating the role of the SPP zeolite as catalyst compositions or catalyst supports. Sn- and Sn/B-containing SPP zeolites were studied as catalysts for the conversions of sugar molecules.28,29 Phosphorus-loaded SPP was active in the tetrahydrofuran conversion to butadiene.30 As a support for metal catalysts, SPP zeolite was found to stabilize sub-nanometer Rh and Rh–Ru clusters and was tested in the hydrogenation of various chemicals by ammonia borane.31 Herein, we used the pure-silica version of SPP to eliminate the contribution of acid sites and keep the focus of the study on the Cu/ZnO species. Over a Cu/ZnO-SPP-zeolite composite, the formation and evolution of the adsorbed intermediates were followed using in situ FTIR spectroscopy. Also, quasi-in situ XPS was used to confirm the surface electronic deficiency of Cu particles.
Experimental
Materials
SPP zeolite was synthesized according a procedure adapted from ref. 25 Cu and Zn were loaded on the calcined SPP zeolite through incipient wetness impregnation using aqueous solutions of Cu(NO3)2·3H2O and Zn(NO3)2·6H2O at Cu![[thin space (1/6-em)]](https://www.rsc.org/images/entities/char_2009.gif) :
:![[thin space (1/6-em)]](https://www.rsc.org/images/entities/char_2009.gif) Zn = 7
Zn = 7![[thin space (1/6-em)]](https://www.rsc.org/images/entities/char_2009.gif) :
:![[thin space (1/6-em)]](https://www.rsc.org/images/entities/char_2009.gif) 3 (molar ratio). Ethylenediamine (3.0 mol eq. referring to the total amount of the metals) was added in the impregnation solutions as an agent to aid the metal dispersions. The metal loadings were 25.56 wt% CuO and 11.21 wt% ZnO, calculated on the oxide bases (CuZn-SPP-E in Table 1). A reference material CuZn-SPP was prepared through the same procedure but without ethylenediamine in the impregnation solution. Another reference, a Cu/ZnO/Al2O3 catalyst of the composition (6.3/2.7/1.0 wt), was prepared using the conventional co-precipitation method (Table 1). The synthetic procedure and basic properties of the pure-silica SPP zeolite are elaborated in the ESI† Section 1, Fig. S1 and S2.
3 (molar ratio). Ethylenediamine (3.0 mol eq. referring to the total amount of the metals) was added in the impregnation solutions as an agent to aid the metal dispersions. The metal loadings were 25.56 wt% CuO and 11.21 wt% ZnO, calculated on the oxide bases (CuZn-SPP-E in Table 1). A reference material CuZn-SPP was prepared through the same procedure but without ethylenediamine in the impregnation solution. Another reference, a Cu/ZnO/Al2O3 catalyst of the composition (6.3/2.7/1.0 wt), was prepared using the conventional co-precipitation method (Table 1). The synthetic procedure and basic properties of the pure-silica SPP zeolite are elaborated in the ESI† Section 1, Fig. S1 and S2.
| Samples | CuO mean size by TEM (nm) | CuO (wt%) | ZnO (wt%) | Cu dispersion by TPR (%) |
|---|---|---|---|---|
| CuZn-SPP-E | 4.5 | 25.6 | 11.2 | 24.0 |
| CuZn-SPP | 26.5 | 18.3 | 8.1 | 7.1 |
| Cu/ZnO/Al2O3 | — | 63 | 27 | — |
Characterization
Powder X-ray diffraction was performed on a Rigaku SmartLab diffractometer using Cu Kα radiation at 40 kV and 150 mA operating in the continuous scan mode in theta–theta geometry at 2θ = 5–80° for phase identification.SEM images were taken on a Hitachi S-4800 scanning electron microscope equipped with a cold-field emission gun operating at 5 kV. The powder samples were dusted on carbon sheets and inspected without coating.
The TEM, STEM images, and corresponding EDS were taken on a JEOL JEM-F200 electron microscope. The samples were suspended in ethanol and dispersed onto ultrathin carbon films supported on 200 mesh Au grids.
FTIR spectra were recorded using a Bruker Vertex 70 V spectrometer at a spectral resolution of 4 cm−1. The sample chamber and the optics chamber were evacuated to <1 hPa. The in situ FTIR studies were performed on self-sustained pellets of a density 15 mg cm−2, which were enclosed in a gas-tight and heated cell with CaF2 windows. For probing the surfaces with CO2 or the mixture of CO2 and H2, the sample was reduced at 400 °C in a 4% H2/Ar flow at first. After cooling down to 150 °C, the background spectra were recorded. Then, a flow of CO2 or CO2/3H2 was introduced into the cell for 30 min at 30 mL min−1, along with spectral recording in 1 min intervals.
Quasi-in situ XPS (X-ray Photoelectron Spectroscopy) experiments were carried out on an ESCALAB 250Xi spectrometer (Thermo Fisher Scientific) equipped with a monochromatic Al Kα radiation source (E = 1486.6 eV). A heated chamber with gas inlets/outlets was used for the activation treatments. Samples were treated in 10% H2/Ar flow at 350 °C for 2 h, then in the reactive feed flow (CO2/H2 = 1/3) for 2 h at different temperatures between 180 and 280 °C. Afterwards, the chamber was evacuated and the sample was analyzed.
N2 adsorption and desorption data were collected on a Quantachrome Autosorb iQ3 at 79 K. Samples were pretreated under vacuum at 350 °C for 10 h.
H2-TPR (temperature-programmed reduction by H2) experiments were carried out in a flow equipment with a thermal conductivity detector. 100 mg samples were pretreated in Ar at 350 °C for 2 h and cooled down to room temperature. The temperature was ramped at 10 °C min−1 to 800 °C in 5% H2/Ar flow.
To carry out N2O titration, 100 mg reduced sample was exposed to 20% N2O/Ar at 60 °C for 1 h. After Ar purging, the surface-oxidized sample was tested with H2-TPR again. The dispersion rate, defined as the portion of surface Cu atoms against the total atoms in the particle, was calculated as
Catalytic test
Catalytic tests were carried out using a fixed-bed plug-flow microreactor with Φ = 0.4 mm and L = 50 mm (Vbed = 0.6 mL with 0.1 g catalyst diluted in quartz, grain sizes 60–100 mesh). The feed was CO2/H2 = 1![[thin space (1/6-em)]](https://www.rsc.org/images/entities/char_2009.gif) :
:![[thin space (1/6-em)]](https://www.rsc.org/images/entities/char_2009.gif) 3 (3 MPa) at 30 mL min−1, GHSV = 3000 h−1, or WHSVCO2 = 9.3 g h−1 gcat−1. The activity was tested in the range of 180–300 °C for 3–5 hours at each temperature with 20 °C intervals. The outlet gas composition was analyzed by an online gas chromatograph (GC) equipped with an HP Plot/Q column connected to a thermal conductivity detector (TCD).
3 (3 MPa) at 30 mL min−1, GHSV = 3000 h−1, or WHSVCO2 = 9.3 g h−1 gcat−1. The activity was tested in the range of 180–300 °C for 3–5 hours at each temperature with 20 °C intervals. The outlet gas composition was analyzed by an online gas chromatograph (GC) equipped with an HP Plot/Q column connected to a thermal conductivity detector (TCD).
CO2 conversion, methanol yield, selectivity, and space time yield of methanol were calculated on carbon bases using the equations below, where N is the mol fraction of the respective component in the reaction gas flow and M is the mol mass in [g mol−1]. STY in the dimension [g h−1 gcat−1] was calculated using dcat/bed = 0.1 g/0.6 mL. The turn-over frequency of CO2 and CH3OH formation rate were normalized to time and Cu weight.
Results and discussion
Basic properties of the catalyst
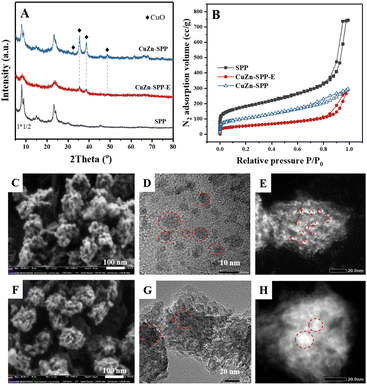
The catalyst under study is a SPP zeolite loaded with Cu and Zn components. Fig. 1 shows the characterization of the catalyst CuZn-SPP-E prepared by impregnating metal nitrite precursors with the aid of ethylenediamine as a dispersion agent,32 in comparison with the reference material CuZn-SPP, prepared using the same precursors but without the dispersing agent. The metal loading amounts achieved 25.6 and 11.2 wt% for CuO and ZnO, respectively, in CuZn-SPP-E (Table 1). Ethylenediamine played a role in regulating the slow releases of metal ions during the preparation process, aiming at a uniform deposition of smaller metal oxide particles throughout the zeolite. In XRD, only weak and broad diffraction peaks for CuO and none were observed for ZnO were observed. Further, SEM observed that CuZn-SPP-E had the same morphology as the starting SPP zeolite, i.e., ellipsoidal particles with the long axis of about 100 nm, and the particles were made of intersecting sheets of ca. 2 nm thicknesses. The particles had clean surfaces, without observable foreign particles attached. The TEM images show 2–8 nm metal oxide particles randomly across the entire SPP zeolite particles. The N2 adsorption isotherm shows that the metal oxide particles occupied a portion of the mesopores and partially blocked the access to the micropores (Table 2). H2-TPR and N2O–H2 titration experiments could determine a value of Cu dispersion of 24.0%, defined as the portion of surface Cu atoms in the entire Cu particles in the reduced state.| Materials | BET surface area (m2 g−1) | Micropore area (t-plot) (m2 g−1) | Mesopore area (t-plot) (m2 g−1) | Micropore volume (t-plot) (cm3 g−1) | Mesopore volume (t-plot) (cm3 g−1) |
|---|---|---|---|---|---|
| SPP | 581.1 | 106.6 | 474.5 | 0.075 | 0.945 |
| CuZn-SPP-E | 190.7 | 24.7 | 166 | 0.013 | 0.383 |
| CuZn-SPP | 336.2 | 50.7 | 315.5 | 0.024 | 0.326 |
Without ethylenediamine, less uniform deposition of metal particles with broad size distribution was obtained. In the reference CuZn-SPP material, a separation of the metal particles entrapped in the zeolite and those remaining at the external surface of the zeolite was observed at lower loadings, 18.3 wt% for CuO and 8.1 wt% for ZnO. XRD showed sharper and higher diffraction peaks for CuO. The SEM images show the crystallites attached to the external surfaces of the SPP zeolite particles.
TEM images displayed both smaller particles inside the zeolite and larger particles outside. Consistently, N2 adsorption showed that less mesopore volumes were occupied, while more micropores remained accessible. The Cu dispersion rate was 7.1%.
Catalytic performance
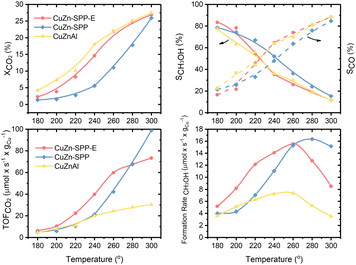
Fig. 2 shows the steady state (3–5 hours of time-on-stream) CO2 conversion, CH3OH and CO selectivity (carbon-based), CO2 conversion rate and CH3OH formation rate per unit Cu for the CuZn-SPP-E material at the reaction temperatures of 180–300 °C, in comparison with CuZn-SPP and the co-precipitated Cu/ZnO/Al2O3 material of the composition (6.3/2.7/1.0 wt), which is typical for commercial catalysts.33 CH3OH, CO and H2O were the observed products at the tested conditions. Heavier compounds such as C2H5OH and hydrocarbons were absent.Over CuZn-SPP-E, CO2 conversion started with 2.4% at 180 °C and gradually grew to 26% until 300 °C. The CuZn-SPP catalyst, i.e., the material with a similar amount of metal loadings but at a lower dispersion rate, showed lower CO2 conversion in the same temperature range. The larger particles on the external surfaces of the zeolite had lower activities. CuZn-SPP exhibited a sufficient activity only at higher temperatures, where the productivity of methanol is not satisfactory. Thus, the uniform distribution of smaller metal particles inside the zeolite in CuZn-SPP-E was beneficial.
Compared to Cu/ZnO/Al2O3, both SPP-supported catalysts were weak in terms of CO2 conversion and CH3OH yield because of the lower loadings of Cu and Zn components. However, the performance of CuZn-SPP-E regarding the CO2 conversion and CH3OH selectivity was already close to that of Cu/ZnO/Al2O3, with less than a half of the active components. When we consider the efficiency of unit Cu loadings, both CO2 turnover frequency and CH3OH formation rate on unit Cu are significantly higher for the CuZn-SPP-E sample than those for Cu/ZnO/Al2O3. The SPP-supported, highly dispersed and smaller metal particles exhibited higher activity than Cu/ZnO/Al2O3 with respect to the efficiency of the Cu active component by providing a higher number of surface sites.
Electron deficiency transferred from ZnO to Cu as detected by quasi-in situ XPS
For the Cu/ZnO/Al2O3 catalyst, it is known that ZnO interacts with the metallic Cu particles as a bulk support and as surface overlayers. Moreover, some Zn atoms alloy in the Cu particles. In both cases, Zn species causes positive electronic charges to the metallic Cu particles, enhancing the interaction with CO2 by polarizing the C![[double bond, length as m-dash]](https://www.rsc.org/images/entities/char_e001.gif) O bonds.19,20,23,33,34 It can be envisaged that ZnO and Zn play similar roles in the CuZn-SPP-E material. However, due to the high dispersion degrees and the SPP zeolite's unique nano-structure, our TEM inspection could not disclose more structural details of Zn species. XRD could only deduce that bulk crystalline ZnO or other Zn compounds were absent. ZnO was not supposed to be reduced in the TPR conditions. If some ZnO underwent reduction and alloyed with Cu, the small portion was also below TPR's detection ability.
O bonds.19,20,23,33,34 It can be envisaged that ZnO and Zn play similar roles in the CuZn-SPP-E material. However, due to the high dispersion degrees and the SPP zeolite's unique nano-structure, our TEM inspection could not disclose more structural details of Zn species. XRD could only deduce that bulk crystalline ZnO or other Zn compounds were absent. ZnO was not supposed to be reduced in the TPR conditions. If some ZnO underwent reduction and alloyed with Cu, the small portion was also below TPR's detection ability.
Therefore, quasi-in situ XPS experiments were carried out to analyze the valences of Cu and Zn species under the reaction conditions. Fig. 3 shows the X-ray photoelectron and X-ray excited Auger electron spectra of CuZn-SPP-E for the calcined, reduced, and after reaction testing states at various temperatures. In the Cu 2p spectra of the calcined sample (Fig. 3A), besides the shift splitting of Cu 2p1/2 and Cu 2p3/2, strong Cu2+ satellites indicated that Cu was present as CuO. The Cu LMM curve had an Auger peak at 915.5 eV (Fig. 3B), which also corresponded to CuO. After the reduction in H2, CuO was converted completely to metallic Cu0, with the Cu 2p3/2 peak at 932.4 eV, Cu 2p1/2 at 952.1 eV, Δ = 19.7 eV, and the Cu LMM peak at 918.2 eV.35,36 The spectra remained unchanged after the reaction tests from 180 to 280 °C. The expected electron deficiency is neither obvious for the reduced material nor for the samples that experienced the reaction conditions in the XPS spectra.
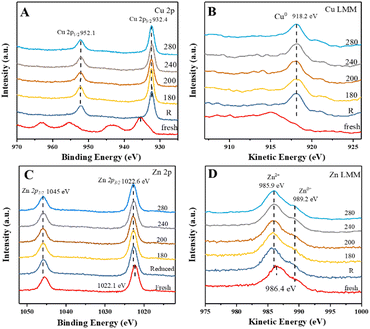 | ||
| Fig. 3 Quasi-in situ XPS spectra of CuZn-SPP-E at the calcined, reduced, and after reaction testing states at the given temperatures (180–280 °C): Cu 2p (A), Cu LMM (B), Zn 2p (C), Zn LMM (D). | ||
The rather large splitting of Zn 2p3/2 (1022.1 eV) and Zn 2p1/2 (1045.5 eV) of Δ = 22.4 eV implies that Zn was present as ZnO in the calcined CuZn-SPP-E sample (Fig. 3C). In the Zn LMM spectra, the Auger peak corresponding to Zn2+ appeared at 986.4 eV (Fig. 3D), while the Znδ+ (δ < 2) peak at 989.2 eV also had a non-negligible intensity. Here, the O vacancies caused an electron deficiency in the ZnO species. After the reduction and the catalytic tests, the 2p spectra moved to slightly higher binding energies (1022.6 and 1046.0 eV) while the Auger binding energies became lower (985.9 eV), indicating that Zn was in a more oxidized state after the reduction and during the reaction, i.e., the oxygen vacancy was partly filled by taking over the oxygen from CuO and/or electron from Cu. Also, it was plausible to deduce that the electron deficiency was transferred to the Cu particles, thus strengthening the adsorption and polarization of C![[double bond, length as m-dash]](https://www.rsc.org/images/entities/char_e001.gif) O bonds under the reaction conditions.
O bonds under the reaction conditions.
The quasi-in situ XPS spectra of the CuZn-SPP catalysts are provided in the ESI† in Fig. S3. Despite different spectroscopic intensities due to the different amounts of exposed surface sites, they supported the same hypothesis that the electron deficiency at the O vacancy of ZnO transferred to Cu particles after the reduction and during the catalytic reaction.
In the XPS spectra for O 1s (Fig. S4 in the ESI†), only one shift at 532.8 eV was observed for the freshly prepared CuZn-SPP-E sample. It covers the oxygen bonds in the zeolite framework as well as the ones in CuO and ZnO.37 After the exposure to H2, this peak shifted to a higher binding energy at 533.3 eV due to the reduction of CuO to Cu0. The same procedure was observed for CuZn-SPP. Red shifts of the binding energy occurred when the materials were exposed to the reaction conditions, where binding and chemisorption of oxygen-containing reaction intermediates at the Cu surfaces, especially H2O, were present. For CuZn-SPP-E, the red shift was about 0.2 eV, whereas it was 0.5 eV for CuZn-SPP. The catalyst with smaller and uniform metal particles favored smooth transitions and desorption of these intermediates. Unfortunately, no signal related to the charge exchange between Cu particles and the O vacancies in ZnO could be resolved. The contributions of the rather small amount of O vacancies to the shifts in the binding energy were insignificant.
In situ FTIR-recognizable reaction intermediates
Fig. 4 shows the in situ FTIR spectra of the reduced CuZn-SPP-E catalysts exposed to flowing CO2 and then to CO2/3H2 at 150 °C. Several reaction intermediate species already appeared upon the initial adsorption of CO2. The peaks at 2075 cm−1 and 2060 cm−1 corresponded to the stretching vibration of carbonyl that bonded to Cu metal surfaces (Cu–C![[double bond, length as m-dash]](https://www.rsc.org/images/entities/char_e001.gif) O).24,38,39 The appearance of two distinctive carbonyl bands for Cu implied that the charge distribution on the metal surfaces was not even. A weaker d–π feedback along the bond Cu–C
O).24,38,39 The appearance of two distinctive carbonyl bands for Cu implied that the charge distribution on the metal surfaces was not even. A weaker d–π feedback along the bond Cu–C![[triple bond, length as m-dash]](https://www.rsc.org/images/entities/char_e002.gif) O caused the band at a higher frequency and indicated electron-deficient spots.40 One reason for the electron deficiency was the surface oxidation by CO2. Additional electron deficiency was caused by the transformation from the oxygen vacancy of ZnO, in accordance with quasi-in situ XPS. One more carbonyl peak at 2130 cm−1 was due to the surface carbonyl on ZnO.24,41 Further carbonyl stretching was observed at 1900 cm−1, which is attributed to the bridged C
O caused the band at a higher frequency and indicated electron-deficient spots.40 One reason for the electron deficiency was the surface oxidation by CO2. Additional electron deficiency was caused by the transformation from the oxygen vacancy of ZnO, in accordance with quasi-in situ XPS. One more carbonyl peak at 2130 cm−1 was due to the surface carbonyl on ZnO.24,41 Further carbonyl stretching was observed at 1900 cm−1, which is attributed to the bridged C![[double bond, length as m-dash]](https://www.rsc.org/images/entities/char_e001.gif) O on Cu or ZnO surfaces.42,43 Bands belonging to surface adsorbed carbonate were observed, which were due to the asymmetric bending vibration at 1520 cm−1 and symmetric bending at 1380 cm−1.42,44,45
O on Cu or ZnO surfaces.42,43 Bands belonging to surface adsorbed carbonate were observed, which were due to the asymmetric bending vibration at 1520 cm−1 and symmetric bending at 1380 cm−1.42,44,45
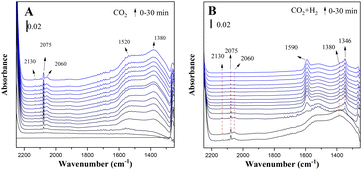 | ||
| Fig. 4 In situ FTIR spectra of the reduced CuZn-SPP-E catalyst exposed to flowing CO2 (A) and then to CO2+3H2 (B) at 150 °C. | ||
On co-feeding 3 mol eq. H2 with CO2, both the surface-adsorbed carbonyls and carbonates were consumed rapidly. Two new bands appeared: the peak at 1590 cm−1, which was due to the O–C–O bending vibration of mono-dentated formate adsorbed on Cu surfaces, and at 1346 cm−1 due to the bi-dentate formate on Cu.38,39,42,46–48 The peak intensity changes approached a steady state within approximately 5 min.
Physisorbed water was built-up during the adsorption of CO2, together with the formation of surface carbonyls and formates, which is recognized by the –O–H stretching at 1630 cm−1.39,46,49 The initial source of hydrogen must be the layer of chemisorbed H atoms on the reduced Cu surfaces. The overall intensities of the adsorbed water were not high and became even lower when the reactions proceeded. The reaction intermediates expelled a portion of the adsorbed water.
Fig. 5 shows the in situ FTIR spectra of CuZn-SPP at the same conditions. CuZn-SPP, which had larger Cu particles at the external surfaces of SPP zeolite, accumulated more bridged carbonyl and more physisorbed water when exposed to CO2. Thus, both signals stayed during the reactions. Bridged carbonyl is less reactive than the linearly adsorbed one. This explains that the material performed less efficiently, especially at lower reaction temperatures.
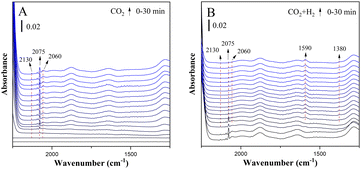 | ||
| Fig. 5 In situ FTIR spectra of the reduced CuZn-SPP catalyst exposed to flowing CO2 (A) and then to CO2+3H2 (B) at 150 °C. | ||
The in situ FTIR spectra of the reduced catalysts directly exposed to the reaction feeds (without the pre-adsorption of CO2) were also recorded and are illustrated as the ESI† in Fig. S5 and S6. Without the initial accumulation of the first carbonyls and carbonates out of CO2, the reactions still approached the same steady states within ca. 5 minutes.
Compared to the 1 nm Cu particles entrapped in the grain boundaries of nanosilicalite-1 reported before,17 less intermediate species were observable on CuZn-SPP-E and CuZn-SPP, specifically, HCOOH* and HCO* were absent. Fig. 6 summarizes the expected reaction intermediates when the reactions proceed through both the formate route and the RWGS route.19,20 The red circles indicate the reaction intermediates detected by in situ FTIR over the 1 nm Cu particles entrapped in silicalite-1.17 The blue circles indicate the ones recognized in the present study over 2–8 nm Cu/ZnO in SPP zeolite. The intermediates related to the formate-route were preferentially consumed than the carbonyls over the smaller Cu particles. But the current study on ZnO modified and larger Cu particles would not allow to distinguish both. The absence of COOH* and HCOO* and subsequent intermediates and the fast consumption of carbonyls and formates implies that these reaction intermediates were very rapidly converted to the products. The reactions proceed faster on the ZnO-modified and zeolite enclosed 2–8 nm Cu particles.
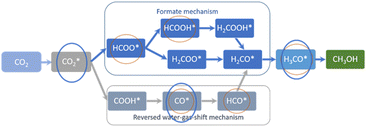 | ||
| Fig. 6 The expected reaction intermediates for CO2 hydrogenation to methanol, and the ones recognized by in situ FTIR over 1 nm Cu particles entrapped in silicalite-1 (red circles),17 and 2–8 nm Cu/ZnO in SPP zeolite (blue circle). | ||
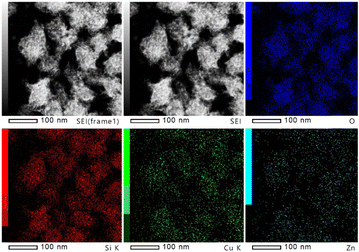
The in situ XPS and FTIR results together support the conclusion that the transfer of electron deficiency from the ZnO oxygen vacancy to the Cu surfaces promotes the activation of CO2. Thus, it is interesting to study how the ZnO species affect the small Cu nanoparticles entrapped in zeolites. Here, as a first attempt, Fig. 7 illustrates the TEM images and EDX elemental mapping of Si, O, Cu, and Zn for CuZn-SPP-E, which showed that the distribution area of Cu and Zn elements overlapped each other rather than that of the individual element crowded in certain spots. In the future, the structural relationship of Cu clusters and ZnO species could be characterized in detail through further experimental and theoretical studies.
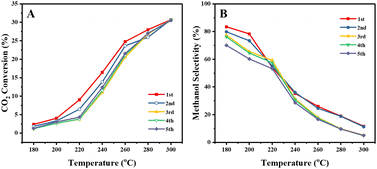
It is also expected that the confinement in the mesopores of the SPP zeolite would stabilize the metal particles against sintering. We begin to investigate this point by cycling the catalytic test experiments. Fig. 8 shows the CO2 conversion and CH3OH selectivity over the CuZn-SPP-E catalyst in 5 test cycles for 5 hours at each temperature step and total 175 hours in the whole experiment. The results show that both conversion and selectivity deteriorated slightly in the 2nd and 3rd cycles but were stabilized in the subsequent cycles. Taking the values at 240 °C, the CO2 conversion stabilized from 17% to about 13% and the CH3OH selectivity from 36% to 30%. Considering that the catalyst was exposed to harsh temperature conditions of up to 300 °C in each cycle, the deterioration in performance can be considered not severe. The potential of the SPP zeolite to stabilize smaller metal particles by trapping them in the mesopores is thus confirmed. In addition, the stability of the catalyst should be compared with that of the commercial Cu/ZnO/Al2O3 catalyst by longer and more extensive tests, e.g., at a temperature of about 230 °C for at least 1000 h, as described by Schlögl et al. in a benchmark study.33 The spent catalyst in various stages of deactivation will be thoroughly characterized in order to develop further means of preventing sintering and other types of deterioration.
Conclusions
The Cu/ZnO/SPP-zeolite composite, with CuO particle sizes in the range of 2–8 nm that are uniformly embedded within the mesopores of the SPP zeolite having loading amounts up to 25.6 wt% for CuO and 11.2 wt% for ZnO, acts as an active catalyst in CO2 hydrogenation to CH3OH and CO. It performs better than the Cu/ZnO/Al2O3 catalyst in terms of CO2 turnover frequency and methanol formation rate per unit Cu. But the overall performance of the zeolite-supported materials is still not able to match that of the Cu/ZnO/Al2O3 catalyst because of the low metal loadings.Reduced metal particle size accelerated the reaction speeds. Quasi-in situ XPS and in situ FTIR experiments determined that the electronic deficiency due to the oxygen vacancy in ZnO can be transferred to Cu particles during the reactions and promote the interaction with CO2. CuZn-SPP-E can maintain a constant carbonate coverage and low water adsorption during the catalytic reaction. Intermediates related with the hydrogenation processes, such as adsorbed carbonyl and formate species, are turned over very rapidly. The structures of ZnO and its relationship with Cu particles and SPP zeolite have not been characterized yet and will be the focus of future studies. It is also discovered in the in situ experiments that larger Cu/ZnO particles on SPP zeolite are prone to stronger water adsorption.
Detailed investigations into the structure and role of the ZnO promoter as well as longer and larger stability tests are being carried out.
Data availability
The data supporting this article have been included as part of the ESI,† including the preparation and characterization of the starting SPP zeolite, and additional in situ FTIR and quasi-in situ XPS spectra recorded in various reactive flows. Further details are available from the authors upon request.Author contributions
X. Liu: investigation. G. Fu: conceptualization, methodology, supervision, investigation. Q. Lang, R. Ding, Q. Guo, K. Liang, S. Gao: investigation. X. Yang: methodology, investigation, writing – original draft. B. Yu: supervision.Conflicts of interest
There are no conflicts to declare.Acknowledgements
Fundings were provided by Shandong Energy Institute (SEI S202107), and Natural Science Foundation of Shandong Province, China (ZR2022MB053, ZR2022QB216).References
- J. Zhong, X. Yang, Z. Wu, B. Liang, Y. Huang and T. Zhang, Chem. Soc. Rev., 2020, 49, 1385–1413 RSC.
- George Olah CO2 to Renewable Methanol Plant, Reykjanes, Iceland, https://www.carbonrecycling.is/.
- P. Gao, L. Zhang, S. Li, Z. Zhou and Y. Sun, ACS Cent. Sci., 2020, 6, 1657–1670 CrossRef CAS.
- P. Sharma, J. Sebastian, S. Ghosh, D. Creaser and L. Olsson, Catal. Sci. Technol., 2021, 11, 1665–1697 RSC.
- P. Gao, S. Li, X. Bu, S. Dang, Z. Liu, H. Wang, L. Zhong, M. Qiu, C. Yang, J. Cai, W. Wei and Y. Sun, Nat. Chem., 2017, 9, 1019–1024 CrossRef CAS PubMed.
- S. Dang, B. Qin, Y. Yang, H. Wang, J. Cai, Y. Han, S. Li, P. Gao and Y. Sun, Sci. Adv., 2020, 6, eaaz2060 CrossRef CAS.
- J. Wang, T. Wang, Y. Xi, G. Gao, P. Sun and F. Li, Angew. Chem., Int. Ed., 2023, e202311335 CAS.
- L. Liu and A. Corma, Chem. Rev., 2018, 118, 4981–5079 CrossRef CAS.
- C. R. Henry, C. Chapon, S. Giorgio and C. Goyhenex, in Chemisorption and Reactivity on Supported Clusters and Thin Films: Towards an Understanding of Microscopic Processes in Catalysis, ed. R. M. Lambert and G. Pacchioni, Springer Netherlands, Dordrecht, 1997, pp. 117–152, DOI:10.1007/978-94-015-8911-6_5.
- Y. Wang, C. Wang, L. Wang, L. Wang and F.-S. Xiao, Acc. Chem. Res., 2021, 54, 2579–2590 CrossRef CAS PubMed.
- Y. Chai, W. Shang, W. Li, G. Wu, W. Dai, N. Guan and L. Li, Adv. Sci., 2019, 6, 1900299 CrossRef.
- Q. Zhang, S. Gao and J. Yu, Chem. Rev., 2023, 123, 6039–6106 CrossRef CAS PubMed.
- N. Kosinov, C. Liu, E. J. M. Hensen and E. A. Pidko, Chem. Mater., 2018, 30, 3177–3198 CrossRef CAS.
- E. B. Clatworthy, S. V. Konnov, F. Dubray, N. Nesterenko, J.-P. Gilson and S. Mintova, Angew. Chem., Int. Ed., 2020, 59, 19414–19432 CrossRef CAS PubMed.
- W.-G. Cui, Y.-T. Li, L. Yu, H. Zhang and T.-L. Hu, ACS Appl. Mater. Interfaces, 2021, 13, 18693–18703 CrossRef CAS.
- L. Ding, T. Shi, J. Gu, Y. Cui, Z. Zhang, C. Yang, T. Chen, M. Lin, P. Wang, N. Xue, L. Peng, X. Guo, Y. Zhu, Z. Chen and W. Ding, Chem, 2020, 6, 2673–2689 CAS.
- R. Ding, G. Fu, S. Wang, Y. Yang, Q. Lang, H. Zhao, X. Yang and V. Valtchev, Catalysts, 2022, 12, 1296 CrossRef CAS.
- X. Yang, E. Dib, Q. Lang, H. Guo, G. Fu, J. Wang, Q. Yi, H. Zhao and V. Valtchev, Microporous Mesoporous Mater., 2022, 329, 111537 CrossRef CAS.
- L. C. Grabow and M. Mavrikakis, ACS Catal., 2011, 1, 365–384 CrossRef CAS.
- M. Behrens, F. Studt, I. Kasatkin, S. Kühl, M. Hävecker, F. Abild-Pedersen, S. Zander, F. Girgsdies, P. Kurr, B.-L. Kniep, M. Tovar, R. W. Fischer, J. K. Nørskov and R. Schlögl, Science, 2012, 336, 893–897 CrossRef CAS PubMed.
- P. L. Hansen, J. B. Wagner, S. Helveg, J. R. Rostrup-Nielsen, B. S. Clausen and H. Topsøe, Science, 2002, 295, 2053–2055 CrossRef CAS.
- T. Lunkenbein, J. Schumann, M. Behrens, R. Schlögl and M. G. Willinger, Angew. Chem., Int. Ed., 2015, 54, 4544–4548 CrossRef CAS.
- T. Lunkenbein, F. Girgsdies, T. Kandemir, N. Thomas, M. Behrens, R. Schlögl and E. Frei, Angew. Chem., Int. Ed., 2016, 55, 12708–12712 CrossRef CAS PubMed.
- J. Schumann, J. Kröhnert, E. Frei, R. Schlögl and A. Trunschke, Top. Catal., 2017, 60, 1735–1743 CrossRef CAS.
- X. Zhang, D. Liu, D. Xu, S. Asahina, K. A. Cychosz, K. V. Agrawal, Y. Al Wahedi, A. Bhan, S. Al Hashimi, O. Terasaki, M. Thommes and M. Tsapatsis, Science, 2012, 336, 1684–1687 CrossRef CAS.
- W. Chaikittisilp, Y. Suzuki, R. R. Mukti, T. Suzuki, K. Sugita, K. Itabashi, A. Shimojima and T. Okubo, Angew. Chem., Int. Ed., 2013, 52, 3355–3359 CrossRef CAS PubMed.
- R. Jain, A. Chawla, N. Linares, J. García Martínez and J. D. Rimer, Adv. Mater., 2021, 33, 2100897 CrossRef CAS.
- T. R. Josephson, R. F. DeJaco, S. Pahari, L. Ren, Q. Guo, M. Tsapatsis, J. I. Siepmann, D. G. Vlachos and S. Caratzoulas, ACS Catal., 2018, 8, 9056–9065 CrossRef CAS.
- H. Wu, W. Huang, J. Zhang, T. Du, J. Wang, Z. Xu, R. Xu, C. Meng, X. Guo, L. Ren and M. Tsapatsis, Microporous Mesoporous Mater., 2022, 341, 112068 CrossRef CAS.
- E. Ruiz-Zamora, J. R. De la Rosa, C. S. Maldonado, C. J. Lucio-Ortiz, D. A. D. H. D. Río, M. A. Garza-Navarro, L. Sandoval-Rangel, F. J. Morales-Leal and S. Wi, Appl. Catal., A, 2022, 640, 118648 CrossRef CAS.
- N. Wang, Q. Sun, T. Zhang, A. Mayoral, L. Li, X. Zhou, J. Xu, P. Zhang and J. Yu, J. Am. Chem. Soc., 2021, 143, 6905–6914 CrossRef CAS PubMed.
- C. Dong, Y. Li, D. Cheng, M. Zhang, J. Liu, Y.-G. Wang, D. Xiao and D. Ma, ACS Catal., 2020, 10, 11011–11045 CrossRef CAS.
- H. Ruland, H. Song, D. Laudenschleger, S. Stürmer, S. Schmidt, J. He, K. Kähler, M. Muhler and R. Schlögl, ChemCatChem, 2020, 12, 3216–3222 CrossRef CAS.
- S. Fujita, M. Usui, H. Ito and N. Takezawa, J. Catal., 1995, 157, 403–413 CrossRef CAS.
- G. Moretti, Surf. Sci., 2013, 618, 3–11 CrossRef CAS.
- N. J. Divins, D. Kordus, J. Timoshenko, I. Sinev, I. Zegkinoglou, A. Bergmann, S. W. Chee, S. Widrinna, O. Karslıoğlu, H. Mistry, M. Lopez Luna, J. Q. Zhong, A. S. Hoffman, A. Boubnov, J. A. Boscoboinik, M. Heggen, R. E. Dunin-Borkowski, S. R. Bare and B. R. Cuenya, Nat. Commun., 2021, 12, 1435 CrossRef CAS PubMed.
- S. Wang, K. Feng, D. Zhang, D. Yang, M. Xiao, C. Zhang, L. He, B. Yan, G. A. Ozin and W. Sun, Adv. Sci., 2022, 9, 2104972 CrossRef CAS.
- F. C. Meunier, Catal. Today, 2023, 423, 113863 CrossRef CAS.
- D. B. Clarke and A. T. Bell, J. Catal., 1995, 154, 314–328 CrossRef CAS.
- E. Shaaban and G. Li, Commun. Chem., 2022, 5, 32 CrossRef CAS.
- J. Hu, Y. Li, Y. Zhen, M. Chen and H. Wan, Chin. J. Catal., 2021, 42, 367–375 CrossRef CAS.
- K. K. Bando, K. Sayama, H. Kusama, K. Okabe and H. Arakawa, Appl. Catal., A, 1997, 165, 391–409 CrossRef CAS.
- C. Shao and M. Chen, J. Mol. Catal. A: Chem., 2001, 170, 245–249 CrossRef CAS.
- J. Baltrusaitis, J. H. Jensen and V. H. Grassian, J. Phys. Chem. B, 2006, 110, 12005–12016 CrossRef CAS PubMed.
- H. Bahruji, M. Bowker, G. Hutchings, N. Dimitratos, P. Wells, E. Gibson, W. Jones, C. Brookes, D. Morgan and G. Lalev, J. Catal., 2016, 343, 133–146 CrossRef CAS.
- F. C. Meunier, I. Dansette, K. Eng and Y. Schuurman, Catalysts, 2022, 12, 793 CrossRef CAS.
- F. C. Meunier, Angew. Chem., Int. Ed., 2011, 50, 4053–4054 CrossRef CAS.
- J. Merel, M. Clausse and F. Meunier, Ind. Eng. Chem. Res., 2008, 47, 209–215 CrossRef CAS.
- F. C. Meunier, R. Kdhir, N. Potrzebowska, N. Perret and M. Besson, Inorg. Chem., 2019, 58, 8021–8029 CrossRef CAS.
Footnote |
| † Electronic supplementary information (ESI) available: The synthesis and basic characterization of the starting SPP zeolite, and additional quasi-in situ XPS and in situ FTIR spectra. See DOI: https://doi.org/10.1039/d4lf00266k |
| This journal is © The Royal Society of Chemistry 2025 |


