 Open Access Article
Creative Commons Attribution 3.0 Unported Licence
On the characterization and performance of highly dispersed TiO2 nanoparticles onto BEA zeolite in the continuous gas-phase photooxidation of ethylene†
Ricardo
Ferreira
 ab,
Sergio
Morales-Torres
 b,
Luisa M.
Pastrana-Martinez
 b,
Francisco J.
Maldonado-Hódar
 b,
João Paulo
Lourenço
 ac,
João Miguel
Silva
 ad,
Isabel M.
João
 de,
Maria Filipa
Ribeiro
 a and
Auguste
Fernandes
 *a
*a
aCentro de Química Estrutural, Institute of Molecular Sciences, Instituto Superior Técnico, Universidade de Lisboa, Lisboa, Portugal. E-mail: auguste.fernandes@tecnico.ulisboa.pt
bNanomaterials and Sustainable Chemicals Technologies, Department of Inorganic Chemistry, Faculty of Science, University of Granada, Granada, Spain
cFaculdade de Ciências e Tecnologia, Universidade do Algarve, Faro, Portugal
dInstituto Superior de Engenharia de Lisboa, Lisboa, Portugal
eCEGIST, Instituto Superior Técnico, Universidade de Lisboa, Lisboa, Portugal
First published on 9th October 2024
Abstract
Two series of TiO2-based zeolite composites (BEA structures) were prepared by employing a sol–gel method using two different synthesis approaches, i.e., acidic and basic media. Different photocatalytic composites obtained with increasing amounts of TiO2 (10–50 wt%) were thoroughly characterized and subsequently tested in the photooxidation of ethylene in a continuous gas-phase system. Results showed that sol–gel experimental conditions had a significant effect on the final properties of the samples, as photocatalytic composites obtained under basic conditions showed better TiO2 dispersion and interaction with the BEA support than their counterparts prepared in an acidic medium. The same photocatalysts showed high performance in ethylene photooxidation, demonstrating complete mineralization and results comparable to or even better than those of the bulk TiO2 material.
Introduction
Ethylene (C2H4) is a natural hormone found in fruits and vegetables that induces their growth, ripening and senescence.1 Apart from accelerating fruit maturation, ethylene can lead to fruit spoilage, reducing shelf life and causing huge losses worldwide each year, with wastes estimated for this sector as much as 20–60%.2 Because the global demand for fruits is increasing, concerns about food quality and food waste minimization are rising in population priorities. For these reasons, ethylene removal in fruit transportation and cold storage chambers has been the subject of several studies.1,3,4 Many different (chemical and/or physical) methods can be used for ethylene elimination,5 for example, the use of chemical inhibitors (e.g., 1-MCP), chemical oxidation with KMnO4, adsorption methods and different advanced oxidation processes (AOPs).5,6 Among all the available methods and technologies applied in the food storage industry, the ethylene photooxidation method appears a very promising opportunity.Although many different photocatalytic materials can be potentially employed for such a purpose (one can cite nanostructured ZnO,7 for example), TiO2 photocatalyst is, by far the most common and popular semiconductor studied for photocatalytic purposes, probably because of their unique properties such as chemical inertness, high stability, low cost and, undoubtedly, efficient photoactivity under UV light.8 TiO2 photocatalysts have received much attention from the food industry. Indeed, TiO2-based alternative postharvest technologies have demonstrated a strong potential in ethylene removal through photodegradation, especially for the storage of fresh products and/or manufacturing of food-active packaging.5,9,10 However, successful ethylene photooxidation technologies, already mature, are still a challenging task, in part because of the need to find a highly efficient photocatalyst material. One interesting solution is the coupling of photocatalytic oxidation with another ethylene control method, such as ventilation or adsorption.5 Preparing composites based on TiO2 and a zeolite-based adsorbent seems to be a promising solution for obtaining highly efficient ethylene removal via photooxidation. In fact, zeolite materials present many advantages over other adsorbent materials. They can play an important role in increasing ethylene concentration, thus improving the reaction rate of the photocatalytic oxidation process.5 However, owing to their capacity to disperse well the active phase, zeolites are commonly used as supports for metals and metal oxide supports.11 In particular, many studies have focused on the incorporation of titanium into zeolite and silicate materials. Depending on the synthesis methods used to introduce Ti, two different Ti-based zeolite materials can be obtained: Ti-containing zeolites/silicates and TiO2-zeolite composites. In the first case, Ti is essentially incorporated within the zeolite structure, replacing Si and thus adopting tetrahedral coordination.12 In the second case, zeolite is used as a support to obtain highly dispersed TiO2 nanoparticles at the surface of the zeolite.13–15 The ultimate goal consists of preparing a TiO2-based zeolite composite with highly active TiO2 species, which is at least more active than bulk TiO2 materials.12,15 BEA structure has prevailed among all the different zeolite supports that have been studied as potential support of TiO2 for several reasons: a) the high surface area and also the presence of silanol defects enable the incorporation of TiO2 as isolated tetrahedral Ti(IV) species;16,17 b) the good adsorption properties that enhance the photodegradation efficiency of zeolite-supported TiO2;18 c) the possibility to transfer the excited electrons of TiO2 to the zeolite support can lead to a decrease in the e−/hole recombination rate and the subsequent improvement of the composite photocatalytic efficiency.14,18 In fact, many photocatalytic reactions, such as ketonisation,17 epoxidation16 and photooxidation of volatile organic compounds (VOCs), in both liquid and gas-phase systems,14,18–20 have been studied with BEA-based TiO2 composites.
In this work, we show the use of BEA-based TiO2 composites in the photooxidation of ethylene in a gas-phase system. TiO2/BEA zeolite composites were prepared using a sol–gel method, with two different alcohols (2-propanol and ethanol) and different TiO2 concentrations (10–50 wt%) in the final composites. The photocatalysts were tested under two types of irradiation: UV-vis and UVA-vis lights. The results demonstrated the presence of different TiO2 species, well dispersed on the surface of the zeolite support. The resulting BEA-TiO2 composites showed highly efficient photocatalytic activity in ethylene photooxidation.
Results and discussion
Characterization of the TiO2 bulk samples
Fig. 1 shows the PXRD patterns (left) and the N2 isotherms (right) for the three bulk TiO2 samples used for this comparative study (the respective pore size distribution (PSD) curves are presented in Fig. S1, ESI†). TiO2-SA sample consists of a mixture of anatase and rutile phases (main peaks at 25.33 and 27.47°, respectively), with peaks rather broad, indicating very small crystallites. The TiO2-S1 sample shows the same behavior as the TiO2-SA one, meaning that the samples are very similar in terms of anatase/rutile weight ratio and crystallite size. This result agrees well with the study of Molea et al.,21 who showed that acidic pH conditions during TiO2 sol–gel preparation give a mixture of anatase and rutile, while basic conditions favor the anatase phase. The sol–gel process might be driven essentially by the pH of the solution.22 Under acidic conditions, deoxolation does not occur during nucleation; instead, olation leads to the growth of linear chains that condense by oxolation to form a rutile phase. Under basic conditions, deoxolation occurs prior to olation and condensation can proceed along apical directions, with the formation of anatase structure. In fact, the TiO2-S2 sample synthesized under basic sol–gel conditions corresponds to a pure anatase phase (absence of the main rutile peak at 27.47° in 2θ). This sample also presents broader peaks, revealing even smaller particles. This is also well in line with the work of Bahar et al.,23 who demonstrated that ethanol solvent favored the formation of small TiO2 particles while propanol favored larger TiO2 ones. All these observations are supported by the quantitative PXRD analysis performed, as presented in Table 1. TiO2-SA and TiO2-S1 samples present the same amount of anatase and rutile (87 and 13 wt%, respectively) and crystallite size (18–19 nm for the anatase phase). These results also agree well with common values found in the literature for P25-like TiO2 materials.24 However, the pure anatase TiO2-S2 sample shows smaller crystallites (about 11 nm).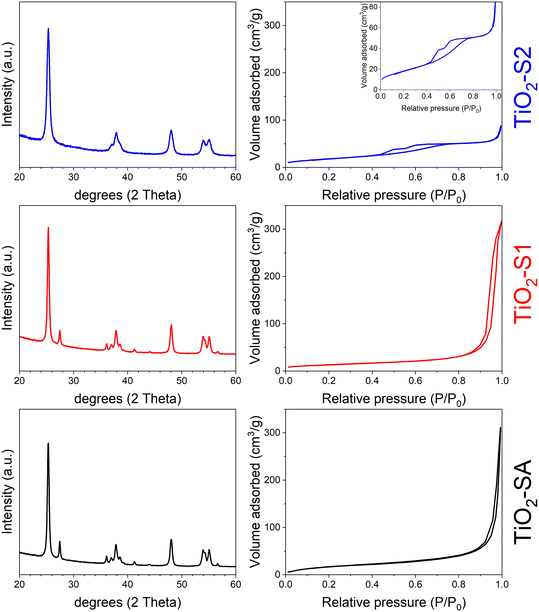 | ||
| Fig. 1 (Left) PXRD patterns and (right) N2 isotherms (at 77 K) of bulk TiO2 samples: TiO2-SA (black), TiO2-S1 (red) and TiO2-S2 (blue). Inset: details of the TiO2-S2 isotherm. | ||
| Sample | XRD analysisa | Textural parameters | |||
|---|---|---|---|---|---|
| Anatase | Rutile | V total | S BET | Pore sized | |
| a Quantitative phase analysis (wt%) and crystallites size (nm). b (cm3 g−1). c (m2 g−1). d From the maxima of BJH curves, desorption branch (nm). | |||||
| TiO2-SA | 87 (19) | 13 (30) | 0.48 | 67 | 65 |
| TiO2-S1 | 88 (18) | 12 (28) | 0.49 | 48 | 33 |
| TiO2-S2 | 100 (11) | — | 0.14 | 66 | 5 |
The textural properties obtained for the bulk TiO2 samples are in line with previous comments. TiO2-SA and TiO2-S1 samples present a type II isotherm with a high uptake at high P/P0, typical of nanoparticle aggregates, with a significant interparticular mesopore volume. Interestingly, the TiO2-S1 sample shows hysteresis at a lower P/P0 value when compared with TiO2-SA, indicating that mesopores are smaller in size (33 against 65 nm). Moreover, both samples show a non-negligible surface area of about 50–70 m2 g−1, typical for nanosized TiO2 materials, e.g. P25.25 In contrast, TiO2-S2 presents a type IV isotherm and a hysteresis in a range of 0.4–0.8 P/P0 (mesopores of about 5 nm), reflecting the presence of much smaller TiO2 particles. This latter sample also presents a surface area comparable to the TiO2-SA reference (66 m2 g−1). The SEM images of both sol–gel TiO2 samples corroborate the previous comments (see ESI† Fig. S2). The TiO2-S1 sample shows large and loosely aggregated particles, while TiO2-S2 presents smaller particles that easily aggregate to form coral-like nanostructures. Interestingly, this morphology was also found by Bahramian26 who used a very similar sol–gel recipe to synthesize their nanostructured TiO2 films (ethanol and aqueous acid solution). This difference in particle morphology also explains well the difference in pore sizes for the two samples: larger interparticular mesopores for TiO2-S1 (ca. 33 nm) and smaller mesopores for the TiO2-S2 sample (ca. 5 nm). Although it is difficult to determine the average size of the particles for both bulk TiO2 samples, these SEM images fairly agree with the crystallite's sizes determined from PXRD measurements (about 20 and 10 nm for TiO2-S1 and TiO2-S2 samples, respectively).
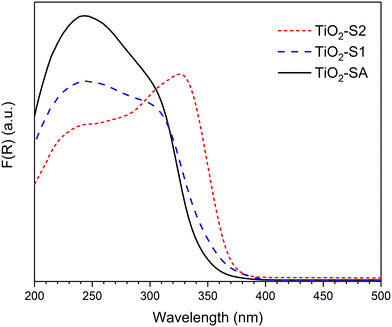
Fig. 2 presents the absorption spectra obtained for the 3 different TiO2 samples. In all cases, an intense and broad band below 400 nm can be observed, with maxima at ca. 240 and 300–330 nm. All the spectra agree well with those reported for bulk TiO2 materials. In particular, the band at 275–330 nm is well known to be the characteristic of bulk TiO2 (anatase or rutile).27,28 Interestingly, TiO2-SA and TiO2-S1 samples, which present similar crystallite sizes and the same anatase/rutile ratio also present a similar UV absorption profile, with a shoulder at about 310 nm. However, the pure anatase TiO2-S2 sample presents a different profile, with the most intense band appearing at a higher wavelength (ca. 330 nm).
Characterization of the TiO2-BEA composites
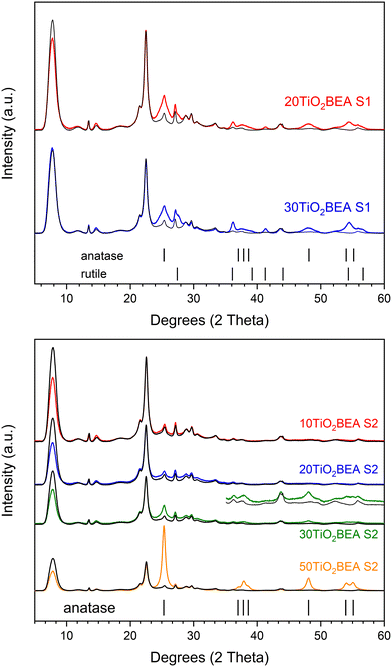 | ||
| Fig. 3 PXRD patterns of the different composite materials: (top) S1 series and (bottom) S2 series. For a better comparison, for each sample, the H-BEA pattern is compared. | ||
Regarding the S1 composite series, independently of the TiO2 amount, an increase in the intensity in the 24–28° region is observed and indicates the presence of both anatase and rutile phases in the final composites. This is confirmed by an increase in intensity at about 38, 48 and 56° (in 2θ). However, for the S2 composite series, the results are quite different. Below 30 wt% TiO2, no substantial differences are observed between the BEA zeolite and composite patterns. However, for TiO2 loading of 30 wt% or higher, clear differences between composite and raw BEA patterns can be observed, especially for the 50TiO2-BEA S2 sample. In this case, the XRD pattern is dominated by peaks corresponding to the anatase phase. Moreover, if diffraction peaks from the rutile phase can be easily identified for the series S1 composites, this phase is not observed for the S2 series samples. However, if both anatase and rutile phases can be identified for the S1 series at a relatively low TiO2 loading (20 wt%), this is not the case for the S2 series, where a higher amount of TiO2 is necessary to observe an anatase phase in the final composite patterns. Similar to what happens with the bulk TiO2 samples, the sol–gel preparation of composites under basic conditions seems to favour the presence of anatase only, whereas, under acidic conditions, both anatase and rutile phases appear.
The textural properties of the different composites are presented in Table 2. Fig. 4 shows the pore size distribution (PSD) curves obtained for the different materials, while Fig. S4 (in ESI†) illustrates the nitrogen isotherms of the respective materials. The H-BEA sample presents an isotherm that corresponds to type I at low relative pressure but also an important uptake for P/P0 > 0.4 and a subsequent H3 hysteresis, corresponding to the interparticle voids into and between aggregates. Consequently, the H-BEA sample presents a very large external surface area (205 m2 g−1) and a large mesopore volume. This is in agreement with the SEM images of H-BEA support, showing aggregates of very small particles (about 20–30 nm, see Fig. 5)29 (0.78 cm3 g−1). The different composites present essentially the same isotherm profile as the H-BEA support but with a systematic decrease in nitrogen uptake because of the presence of TiO2 (see Fig. S4†). This decrease in nitrogen adsorption for both series implies a decrease in both micropore and mesopore volumes, especially for the S2 series.
| Sample | Acidity properties | Textural properties | |||||
|---|---|---|---|---|---|---|---|
| B sitesa,b | L sitesa,b | B (350/150)c | V micro | V meso | S ext | S BET | |
| a Amount of Brønsted (B) and Lewis (L) acid sites (μmol) per gram of the composite determined at 150 °C. b In () amount of B and L acid sites (μmol) per g of zeolite determined at 150 °C. c B ratio = Brønsted acid sites at 350 °C/Brønsted acid sites at 150 °C. d cm3 g−1 (percentage of Vmicro considering only the amount of zeolite in the final composite material). e V meso = Vtotal − Vmicro (cm3 g−1). f From t-plot (m2 g−1). g SBET calculated in the P/P0 range of 0.05–0.3. | |||||||
| H-BEA | 553 (553) | 335 (335) | 0.49 | 0.17 (100) | 0.78 | 205 | 627 |
| 20TiO2-BEA S1 | 320 (399) | 296 (370) | 0.48 | 0.13 (96) | 0.50 | 211 | 541 |
| 30TiO2-BEA S1 | 185 (265) | 208 (297) | 0.50 | 0.11 (92) | 0.58 | 214 | 477 |
| 10TiO2-BEA S2 | 416 (462) | 368 (409) | 0.42 | 0.14 (92) | 0.77 | 241 | 575 |
| 20TiO2-BEA S2 | 365 (456) | 360 (450) | 0.37 | 0.12 (88) | 0.54 | 238 | 516 |
| 30TiO2-BEA S2 | 320 (457) | 290 (415) | 0.38 | 0.09 (76) | 0.55 | 314 | 522 |
| 50TiO2-BEA S2 | 223 (446) | 246 (492) | 0.38 | 0.06 (71) | 0.42 | 208 | 349 |
| TiO2-S2 | 0 | 108 | — | 0 | 0.14 | — | 66 |
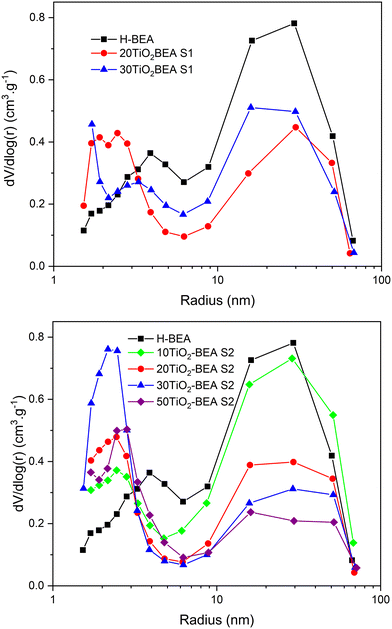 | ||
| Fig. 4 Pore size distribution curves (BJH, desorption branch) of TiO2-BEA composites: (top) S1 series and (bottom) S2 series. | ||
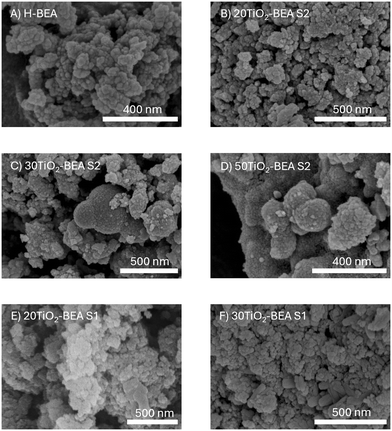 | ||
| Fig. 5 SEM images of the different composites: A) H-BEA, B) 20TiO2-BEA S2, C) 30TiO2-BEA S2, D) 50TiO2-BEA S2, E) 20TiO2-BEA S1 and F) 30TiO2-BEA S1 samples. | ||
However, for that later series, the external surface area increases when compared with pristine H-BEA support and S1 series composites. The PSD curves of the different samples show a decrease in the larger mesopores (20–30 nm) and a concomitant increase in the smaller mesopores (2–3 nm), especially for the samples of the S2 series. This observation could be explained by the fact that the amount of zeolite support decreases with the amount of TiO2; consequently, the interparticular mesoporosity derived from the zeolite nanoparticle aggregates decreases.
The SEM images of the different composites are shown in Fig. 5 together with the raw H-BEA support. As stated previously, zeolite support consists of aggregates of ca. 30 nm in size particles. Both 10TiO2-BEA S2 and 20TiO2-BEA S2 samples present an identical morphology and are very similar to the H-BEA sample (results not shown for the 10TiO2-BEA S2 sample for the sake of simplicity). For those samples that present low TiO2 loading, no significant difference can be observed with BEA support, i.e., TiO2 particles can hardly be observed. However, with the increase in the TiO2 loading (30–50 wt%), the coral-like morphology, characteristic of TiO2 nanoparticle aggregates (TiO2-S2 sample), is now visible, together with aggregates of larger particles coming from the BEA support (see Fig. 5).
The presence of these coral-like TiO2 aggregates might explain the presence of the hysteresis in the isotherms of the S2 series composites at about 0.5–0.8 P/P0 (see ESI,† Fig. S4, right) and the consequent increase, in the PSD curves in the contribution of the smaller pores (2–3 nm). One can note that the same hysteresis is also observed for bulk TiO2-S2 samples (cf.Fig. 1). However, for the TiO2-based S1 series, the results are quite different. Here, large particles with a distinct morphology, contrasting with the aggregates formed by the zeolite particles, can be observed for the 20TiO2-BEA S1 sample. These large platelet-like particles might correspond to the anatase/rutile phases detected in the XRD patterns of the respective samples. These isolated TiO2 nanoparticles are even more evident for the 30TiO2-BEA S1 sample.
As observed previously, the analysis of the XRD patterns of the different composites reveals that the intensity of the zeolite peaks gradually decreases with the increase in the TiO2 loading, whether other peaks (from TiO2 phases) appear or not. In particular, for the S2 series samples presenting a low TiO2 content (10–20 wt%), no extra peak is observed although the diffraction lines of the BEA support decrease substantially. This result suggests that TiO2 species might interact strongly with the zeolite surface without crystallization of a separated bulk crystalline TiO2 phase, as no extra phase can also be observed in the SEM images.
To obtain a more detailed insight into this S2 series samples (10–20 wt% TiO2), STEM analysis was performed. The results are shown in ESI† (Fig. S5) for both 10TiO2-BEA S2 and 20TiO2-BEA S2 samples. EDS analyses were crucial for understanding the distribution of titanium within the zeolite matrix. In the composite with 10 wt% TiO2, Ti is dispersed within the zeolite structure in smaller amounts than that observed for the 20 wt% TiO2 sample, as expected. No TiO2 nanocrystals are visible in the 10TiO2-BEA S2 sample. On the contrary, in the 20TiO2-BEA S2 sample, TiO2 nanocrystals of approximately 5 nm in size are observed (Fig. S6(f)†). The observed TiO2 nanocrystal was further investigated, and the HAADF-STEM image in the inset of Fig. S6(f)† clearly shows the Ti atom columns, with a measured lattice spacing of 3.8 Å, corresponding to the (100) and (010) atomic planes of the TiO2 anatase crystalline phase. Observed along the [001] zone axis, the angles between (100) and (010) measured in the FFT image are 90°, which is consistent with the theoretical value reported for pure crystalline TiO2 anatase (ICSD 9852). These STEM results also help in explaining the textural differences between the two composites series. In the case of the S2 samples, the presence of well-dispersed Ti atoms together with the presence of very small TiO2 nanoparticles strongly attached at the surface of the BEA support might cause the blockage of some micropores. Indeed, the decrease in the micropore volume is more significant for the S2 series than for the S1 series. The lower decrease in microporosity for these later samples should be justified by the weaker interaction between TiO2 nanoparticles and the BEA support.
Spectroscopic characterization of the TiO2-BEA composites
To obtain a better insight into the exact interaction between TiO2 species and BEA zeolite support, FTIR, UV-vis DRS, Raman and XPS experiments were performed. Fig. 6 shows the different FTIR reflectance spectra obtained for the composites and compared with the bulk TiO2-S1 oxide. The two other TiO2 bulk samples (spectra not shown) present the same features as TiO2-S1, a spectrum essentially dominated by a very large and intense band below 1000 cm−1 corresponding to Ti–O stretching.30 H-BEA support presents typical structural bands from BEA zeolite at 1230, 1070 and 790 cm−1.20 The intense band at about 1070 cm−1 corresponds to the asymmetric T–O–T stretching mode and is normally related to internal tetrahedra vibrations (T–O–T, T = Si, Al), while the shoulder at 1230 cm−1 corresponds to external tetrahedra linkages, which are more sensitive to the zeolite topology and/or the building units.31 The spectroscopic feature of this shoulder has been shown to change with the Si/Al ratio, zeolite structure amorphization, etc. When looking at the spectra of the composites, one can observe important differences when compared with the BEA sample. For all the composites, a band at about 950 cm−1 is observed for all the samples, except for the pristine BEA sample, which seems to be more prominent for the 10TiO2-BEA S2 sample. Additionally, for this sample, the strong band corresponding to asymmetric T–O–T stretching (1063 cm−1) is shifted when compared with all the other samples (1073 cm−1). The baseline also starts to tilt down below 900 cm−1.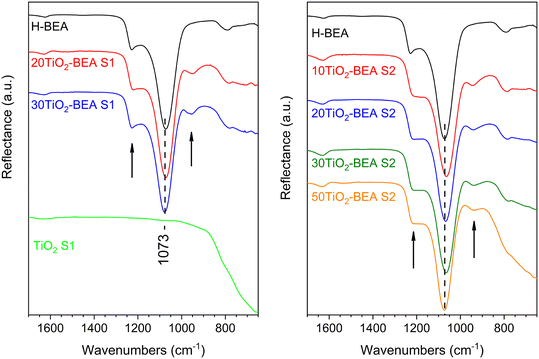 | ||
| Fig. 6 FTIR spectra of the different composite materials (ATR mode): (left), S1 series, and (right) S2 series (the arrows in both figures depict the bands at about 1230 and 950 cm−1). | ||
These two observations can be easily understood by considering the presence of various TiO2 species in the final composites. The band at ∼950 cm−1 has already been observed for TiO2-Y zeolite32 and TiO2-modified MCM-4133 systems, among others. It is generally related to either framework TiO4 or Ti interacting with TO4 species (T = Si or Al) and has been used as an indication of the presence of Ti–O–Si bonds in the respective materials20,27,32,33 or T–O–T bonds perturbed by Ti(VI) species.34 However, the baseline decrease indicates the presence of extra-framework Ti(IV) species in the form of bulk TiO2. Finally, for series S2 samples, the shoulder initially visible at 1230 cm−1 seems to vanish, probably indicating a stronger interaction between TiO2 species and the zeolite support surface for this series of composites.
Table 2 presents the acidity properties of the different samples determined using pyridine adsorption followed by FTIR spectroscopy. The results concerning the bulk TiO2-S2 sample are also presented for comparison: the sample only presents Lewis acid sites, i.e., no Brønsted acid sites are detected for this sample. The results obtained show an important decrease in the Brønsted acid site concentration with the amount of TiO2 in the final composites. In particular, the decrease in the Brønsted acidity seems to be more pronounced for the S1 series than for the S2 series, even if the support dilution is considered (Table 2). Interestingly, the Brønsted acidity strength, i.e., the ratio between the concentration of Brønsted acid sites at 350 and 150 °C (determined from pyridine desorption with temperature and followed by FTIR) is similar between the raw BEA zeolite and the S1 series samples (about 0.49) but decreases substantially for S2 series samples (0.38) (Table 2).
This result could be understood if one considers a change in the electronegativity of the zeolite surface for this S2 series due to the presence of strongly interacting TiOx species, considering that Ti is less electronegative than Al and Si (1.54 against 1.61 and 1.90, respectively). Another explanation might be that the interaction between TiO2 nanoparticles and the BEA surface could generate additional Brønsted acid sites. This has been observed by Doolin et al.35 who studied the acidity properties of titania-silica mixed oxides. They first concluded that both silica and titania oxides, taken separately, do not present any Brønsted acidity. Then, they verified that by combining the two oxides, Brønsted acidity could be generated, in a similar way to the silica-alumina system. They also concluded that the Brønsted acid sites generated are weaker than those found for YH zeolite material. In our case, the presence of weaker Brønsted acid sites could indicate a strong interaction between TiO2 nanoparticles and the BEA surface, resulting in the formation of these new Brønsted acid sites. However, the evolution of the Lewis acidity is not straightforward. All the spectra corresponding to the composite materials show an extra peak at about 1445 cm−1 together with the usual peak at 1455 cm−1 corresponding to pyridine adsorbed onto classical Al-based Lewis acid sites (see Fig. S6 in ESI†). According to El-Roz et al., the former peak corresponds to pyridine adsorbed onto a TiO2 Lewis acid site.20 Odenbrand and coworkers,36,37 who studied similar TiO2–SiO2 chemical systems, observed the existence of, not one, but two types of Lewis sites associated with the presence of Ti in TiO2–SiO2 systems, tetrahedrally coordinated Ti atoms in addition to the coordinately unsaturated octahedral Ti ions. These former tetrahedral sites were thought to be considerably stronger Lewis acid sites than their octahedral counterparts. In our case, as a decrease in the Lewis acidity strength is observed when TiO2 is present, one can speculate that these weak Lewis acid sites (see Fig. S6†), newly formed in the presence of TiO2, are associated with Ti species presenting octahedral coordination. The estimation of the amount of Lewis sites derived exclusively from TiO2 species present in the composites might be rather difficult. Nevertheless, one can observe that samples from the S2 series present a similar or even higher amount of total Lewis acid sites than BEA support alone (see Table 2) despite a lower micropore volume. Moreover, the S1 series samples present a similar Lewis acidity and a similar micropore volume. We can then conclude that, in the S2 samples, the highly dispersed TiO2 species and/or nanoparticles might contribute to a higher amount of Lewis acid sites.
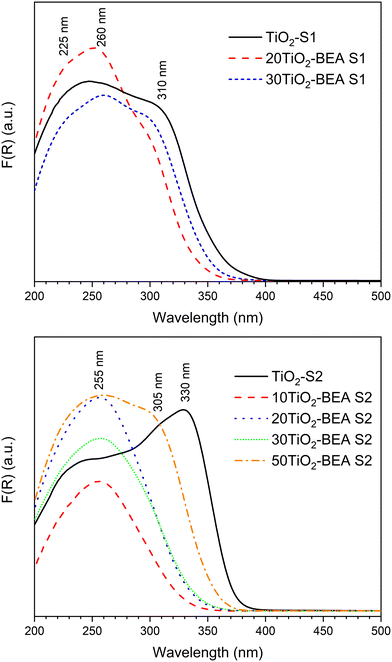
The UV-vis DRS spectra of the different composites are presented in Fig. 7. For the S1 series, the absorption spectra resemble the one of the bulk TiO2-S1 sample. The band at about 300–330 nm, characteristic of bulk TiO2 (anatase or rutile),27,28 is already present in both spectra, meaning that composites are essentially made of a mixture (zeolite/bulk TiO2) although with some TiO2 species interacting more strongly with the support (vide infra). However, for the S2 samples series, the behavior is quite different. For the S2 sample series with a low TiO2 content (10 and 20 wt%), the UV-vis DRS spectra are quite different from the bulk TiO2 S2 sample, as they do not present any band at 310–330 nm, but rather a band centered at 255 nm. This significant blue shift when compared with raw TiO2 materials is commonly interpreted in the literature as the size quantization effect,28,38,39 where the band maximum suffers a blue shift with the decrease in the TiO2 particle size. This decrease in particle size might also be responsible for higher light scattering, and decreasing absorbance cannot be ruled out. In our case, this decrease in wavelength could also be explained by the presence of poorly polymerized TiO2 species, interacting strongly with the zeolite surface, as revealed by XRD and FTIR results. The spectra of 30TiO2-BEA S2 and 50TiO2-BEA S2 samples, however, present a component at about 305 nm (a clear shoulder is observed for the later sample). Here, the TiO2 content is probably enough for the formation of a free bulk TiO2 phase, with almost no interaction with zeolite support, as confirmed by the SEM images (see Fig. 5). The band gap values, calculated from the Tauc plot curves, are presented in Table S1 (see ESI†). TiO2-SA was used as a reference (band gap of 3.33 eV, in agreement with the literature24). As expected from the UV-vis DRS spectra obtained, most of the composites have a band gap value between 3.2 and 3.5 eV. Interestingly, all the composites have a BG value higher than their respective bulk TiO2 references, meaning that all the composites present a blue-shift absorption when compared with respective references.
Several studies focusing on TiO2-based zeolite composites (especially BEA support) have shown the presence of TiO2 species other than anatase-like TiO2 oxide, i.e., mononuclear TiO2, TiO2 nanoclusters, extra-framework Ti species, etc., present at the surface of the zeolite support.16,40–42 In particular, the interesting work by Klaas et al.28 gives important insights concerning the definition of these Ti-based species: a) polymeric, anatase-like TiO2 species are characterized by an intense band above 300 nm (typically 310–330 nm); b) the absorption energies increase with a decrease in the coordination number. This is the reason why Ti(IV) species in a tetrahedral environment (TS-1, TS-2 materials) are characterized by an absorption band at about 200–210 nm; c) the absorption coefficient of cations usually rises by 1 or 2 orders if the coordination changes from centrosymmetry to noncentrosymmetry, or in other words, from ideal to strongly distorted octahedral or to lower coordination, meaning that low coordination/distorted Ti species present a strong absorption at a relatively low wavelength, even though these species are in low concentration in the material.
Following the above statements, we can more specifically define the different TiOx species that coexist simultaneously in our various TiO2-BEA composites. For a low TiO2 content, these TiO2 species might be essentially penta and/or hexacoordinated, either isolated or in oligomeric form, as they are characterized by absorption bands ranging from 225 to 255–270 nm. These TiOx species might also be coordinatively saturated because no changes occurred in the respective absorption spectra after dehydration (results not shown). We can also differentiate the S1 series samples from the S2 series samples. In fact, for the S1 series samples, anatase-like (highly polymerized) TiO2 species dominate because of the presence of a characteristic band above 300 nm. In the case of the S2 series samples, TiOx species, possibly penta/hexacoordinated, poorly oligomerized, and interacting strongly with the zeolite support might prevail. We will see, in the subsequent paragraphs, that both Raman and XPS spectroscopies results support the above findings.
Fig. 8 shows the Raman spectra of the different samples. For the S1 series samples, the Raman spectra are very similar and show two sets of lines at 153, 402, 522 and 642 cm−1, and 440 and 610 cm−1 which, according to the literature, are characteristics of anatase and rutile, respectively.21 In both cases, the fluorescence from the zeolite support is hidden by the strong signal from the respective TiO2 and appears in the spectrum background. However, the Raman spectra of the S2 series sample are dominated by a strong background usually observed for zeolite-based materials, which is normally explained by the fluorescence of organic species adsorbed onto the zeolite support and/or the presence of Fe present in the zeolite framework.43 Furthermore, for samples presenting a low TiO2 content, no peak characteristics of TiO2 can be observed. Nonetheless, the presence of TiO2 is confirmed for the samples with a higher TiO2 content (30 and 50 wt%), with a peak observed at about 144 cm−1 for both samples, despite the intense background generated by fluorescence. In the case of the 50TiO2-BEA S2 sample, three additional peaks with a very low intensity can also be observed at 402, 520 and 640 cm−1, confirming the presence of an anatase-like TiO2 phase. These Raman results clearly corroborate our prior conclusions. If the anatase and rutile phases seem to crystallize separately from the zeolite support for the S1 series samples, the same is not observed for the S2 series, where TiO2 might interact more strongly with the BEA support. This results in a loss of the centrosymmetry for the TiOx units, hence making the respective vibrations Raman inactive.28
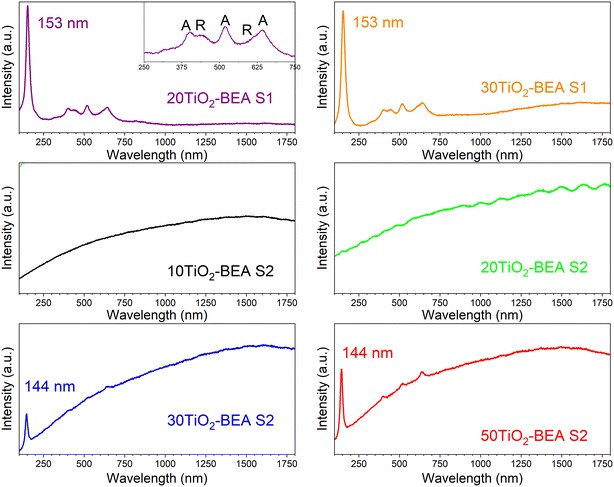 | ||
| Fig. 8 Raman spectra of the different BEA-based composites (532 nm laser) (inset: details of the spectrum in the region 250–750 nm). | ||
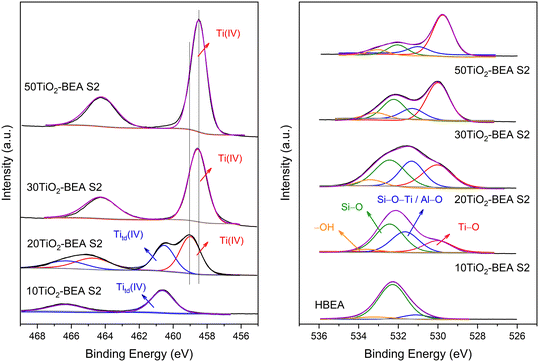
The Ti2p and O1s XPS spectra of the S2 series composites are presented in Fig. 9. For the 10TiO2-BEA S2 sample, the Ti2p region is dominated by a doublet at 466.3 and 460.6 eV corresponding to Ti2p1/2 and Ti2p3/2 components, respectively. These values are very different from those of bulk TiO2-SA, which shows peaks at 464.2 and 458.5 eV, typical values for polymeric TiO2 oxide (see ESI,† Fig. S5). These two-component peaks at higher energy are characteristic of Ti4+ in a tetrahedral environment/coordination, e.g., in many titanium-based silicate materials (TS-1,44 TS-245). However, according to Camblor and coworkers,46–48 this doublet high in energy does not necessarily mean that Ti(IV) species are present with a tetrahedral coordination but might also account for Ti species in octahedral sites. Indeed, these authors studied two natural titanosilicate minerals, ramsayite and benitoite, with distinct Ti species features. In the case of ramsayite, the distorted octahedral TiO6 units share two edges and one independent corner with other TiO6 octahedra (forming TiO6 chains) and corners with SiO4 tetrahedra; for benitoite, the symmetric TiO6 octahedra are isolated in the silica matrix, i.e., each TiO6 unit is only surrounded by SiO4 neighbors in the first shell.
The authors concluded that the presence of SiO4 units in the respective minerals causes a shift in the respective Ti2p signal to a higher energy. In their case, they observed a BE Ti2p3/2 peak at 459.8 and 460.2 eV for ramsayite and benitoite, respectively. In our case, the Ti2p3/2 contribution of the 10TiO2-BEA S2 sample is at 460.6 eV. Because this sample presents a maximum in the absorption spectrum at 250–260 nm and no changes are observed in the absorption spectrum after dehydration, we tentatively attribute this XPS signal to distorted octahedral Ti species, strongly interacting with the surface of the zeolite and probably highly dispersed, that is, poorly oligomerized (see STEM and Raman results). With the increase in Ti content in the composite (20TiO2-BEA S2 sample), a second doublet appears at 464.6 and 458.9 eV, with values closer to those found for anatase-like TiO2 materials.49,50 However, the Ti2p3/2 peak still presents a significant deviation from TiO2-SA (458.9 against 458.5 eV). Thus, for that sample, distorted octahedral Ti species coexist with very small TiO2 nanoparticles interacting strongly with the support (see STEM discussion). For higher TiO2 content (30 and 50 wt%), the spectra are dominated by a doublet at 464.2 and 458.5 eV, typical of bulk TiO2 oxide. However, the Ti2p spectra of the S1 series samples are very similar to bulk TiO2-SA (see Fig. S7†), which shows that polymeric TiO2 species are present in these samples.
The XPS spectra corresponding to the O1s region (Fig. 9, right) corroborate the previous conclusions well. HBEA support shows a main O1s signal at 532.3 eV attributed to Si–O–Si groups and two others, but less intense peaks at 531.1 and 533.2 eV, corresponding to Si–O–Al/Si–OH and H2O species, respectively.51 When Ti is introduced (10TiO2-BEA S2 sample), the band at 531.1 eV increases in intensity and shifts to 531.7 eV, while another band appears at 530.0 eV. Because the Si/Al ratio of the starting BEA support did not change with the introduction of Ti, the increase in the band at ca. 531.7 eV may be attributed to the Si–O–Ti groups, which were formed during the incorporation of Ti. The band appearing at a lower binding energy is attributed to the Ti–O groups. The appearance of these two bands agrees well with the formation of hexacoordinated TiO6 species, strongly attached to the zeolite support. With the further increase in Ti content in the composites, the band associated with Ti–O groups now dominates the O1s spectra, while the bands ascribed to Si–O–Si and Si–O–Ti species decrease in intensity although maintaining the same relative intensity. For these two samples, 30 and 50TiO2-BEA S2, the main TiO2 species can now be regarded as anatase-like TiO2 species.
Table 3 presents the results of the chemical analysis of the different composites. The experimental Si/Al and Si/Ti ratios determined from both the EDS and XPS analyses are presented together with the theoretical values. In the case of EDS analysis, the experimental results fairly agree with the theoretical ones for both Si/Al and Si/Ti ratios. As the composites are essentially composed of very small nanoparticles (20–40 nm), one can consider this EDS analysis a bulk analysis. However, XPS analysis is well known for providing information about the surface of the material. In this case, the experimental results differ significantly from the theoretical ones. For example, the experimental Si/Al ratio determined by XPS decreases with the amount of TiO2 in the final materials. This observation could be explained by the fact that the Si signal is more attenuated than the Al one.52 More interestingly, the experimental Si/Ti ratio is significantly lower than the expected one, which shows enrichment of Ti species at the surface of the composites compared with the bulk, in agreement with the aforementioned results.
| Sample | Si/Ti | Si/Al | Si/Ti | Si/Al | Si/Ti |
|---|---|---|---|---|---|
| EDS analysis | XPS analysis | ||||
| nd – not determined. | |||||
| H-BEA | 0 | — | — | 12.7 | — |
| 20TiO2-BEA S1 | 4.9 | 11.4 | 4.9 | nd | nd |
| 30TiO2-BEA S1 | 2.9 | 8.7 | 1.8 | nd | nd |
| 10TiO2-BEA S2 | 11.1 | 10.8 | 9.8 | 12.0 | 3.2 |
| 20TiO2-BEA S2 | 4.9 | 11.3 | 4.8 | 9.3 | 1.1 |
| 30TiO2-BEA S2 | 2.9 | 11.3 | 2.4 | 9.7 | 0.7 |
| 50TiO2-BEA S2 | 1.2 | 10.6 | 1.9 | 5.4 | 0.2 |
Evaluation of the performance of the TiO2-BEA composites in the photooxidation of ethylene
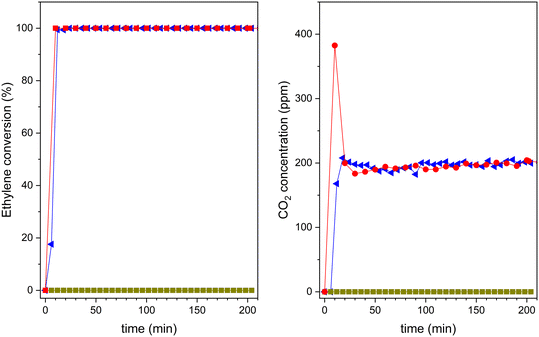
To analyse the advantages of TiO2-based zeolite composites compared with bulk TiO2, we analysed, in a first approach, the comparative performance under UV-vis radiation of the H-BEA support, the bulk TiO2-S2 sample and also the composite with intermediate TiO2 loading (20TiO2-BEA S2), considering that TiO2 is expected to be only active under UV-radiation. Moreover, because the samples possess an important porosity, to avoid any contribution of ethylene adsorption to the final conversion of the photocatalysts, all the samples were previously saturated in the dark. The corresponding breakthrough curves were recorded and allowed to determine the ethylene adsorption capacity of each sample (see Fig. 10). As expected, the porous support H-BEA shows an ethylene adsorption of about 13 μmol g−1, while the adsorption can be considered negligible for the bulk TiO2 sample. However, the 20TiO2-BEA S2 sample presents an intermediate ethylene adsorption capacity, with a value of 5 μmol g−1, due to the blockage of the support porosity. This result demonstrates the advantage of using a support such as zeolite, concentrating the ethylene close to the TiO2 photoactive species.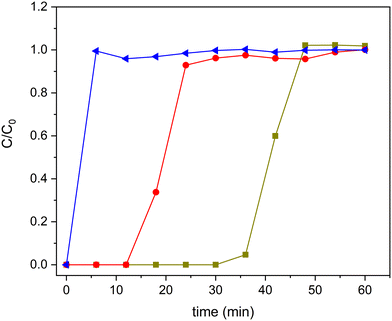 | ||
Fig. 10 Ethylene adsorption curves for samples H-BEA ( ), 20TiO2-BEA S2 ( ), 20TiO2-BEA S2 ( ) and TiO2-S2 ( ) and TiO2-S2 ( ) (C2H4 100 ppm, 25 cm3 min−1, RT). ) (C2H4 100 ppm, 25 cm3 min−1, RT). | ||
After saturation in the dark, the UV lamp is lighted on, and the photocatalytic reaction can proceed. The results obtained are shown in Fig. 11. Pristine zeolite support does not show any photocatalytic activity. However, both 20TiO2-BEA S2 and TiO2-S2 samples convert completely ethylene, with 100% selectivity to CO2. These results confirm that the composites selectively remove all the ethylene present in the gas stream. However, the pre-concentration of ethylene on the catalyst's surface makes the CO2 concentration profiles different for the two samples. The composite material presents a huge CO2 peak at the beginning of the experiment, which is not present for the bulk TiO2-S2 sample. This peak is due to the combustion of the pre-adsorbed ethylene on the composite during the adsorption step in the dark,53 indicating the beneficial effect of zeolite support in concentrating ethylene.
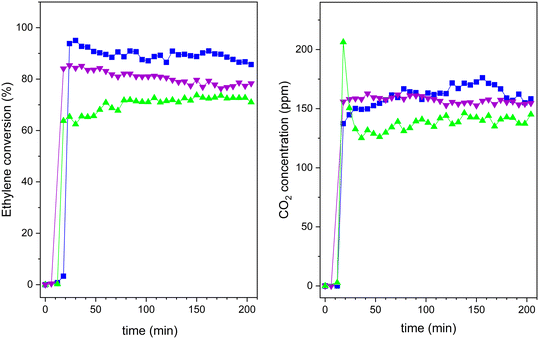
As mentioned above, although 20TiO2-BEA S2 presents a lower TiO2 amount when compared with the TiO2-S2 sample, the photocatalyst can still completely convert ethylene. This result clearly shows the advantages of using a zeolite-based photocatalytic material. The UV results concerning the other composites can be found in the ESI† (Fig. S8). Nonetheless, from the viewpoint of the economy and sustainability of the processes, the great challenge is to improve the performance of TiO2 under visible (solar) light regarding artificial UV light. Thus, after demonstrating good performance under UV, the different composites were compared under UVA-vis radiation. The results are presented in Fig. 12. It is noteworthy that these photocatalytic results have been obtained under dynamic gas-phase conditions, which could present high interest in photocatalytic oxidation applications.5
The efficiency of the photooxidation process decreased under UVA-vis irradiation. This lower photocatalytic performance can be explained by the smaller energy of the radiation but also by the fact that the samples present a lower absorption in the UV-vis range (Fig. 7), which limits the excitation of the active sites. This fact is notorious for all the samples and, in particular, for the S2 sample. However, when comparing the performance of the different samples (Fig. 12), the composite prepared under a basic medium presents a higher ethylene conversion when compared with its counterparts obtained under an acidic medium. As expected, the conversion increased with increasing TiO2 loadings from 20 to 30 wt% in the S1 series. Nevertheless, the 20TiO2-BEA S2 sample maintained a high performance, even better than 30TiO2-BEA S1, but without reaching 100% conversion, as the samples demonstrated in the previous UV experiments.
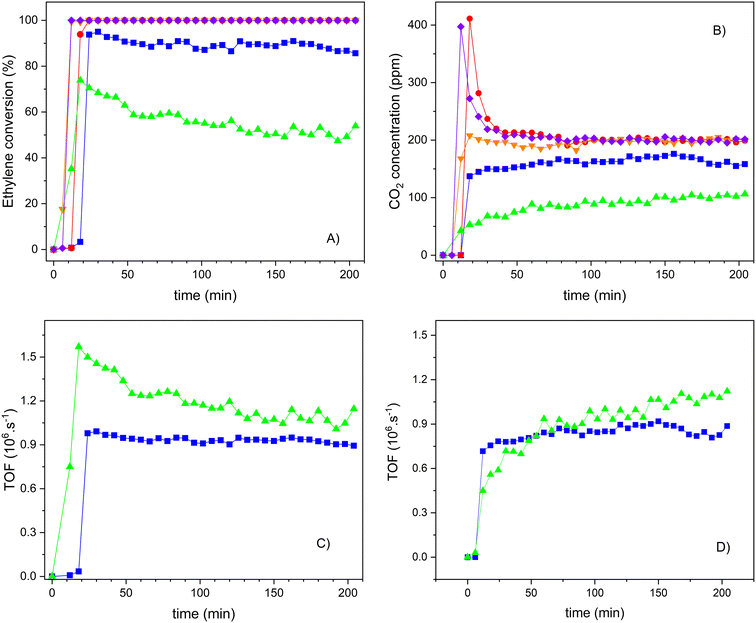
Therefore, the following results, depicted in Fig. 13, only concern the influence of the TiO2 concentration on the photocatalytic performance of the S2 series samples. In this case, the reference material TiO2-S2 was also included for comparison. As it was already observed for the S1 series samples, here we can observe that the ethylene conversion also increases with the TiO2 loading, and samples with a TiO2 wt% of 30 or higher show a 100% conversion of ethylene, as the bulk TiO2-S2 sample does. The crystallization of isolated TiO2 nanoparticles (see the SEM results) might contribute to this total ethylene conversion. However, CO2 is always the only product of the reaction, as confirmed by the carbon balance. As shown in Fig. 11, one of the differences in performance between composites and pure TiO2 is the capacity of the former to oxidize ethylene molecules previously adsorbed. Under UV-radiation, this occurs for sample 20TiO2-BEA S2 but not under vis-radiation (Fig. 13B) or for sample 10TiO2-BEA S2. This oxidation of pre-adsorbed ethylene occurs only for the samples with higher TiO2 loadings, such as 30 and 50TiO2-BEA S2 ones. As ethylene adsorption should decrease with increasing TiO2 loadings (because the porosity of the composites decreases), this difference in behaviour might reveal a difference in nature of the active sites, with low TiO2 composites clearly inactive for the oxidation of pre-adsorbed ethylene, as no CO2 peaks at the reaction beginning can be observed. These results agree with the XPS results, which show a clear difference in the nature of the active sites between samples with low and high loadings. Logically, the bulk TiO2-S2 sample does not show any CO2 peak at the beginning of the experiment, as it shows no ethylene adsorption capacity (see Fig. 13B).
To understand the reactivity of the different active sites on the composites, the results were expressed and compared in terms of TOF for the 10 and 20TiO2-BEA S2 samples, as higher loadings lead to total conversion and thus cannot be compared (see Fig. 13C and D). Although the samples present very different conversion values, the activity for both composites is very similar after 3 h on stream (TOF of about 1.10−6 s−1). Clearly, the photocatalytic sites seem to be more active at low loading although they seem to undergo significant deactivation, which could occur also, to a lesser extent, for sample 20TiO2-BEA S2. Curiously, while the profile of either TOF or ethylene conversion decreased with time on stream for the samples with lower loadings, the formation of CO2 increased (Fig. 13D). This is a consequence of some ethylene pre-adsorbed in these samples and not oxidized but that desorbs under radiation because the light is not powerful enough to oxidize the species but only to desorb it, decreasing the ethylene conversion values. This means that the deactivation observed is only apparent. With the ethylene being desorbed, the freshly free active sites can interact with additional ethylene molecules or activate O2 to produce peroxide radicals, which, in turn, oxidize the ethylene molecules. Additional experiments are required to address this question, in order to elucidate the reaction mechanisms involved (Langmuir–Hinshelwood or Eley–Rideal) and to better define the correlation between the different photoactive sites.
Nevertheless, one can see that the TiO2-BEA composites demonstrate excellent performance in the photooxidation of ethylene although with a lower amount of TiO2 when compared with bulk TiO2 materials. Here, the zeolite support seems to be a key point in the excellent photocatalytic performance of the nanocomposites, acting in distinct ways: a) by allowing good dispersion and accessibility of the TiO2 photoactive phase, namely both isolated TiO2 species and TiO2 nanoparticles, b) by gathering and concentrating ethylene molecules close to the photoactive sites and c) by limiting or delaying the recombination of the electron–hole pairs, a paramount parameter for the photodegradation process (see Scheme 1).
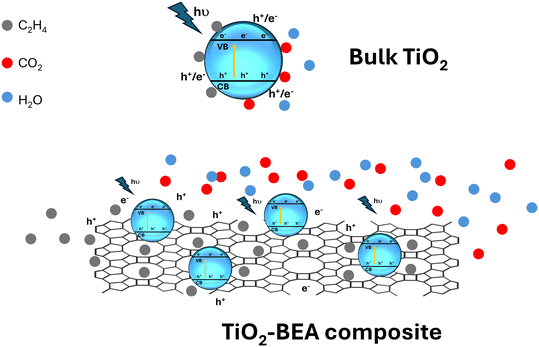 | ||
| Scheme 1 Illustration of the adsorption and the photocatalytic degradation of ethylene on the surface of bulk TiO2vs. zeolite-based TiO2 composites. | ||
Experimental
Materials and methods
Commercial zeolite parent (NH4-BEA, Si/Al of 12.5, i.e. CP814E) was purchased from Zeolyst. Titanium isopropoxide (97% w/w) and titanium dioxide (TiO2-SA) were purchased from Sigma Aldrich. HNO3 (65% w/w) was purchased from Panreac, NH4OH (25% NH3) was obtained from Fluka, and ethanol absolute (99.5% w/w) and 2-propanol (99.8% w/w) were both supplied by Honeywell.Preparation of TiO2/BEA composites
TiO2/BEA composites were prepared by applying the sol–gel method, using two distinct approaches combining different solvents and catalysts: 2-propanol/HNO3 and ethanol/NH4OH. Samples prepared under acidic or basic medium are denoted as S1 or S2, respectively.For both methods, by changing the initial amount of Ti precursor in the alcoholic solution, BEA samples with 20–30 wt% (S1 method) or 10–50 wt% TiO2 (S2 method) are obtained. Moreover, for comparison, 2 TiO2 bulk reference samples, using the same sol–gel methods but without zeolite, were also prepared (TiO2-S1 and TiO2-S2). TiO2/BEA composites are named as follows: xTiO2-BEA SI, where x represents the amount of TiO2 (wt%) and SI represents the method used (S1 for 2-propanol/HNO3 and S2 for ethanol/NH4OH, respectively). Table 4 lists all the samples prepared for the ethylene photooxidation experiments.
| Sample | Alcohol | Catalyst | TiO2 (wt%) |
|---|---|---|---|
| HBEA | — | — | — |
| 20TiO2-BEA S1 | 2-Propanol | HNO3 | 20 |
| 30TiO2-BEA S1 | 2-Propanol | HNO3 | 30 |
| TiO2-S1 | 2-Propanol | HNO3 | 100 |
| 10TiO2-BEA S2 | Ethanol | NH4OH | 10 |
| 20TiO2-BEA S2 | Ethanol | NH4OH | 20 |
| 30TiO2-BEA S2 | Ethanol | NH4OH | 30 |
| 50TiO2-BEA S2 | Ethanol | NH4OH | 50 |
| TiO2-S2 | Ethanol | NH4OH | 100 |
Composite characterization
The composites were characterized by different techniques. Powder X-ray diffraction patterns were recorded using a D8 Advance diffractometer (Bruker) with Cu Kα radiation filtered by Ni and a 1D LynxEye detector. Quantitative phase analysis and crystallite size measurements were performed by applying the Rietveld/whole pattern fitting method (fundamental parameters approach) with TOPAS V.5 software from Bruker AXS. Nitrogen sorption experiments were performed using Autosorb IQ equipment from Quantachrome. Before each measurement, the samples were outgassed first at 90 °C and then at 350 °C for 1 and 5 h, respectively. DRS UV-visible spectra were recorded using a Praying Mantis diffuse reflectance accessory coupled to a Cary 5000 spectrophotometer (Varian). The band gap (Eg) of the different materials was calculated from the corresponding Tauc plots (indirect method54). X-ray photoelectron spectroscopy (XPS) was carried out using a Physical Electronics VersaProbe II apparatus with a MgKα X-ray source (hν = 1486.6 eV) working at 1.3 eV and 20 mA, and a hemispherical electron analyser. Infrared spectra (KBr method) were obtained in transmission mode, with pellets consisting of samples diluted with KBr (0.5 wt%). Pyridine adsorption, followed by FTIR, was performed in line with previous work.55 The following molar extinction coefficients, determined in our IR setup, were used (εB = 0.91 and εL = 1.58 cm μmol−1, for Brønsted and Lewis acid sites at 1545 and 1455–45 cm−1). A Thermo Nicolet Nexus 960 spectrometer was used in both cases. Raman spectra were collected using Labram HR 800 Evolution equipment from Horiba, Jobin Yvon. Spectra were obtained with a 532 nm excitation source and a laser power of ca. 10 mW. Data were collected for 10 s and 4 accumulations using a 100× objective lens. SEM images were acquired using a Hitachi Regulus 8220 Scanning Electron Microscope equipped with an energy dispersive X-ray spectrometer (EDS) from Oxford Instruments. Scanning Transmission Electron Microscopy (STEM) analyses, including High-Angle Annular Dark-Field (HAADF) imaging, were carried out using a Hitachi HF5000 field-emission transmission electron microscope operating at 200 kV equipped with a 100 mm2 EDS detector from Oxford Instruments. A drop of the sonicated dispersions was applied to the lacey-carbon copper grids and left to dry prior to STEM observation.Ethylene adsorption and photodegradation experiments
The experimental setup utilized was the same one used by Regadera-Macías et al.53 Before ethylene photodegradation experiments, samples are pre-treated in a muffle at 250 °C for 25 min to clean up the surface of the materials. Composites are then loaded into a quartz reactor (0.45 g) operating at atmospheric pressure. A total flow of 25 cm3 min−1 was used with the following mixture of gases (100 ppm C2H4/He 5%/O2 21%, N2). Before each photocatalytic experiment, the gas mixture is allowed to pass through the sample under the dark to reach ethylene adsorption equilibrium; the corresponding breakthrough curves are recorded and properly analysed. The sample is then irradiated with a medium-pressure mercury lamp equipped with a cooling jacket (irradiation spectrum is shown in Fig. S9, ESI†). Depending on the cooling jacket material used, quartz, or glass, experiments can be conducted under UV-vis or UVA-vis illumination, respectively. The glass jacket completely removes the radiation for λ < 300 nm, while the UVA-vis radiation with λ > 350 nm corresponds to 74% of the lamp irradiation power. The total time for each reaction was 3 h and 30 min.Conclusions
This study reports the use of two different sol–gel methods for the preparation of photocatalytic TiO2-based zeolite (BEA) composites. The main idea here is to prepare photoactive composites that are highly efficient for the photodegradation of ethylene and can integrate photocatalytic devices to control ethylene in industrial cold storage facilities. The two synthesis strategies changed when using either an acidic or a basic medium during the sol–gel preparation of the TiO2 nanoparticles, as the zeolite support was introduced before the titanium precursor hydrolysis step. The two synthesis strategies resulted in photocatalytic composites with distinct properties. For the samples prepared under an acidic medium, the isolated TiO2 nanoplatelets crystallized separately from the zeolite support. However, for the samples obtained under basic conditions, a stronger interaction between the growing TiO2 nanoparticles and the zeolite support was found, leading to highly dispersed TiO2 nanoparticles over the BEA zeolite support. Moreover, the resulting photocatalytic composites demonstrated excellent performance in the photooxidation of ethylene, despite a rather low amount of TiO2 when compared with bulk TiO2 material, prepared without the zeolite support and used as photocatalytic reference. Here, the BEA support was shown to be decisive in the excellent photocatalytic performance of the nanocomposites, as the zeolite support might exhibit different but distinct roles in: a) allowing a good dispersion and accessibility of the TiO2 photoactive phase, namely both isolated TiO2 species and TiO2 nanoparticles, b) gathering and concentrating ethylene molecules close to the photoactive sites and c) limiting or delaying the electron–hole pair recombination, a paramount parameter for the photodegradation process. Finally, photocatalysis might be a really promising ethylene removal technology capable of competing with the conventional technologies currently used in industrial cold storage facilities. However, significant efforts must be made to reach a level of technology that is as mature as those found in indoor air treatments. This means a great effort in what concerns the design and engineering of photoreactors. Our TiO2-BEA photocatalysts, tested under continuous gas-phase conditions, have proven to be good candidates for this purpose.Data availability
The data supporting this article have been included as part of the ESI.†Author contributions
R. F.: writing – original draft; investigation; S. M. T.: methodology, data curation, writing – review & editing, supervision; L. M. P. M.: data curation, formal analysis, writing – review & editing, supervision. F. J. M. H.: conceptualization, validation; resources, project administration, funding acquisition, writing – review & editing, supervision; J. P. L.: conceptualization, writing – review & editing; J. M. S.: writing – review & editing; I. M. J.: writing – review & editing; M. F. R.: conceptualization, resources, project administration, funding acquisition, writing – review & editing; supervision; A. F.: conceptualization, investigation, writing – review& editing, supervision.Conflicts of interest
There are no conflicts to declare.Acknowledgements
The authors thank FCT for providing funding through projects Nano4fresh-PRIMA/0015/2019 (http://doi.org/10.54499/PRIMA/0015/2019), UIDB/00100/2020 (CQE) (https://doi.org/10.54499/UIDB/00100/2020), UIDP/00100/2020 (CQE) (https://doi.org/10.54499/UIDP/00100/2020), UIDB/00097/2020 (CEGIST) (https://doi.org/10.54499/UIDB/00097/2020) and LA/P/0056/2020 (IMS) (https://doi.org/10.54499/LA/P/0056/2020), project PCI2020-112045 from MCIN/AEI/10.13039/501100011033 and European Union Next Generation EU/PRTR; and partially by projects PID2021-126579OB-C31 funded through MCIN/AEI/10.13039/501100011033 and “ERDF A way of making Europe”; P21_00208 from Consejería de Universidad, Investigación e Innovación – Junta de Andalucía. SMT is grateful to MCIN/AEI/10.13039/501100011033 and the European Social Found (FSE) “El FSE invierte en tu futuro” for a Ramon y Cajal research contract (RYC-2019-026634-I). A. F. thanks Instituto Superior Técnico for the Scientific Employment contract under law DL 57/2016. R. Ferreira also thanks FCT for the PhD grant (2022.12593.BD).Notes and references
- M. H. Álvarez-Hernández, F. Artés-Hernández, F. Ávalos-Belmontes, M. A. Castillo-Campohermoso, J. C. Contreras-Esquivel, J. M. Ventura-Sobrevilla and G. B. Martínez-Hernández, Food Bioprocess Technol., 2018, 11, 511–525 CrossRef
.
- S. Anand and M. K. Barua, Comput. Electron. Agric., 2022, 198, 106936 CrossRef
.
-
Controlled Atmosphere Storage of Fruit and Vegetables, ed. A. K. Thompson, R. K. Prange, R. D. Bancroft and T. Puttongsiri, CABI, 3rd edn, 2018 Search PubMed
.
- H. Wei, F. Seidi, T. Zhang, Y. Jin and H. Xiao, Food Chem., 2021, 337, 127750 CrossRef CAS
.
- N. Keller, M.-N. Ducamp, D. Robert and V. Keller, Chem. Rev., 2013, 113, 5029–5070 CrossRef CAS PubMed
.
-
N. Pathak and P. Mahajan, in Reference Module in Food Science, Elsevier, 2017 Search PubMed
.
- Q. Zhang, G. Xie, M. Duan, Y. Liu, Y. Cai, M. Xu, K. Zhao, H. Tai, Y. Jiang and Y. Su, ACS Appl. Nano Mater., 2023, 6, 17445–17456 CrossRef CAS
.
- K. Hashimoto, H. Irie and A. Fujishima, Jpn. J. Appl. Phys., 2005, 44, 8269 CrossRef CAS
.
- W. Zhang and J.-W. Rhim, Food Packag. Shelf Life, 2022, 31, 100806 CrossRef CAS
.
- J. de M. Fonseca, M. J. dos S. Alves, L. S. Soares, R. de F. P. M. Moreira, G. A. Valencia and A. R. Monteiro, Food Res. Int., 2021, 144, 110378 CrossRef CAS
.
- Q. Sun, N. Wang and J. Yu, Adv. Mater., 2021, 33, 2104442 CrossRef CAS
.
-
G. Bellussi and R. Millini, in Structure and Reactivity of Metals in Zeolite Materials, ed. J. Pérez Pariente and M. Sánchez-Sánchez, Springer International Publishing, Cham, 2018, pp. 1–52 Search PubMed
.
- Y. Xu and C. H. Langford, J. Phys. Chem. B, 1997, 101, 3115–3121 CrossRef CAS
.
- M. Lafjah, F. Djafri, A. Bengueddach, N. Keller and V. Keller, J. Hazard. Mater., 2011, 186, 1218–1225 CrossRef CAS PubMed
.
- M. Anpo and M. Takeuchi, J. Catal., 2003, 216, 505–516 CrossRef CAS
.
- X. Liang, X. Peng, C. Xia, H. Yuan, K. Zou, K. Huang, M. Lin, B. Zhu, Y. Luo and X. Shu, Ind. Eng. Chem. Res., 2021, 60, 1219–1230 CrossRef CAS
.
- Z. Yang, Q. Yu, Y. Guo, X. Wu, H. Wang, J. Han, Q. Ge and X. Zhu, Microporous Mesoporous Mater., 2022, 330, 111625 CrossRef CAS
.
- M. Mahalakshmi, S. Vishnu Priya, B. Arabindoo, M. Palanichamy and V. Murugesan, J. Hazard. Mater., 2009, 161, 336–343 CrossRef CAS
.
- J. Fernández-Catalá, M. Sánchez-Rubio, M. Navlani-García, Á. Berenguer-Murcia and D. Cazorla-Amorós, ACS Omega, 2020, 5, 31323–31331 CrossRef
.
- M. El-Roz, L. Lakiss, J. El Fallah, O. I. Lebedev, F. Thibault-Starzyk and V. Valtchev, Phys. Chem. Chem. Phys., 2013, 15, 16198–16207 RSC
.
- A. Molea, V. Popescu, N. A. Rowson and A. M. Dinescu, Powder Technol., 2014, 253, 22–28 CrossRef CAS
.
- S. T. Aruna, S. Tirosh and A. Zaban, J. Mater. Chem., 2000, 10, 2388–2391 RSC
.
- M. Bahar, M. Mozaffari and S. Esmaeili, J. Theor. Appl. Phys., 2017, 11, 79–86 CrossRef
.
- A. Indekeu, E. Bailón-García, A. Fernandes, R. Baltazar, A. M. Ferraria, A. M. B. do Rego and M. Filipa Ribeiro, Catal. Today, 2021, 379, 272–284 CrossRef CAS
.
- T. Ohno, K. Sarukawa, K. Tokieda and M. Matsumura, J. Catal., 2001, 203, 82–86 CrossRef CAS
.
- A. Bahramian, Ind. Eng. Chem. Res., 2013, 52, 14837–14846 CrossRef CAS
.
- F. Geobaldo, S. Bordiga, A. Zecchina, E. Giamello, G. Leofanti and G. Petrini, Catal. Lett., 1992, 16, 109–115 CrossRef CAS
.
- J. Klaas, G. Schulz-Ekloff and N. I. Jaeger, J. Phys. Chem. B, 1997, 101, 1305–1311 CrossRef CAS
.
- A. F. Silva, A. Fernandes, P. Neves, M. M. Antunes, S. M. Rocha, M. F. Ribeiro, C. M. Silva and A. A. Valente, ChemCatChem, 2018, 10, 2741–2754 CrossRef CAS
.
- Y. Kissoum, D. E. Mekki, M. Bououdina, E. Sakher and S. Bellucci, J. Supercond. Novel Magn., 2020, 33, 427–440 CrossRef CAS
.
-
E. M. Flanigen, H. Khatami and H. A. Szymanski, in Molecular Sieve Zeolites-I, American Chemical Society, 1974, vol. 101, pp. 16–201 Search PubMed
.
- H. Chen, A. Matsumoto, N. Nishimiya and K. Tsutsumi, Colloids Surf., A, 1999, 157, 295–305 CrossRef CAS
.
- S. Zheng, L. Gao, Q. Zhang and J. Guo, J. Mater. Chem., 2000, 10, 723–727 RSC
.
- Y. Xu and C. H. Langford, J. Phys. Chem., 1995, 99, 11501–11507 CrossRef CAS
.
- P. K. Doolin, S. Alerasool, D. J. Zalewski and J. F. Hoffman, Catal. Lett., 1994, 25, 209–223 CrossRef CAS
.
- C. U. Ingemar Odenbrand, J. G. M. Brandin and G. Busca, J. Catal., 1992, 135, 505–517 CrossRef
.
- C. U. Ingemar Odenbrand, S. Lars, T. Andersson, L. A. H. Andersson, J. G. M. Brandin and G. Busca, J. Catal., 1990, 125, 541–553 CrossRef
.
- S. Yamazaki, S. Tanaka and H. Tsukamoto, J. Photochem. Photobiol., A, 1999, 121, 55–61 CrossRef CAS
.
- M. V. P. Sharma, V. Durgakumari and M. Subrahmanyam, J. Hazard. Mater., 2008, 160, 568–575 CrossRef CAS PubMed
.
- N. Hoeven, G. Mali, M. Mertens and P. Cool, Microporous Mesoporous Mater., 2019, 288, 109588 CrossRef CAS
.
- V. Durgakumari, M. Subrahmanyam, K. V. Subba Rao, A. Ratnamala, M. Noorjahan and K. Tanaka, Appl. Catal., A, 2002, 234, 155–165 CrossRef CAS
.
- M. El-Roz, P. Bazin and F. Thibault-Starzyk, Catal. Today, 2013, 205, 111–119 CrossRef CAS
.
- P.-P. Knops-Gerrits, D. E. De Vos, E. J. P. Feijen and P. A. Jacobs, Microporous Mater., 1997, 8, 3–17 CrossRef CAS
.
- H. She, G. Ding, X. Li, H. Wang, D. Cao, Y. Zhu and Y. Li, J. Fuel Chem. Technol., 2021, 49, 1148–1160 CrossRef CAS
.
- D. T. On, L. Bonneviot, A. Bittar, A. Sayari and S. Kaliaguine, J. Mol. Catal., 1992, 74, 233–246 CrossRef CAS
.
- M. A. Camblor, A. Corma, A. Martínez and J. Pérez-Pariente, J. Chem. Soc., Chem. Commun., 1992, 589–590 RSC
.
- T. Blasco, M. A. Camblor, A. Corma and J. Perez-Pariente, J. Am. Chem. Soc., 1993, 115, 11806–11813 CrossRef CAS
.
- T. Blasco, M. A. Camblor, J. L. G. Fierro and J. Pérez-Pariente, Microporous Mater., 1994, 3, 259–263 CrossRef CAS
.
- S. Praserthdam, M. Rittiruam, K. Maungthong, T. Saelee, S. Somdee and P. Praserthdam, Sci. Rep., 2020, 10, 18952 CrossRef CAS
.
- G. I. Supelano, F. Mesa, C. A. P. Vargas, J. A. M. Gómez and A. Dussan, Sci. Rep., 2023, 13, 3650 CrossRef CAS
.
- A. Walkowiak, L. Wolski and M. Ziolek, Molecules, 2020, 25(24), 5781 CrossRef CAS
.
- J. Matthew, Surf. Interface Anal., 2004, 36, 1647 CrossRef CAS
.
- A. M. Regadera-Macías, S. Morales-Torres, L. M. Pastrana-Martínez and F. J. Maldonado-Hódar, Catal. Today, 2023, 413–415, 113932 CrossRef
.
- P. Makuła, M. Pacia and W. Macyk, J. Phys. Chem. Lett., 2018, 9, 6814–6817 CrossRef PubMed
.
- J. M. Silva, M. F. Ribeiro, I. Graça and A. Fernandes, Microporous Mesoporous Mater., 2021, 323, 111170 CrossRef CAS
.
Footnote |
| † Electronic supplementary information (ESI) available. See DOI: https://doi.org/10.1039/d4lf00286e |
| This journal is © The Royal Society of Chemistry 2025 |

