 Open Access Article
Mitigating polysulfide crossover in lithium–sulfur batteries with polymer-coated separators†
R. Blake
Nuwayhid
 a,
Junghoon
Yeom
b,
Hunter O.
Ford
a,
Zachary G.
Neale
c,
Michael W.
Swift
d,
Noam
Bernstein
d,
Rachel E.
Carter
c and
Jeffrey W.
Long
a,
Junghoon
Yeom
b,
Hunter O.
Ford
a,
Zachary G.
Neale
c,
Michael W.
Swift
d,
Noam
Bernstein
d,
Rachel E.
Carter
c and
Jeffrey W.
Long
 *c
*c
aNational Research Council Postdoctoral Associate, U.S. Naval Research Laboratory, Washington, DC, USA
bMultifunctional Materials Branch (Code 6350), U.S. Naval Research Laboratory, Washington, DC, USA
cSurface Chemistry Branch (Code 6170), U.S. Naval Research Laboratory, Washington, DC, USA. E-mail: jeffrey.w.long26.civ@us.navy.mil
dCenter for Materials Physics and Technology (Code 6390), U.S. Naval Research Laboratory, Washington, DC, USA
First published on 16th December 2024
Abstract
Lithium–sulfur (Li–S) batteries promise high energy density and sustainability advantages by using earth-abundant sulfur as a key component, yet practical performance is limited by the complexity of sulfur-based redox reactions. One key challenge is the dissolution and redistribution of soluble lithium polysulfide (LiPS) intermediates from the sulfur cathode, which leads to irreversible loss of active material, poor cycle life, and high self-discharge rates. To ameliorate this issue, we use initiated chemical vapor deposition (iCVD) to conformally coat conventional polyolefin separators with an ultrathin (40–400 nm) copolymer, poly(divinylbenzene-co-(dimethylaminomethyl)styrene). This pDVB-co-DMAMS copolymer is designed with amine functionalities to interact with LiPSs and mitigate cathode-to-anode crossover, while DVB comonomer units serve as cross-linkers that improve mechanical integrity. We evaluate the electrochemical properties of prototype Li–S cells that include pDVB-co-DMAMS-coated separators and sulfur-infused carbon nanofoam paper cathodes. Separators with the thickest pDVB-co-DMAMS coating (400 nm) provide extended protection against self-discharge, while 40 nm pDVB-co-DMAMS coatings enable the highest overall rate capability and cycling stability while still maintaining reasonably low self-discharge rates. Post-cycling analysis of anode, separator, and cathode components, in conjunction with computational efforts, confirms that pDVB-co-DMAMS delays LiPSs crossover through chemical adsorption in the polymer-coated separator. The pDVB-co-DMAMS-coated separators also interact with Li metal anode to form favorable chemical speciation at the solid-electrolyte interphase that stabilizes the Li surface for Li–S cell operation.
Introduction
Lithium–sulfur (Li–S) batteries are emerging as a promising energy-storage alternative to conventional lithium-ion batteries (LIBs) by offering the advantages of an earth-abundant cathode material (sulfur) that also exhibits high specific capacity (1675 mA h g−1 theoretical). Pairing sulfur-based cathodes with Li metal anodes yields a materials-level theoretical specific energy of ∼2500 W h kg−1.1–3 Practical packaged Li–S cells typically achieve ∼400 W h kg−1,4 with energy content varying with such factors as cathode thickness and sulfur loading. Because elemental sulfur is a poor electron conductor, Li–S cathodes must be constructed to include appreciable amounts of conductive carbon. Advanced porous carbons have been designed as sulfur hosts to further optimize mass, volume, and areal capacity values for sulfur-based cathodes.3,5,6The high specific capacity of sulfur-based electrodes arises from the conversion reaction between elemental sulfur and lithium sulfide (S8 + 16Li+ + 16e− ↔ 8 Li2S), which proceeds through a complex pathway involving multiple soluble polysulfides. These intermediate lithium polysulfides (LiPSs), including Li2S8, Li2S6, and Li2S4, unavoidably dissolve in the electrolyte during cycling, leading to active material loss at the cathode. Such polysulfide species may also cross over to the Li anode where they are chemically reduced, then diffuse back to the cathode to be re-oxidized in a process described as the polysulfide shuttle effect.7,8 The combination of these polysulfide-based processes results in rapid capacity fade and high self-discharge rates during the operation of Li–S batteries, limiting the practical application of this otherwise promising energy-storage technology.
Several materials strategies have been used to address the problems imposed by these polysulfide shuttle effects, including: (i) physical confinement or chemical interaction of LiPSs within the sulfur-containing cathode; (ii) optimization of electrolyte composition to reduce LiPSs solubility or using solid-state electrolytes; (iii) physical shielding or chemical trapping effects at the separator through functional coatings; and (iv) artificial protection layers at the Li anode to inhibit chemical reactions of polysulfide with Li metal; and (v) using catalysts to accelerate the redox kinetics of LiPSs.8–10 For example, conventional porous polyethylene/polypropylene separators can be coated with chemical functionalities that induce adsorption, repulsion, or entrapment of LiPSs, thereby acting as a barrier to crossover of dissolved LiPSs from the cathode to the Li anode.11,12 Additional benefits of functionalized separators include enhancing thermal stability, Li+ conductivity, electrolyte wettability, sulfur utilization, rate capability, and specific capacity.13–15 Such coatings should be kept thin and conformal to avoid occluding the pores of the separator (as small as 100 nm) and introducing unnecessary resistance and additional mass/volume to the cell.11,16 Atomic layer deposition (ALD) is a popular thin-film coating technique that has been successfully used to modify various battery components, but ALD coatings (typically rigid inorganic materials) require elevated temperatures for growth that are near the decomposition temperature of common polyethylene/polypropylene separators (130–150 °C).17,18
Alternatively, initiated chemical vapor deposition (iCVD) can be used to generate ultrathin polymer coatings at mild substrate temperatures (20–50 °C) to modify thermally sensitive materials.19–21 Polymers with varying functionality can be generated by iCVD, typically using vinyl-substituted monomers that have some degree of volatility. Because iCVD is a non-line-of-sight deposition technique, it is amenable to coating complex 3D substrates,22–24 as would be the case for porous battery separators. Recent studies have demonstrated that iCVD-modified separators can enhance Li–S and Li-ion cell performance.25,26 This deposition technique has also been shown to operate in large-scale roll-to-roll coating systems,27–29 which should be compatible with existing battery manufacturing processes.
We use iCVD to conformally coat porous polyethylene (PE) battery separators with the copolymer, poly(divinylbenzene-co-(dimethylaminomethyl)styrene) (pDVB-co-DMAMS), which is designed to express multiple characteristics that are beneficial to Li–S cell operation. The DMAMS subunit provides an amine functionality to interact with LiPSs and to stabilize the Li metal anode interface, while the DVB subunit crosslinks the copolymer to prevent its dissolution/delamination into the battery electrolyte. We assess the impact of these (pDVB-co-DMAMS)-coated separators on electrochemical performance in Li–S coin cells that also include freestanding carbon nanofoam paper (CNFP) cathodes30 with high sulfur loading (3 mg cm−2) and Li foil anodes, ascertaining such critical metrics as self-discharge rate and charge–discharge cycling stability. Based on post-cycling analysis using a suite of characterization techniques and computation by atomistic modelling, we elucidate the interactions between pDVB-co-DMAMS with LiPSs that lessen cathode-to-anode crossover and improve Li–S cycling performance.
Results and discussion
Poly(DVB-co-DMAMS) synthesis and electrochemical properties
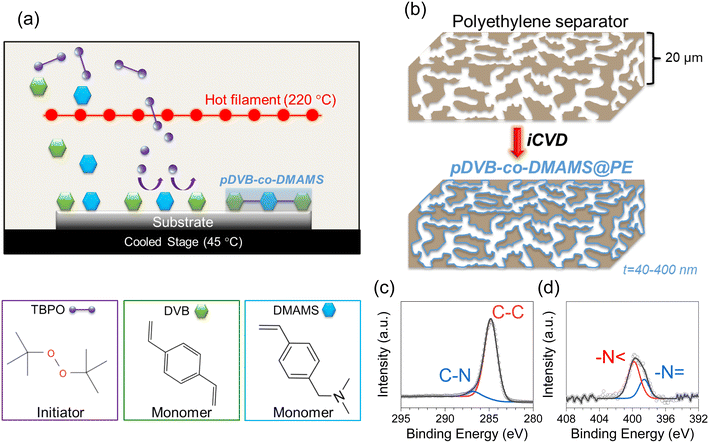
The iCVD process for generating the copolymer, pDVB-co-DMAMS, is depicted in Fig. 1a, where DVB and DMAMS monomer vapors are introduced into the vacuum chamber along with the tert-butyl peroxide (TBPO), a common initiator used with iCVD. The heated filament located above the temperature-controlled stage decomposes TBPO to form radicals that initiate the polymerization of DVB and DMAMS monomers adsorbed on the surfaces of the PE separators. Under optimized conditions, the polymer conformally coats all surfaces throughout the separator volume (Fig. 1b). The chemical composition of pDVB-co-DMAMS is assessed via XPS of films deposited on Si substrates (Fig. 1c and d). The C 1s core-level spectra show two peaks at 284.8 eV and 286.1 eV, assigned to C–C and C–N bonding, respectively. The N 1s core-level spectra show two peaks: –N < at 399.8 eV and –N = at 398.6 eV. The –N < peak accounts for ∼70% of the N 1s peak intensity, qualitatively similar to results recently reported for iCVD-generated pDMAMS.23 Quantification of the XPS peaks yields a C:N atomic ratio of 19.9 (with negligible oxygen, 1 at%) that corresponds to a 1![[thin space (1/6-em)]](https://www.rsc.org/images/entities/char_2009.gif) :
:![[thin space (1/6-em)]](https://www.rsc.org/images/entities/char_2009.gif) 1.1 ratio of DVB
1.1 ratio of DVB![[thin space (1/6-em)]](https://www.rsc.org/images/entities/char_2009.gif) :
:![[thin space (1/6-em)]](https://www.rsc.org/images/entities/char_2009.gif) DMAMS, demonstrating the ability of iCVD to deposit high-purity pDVB-co-DMAMS films.
DMAMS, demonstrating the ability of iCVD to deposit high-purity pDVB-co-DMAMS films.
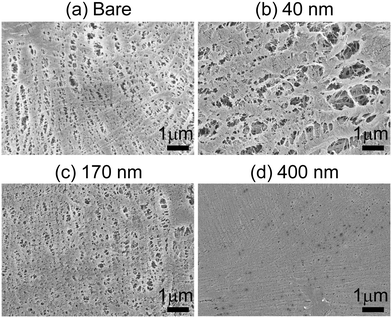
Copolymer coating thickness is controlled by exposure time to monomers and initiator in the iCVD chamber. Thickness values of ∼40 nm, 170 nm, and 400 nm for 25, 50, and 90 min depositions, respectively, are measured based on spectroscopic ellipsometry analysis of planar Si chips that are included in the iCVD chamber along with the porous separators (Fig. S1†). The porosity of pDVB-co-DMAMS-coated PE separators, hereby referred to as “iCVD@PE” for simplicity, are examined using scanning electron microscopy (SEM). Fig. 2 displays SEM images of the separators after deposition at the boundary facing up towards the deposition chamber ceiling and filaments, and those at the boundary resting on the chamber floor are shown in Fig. S2.† The inherent porosity is largely maintained for the 40 nm-iCVD@PE separator (Fig. 2b), while pore diameter diminishes significantly with 170 nm-iCVD@PE and 400 nm-iCVD@PE separators (Fig. 2c and d). Qualitatively similar trends are noted in micrographs taken on the back side of the separator (Fig. S2†), confirming that iCVD polymer generation is generally conformal and uniform through the separator thickness.
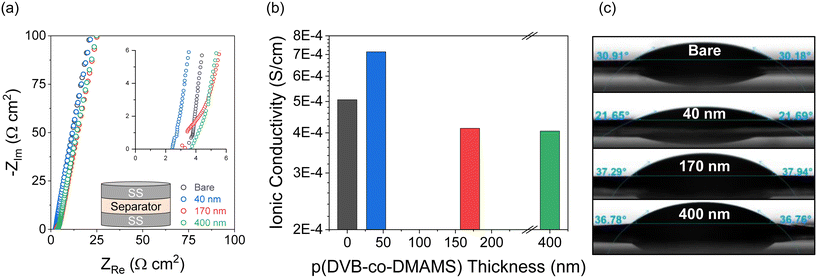
The ionic transport properties of pDVB-co-DMAMS-coated PE separators are examined by electrochemical impedance spectroscopy (EIS) in symmetric cells with stainless-steel (SS) ion-blocking electrodes, which ensure that all measured ionic contributions are from the electrolyte-soaked separator. For all electrochemical experiments, we use an electrolyte comprising 1 M LiTFSI + 0.2 M LiNO3 in DOL/DME, a commonly used composition for Li–S cell testing (see further discussion below). Nyquist plots for all cells show continuous increase in the imaginary impedance as frequency decreases, consistent with double-layer formation on the blocking electrodes (Fig. 3a). The high-frequency real impedance for all cells ranges between 2 and 5 Ω cm2; values taken from the intercept with the real-impedance axis are used to calculate the ionic conductivity of the electrolyte-infused separator, according to the equation,  , where L is the separator thickness (20.4 μm), R is the total resistance, and A is the area of the electrode (see values in Fig. 3b). Ionic conductivity is higher with the 40 nm-iCVD@PE separator (0.71 mS cm−1) versus the bare separator (0.51 mS cm−1), which we attribute to improved wetting of the PE-based separator with the polar liquid electrolyte (1 M LiTFSI + 0.2 M LiNO3 in DOL/DME), as shown by decreasing contact angle with an electrolyte droplet (Fig. 3c). Thicker iCVD@PE coatings (≥170 nm) decrease conductivity modestly as the pores of the polyethylene separator become more occluded and the electrolyte contact angle increases.
Poly(DVB-co-DMAMS) in lithium–sulfur batteries
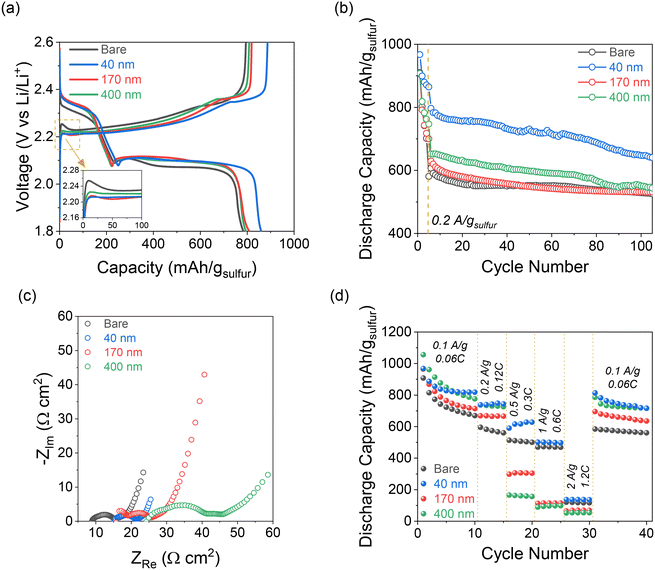
On the reverse charge step, Li2S is oxidized back to S8, which is represented by a single broad plateau at ∼2.35 V for all cells. At the early stage of the charging process, there is an “overpotential” to oxidize the insoluble and insulating Li2S back to soluble LiPSs, which manifests as an initial peak above the charging plateau (Fig. 4a, inset).31 This charging peak (∼24 mV above the plateau) is most pronounced in the Li–S cell with the bare separator, whereas it is essentially zero for the 40 nm-iCVD@PE and minimal (∼4 mV) for 170 nm-iCVD@PE and 400 nm-iCVD@PE. The decrease in this initial charge voltage confirms that Li2S oxidation within the CNFP is more kinetically facile in such cases.
The charge–discharge voltage hysteresis is also lower in all cells with pDVB-co-DMAMS coatings compared to those with the bare separator, and lowest overall for 40 nm-iCVD@PE. This trend is further supported by EIS analysis of Li–S cells before cycling (Fig. S4†), which shows minimal difference in cell impedance with the bare separator versus the 40 nm-iCVD@PE separator. Alternatively, 170–400 nm@PE cells show a 1.5× higher impedance due to the thicker polymer film and less free volume within the separator for liquid electrolyte.
Long-term Li–S cell cycling behavior is assessed by first applying 5 formation cycles at 0.1 A gsulfur−1 followed by 100 cycles at 0.2 A gsulfur−1. All cells show similar first-cycle capacity (∼900–980 mA h gsulfur−1) at 0.1 A gsulfur−1, but measured capacities diverge after a few cycles (Fig. 4b). Cells with the 40 nm-iCVD@PE separator exhibit the best capacity retention, maintaining ∼640 mA h gsulfur−1 after 105 cycles compared to ∼530 mA h gsulfur−1 for all other cells, while also showing better cell-to-cell consistency than each of the other cell types (Fig. S5†). Voltage profiles for cycles 5, 25, 50, and 100 at 0.2 A gsulfur−1 show a high overpotential on initial charge for all cells except with the 40 nm-iCVD@PE (Fig. S6†). The 40 nm-iCVD@PE cell displays a steady discharge plateau throughout 105 cycles indicative of facile reduction of S8 → Li2S, while each of the other cells show broad features at the Li2S6(l) → Li2S4(l) and Li2S2(s) → Li2S(s) transitions. These features arise due to the resistive nature of the thicker pDVB-co-DMAMS coatings. Increasing voltage polarization is further supported by EIS measurements after cycling (Fig. 4c), where the 40 nm-iCVD@PE cell shows a single semicircular feature of ∼5 Ω cm2 diameter compared to multiple semicircles of ∼20 Ω cm2 magnitude for 170 nm- and 400 nm-iCVD@PE cells. We also note that the series resistance increases linearly with pDVB-co-DMAMS coating thickness, consistent with a decrease in free volume for electrolyte in the separator.
The rate performance of cells with bare and iCVD@PE separators is displayed in Fig. 4d. All cells with iCVD@PE separators deliver higher capacity than the bare separator at rates of 0.1 and 0.2 A gsulfur−1, with the 40 nm-iCVD@PE separator showing the highest overall capacity retention. Cells with thicker pDVB-co-DMAMS coatings show decreasing capacity at rates of 0.5–2 A gsulfur−1, but the 40 nm-iCVD@PE cell exhibits a 1.3× higher capacity than the bare cell at 0.5 A gsulfur−1. Upon returning to 0.1 A gsulfur−1, the 40 nm-iCVD@PE cell exhibits the best overall capacity retention, providing 87.5% of its cycle-10 capacity at cycle 40 after the high-rate excursion. We attribute the improved rate performance of the 40 nm-iCVD@PE cell to a thinner pDVB-co-DMAMS coating that preserves the porous transport pathways of the separator while still stabilizing the electrode/electrolyte interfaces. At the other end of the pDVB-co-DMAMS thickness range, the 400 nm-iCVD@PE cell exhibits a higher capacity at 0.1–0.2 A gsulfur−1 than the 170 nm-iCVD@PE coating. This trend is supported by the decreased resistivity in Li/Li cells with the 400 nm-iCVD@PE separator (Fig. S7†), suggesting that rate capability may also be impacted by differences in the solid-electrolyte interphase (SEI) at the Li metal anode. The overall cycling performance benefits of the iCVD@PE separators are summarized in Table 1 and are compared to their self-discharge performance.
| Separator | Ionic conductivitya (S cm−1) | Capacity at 0.5 A gsulfur−1b (mA h gsulfur−1) | Capacity after 100 cyclesc (mA h gsulfur−1) | Self-discharge rated (mV day−1) |
|---|---|---|---|---|
| a Ionic conductivity of the electrolyte-soaked separator determined by EIS measurements in Fig. 3a. b Capacity of Li–S cells the fifth cycle at 0.5 A gsulfur−1 from the rate test in Fig. 4d. c Capacity of Li–S cells after 100 cycles at 0.2 A gsulfur−1 in Fig. 4b. d Self-discharge rate from Fig. 6d. | ||||
| Bare | 5.06 × 10⁻⁴ | 500 | 532 | 35.7 |
| 40 nm-iCVD@PE | 7.14 × 10⁻⁴ | 627 | 641 | 18.6 |
| 170 nm-iCVD@PE | 4.13 × 10⁻⁴ | 304 | 532 | 12.9 |
| 400 nm-iCVD@PE | 4.05 × 10⁻⁴ | 156 | 544 | 10.0 |
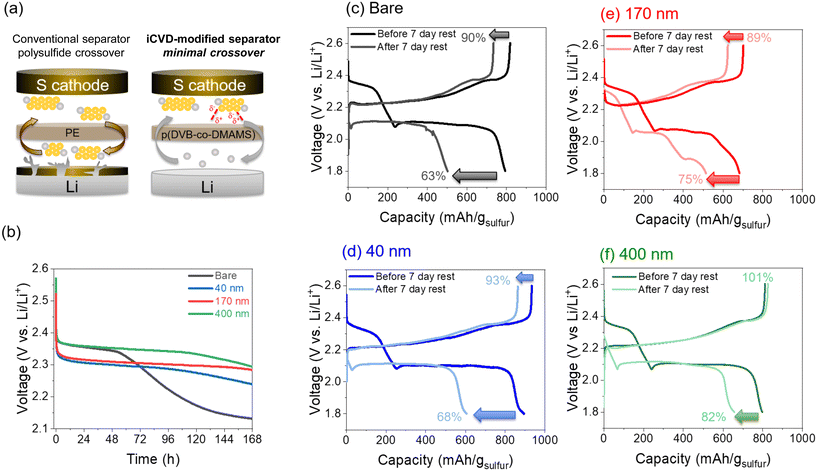
Self-discharge behavior is assessed in Li–S cells that were initially subjected to 14 charge–discharge cycles ending in a final charge half-cycle, followed by monitoring open-circuit voltage (OCV) over a period of 7 days (Fig. 6b). After ∼2 days, the OCV of the bare-separator cell begins to decrease substantially from 2.35 V down to 2.13 V. Cells with iCVD@PE separators exhibit significantly slower self-discharge, with the delay of voltage decay increasing with thicker pDVB-co-DMAMS coatings. This effect also manifests in the deliverable cell capacity following the self-discharge 7 d rest period. As depicted in Fig. 6c–f, separators with thicker pDVB-co-DMAMS coatings support higher post-rest discharge capacity. On the following charge step, there is some irreversible loss of capacity in cells with ≤170 nm coatings, while the cell with the 400 nm-iCVD@PE separator is able to regain 100% of its initial (pre-rest) charge capacity, consistent with its ability to best inhibit LiPS crossover. In a prior study of iCVD-generated polyimidazole coatings on battery separators, Lim et al.26 reported 83.2% capacity retention for Li–S cells (using conventional carbon–sulfur powder composite cathodes) following a 12 h rest period. We performed similar tests (12 h rest; Fig. S8†) and observed 96% capacity retention for the bare separator and 100% retention with each of the iCVD@PE separators. This high capacity retention (low self-discharge) for all of our cells at these short 12 h rest periods is also attributable to enhanced sulfur confinement within the 3D CNFP cathodes,30 which enables even cells with the conventional separator to remain OCV-stable for at least 48 h of rest time.
To further isolate the effect of the pDVB-co-DMAMS coating on LiPS crossover, we also perform similar self-discharge measurements on Li–S cells assembled without LiNO3 in the electrolyte. Lithium–sulfur cells commonly include LiNO3 as an electrolyte additive to mitigate undesirable reactions at the Li anode when soluble LiPSs are present.32–35 Our results with LiNO3-free cells also show that iCVD@PE separators still delay cell self-discharge (Fig. S9a†), and also improve capacity and coulombic efficiency under galvanostatic cycling (Fig. S9b†). In all cases, we observe a decrease in coulombic efficiency and faster self-discharge for cells without the LiNO3 additive. Thus, the combination of both separator coating and electrolyte additive yields optimal performance for Li–S cell operation.
Post-cycling characterization of Li–S cell components
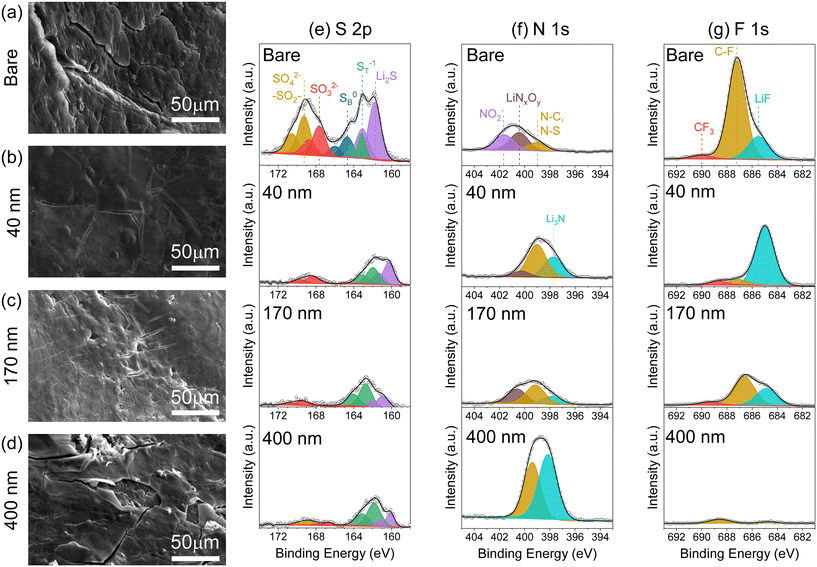
X-ray photoelectron spectroscopy analysis of the Li surface provides chemical information for products formed during Li–S cell operation. We observe a lower total content of S at the Li surface for anodes used with all of the iCVD@PE separators, with ∼1 at% S for each such case compared to 4.3 at% with the bare separator; argon-ion depth-profiling also confirms consistent chemical composition throughout the surface layer (Fig. S11†). Deconvolution of the S 2p spectra reveals additional information about S speciation (Fig. 6e). After cycling with the bare separator, the Li anode surface expresses several S species: Li2S at 161.8 eV; terminal LiPS (ST) or Li2S2 at 163.2 eV; bridging LiPS (SB) at 164.7 eV; SO32− at 167.7 eV; and SO42−/R-SO2-R at 169.3 eV (j = 3/2 binding energies).33,38,39 Cells cycled with iCVD@PE separators display a significantly different S speciation at the Li surface. In the reduced S species region (160–166 eV), there are no peaks associated with SB bonds but only ST bonds, indicating that no higher order Li2Sn (n = 4, 6, 8) are present at the Li electrode surface. Peaks for Li2S, which can arise from the chemical reaction of LiPS with Li, are observed with iCVD@PE separators but at a lower relative intensity compared to results with the bare separator. In the oxidized sulfur species region (167–173 eV), peaks associated with SO32− and SO42−/R-SO2-R are minimized at the Li metal surface for cells cycled with iCVD@PE separators. In contrast, Li cycled with the bare separator shows prominent peaks for lithium sulfates and sulfites, as would commonly occur due to the reaction of crossover LiPS with Li metal in the presence of LiNO3 and LiTFSI.37,38 Reaction of the Li metal anode with LiPS also manifests with the reduction of LiNO3 to LiNO2. Such reduced NO2 species are not observed in the N 1s spectra (Fig. 7f) of the Li metal surface cycled with the iCVD@PE separators, but only the bare separator. These findings support the supposition that pDVB-co-DMAMS plays a role in preventing detrimental LiPS interaction with the Li metal surface.
The N 1s and F 1s spectra (Fig. 7f and g) show that the 400 nm-iCVD@PE separator produces a significantly different chemical composition at the Li anode surface, exhibiting the most N and C content, and the least amount of S and F (as quantified in Fig. S11†). We posit that the thick pDVB-co-DMAMS coating contacting the Li metal surface reacts to form a pDVB-co-DMAMS-derived passivating layer, evidenced by excess Li3N and C–N peaks in the N 1s spectra (Fig. 7f). This supposition is further supported by our SEM observation of a thick film on the Li surface for cells cycled with the 400 nm-iCVD@PE separator (Fig. 6d), and the lower impedance measured with this separator in Li/Li symmetric cells compared to cells with the bare separator (Fig. S7†). The F 1s spectra confirms the superior SEI quality at Li from the 40 nm–iCVD@PE cell (Fig. 7g); in such case the F content is 88% LiF, which is known as a desirable SEI product.40–42 Alternatively, the bare separator results in a F surface chemistry dominated by C–F functionalities arising from electrolyte decomposition (see also C 1s spectra in Fig. S12†) with only 21% of F content as LiF. The Li electrode from the 400 nm-iCVD@PE cell exhibits minimal F content, further evidence of its passivation from electrolyte decomposition. In combination, the XPS and SEM results confirm that the pDVB-co-DMAMS coating plays a significant role in mitigating LiPS crossover, and promoting favorable Li metal morphology and SEI chemistry.
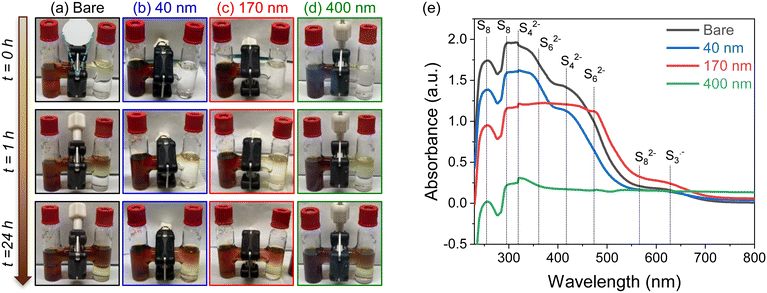
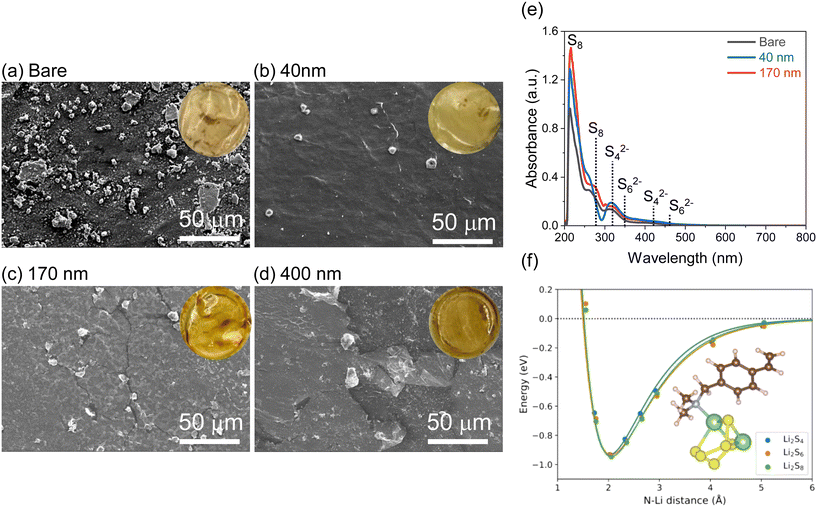
These LiPS-stained separators were further extracted with DME solvent and the resulting solution characterized with UV–visible spectroscopy (Fig. 8e). The observed peaks are consistent with reduced LiPS species in LiTFSI/ether solutions, as reported in literature.43–45 The spectra in Fig. 8e show an increase in absorbance of S8 species for extracts of thicker pDVB-co-DMAMS coatings, indicating that pDVB-co-DMAMS is chemically trapping LiPSs46–48 and delaying their crossover towards the Li anode.
Atomistic simulations are performed to determine the thermodynamics of the interaction between DMAMS and LiPSs. The results of these simulations indicate that Li2Sn molecules can reversibly attach to DMAMS units in the pDVB-co-DMAMS layer through the nitrogen lone pair on the pedant dimethylamine group (Fig. 8f). The binding energy (calculated in vacuum using DFT) is 0.93 eV, consistent with reversible binding of LiPSs. In contrast, the bonding of LiPSs to the CNFP cathode surface (as approximated computationally by a graphene monolayer) is substantially weaker, averaging 0.48 eV in vacuum. The bonding of LiPSs with DMAMS is primarily a Lewis-base interaction between the amine and the Li+,49 whereas interaction with carbon surfaces is primarily driven by van der Waals forces. This large vacuum binding energy is consistent with reversible attachment of LiPSs to the pDVB-co-DMAMS layer in solution, because solvation acts to weaken the bond. The reversible binding of LiPSs is crucial for maintaining a long-lasting Li–S battery, whereas if the binding forces are too strong, some sulfur-based material will be lost from the cathode.
To further explore solvation effects, we perform molecular dynamics (MD) simulations of Li2S6 and DMAMS in the presence of a realistic solvent (DOL![[thin space (1/6-em)]](https://www.rsc.org/images/entities/char_2009.gif) :
:![[thin space (1/6-em)]](https://www.rsc.org/images/entities/char_2009.gif) DME 1
DME 1![[thin space (1/6-em)]](https://www.rsc.org/images/entities/char_2009.gif) :
:![[thin space (1/6-em)]](https://www.rsc.org/images/entities/char_2009.gif) 1 by weight). Simulations are performed using a machine-learning interatomic potential fine-tuned based on DFT data of solvated DMAMS and LiPSs.50,51 The binding enthalpy in the presence of solvent is 0.146 ± 0.038 eV, likely large enough to trap the polysulfide but small enough that the polysulfide is still available for further reduction during discharge. The atomistic simulations also suggest that the Li2Sn species do not dissociate into 2Li+ + Sn2− in solution, but rather remain as an ion complex. Further details of the MD simulations may be found in the ESI.†
1 by weight). Simulations are performed using a machine-learning interatomic potential fine-tuned based on DFT data of solvated DMAMS and LiPSs.50,51 The binding enthalpy in the presence of solvent is 0.146 ± 0.038 eV, likely large enough to trap the polysulfide but small enough that the polysulfide is still available for further reduction during discharge. The atomistic simulations also suggest that the Li2Sn species do not dissociate into 2Li+ + Sn2− in solution, but rather remain as an ion complex. Further details of the MD simulations may be found in the ESI.†
Conclusions
Our findings demonstrate the efficacy of iCVD as a route to modify commercial battery separators with thin, conformal coatings of a specifically designed copolymer—pDVB-co-DMAMS—that effectively mitigates the negative effects of LiPS shuttling on Li–S cell operation. In addition to reversibly adsorbing LiPSs at amine functionalities, the pDVB-co-DMAMS coating also interacts with the Li metal anode surface to form a stabilizing layer, while also improving the wettability of the PE separator to liquid electrolyte. As a result, Li–S cells that include these iCVD@PE separators exhibit enhanced electrochemical performance in terms of resilience to self-discharge, better charge–discharge cycle life, and greater capacity retention with increasing discharge rate. Specifically, thicker coatings of 400 nm-iCVD@PE offer extended protection towards self-discharge, while 40 nm-iCVD@PE separators provide the best overall electrochemical performance while maintaining effective self-discharge mitigation. Combining these polysulfide-mitigating, iCVD-modified separators with advanced carbon cathode architectures such as the CNFP opens new possibilities for Li–S battery performance and application.Experimental
Initiated chemical vapor deposition of polymer coatings
A GVD Corporation “iLab” reactor was used to iCVD-synthesize pDVB-co-DMAMS. In a typical deposition, the 4-DMAMS monomer (synthesized according to our previous report23) was heated to 70 °C, the DVB monomer independently heated to 50 °C, and the di-tert-butyl peroxide (TBPO 98%, Aldrich) initiator was maintained at room temperature, all in separate source vessels. The lines from source vessels to the reactor were heated to 80 °C in order to minimize vapor condensation. The DVB flow was controlled through a ball-valve while DMAMS and TBPO flow to the reactor were controlled using mass-flow controllers set for rates of 2.1 SCCM DMAMS and 1 SCCM TBPO, respectively. The reactor substrate stage was maintained at 45 °C and a pressure of ∼200 mTorr was maintained in the deposition chamber using an automated throttle valve. The initiator was thermally activated by resistively heating a Nichrome filament to ∼220 °C (35 V, ∼2A applied) mounted above the substrate stage. Depositions were conducted directly on Entek Gold LP separators (UHMWPE, 19.4 μm thick, 37% porosity) and on Si chips that were subsequently used for thickness measurements. Ellipsometry measurements on these Si chips were collected at variable angles (55°, 65°, 75°) and film thickness was modeled using a general oscillator model consisting of Tauc–Lorentz and Gaussian oscillators (J. A. Woolam M-2000 spectroscopic ellipsometer). The bare and pDVB-co-DMAMS-coated separators were dried at 60 °C under vacuum overnight, then quickly transferred to an Ar-filled glovebox (<0.1 ppm H2O, O2) to minimize moisture exposure.Sulfur-CNFP cathode synthesis
The CNFPs were synthesized as previously reported.30,52 Sized (15 mm diameter) and weighed pieces of CNFP were supported on a stainless-steel mesh placed above a bed of 1 g sulfur powder inside a PTFE chamber. Vapor infiltration with sulfur was achieved by heating the chamber inside a muffle furnace for 4 hours at 175 °C, as previously described.53–55 After infiltration, the chamber was removed from the oven and cooled for 30 min; the CNFPs were then removed from the chamber, weighed, and immediately transferred to an Ar glovebox. The resulting S@CNFP cathodes contained an average of 38.4% sulfur by weight, corresponding to ∼3 mg cm−2 areal S loading.Electrochemistry
Lithium–sulfur cells were constructed inside an Ar-filled glovebox using CR2032 coin-cell hardware (Hoshen Corp.) with a 9/16′′ diameter Li anode (99.9% MSE supplies, 0.6 mm thick), ¾′′ diameter Entek separator with 70 μL of 1 M lithium bis(trifluoromethanesulfonyl)imide (LiTFSI)/0.2 M lithium nitrate (LiNO3) in 1,3-dioxolane (DOL)/1,2-dimethoxyethane (DME) electrolyte, and a 15 mm diameter S@CNFP cathode. The Li/Li symmetric cells, SS/SS symmetric cells, and Li/Cu cells were assembled in a similar fashion. All electrochemical cycling was performed inside environmental chambers at 25 °C with control and data collection provided by a Maccor Model 4300 test system; an Ametek Parstat multichannel potentiostat with PMC-1000 modules was used for EIS and cycling. All cells were cycled at specified rates normalized to the mass of sulfur (A gsuflur−1), and operated with voltage limits of 1.8 and 2.6 V. Impedance measurements were performed by scanning the frequency between 600 kHz–0.06 Hz with a sinusoidal amplitude of 10 mV for cells in an OCV state.Characterization
Data availability
Data generated and analyzed in this study are included in the article and its ESI.†Author contributions
R. B. N. and H. O. F. conceived the research idea and performed the iCVD depositions. R. B. N. performed electrochemical tests and spectroscopic characterizations. J. Y. and H. O. F. performed SEM analysis. Z. G. N. synthesized the CNFPs. M. W. S. and N. B. performed the atomistic simulations. J. W. L. and R. E. C. directed and guided the research project. R. B. N. wrote the manuscript with input from all authors.Conflicts of interest
The authors have no conflicts to declare.Acknowledgements
Financial support for this research was provided by the U.S. Office of Naval Research under award numbers N0001424WX00013 and N0001424WX00370. R. B. N. and H. O. F. are National Research Council Postdoctoral Associates at the U.S. Naval Research Laboratory.References
- Z. W. Seh, Y. Sun, Q. Zhang and Y. Cui, Chem. Soc. Rev., 2016, 45, 5605–5634 RSC.
- A. Manthiram, Y. Fu, S. H. Chung, C. Zu and Y. S. Su, Chem. Rev., 2014, 114, 11751–11787 CrossRef CAS PubMed.
- Y. Yang, G. Zheng and Y. Cui, Chem. Soc. Rev., 2013, 42, 3018–3032 RSC.
- G. Zhou, H. Chen and Y. Cui, Nat. Energy, 2022, 7, 312–319 CrossRef CAS.
- A. Eftekhari and D.-W. Kim, J. Mater. Chem. A, 2017, 5, 17734–17776 RSC.
- M. A. Pope and I. A. Aksay, Adv. Energy Mater., 2015, 5, 1500124 CrossRef.
- Q. Pang, X. Liang, C. Y. Kwok and L. F. Nazar, Nat. Energy, 2016, 1, 16132 Search PubMed.
- Z. Han, S. Li, Y. Wu, C. Yu, S. Cheng and J. Xie, J. Mater. Chem. A, 2021, 9, 24215–24240 RSC.
- Y. Huang, L. Lin, C. Zhang, L. Liu, Y. Li, Z. Qiao, J. Lin, Q. Wei, L. Wang, Q. Xie and D. L. Peng, Adv. Sci., 2022, 9, e2106004 CrossRef.
- G. Liu, C. Yuan, P. Zeng, C. Cheng, T. Yan, K. Dai, J. Mao and L. Zhang, J. Energy Chem., 2022, 67, 73–81 Search PubMed.
- L. Fan, M. Li, X. Li, W. Xiao, Z. Chen and J. Lu, Joule, 2019, 3, 361–386 CrossRef CAS.
- M. Waqas, Y. Niu, M. Tang, Y. Pang, S. Ali, Y. Dong, W. Lv and W. He, Energy Storage Mater., 2024, 103682, DOI:10.1016/j.ensm.2024.103682.
- A. Kim, S. H. Oh, A. Adhikari, B. R. Sathe, S. Kumar and R. Patel, J. Mater. Chem. A, 2023, 11, 7833–7866 RSC.
- M. Zhang, X. Zhang, S. Liu, W. Hou, Y. Lu, L. Hou, Y. Luo, Y. Liu and C. Yuan, ChemSusChem, 2024, 17, e202400538 CrossRef CAS PubMed.
- X. Dong, W. Gu, X. Tong, G. Liu, J. Sun, H. Li, X. Gu, T. Zhu and S. Zhang, Small, 2024, 20, 2311471 CrossRef CAS PubMed.
- J. Jang, J. Oh, H. Jeong, W. Kang and C. Jo, Materials, 2020, 13, 4625 CrossRef CAS.
- S. M. George, Chem. Rev., 2010, 110, 111–131 CrossRef CAS.
- L. Ma, R. B. Nuwayhid, T. P. Wu, Y. Lei, K. Amine and J. Lu, Adv. Mater. Interfaces, 2016, 3, 1600564 CrossRef.
- W. E. Tenhaeff and K. K. Gleason, Adv. Funct. Mater., 2008, 18, 979–992 CrossRef CAS.
- K. K. Gleason, Nat. Rev. Phys., 2020, 2, 347–364 CrossRef CAS.
- K. K. Gleason, Adv. Mater., 2024, 36, e2306665 CrossRef.
- H. Sojoudi, S. Kim, H. Zhao, R. K. Annavarapu, D. Mariappan, A. J. Hart, G. H. McKinley and K. K. Gleason, ACS Appl. Mater. Interfaces, 2017, 9, 43287–43299 CrossRef CAS.
- H. O. Ford, B. L. Chaloux, B. Jugdersuren, X. Liu, C. A. Klug, J. B. Miller, X. Zuo, M. W. Swift, M. D. Johannes, J. W. Long, D. R. Rolison and M. B. Sassin, RSC Appl. Interfaces, 2024, 1, 531–543 RSC.
- M. B. Sassin, J. W. Long, J. M. Wallace and D. R. Rolison, Mater. Horiz., 2015, 2, 502–508 RSC.
- Y. Yoo, B. G. Kim, K. Pak, S. J. Han, H. S. Song, J. W. Choi and S. G. Im, ACS Appl. Mater. Interfaces, 2015, 7, 18849–18855 CrossRef CAS.
- W.-G. Lim, S. Oh, J. Jeong, W. Jang, K. I. Shim, S. Kim, J. W. Han, S. G. Im and J. Lee, ACS Appl. Energy Mater., 2021, 4, 611–622 CrossRef CAS.
- H. Şakalak, K. Yılmaz, M. Gürsoy and M. Karaman, Chem. Eng. Sci., 2020, 215, 115466 CrossRef.
- C. Cheng and M. Gupta, Ind. Eng. Chem. Res., 2018, 57, 11675–11680 CrossRef CAS.
- M. Gupta and K. K. Gleason, Thin Solid Films, 2006, 515, 1579–1584 CrossRef CAS.
- Z. G. Neale, M. J. Lefler, J. W. Long, D. R. Rolison, M. B. Sassin and R. Carter, Nanoscale, 2023, 15, 16924–16932 RSC.
- L. F. Nazar, M. Cuisinier and Q. Pang, MRS Bull., 2014, 39, 436–442 CrossRef CAS.
- N. Ding, L. Zhou, C. Zhou, D. Geng, J. Yang, S. W. Chien, Z. Liu, M.-F. Ng, A. Yu, T. S. A. Hor, M. B. Sullivan and Y. Zong, Sci. Rep., 2016, 6, 33154 CrossRef CAS.
- M. J. Lacey, A. Yalamanchili, J. Maibach, C. Tengstedt, K. Edström and D. Brandell, RSC Adv., 2016, 6, 3632–3641 RSC.
- A. Rosenman, R. Elazari, G. Salitra, E. Markevich, D. Aurbach and A. Garsuch, J. Electrochem. Soc., 2015, 162, A470 CrossRef CAS.
- S. S. Zhang, Electrochim. Acta, 2012, 70, 344–348 CrossRef CAS.
- S. Xiong, K. Xie, Y. Diao and X. Hong, J. Power Sources, 2014, 246, 840–845 CrossRef CAS.
- D. Aurbach, E. Pollak, R. Elazari, G. Salitra, C. S. Kelley and J. Affinito, J. Electrochem. Soc., 2009, 156, A694 CrossRef CAS.
- M. T. Lee, H. Liu and D. Brandell, Batteries Supercaps, 2020, 3, 1370–1376 CrossRef CAS.
- X. Liang, C. Hart, Q. Pang, A. Garsuch, T. Weiss and L. F. Nazar, Nat. Commun., 2015, 6, 5682 CrossRef.
- X. Ye, J. Wu, J. Liang, Y. Sun, X. Ren, X. Ouyang, D. Wu, Y. Li, L. Zhang, J. Hu, Q. Zhang and J. Liu, ACS Appl. Mater. Interfaces, 2022, 14, 53788–53797 CrossRef CAS PubMed.
- X.-Q. Zhang, X.-B. Cheng, X. Chen, C. Yan and Q. Zhang, Adv. Funct. Mater., 2017, 27, 1605989 CrossRef.
- S. Choudhury and L. A. Archer, Adv. Electron. Mater., 2016, 2, 1500246 CrossRef.
- G. Bieker, D. Diddens, M. Kolek, O. Borodin, M. Winter, P. Bieker and K. Jalkanen, J. Phys. Chem. C, 2018, 122, 21770–21783 CrossRef CAS.
- Q. Zou and Y. C. Lu, J. Phys. Chem. Lett., 2016, 7, 1518–1525 CrossRef CAS.
- J. Häcker, D. H. Nguyen, T. Rommel, Z. Zhao-Karger, N. Wagner and K. A. Friedrich, ACS Energy Lett., 2021, 7, 1–9 CrossRef.
- P. Han and A. Manthiram, J. Power Sources, 2017, 369, 87–94 CrossRef CAS.
- Q. Zhang, Y. Wang, Z. W. Seh, Z. Fu, R. Zhang and Y. Cui, Nano Lett., 2015, 15, 3780–3786 CrossRef CAS.
- M. W. Hasan, K. Huynh, B. Lama, A. A. Razzaq, M. G. Smdani, F. N. Akter, B. Maddipudi, R. Shende, T. R. Paudel and W. Xing, J. Electrochem. Soc., 2024, 171, 040540 CrossRef CAS.
- R. L. Woodin and J. L. Beauchamp, J. Am. Chem. Soc., 1978, 100, 501–508 CrossRef CAS.
- I. Batatia, P. Benner, Y. Chiang, A. M. Elena, D. P. Kovács, J. Riebesell, X. R. Advincula, M. Asta, W. J. Baldwin and N. Bernstein, arXiv, 2023, preprint, arXiv:2401.00096, DOI:10.48550/arXiv.2401.00096.
- I. Batatia, D. P. Kovacs, G. Simm, C. Ortner and G. Csányi, Adv. Neural Inf. Process. Syst., 2022, 35, 11423–11436 Search PubMed.
- J. C. Lytle, J. M. Wallace, M. B. Sassin, A. J. Barrow, J. W. Long, J. L. Dysart, C. H. Renninger, M. P. Saunders, N. L. Brandell and D. R. Rolison, Energy Environ. Sci., 2011, 4, 1913–1925 RSC.
- R. Carter, L. Oakes, N. Muralidharan and C. L. Pint, J. Phys. Chem. C, 2017, 121, 7718–7727 CrossRef CAS.
- M. Li, R. Carter, A. Douglas, L. Oakes and C. L. Pint, ACS Nano, 2017, 11, 4877–4884 CrossRef CAS.
- R. Carter, B. Davis, L. Oakes, M. R. Maschmann and C. L. Pint, Nanoscale, 2017, 9, 15018–15026 RSC.
- G. Kresse and J. Furthmüller, Phys. Rev. B: Condens. Matter Mater. Phys., 1996, 54, 11169–11186 CrossRef CAS.
- P. E. Blöchl, Phys. Rev. B: Condens. Matter Mater. Phys., 1994, 50, 17953–17979 CrossRef.
- J. Heyd, G. E. Scuseria and M. Ernzerhof, J. Chem. Phys., 2003, 118, 8207–8215 CrossRef CAS.
- S. Grimme, J. Antony, S. Ehrlich and H. Krieg, J. Chem. Phys., 2010, 132, 154104 CrossRef.
Footnote |
| † Electronic supplementary information (ESI) available. See DOI: https://doi.org/10.1039/d4lf00369a |
| This journal is © The Royal Society of Chemistry 2025 |

