 Open Access Article
Investigation of the influence of substituents on the dielectric properties of polyethylene derivatives†
Bing
Zhong
ab,
Yin
Zhang
ab,
Wei
You
 *ab and
Yu
Wang
 *a
*a
aBeijing National Laboratory for Molecular Sciences (BNLMS), CAS Key Laboratory of Engineering Plastics, Institute of Chemistry, Chinese Academy of Sciences, Beijing, 100190, China. E-mail: ywang507@iccas.ac.cn; weiyou@iccas.ac.cn
bUniversity of Chinese Academy of Sciences, Beijing 100049, China
First published on 19th June 2024
Abstract
To systematically explore the influence of microscopic substituent structures on the macroscopic dielectric properties of polyethylene (PE), ten PE derivatives, incorporating 18 mol% of diverse functional groups such as halogens, azides, norbornene-based groups, and macrocyclic structures, were synthesized using post-functionalization reactions from the same poly(ethylene-co-vinyl acetate) precursors. Using linear low-density PE (LLDPE) as a reference, the experimental results reveal the effective modulation of the dielectric constants of PE derivatives by introducing various functional groups. The PE units in the molecular chain ensure excellent compatibility of PE derivatives with LLDPE to form homogeneous polymer blends in molten states. Blending with LLDPE effectively reduces the dielectric loss of PE derivatives and exhibits a higher dielectric constant than LLDPE at the frequencies below 10 Hz. Notably, these blends exhibited a more pronounced temperature dependence of the dielectric constants, indicating higher values at elevated temperatures. More importantly, the dielectric breakdown strength of the blends was effectively enhanced, reaching up to 1.4 times that of LLDPE. In addition, improvements in the mechanical properties of the blends were also observed with the strain-at-break exceeding 1000%. This research confirms that post-polymerization functionalization provides an excellent platform to systematically evaluate the influence of substituents on synthetic polymers, and it is expected to generate new insights into the mechanisms of enhancing polymer dielectric properties.
Introduction
Dielectric polymers manifest electrical properties through the polarization within their molecular chains,1 which is the finite displacement of the electron cloud density of the dipoles, resulting in the formation of a net dipole moment when subjected to an electric field. These polymers have garnered significant attention and found applications in diverse fields, including film capacitors, electronic communications, and energy storage materials,2–5 owing to their characteristics of high flexibility, low density, and repeated processability.6,7 The polarizability of macromolecules is commonly assessed using the dielectric constant (ε′), wherein a higher ε′ represents a larger net dipole moment of the macromolecule. For instance, poly(vinylidene fluoride) (PVDF), containing high dipole moment C–F bonds, can exhibit a ε′ of ≥10,8–10 making it and its copolymers suitable for use in capacitors and piezoelectric and ferroelectric materials.11–15 On the other hand, biaxially oriented polypropylene (BOPP) films, demonstrating both a low ε′ and a low dielectric loss (ε′′),4,10,12 have been employed as electronic circuit components to meet the requirements of high electric field strengths and high frequencies.The polarization behavior of dielectric polymers is characterized by a multiscale nature, responding to a multilevel motion/relaxation process. This process encompasses electronic polarization (the relative displacement of the electron cloud), atomic polarization (the induced dipole moment between the centers of positive and negative charges), ionic polarization, dipolar (or orientational) polarization, and interfacial polarization on the phase domain boundaries (or the matrix–filler boundaries).3 In other words, the macroscopic dielectric properties of polymers and their composites result from the co-coupling microstructures at various scales, including the chemical structures of repeating units,9,16,17 molecular chain conformation,14,18 crystal forms,13,19 microphase separation,20,21 filler dispersion,22etc.
Over the past few decades, numerous studies have investigated methods to tune the dielectric properties of polymer-based materials. Generally, the ε′ of polymeric materials can be enhanced through three main approaches: modifying the structure of polymer backbones and substituents,13,23,24 modulating the microstructures with an external field,19,25,26 and incorporating inorganic fillers.27–29 Among these, structural design is fundamental and crucial, influencing both microstructures and the interaction between the polymer matrix and inorganic fillers. Zhu et al. successfully increased the ε′ of poly(methyl methacrylate) from 3.3–4.0 to 11.4 by introducing a sulfone group (–SO2–) with a high dipole moment while maintaining a low ε′′.23 Furthermore, the discharge energy density of this material tripled.23 The introduction of a trifluoroethylene comonomer into the poly(vinylidenefluoride) (PVDF) molecular chain to prepare a random copolymer P(VDF-TrFE) has been shown to enhance its piezoelectric coefficient and electromechanical coupling coefficient.13,24,30 Additionally, a further enhancement in the piezoelectric coefficient was reported, reaching 1000 pm V−1 for the prepared P(VDF-TrFE-CEF-FA) containing ≤2 mol% fluorinated alkyne (FA) comonomer, comparable to that of the representative ceramic oxidized material ZNT.31
The dielectric properties of the polymer undergo changes corresponding to alterations in the microstructures. For instance, among all the crystal phases of PVDF,32–35 the β crystal phase, with the largest net dipole moment, demonstrates the highest ε′ and the most pronounced dielectric properties.11 The induction of microstructures with high dipole moments through an externally applied field to enhance polarization is a topic that has garnered significant attention. Ma and his co-workers investigated the mechanisms of shear-induced β-crystal formation in PVDF,25,26 revealing that ionic interactions contribute to the formation of shear-induced β and γ crystals.36 It was also reported that β phases can be induced by uniaxial elongation, resulting in higher dielectric properties.37 Drawing from the study of various polyamides (PAs) with different chemical structures (such as PA610, PA612, PA1010, and PA1212), it was observed that higher crystallinity promotes the ferroelectric properties.19 Liang, Liu, and their colleagues demonstrated that thermoplastic polyurethane elastomers, featuring evident microphase separation, exhibited a high ε′ through changes in the species of the hard segments.21 However, the chemical structure of polymers significantly influences their microstructures. Considering the random copolymer poly(ethylene-co-vinyl acetate) (EVA), which consists of ethylene and vinyl acetate monomers, variations in the content of vinyl acetate led to changes in the crystal phase, chain dynamics, ε′, and ε′′.38,39
Incorporating inorganic nanofillers with high energy density and ε′ into flexible polymer materials is a crucial approach for enhancing the dielectric properties of polymer-based devices, such as film capacitors.27,28 This approach involves an increase of ε′ through accumulated dipoles at the boundaries of phase domains, known as interfacial polarization, observed in both polymer blends and nanofiller-reinforced systems.29,40 Interfacial compatibility between the polymer matrix and the filler plays a pivotal role in determining filler dispersion and, consequently, the device's performance.29,41 However, incorporating inorganic nanofillers into non-polar polymers such as polyethylene (PE) to increase ε′ poses significant challenges due to compatibility issues, leading to non-uniform filler distribution.
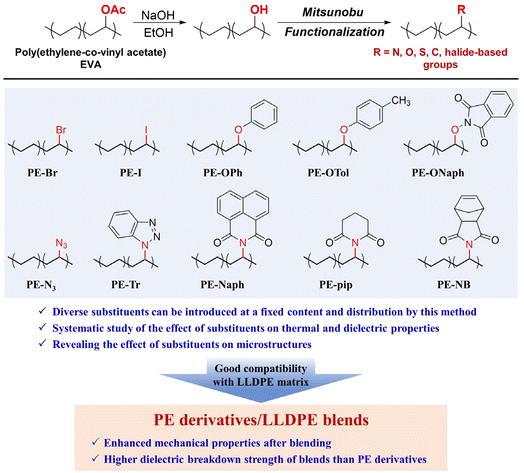
PE, as one of the most extensively manufactured polymers, exhibits one of the lowest dielectric constants among bulk materials, making it an ideal substrate for investigating the influence of substituents on polymer dielectric properties. Despite recent advancements in methods for preparing polar-group-functionalized PE derivatives, a comprehensive exploration of their dielectric properties is yet to be undertaken. This shortfall can be attributed to the inherent challenges associated with directly copolymerizing ethylene and polar vinyl monomers, wherein simultaneous control over functional group incorporation, distribution, and molecular weight proves elusive.42 Recently, our group reported a post-functionalization approach based on Mitsunobu reactions to efficiently synthesize a series of functional PE derivatives from commercial EVA precursors.43–45 Notably, the functionalization conditions do not need transition metal catalysts. More importantly, the complete conversion of functional groups ensures that the functional group contents, distribution, and molecular weight of the resulting PE derivatives are dictated by the EVA starting materials, thus providing a good platform to systematically study the influence of substituents on polymer properties. In this work, ten PE derivatives were synthesized (as shown in Scheme 1) to explore the structure–property relationship of dielectric polymers and provide guidance for enhancing the dielectric properties of polyolefins. The functional groups varied from halogens (–Br and –I) to phenyl ethers, azides, macrocyclic structures and norbornene-based groups, while the main chain structures and functional group contents among the ten samples remained the same. The substituents used in this study have two main advantages. Firstly, their intrinsic dipole moments and steric barriers vary depending on the chemical structure. Secondly, some substituents are expected to enhance the potential applications of the polymers. For example, the introduction of polar groups such as Br– and I– into the polymer backbones can effectively affect the energy density and efficiency of polymeric capacitors used for energy storage.46 On the other hand, aromatic- and aliphatic-ring substituents are expected to affect the band gap and Tg of the materials, which are important factors in determining the dielectric breakdown strength.47,48 Through a comparative analysis of these ten PE derivatives, we aim to unveil the influence of substituents on both the microstructure and macroscopic dielectric properties. Additionally, the PE units in the molecular backbone ensure good compatibility between the synthesized PE derivatives and PE materials. By melt blending, a small amount of PE derivatives effectively enhanced the dielectric and mechanical properties of the linear low-density PE (LLDPE) matrix, particularly the dielectric breakdown strength and the strain-at-break.
Experimental section
Materials
EVA with a vinyl acetate content of 40 wt% (= 18 mol%) was purchased from Aladdin Co., Ltd Shanghai, China. Its melt flow index was determined to be 52 g per 10 min at 190 °C under a 2.16 kg load according to ASTM D1238. The polyethylene derivatives were prepared according to our previously reported Mitsunobu-functionalization method.43 The functionalization achieved complete conversion as confirmed by FT-IR and NMR characterization.43 The synthesis procedure, along with the obtained NMR and FT-IR spectra of the PE derivatives shown in Scheme 1 (except for PE-OTol, which is described in the ESI, and its NMR and FT-IR spectra are provided in Fig. S1–S3†), is referenced elsewhere.43Preparation of PE derivatives/LLDPE blends
To investigate the compatibility of the obtained PE derivatives PE-Br, PE-I, and PE-OPh, as shown in Scheme 1, with the polymer matrix and the effect on their dielectric properties, commercial linear low-density poly(ethylene) (LLDPE, Macklin Inc. Shanghai, China) with a melt flow index of 2 g per 10 min at 190 °C under a 2.16 kg load was used as a matrix to prepare the blends. The PE-Br/LLDPE, PE-I/LLDPE, and PE-OPh/LLDPE blends (with a PE derivative content of 5.9 wt%) were prepared by a melt-mixing method using a co-rotating twin screw extruder-kneader (Haake MinLab II, Thermo Fisher Scientific) with a screw rotation speed of 30 rpm at 180 °C.Characterization of thermal properties
The glass transition (Tg), crystallization (Tc), and melting (Tm) temperatures were determined from the cooling and second heating traces by using differential scanning calorimetry (DSC Q200, TA Instruments Inc.) over −130 to 200 °C under a nitrogen atmosphere. The heating and cooling rates are 10 °C min−1. Thermal stability was evaluated by using thermogravimetric analysis (TGA 8000, PerkinElmer) from 50 to 600 °C at a heating rate of 20 °C min−1. The degradation onset temperature and the temperature corresponding to the peak in the first-order derivative curve are represented by Td and Tpeak, respectively.X-ray measurements
The wide-angle X-ray diffraction (WAXD) and small-angle X-ray scattering (SAXS) experiments were conducted on a Xeuss 2.0 WAXD/SAXS system (Xenocs SA). X-ray radiation was generated using a Cu Kα X-ray source with a wavelength of 1.5418 Å (GeniX3D Cu ULD). The used sample-to-detector distances were 150 mm and 2500 mm for WAXD and SAXS measurements, respectively. All of the films of the synthesized PE derivatives and their blends (with a thickness of ca. 0.5 mm) were obtained by melting them at 180 °C and hot pressing at 5 MPa for 3 min, followed by quick cooling to room temperature under compression. A semiconductor detector (Pilatus 300k, DECTRIS) with a resolution of 487 × 619 pixels (pixel size of 172 × 172 μm2) was used to collect 2-D WAXD/SAXS patterns, with selected acquisition times of 300 s and 900 s, respectively. The 1-D intensity profiles were integrated from the background-corrected WAXD/SAXS patterns, which are corrected for detector noise, air scattering, and sample absorption.Characterization of dielectric properties
The dielectric constant (ε′) and loss (ε′′) of PE derivatives and their blends were measured in the temperature range of 0–120 °C at 20 °C intervals using broadband dielectric spectroscopy with the Quatro temperature control system and a cryostat under a nitrogen atmosphere, and the temperature accuracy was maintained within ±0.1 °C. The broadband dielectric spectroscopy system included a low-frequency module (Alpha-A High Performance Frequency Analyzer) and a high-frequency module (Agilent E4991A RF Impedance/Material Analyzer). Disk samples with a diameter and thickness of 20 mm and approximately 100 μm, respectively, were cut from the hot-pressed films (melted at 180 °C and then pressed at 5 MPa for 3 min) and secured between parallel plate electrodes. A frequency sweep ranging from 107 to 10−2 Hz was conducted at each temperature, with a ramp rate of 10 °C min−1 to transition to the next measurement temperature. The dielectric breakdown strength (εb) of the samples with a thickness of ca. 0.5 mm was determined by applying an increasing electrical field using a high voltage power supply at a boost rate of 20 V s−1 at 25 °C and RH 30% until breakdown. Measurements were repeated ten times for each sample.Morphology observation
The morphology of the as-prepared blends PE-Br/LLDPE, PE-I/LLDPE, and PE-OPh/LLDPE with sputtering platinum (thickness of ca. 4 nm) was observed by scanning electron microscopy (SEM, Hitachi SU-8020) under an accelerated voltage of 10 kV. Elemental distribution was characterized using energy dispersive spectroscopy (EDX GENESIS).Tensile testing
Thin tensile strips (10 mm width, 150 mm length, and ca. 0.1 mm thickness) were cut from the hot-pressed film (melted at 180 °C and then pressed at 5 MPa for 3 min). The plots of engineering stress versus engineering strain were obtained using Instron 3365 at a constant crosshead speed of 6 mm min−1. All measurements were repeated five times for each sample.Dynamic mechanical analysis (DMA)
A DMA (Q800, TA Instruments) was used to record the temperature dependence of dynamic storage (E′) and loss (E′′) moduli from −130 to 90 °C at a rate of 3 °C min−1 under 1 Hz, with a given strain of 0.1%. The strip sample dimensions were 25 mm/3 mm/0.5 mm (length/width/thickness). The Tg,DMA was determined by the peak temperature of E′′.Results and discussion
Synthesis and characterization of PE derivatives via the Mitsunobu reaction
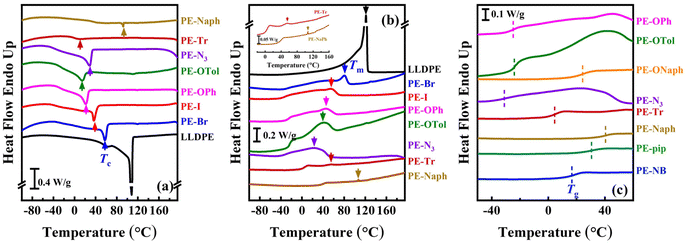
In this study, EVA with a vinyl acetate content of 18 mol% was selected to prepare the PE derivatives, conferring a high degree of functionalization while maintaining PE-like backbones. The sequential alcoholysis and Mitsunobu (or Appel) functionalization do not affect the functional group contents and polymer chain lengths. Consequently, ten products shown in Scheme 1 were successfully prepared, featuring 18 mol% functionalization with diverse groups, ranging from halogens (–Br and –I) to phenyl ether, azides, macrocyclic structures and norbornene-based groups. Most of the products are challenging to be prepared by traditional direct copolymerization approaches, and the 1H, 13C NMR, and FT-IR spectra were identical to our previous report.43The influence of functional groups on the characteristic temperatures such as Tg, Tc, and Tm of the semi-crystalline PE derivatives (excluding the amorphous PE-ONaph, PE-pip, and PE-NB) was compared by the DSC cooling/heating traces (Fig. 1). Using LLDPE with saturated C–H bonds as a basis for comparison, it was found that the Tc, Tm, and their corresponding enthalpy changes (ΔHc and ΔHm) gradually decreased as the steric barrier of functional groups increased (see PE-Br, PE-I, PE-OPh, and PE-OTol in Table 1), indicating a deterioration in crystallization ability. Additionally, PE-ONaph, PE-pip, and PE-NB were amorphous polymers without crystallization and melting peaks in the DSC traces. Their glass transition steps are shown in Fig. S4.† TGA curves (shown in Fig. S5†) revealed a two-stage weight loss for certain PE derivatives, namely PE-OPh, PE-OTol, PE-ONaph, PE-Nr, and PE-pip, exhibiting corresponding two Tds and Tpeaks (listed in Table 1). In the case of PE-Naph and PE-NB, even three stages of weight loss were detected, suggesting a more complex thermal degradation behavior among the studied PE derivatives. Notably, the first Td of the PE derivatives with multiple weight loss stages is lower than the single Td of LLDPE, suggesting that the functional groups degrade more rapidly than the PE backbone.
| Sample | T g (°C) | T c (°C) | ΔHc (J g−1) | T m (°C) | ΔHm (J g−1) |
T
d![[thin space (1/6-em)]](https://www.rsc.org/images/entities/char_2009.gif) (°C)
(°C) |
|---|---|---|---|---|---|---|
| a N.D. denotes not determined. b Multiple peaks were detected in some samples. | ||||||
| LLDPE | N.D.a | 107.4 | 89.3 | 120.6 | 90.8 | 440.6 |
| PE-Br | N.D. | 57.5 | 31.8 | 80.5 | 29.5 | 446.7 |
| PE-I | N.D. | 36.5 | 27.9 | 53.4 | 26.8 | 421.0 |
| PE-OPh | −24.4 | 20.9 | 25.6 | 45.0 | 17.8 | 229.2, 448.7 |
| PE-OTol | −22.7 | 14.3 | 18.3 | 42.5 | 17.4 | 221.6, 462.1 |
| PE-ONaph | 24.6 | N.D. | N.D. | N.D. | N.D. | 236.0, 451.2 |
| PE-N3 | −30.3 | 25.7 | 27.1 | 26.0 | 28.7 | 221.0, 397.8 |
| PE-Tr | 4.7 | 9.9 | 5.2 | 54.4 | 4.7 | 391.6 |
| PE-Naph | 41.1 | 92.3 | 1.3 | 107.2 | 1.4 | 218.7, 272.4, 412.3 |
| PE-pip | 31.5 | N.D. | N.D. | N.D. | N.D. | 253.9, 476.9 |
| PE-NB | 19.0 | N.D. | N.D. | N.D. | N.D. | 227.7, 363.4, 467.2 |
Not only does the thermal stability vary with the functional groups, but the unit-cell structure of the synthesized PE derivatives also differs. In the 1-D WAXD curve of LLDPE, two diffraction peaks located at 2θ = 21.4° and 23.7° suggest a typical orthorhombic unit cell (Fig. S6†). However, the 1-D WAXD curves of PE-I and PE-Naph differ significantly from that of LLDPE. Both of them exhibit more than three diffraction peaks, as shown in Fig. S6.† It has been reported in the literature that the addition of halogen groups can alter the crystalline structure of the PE backbone.49 On the other hand, for PE-N3 with azide groups, only a single diffraction peak at 2θ = 20.9° was found, implying the induction of a hexagonal unit cell of LLDPE (Fig. S6†).50 The hexagonal phase of PE is usually obtained under high temperature, high pressure, or physical treatments. In our work, the functional groups affect the unit cell structure and chain conformation, in agreement with the previous literature.49–51 The differences in the unit cell are likely responsible for the high Tc and Tm of PE-Naph.
Effect of functional groups on the dielectric properties of PE derivatives
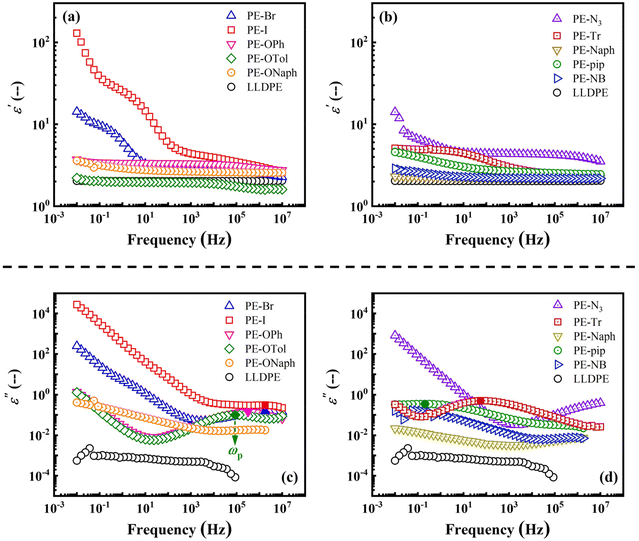
Restricted by the polymerization routes, current literature results make it difficult to comprehensively compare various types of functional groups, especially the complex macrocyclic groups. Our post-functionalization route, based on the Mitsunobu reaction, not only significantly shortens material preparation cycles but also avoids the drawback of altering the distribution of functional groups in the main chain during traditional direct addition copolymerization, providing a more solid foundation for this study.In Fig. 2, double logarithmic plots of ε′ ((a) and (b)) and ε′′ ((c) and (d)) versus frequency measured at 23 °C for each PE derivative are illustrated. The results clearly demonstrate that the ε′ of PE derivatives can be effectively modulated by introducing functional groups (see the dielectric properties in Table S1†). For instance, the plots of PE-OTol and PE-Naph closely resemble that of LLDPE, while the ε′ of PE-N3 remains above 5.0 over a wide frequency range. Remarkably, the ε′ at low frequencies (10−2–10−1 Hz) can be enhanced by more than one or two orders of magnitude by inserting the –Br and –I groups (PE-Br and PE-I). Although the ε′ of the semi-crystalline product PE-I decreases rapidly with increasing frequency, it still surpasses 3 up to 105 Hz, which is higher than those of many reported systems.9,10,52 Furthermore, these results confirmed the advantages of our post-functionalization route in investigating the effect of subtle chemical structure differences on the dielectric properties of polymeric materials. For example, the additional methyl group on the branched chain of PE-OTol, compared to PE-OPh, results in a decrease in its ε′ from approximately 3 to ca. 2 (see Fig. 2(a)). Compared to PE-N3, the introduction of benzene not only reduces the ε′ of PE-Tr but also affects the dielectric relaxation behaviors as illustrated by the ε′ and ε′′ plots shown in Fig. 2(b) and (d). The ε′′ peak shifting toward low frequency for PE-Tr compared to PE-N3 in Fig. 2(d) implies that benzene delays the relaxation. To clarify whether the relaxation behavior observed in Fig. 2(c) and (d) is due to whole chain relaxation or segment relaxation, the semi-log plots of the relaxation timescale (τ, determined by the reciprocal of the frequency at the ε′′ peak ωp) versus the inverse temperature of PE-OPh and PE-Naph are given in the Fig. S7.† In both cases, the experimental results can be well fitted by the Vogel–Fulcher–Tammann (VFT) equation:53,54τ = τ0 × exp(B/(T − T0)), where τ0 is the relaxation time in the limit of high temperature, B is a constant, and T0 is the Vogel temperature. The fitting results suggest that the detected ε′′ peaks are related to segment relaxation rather than whole chain relaxation.55 The characteristic temperatures of PE-OPh and PE-Naph corresponding to τ of 100 s (Tτ=100 s) were extrapolated to be −10.7 °C and 39.1 °C, respectively. For PE-OPh, Tτ=100 s is higher than its Tg of −24.4 °C obtained by DSC, while for PE-Naph, Tτ=100 s is slightly lower than its Tg of 41.1 °C. This slowed segment mobility may lead to a slower polarization, possibly responsible for the decrease in the ε′ of PE-OTol and PE-Tr in the high-frequency region. The segment dynamics is also related to the ωp. When the substituents delay segment relaxation, the ωp shifts toward low-frequency, requiring a longer timescale to polarize in large dimensions, i.e., dipolar polarization, resulting in a high ε′. For example, the onset of the increase in ε′ occurs with decreasing frequency due to the respective ωp of PE-OPh, PE-Tr, and PE-pip (see Fig. 2(c), (d) and Table S1†).
We then compared the variable-temperature dielectric results of selected PE derivatives to understand the dependence of segment relaxation and polarization behaviors on temperature. Such understanding is crucial, especially when considering the operation conditions of dielectric devices, such as film capacitors and electronic packaging materials, which may involve high temperatures.
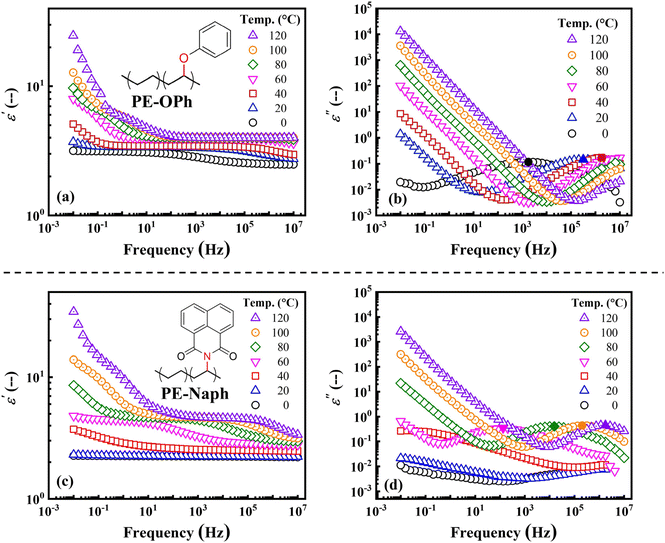
Fig. 3 shows the ε′ ((a) and (c)) and ε′′ ((b) and (d)) versus frequency plots obtained from 0 to 120 °C, revealing distinct trends. The ε′ of PE-OPh shows a slight increase in the range of 105–107 Hz, rising from approximately 2.52 to 3.36 at 105 Hz as the temperature increases from 0 to 40 °C (before its Tm). However, the ε′ of the melt of PE-OPh at 105 Hz remains almost constant at 4.0 under the subsequent heating from 80 to 120 °C. On the other hand, ε′ at low frequency (10−2 to 101 Hz) increases with temperature, ranging from 3.16 at 0 °C to 24.7 at 120 °C for the measured ε′ at 10−2 Hz. In contrast to PE-OPh, the ε′ of PE-Naph increases with temperature over a wide frequency range above its Tg. In particular, at low frequency, the ε′ at 10−2 Hz increased from 2.26 at 0 °C to 34.48 at 120 °C, surpassing that of PE-OPh. While polymers with benzene ring groups are generally considered to be less polarizable due to weak chain mobility and have lower ε′ and ε′′, it was found that the ε′ and ε′′ of PE-Naph with two aromatic rings were higher than those of PE-OPh at a given temperature. In other words, although the steric hindrance of PE-Naph is larger, the chain mobility is better, which can be attributed to its lower crystallinity.
Fig. 4(a) and (b) show the temperature dependence of the ε′ at 103 and 107 Hz, respectively. PE derivatives of PE-Br, PE-I, PE-OPh, and PE-Naph all exhibit a similar temperature dependence of the ε′ (refer to their plots of ε′ versus frequency obtained at various temperatures in Fig. S8†), whereas the ε′ of LLDPE is almost independent of the temperature. The results indicate a more pronounced increase in ε′ with temperature for PE derivatives before reaching their respective Tm. Further investigations focusing on chain dynamics are required to reveal the mechanism by which functional groups influence the temperature dependence of ε′.
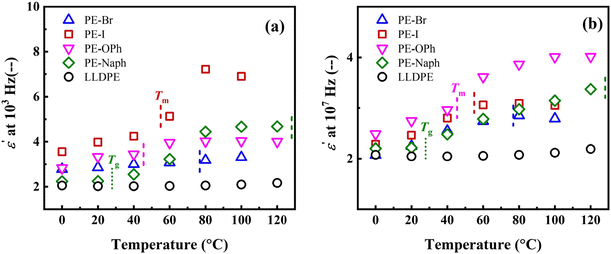 | ||
| Fig. 4 Temperature dependence of the ε′ measured at (a) 103 and (b) 107 Hz, respectively. The respective Tg and Tm were indicated in the plots. | ||
Dielectric properties of the blends of PE derivatives with LLDPE
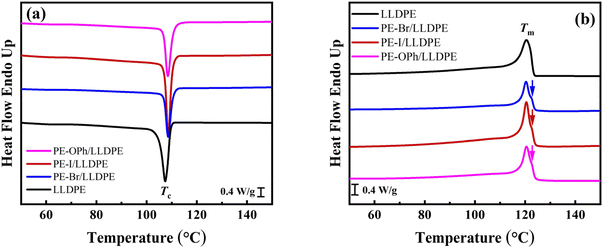
One drawback of our PE derivatives is the elevated ε′′, reaching about 10−1 (as observed in PE-Br, PE-I, and PE-OPh in Fig. 2(c)), which is two orders of magnitude higher than that of LLDPE (around 10−3). ε′′ is a crucial indicator for assessing the performance of dielectric polymers. Generally, a ε′′ below 10−2 is considered effective for applications, and some high-performance dielectric materials have reported values around 10−3.56,57 In this study, the synthesized PE derivatives, namely PE-Br, PE-I, and PE-OPh with higher ε′, were blended with the low-ε′′ LLDPE at 200 °C (in the molten state) to prepare polymer blends with both high ε′ and low ε′′. The relatively low degree of functionalization (18 mol%) was expected to ensure good interfacial compatibility between the three PE derivatives and the LLDPE matrix. To maintain low ε′′ in these blends, a low concentration of 5.9 wt% was used for the PE derivatives. The SEM and EDX mapping images of the blends of PE-Br, PE-I, and PE-OPh with LLDPE are shown in Fig. 5(a)–(c) (the determined elemental composition is listed in Table S2†), demonstrating the uniform dispersion of PE derivatives in the matrix without phase separation at the micrometer scale.The determined Tds of the three blends were all above 400 °C (see Table 2, and the TGA curves are shown in Fig. S9†), indicating their good thermal stability. To reveal the effect of PE derivatives on the crystallization behavior of the LLDPE matrix, their DSC traces were compared, as shown in Fig. 6. Interestingly, the three PE derivatives were found to have the ability to induce crystallization of the LLDPE matrix at a higher Tc (see Fig. 6(a)), increasing from 107.4 °C in LLDPE to 108.4–108.6 °C in the blends (see Table 2). Although the Tm during subsequent heating (Fig. 6(b)) was nearly identical to that of LLDPE, the crystallinity of the LLDPE matrix increased after blending with PE-I and PE-OPh as their higher melting enthalpy normalized to the LLDPE content (ΔHm,n). The melting enthalpy of the reference material of LLDPE is detailed in Table 1. In contrast to the single melting peak of LLDPE, small shoulder peaks were detected in the heating curves of the blends (indicated by the arrows in Fig. 6(b)), suggesting the formation of some crystals with high Tm (or thicker lamellae). Furthermore, no crystallization or melting peak of the used PE derivatives was evident in the DSC traces. Thus, the selected PE derivatives induce the crystallization of LLDPE but do not crystallize by themselves. Given that the crystal diffractions of the blends are consistent with that of LLDPE (see 1-D WAXD curves in Fig. S10†), we conclude that the PE derivatives are located in the amorphous region and are not involved in the crystal lattice of LLDPE.
The dielectric properties of the three blends at room temperature are presented in Fig. 7, demonstrating the benefits of blending with LLDPE. Blending significantly reduced ε′′ by more than one order of magnitude compared to the PE derivatives themselves (Fig. 2(c)). The magnitude of the ε′′ peak was lowered to approximately 10−2 (Fig. 7(b)), meeting commercial quality standards. By comparing the dielectric properties of the blend of reactant EVA (the vinyl acetate content of 18 mol%) with LLDPE (refer to Fig. S11†), it was found that ε′ was effectively enhanced for PE-Br/LLDPE, PE-I/LLDPE, PE-OPh/LLDPE at low frequencies by inserting the substituents via the Mitsunobu functionalization method. Notably, even at low concentrations (5.9 wt%), the PE derivatives enhance ε′ at frequencies below 10 Hz, reaching up to 8.9 for PE-OPh/LLDPE at 0.01 Hz (Fig. 7(a)). Specifically, the ε′ of PE-OPh exhibited weak frequency dependence, remaining constant at ca. 3.40, but a noticeable decrease in ε′ was observed in the 10−2–100 range for the PE-OPh/LLDPE blend. On the other hand, the ε′′ of PE-Br and PE-I decreased by approximately one order of magnitude after blending with LLDPE, but the ε′′ of PE-OPh/LLDPE was about three orders of magnitude lower than that of PE-OPh (Fig. 7(b)). Moreover, the ε′′ peak position of studied samples remained unchanged after blending with LLDPE, indicating that the LLDPE blending does not affect the relaxation time (the reciprocal of the ε′′ peak position) but only reduces ε′′.
More importantly, we noticed that by adding small amounts of PE derivatives, the εb of the LLDPE matrix also effectively improved (see Fig. 7c and Table 3), with the εb of PE-OPh/LLDPE approximately 1.4 times that of the LLDPE matrix. εb is a critical factor in device performance, and an increase in the working electric field often results in better dielectric properties until the material undergoes breakdown. Based on the literature,18,58 the chain mobility plays a crucial role in determining the εb. Recently, the εb of PEI/PI blends was reported to be higher than that of respective homopolymers, attributed to the higher molecular chain packing density in the blend.59 Hence, enhancing εb in polymeric materials involves forming a more dense chain packing. The high εb observed in PE-Br/LLPDE and PE-OPh/LLDPE can be ascribed to the higher crystallinity of the LLDPE component induced by the PE derivatives. This is supported by the fact that PE-OPh/LLDPE with the highest ΔHm,n, as shown in Table 2, exhibits the highest εb. However, PE-I/LLDPE exhibits a lower εb than PE-Br/LLDPE despite its higher ΔHm,n, which is possibly caused by the large radius of iodine, and the amorphous region containing molecular chains of PE derivatives and LLDPE may form a denser packing. As no significant Tm or crystal reflection corresponding to PE-Br, PE-I, and PE-OPh themselves (those of the LLDPE matrix) were observed in the DSC (Fig. 6) and 1-D WAXD (Fig. S10†) curves, respectively, the crystallization of PE derivatives in the blends is negligible. Based on the WAXD result, the unit cell of PE-I is very different from that of LLDPE, yet the PE-I/LLDPE blend exhibits a typical orthorhombic unit cell of PE. Therefore, the molecular chains of PE-Br, PE-I, and PE-OPh are located in the amorphous region for the three blends. A higher εb should be obtained if a certain dense structure is established in the amorphous region through the interactions between the PE derivatives and LLDPE chains.
| Sample | ε′@10−2 Hz | ε′@100 Hz | ε′@103 Hz |
ω
p![[thin space (1/6-em)]](https://www.rsc.org/images/entities/char_2009.gif) a (Hz) a (Hz) |
ε′′p![[thin space (1/6-em)]](https://www.rsc.org/images/entities/char_2009.gif) b b |
ε
b![[thin space (1/6-em)]](https://www.rsc.org/images/entities/char_2009.gif) c (kV mm−1) c (kV mm−1) |
|---|---|---|---|---|---|---|
| a Corresponding frequency at the ε′′ peak. b Peak value in the plot of ε′′ versus frequency. c The average breakdown strength of the studied blends at room temperature. | ||||||
| PE-Br/LLDPE | 2.38 | 2.11 | 2.01 | 4.2 × 10⁶ | 3.0 × 10⁻³ | 99.5 ± 13.9 |
| PE-I/LLDPE | 2.75 | 2.44 | 2.08 | 4.2 × 10⁶ | 9.2 × 10⁻³ | 76.9 ± 9.9 |
| PE-OPh/LLDPE | 2.81 | 2.21 | 2.10 | 7.5 × 10⁵ | 1.2 × 10⁻² | 106.9 ± 13.4 |
These experimental results clearly demonstrated that the selected PE derivatives can successfully improve the εb of polymer blends. This approach is expected to be advantageous for polymer/nano-filler composite systems, as the functional groups on the PE derivatives allow tunable interfacial compatibility or interactions between polymer chains and nano-fillers.
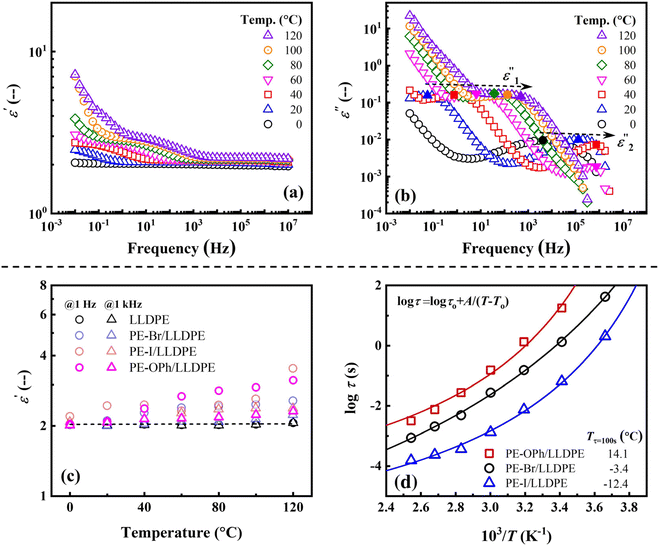
The temperature dependence of the ε and ε′′ of the PE-OPh/LLDPE blend, which exhibits the highest ε′ among the three blends, was investigated to assess its suitability for high-temperature applications. As depicted in Fig. 8(a), ε′ demonstrates a significant increase at elevated temperatures, particularly in the low-frequency region. This differs from LLDPE, where ε′ remains constant until the melting temperature (refer to Fig. S8(e)†). The increase in ε′ diminishes from the low-frequency to high-frequency regions during the heating process, suggesting that the chain mobility of the added PE-OPh is not constrained by the LLDPE matrix, leading to observable polarization behavior. This behavior is consistent with that observed for PE-Br/LLDPE and PE-I/LLDPE (see Fig. S12†). In Fig. 8(b), two ε′′ peaks were detected in the measured frequency range (similar peaks were observed for PE-Br/LLDPE and PE-I/LLDPE; see Fig. S12†). The first peak, ε′′1, occurs between 0.06 Hz and 315.90 Hz, while the second peak, ε′′2, is located between 4.2 × 10³ Hz and 7.5 × 10⁵ Hz. The relaxation time of ε′′1 is longer than that of ε′′2 due to the lower ωp. Upon heating, both ε′′1 and ε′′2 peaks gradually shift toward higher frequencies, indicating a decrease in their respective τ with increasing temperature. Fig. 8(c) further illustrates a more pronounced temperature dependence of ε′ at both 1 Hz and 1 kHz for all three PE derivatives compared to LLDPE as temperature increases. The similar temperature dependence of τ determined by the ε′′1 peak of the three blends is shown in Fig. 8(d). The VFT equation provides a good fit for the three plots shown in Fig. 8(d), confirming that the detected ε′′1 peaks are related to segmented relaxation. The characteristic Tτ=100 s were determined to be −3.4 °C, −12.4 °C, and 14.1 °C for PE-Br/LLDPE, PE-I/LLDPE, and PE-OPh/LLDPE, respectively. Unfortunately, it is difficult to compare the respective Tτ=100 s with Tg for the three blends, as their Tgs could not be determined from the DSC traces. Given that several electric components operate at elevated temperatures due to the waste heat generated during service, blending with PE derivatives presents potential for dielectric applications of polyolefin-based materials.
Influence of PE derivatives on the mechanical properties of LLDPE-based blends
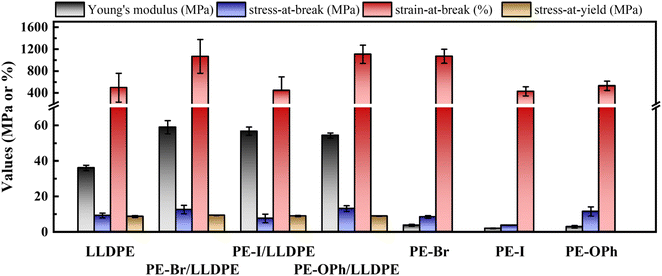
Depending on the application, the mechanical properties required for polymeric materials may vary. For instance, electrical devices demand sufficient strength and flexibility for effective protection. Polymer blending serves as a valuable method for fine-tuning these mechanical properties. In this section, we aim to describe the influence of PE derivatives on the mechanical properties and the underlying mechanism when blended with an LLDPE matrix. The results obtained will contribute to the development of polymeric materials with superior dielectric and flexibility characteristics.Fig. 9 shows the comparison results of the three PE derivatives PE-Br, PE-I, and PE-OPh and their blends. Due to the low crystallinity of PE-Br, PE-I, and PE-OPh, their engineering stress–strain plots reveal significant flexibility in contrast to LLDPE (refer to Fig. S13†). Specifically, the strain-at-break is higher, but the modulus and strength are noticeably weaker (Table S3†). Surprisingly, Young's modulus for the studied blends reached 54–59 MPa, approximately 1.5 times that of the LLDPE matrix. Moreover, the strain-at-break of both PE-Br/LLDPE and PE-OPh/LLDPE exceeded 1000% (similar to elastomers’ results60), which is twice that of the LLDPE matrix. These results highlight that PE derivatives can enhance not only the modulus (and stress-at-break) but also flexibility. Among the three PE derivatives, PE-Br exhibits the greatest enhancement of the mechanical properties of the LLDPE matrix, while PE-I only improved Young's modulus with a negligible effect on the strain-at-break/stress-at-break. The excellent mechanical properties of PE-Br/LLDPE and PE-OPh/LLDPE are demonstrated by the strain-at-break and stress-at-break, which are comparable to those of the blend of LLDPE with the reactant EVA (a commonly used elastomer) at a same composition of 5.9 wt% (see Table S3†).
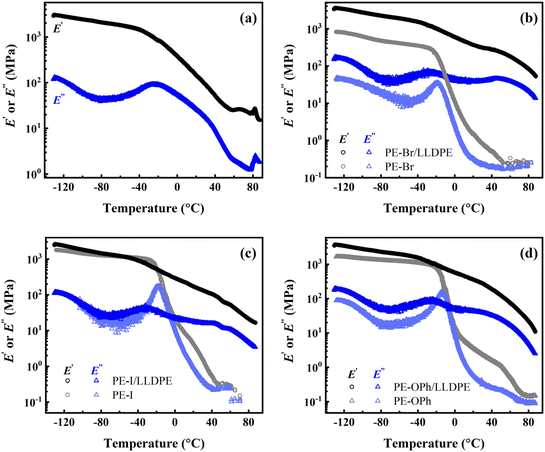
When two polymers are incompatible, their blends are prone to fracture easily under the applied deformation owing to their phase separation behavior. Based on the EDX mapping results (Fig. 5), no evident phase domain is observed at the microscale for the three studied blends. In the polymer blends61 or copolymer systems,62–64 DMA is a common method to study the presence of (micro-)phase separation. The temperature dependence of the dynamic storage (E′) and loss (E′′) moduli was compared to clarify whether the microphase domain exists (as shown in Fig. 10). Only a single Tg,DMA was detected in the LLDPE matrix, while two Tg,DMAs were found in all three blends, implying significant differences between the microstructures of the LLDPE matrix and the studied blends. Moreover, PE derivatives (PE-Br, PE-I, and PE-OPh) all exhibit only one Tg,DMA in their DMA results, suggesting weak or no microphase separation structure, which is supported by the extremely weak signal observed in the 1-D SAXS plots (Fig. S14†) obtained by quenching from 200 °C using a liquid nitrogen bath for the three PE derivatives. The weak SAXS signals also suggest that long-rang ordered morphologies may not have formed. The E′′ peak in the DMA plots of the three blends within 30–50 °C indicates that a certain structure is established, possibly due to crystallinity or microphase separation. Barbosa et al. found that low-temperature shifts of the E′′ peaks and the disappearance of one peak occurred in modified EVA quenched using a liquid nitrogen bath, usually exhibiting less crystallinity.65 However, the effect of crystallinity on the E′′-T plot is controversial. Some literature reported only shifts in peak position without peak formation or disappearance when crystallinity changed due to blending66,67 or copolymerization.68,69 Unfortunately, preparing amorphous blends of LLDPE with PE derivatives to clarify the microphase separation via SAXS is challenging due to easy crystallization and a low Tg of the LLDPE matrix (reported as ca. −30 °C (ref. 70) and −130 °C (ref. 71 and 72) by different groups using linear diatometry), as evidenced by the DSC cooling traces of the studied blends at approximately 50 °C min−1 (see Fig. S15†). Crystallization of PE was still observed even at a cooling rate of 1 × 10⁶ K s−1 using Flash DSC.73 Thus, the obtained 1-D SAXS profile may contain signals from both crystal and possible microphase separation, making it difficult to elucidate the presence of a microphase separation structure. We currently believe that a certain microstructure forms in the LLDPE blend with PE derivatives, leading to a new E′′ peak formed at 30–50 °C, but we cannot determine its nature. Considering that the synthesized PE derivatives are random copolymers, we suspect this microstructure is related to microphase separation when the difference in chemical compatibility between the PE monomer and the substituents is sufficiently large.
As shown in Fig. 10(b)–(d), the Tg,DMA in the range of −32 to −24 °C closely matches that of the respective PE derivatives for all the studied blends (see Table S4†), while the other Tg,DMA of 30–50 °C is higher than that of the PE derivatives and the LLDPE matrix. The former one may be explained by the Tg,DMA reducing to a value closer to that of the PE backbone (reported as −30 °C (ref. 70)) due to the high fraction of the LLDPE matrix. The higher Tg,DMA may be attributed to the specific microstructure formed after blending with LLDPE, contributing to the higher E′ at elevated temperatures. This microstructure may act as a physical crosslinking network during the uniaxial deformation at room temperature, endowing the blends with a higher Young's modulus than that of the LLDPE matrix at near crystallinity. On the other hand, the amorphous molecules of the PE derivative provide flexibility to the blends, allowing them to withstand greater strain.
The formed microstructure can also explain the excellent dielectric properties of the blends. The amorphous chain segments of PE derivatives with better mobility are more likely to undergo polarization, contributing to high ε′ at elevated temperatures. Moreover, the specific microstructure can result in a denser packing of the amorphous chains of PE derivatives and LLDPE, thereby enhancing the εb. Unfortunately, the microstructures could not be further investigated using the SAXS technique because the scattering signal is difficult to distinguish from the signal of the LLDPE crystals. More studies are needed to explore the evolution of the microstructure in detail under the applied stretching/electric fields for PE derivative-based systems, providing new insights into the modulation of the dielectric properties of polymeric materials.
Conclusions
In this work, ten PE derivatives obtained by the post-functionalization reaction from the same commercial EVA precursors (18 mol% functional group contents) were employed to compare the impact of functional group structures on the microstructures, thermal properties, and mechanical properties. This approach allows the examination of differences in chemical structures and their effects on the dielectric properties, as exemplified by PE derivatives PE-OPh and PE-OTol. Meanwhile, it facilitates the exploration of dielectric properties in novel polymers containing complex functional groups. Experimental results show a significant influence of the structure of functional groups on the ε′ of the PE derivatives. PE-Br and PE-I exhibit ε′s one and two orders of magnitude higher than that of LLDPE at low frequencies, respectively. PE-N3 containing azide functional groups displays a ε′ greater than 3.0 over the measured frequency range, while PE-Naph containing a naphthalimide structure exhibits a low ε′ almost identical to that of LLDPE. The comparison of the crystal structure and thermal properties reveals that PE-I and PE-Naph have a unit cell structure different from that of LLDPE, and the Tm of PE-Naph is the highest among all the samples. Our strategy demonstrates potential for developing novel dielectric polymers with high melting temperatures and ε′ through an in-depth study of the relationship between the microstructure and properties.PE-Br/LLDPE, PE-I/LLDPE, and PE-OPh/LLDPE blends with a 5.9 wt% fraction of PE derivatives were successfully prepared, and the PE backbone in the molecular chains ensured good compatibility between the PE derivatives and the LLDPE matrix. The ε′′ of the PE derivatives was reduced by 1–2 orders of magnitude through blending with LLDPE, while the added PE derivatives enhanced the ε′ compared to LLDPE at frequencies below 10 Hz. Notably, the blends exhibit a more pronounced temperature dependence of ε′ compared to LLDPE, with ε′ increasing as the temperature rises. Moreover, PE-Br and PE-OPh have been shown to increase the εb of blends, and the εb of PE-OPh/LLDPE is 1.4 times higher than that of the LLDPE matrix. The PE derivatives PE-Br, PE-I, and PE-OPh induce the crystallization of the LLDPE matrix, as evidenced by both Tc and ΔHm,n, although they are not involved in the unit cell. The PE derivatives enhance the mechanical properties of the blends, including Young's modulus, stress-at-break, and strain-at-break. Surprisingly, PE-Br/LLDPE and PE-OPh/LLDPE exhibit elastomer-like behavior, reaching a strain-at-break of more than 1000%. These results demonstrate that adding a small amount of PE derivatives can simultaneously enhance the dielectric properties, mechanical properties, and crystallization temperature of the commercial LLDPE matrix, offering considerable potential for large-scale production and economic value.
Data availability
The data supporting this article have been included as part of the ESI.†Conflicts of interest
The authors declare no competing financial interests.Acknowledgements
This work was financially supported by the Beijing Municipal Natural Science Foundation (Grant No. 2232074) and the National Natural Science Foundation of China (Grant No. 22175188). The authors also acknowledge the assistance of Prof. Ming Tian (Beijing University of Chemical Technology) and Prof. Nanying Ning (Beijing University of Chemical Technology) in dielectric breakdown strength measurements.References
- F. Kremer and A. Schönhals, Broadband Dielectric Spectroscopy, Springer-Verlag Berlin Heidelberg, New York, 2003 Search PubMed.
- L. Zhu, J. Phys. Chem. Lett., 2014, 5, 3677–3687 CrossRef CAS.
- S. Wang, C. Yang, X. Li, H. Jia, S. Liu, X. Liu, T. Minari and Q. Sun, J. Mater. Chem. C, 2022, 10, 6196–6221 RSC.
- R. Cheng, Y. Wang, R. Men, Z. Lei, J. Song, Y. Li and M. Guo, iScience, 2022, 25, 104837 CrossRef CAS PubMed.
- R. G. Lorenzini, W. M. Kline, C. C. Wang, R. Ramprasad and G. A. Sotzing, Polymer, 2013, 54, 3529–3533 CrossRef CAS.
- T. D. Huan, S. Boggs, G. Teyssedre, C. Laurent, M. Cakmak, S. Kumar and R. Ramprasad, Prog. Mater. Sci., 2016, 83, 236–269 CrossRef CAS.
- D. W. van Krevelen and K. Te Nijenhuis, Properties of Polymers, Elsevier, The Netherlands, 2009 Search PubMed.
- P. Barber, S. Balasubramanian, Y. Anguchamy, S. Gong, A. Wibowo, H. Gao, H. Ploehn and H.-C. Zur Loye, Materials, 2009, 2, 1697–1733 CrossRef CAS.
- Prateek, V. K. Thakur and R. K. Gupta, Chem. Rev., 2016, 116, 4260–4317 CrossRef CAS PubMed.
- M. Zhang, B. Li, J. J. Wang, H. B. Huang, L. Zhang and L. Q. Chen, Adv. Mater., 2021, 33, e2008198 CrossRef PubMed.
- L. Zhu and Q. Wang, Macromolecules, 2012, 45, 2937–2954 CrossRef CAS.
- X.-J. Liu, M.-S. Zheng, G. Chen, Z.-M. Dang and J.-W. Zha, Energy Environ. Sci., 2022, 15, 56–81 RSC.
- Z. Zhu, G. Rui, R. Li, H. He and L. Zhu, Macromolecules, 2021, 54, 9879–9887 CrossRef CAS.
- J.-Y. Ren, Q.-F. Ouyang, G.-Q. Ma, Y. Li, J. Lei, H.-D. Huang, L.-C. Jia, H. Lin, G.-J. Zhong and Z.-M. Li, Macromolecules, 2022, 55, 2014–2027 CrossRef CAS.
- E. Baer and L. Zhu, Macromolecules, 2017, 50, 2239–2256 CrossRef CAS.
- W. Fan, Y. Du, Z. Yuan, P. Zhang and W. Fu, Macromolecules, 2023, 56, 6482–6491 CrossRef CAS.
- Y. Chen, X. Chen, Y. Wang, Z. Nie, X. Wang, J. Tan, Y. Zhuang, X. Liu and X. Wang, Macromolecules, 2023, 56, 9379–9388 CrossRef CAS.
- C.-Y. Liu, D.-L. Li, Y. Li, L. Xu, X. Meng, G.-J. Zhong, H.-D. Huang and Z.-M. Li, Macromolecules, 2022, 55, 9680–9689 CrossRef CAS.
- A. Yanaka, W. Sakai, K. Kinashi and N. Tsutsumi, RSC Adv., 2020, 10, 15740–15750 RSC.
- S. Zhang, H. Hu, H. Yu, Y. Huang and J. Yang, Macromol. Res., 2017, 25, 381–385 CrossRef CAS.
- G. Chen, Y. Liang, D. Xiang, S. Wen and L. Liu, J. Mater. Sci., 2017, 52, 10321–10330 CrossRef CAS.
- D. Ai, H. Li, Y. Zhou, L. Ren, Z. Han, B. Yao, W. Zhou, L. Zhao, J. Xu and Q. Wang, Adv. Energy Mater., 2020, 10, 1903881 CrossRef CAS.
- J. Wei, Z. Zhang, J. K. Tseng, I. Treufeld, X. Liu, M. H. Litt and L. Zhu, ACS Appl. Mater. Interfaces, 2015, 7, 5248–5257 CrossRef CAS PubMed.
- H. Luo, F. Wang, R. Guo, D. Zhang, G. He, S. Chen and Q. Wang, Adv. Sci., 2022, 9, e2202438 CrossRef PubMed.
- Z. Chu, L. Liu, Y. Lou, R. Zhao, Z. Ma and Y. Li, Ind. Eng. Chem. Res., 2020, 59, 4459–4471 CrossRef CAS.
- Z. Chu, L. Liu, Y. Liao, W. Li, R. Zhao, Z. Ma and Y. Li, Polymer, 2020, 203, 122773 CrossRef CAS.
- Q. K. Feng, S. L. Zhong, J. Y. Pei, Y. Zhao, D. L. Zhang, D. F. Liu, Y. X. Zhang and Z. M. Dang, Chem. Rev., 2022, 122, 3820–3878 CrossRef CAS PubMed.
- S. Cheng, Y.-S. Li, J.-J. Liang and Q. Li, Acta Polym. Sin., 2020, 51, 469–483 CAS.
- B. Fan, M. Zhou, C. Zhang, D. He and J. Bai, Prog. Polym. Sci., 2019, 97, 101143 CrossRef CAS.
- K. Omote, H. Ohigashi and K. Koga, J. Appl. Phys., 1997, 81, 2760–2769 CrossRef CAS.
- X. Chen, H. Qin, X. Qian, W. Zhu, B. Li, B. Zhang, W. Lu, R. Li, S. Zhang, L. Zhu, F. Domingues Dos Santos, J. Bernholc and Q. M. Zhang, Science, 2022, 375, 1418–1422 CrossRef CAS PubMed.
- Z. Cui, N. T. Hassankiadeh, Y. Zhuang, E. Drioli and Y. M. Lee, Prog. Polym. Sci., 2015, 51, 94–126 CrossRef CAS.
- M. Li, H. J. Wondergem, M. J. Spijkman, K. Asadi, I. Katsouras, P. W. Blom and D. M. de Leeuw, Nat. Mater., 2013, 12, 433–438 CrossRef CAS PubMed.
- A. J. Lovinger, Macromolecules, 2002, 15, 40–44 CrossRef.
- R. Hasegawa, Y. Takahashi, Y. Chatani and H. Tadokoro, Polym. J., 1972, 3, 600–610 CrossRef CAS.
- Z. Chu, R. Zhao, B. Wang, L. Liu, Z. Ma and Y. Li, Macromolecules, 2021, 54, 3800–3809 CrossRef CAS.
- J.-T. Wang, Z. Chen, Y.-Q. Wang, Y.-F. Chu, M. Pan and L.-J. Dong, Acta Polym. Sin., 2020, 51, 1367–1373 CAS.
- J. A. S. Puente, B. Rijal, L. Delbreilh, K. Fatyeyeva, A. Saiter and E. Dargent, Polymer, 2015, 76, 213–219 CrossRef CAS.
- I. Šics, T. A. Ezquerra, F. J. BaltÁ Calleja, V. Tupureina and M. Kalninš, J. Macromol. Sci., Part B: Phys., 2007, 39, 761–774 CrossRef.
- S. Srinivasan, Fuel Cells: From Fundamentals to Applications, Springer, New York, 2006 Search PubMed.
- J. O. M. Bookris, A. K. N. Reddy and M. Gamboa-Aldeco, Modern Electrochemistry: Fundamentals of Electrodics, Kluwer Academic, New York, 2nd edn, 2002 Search PubMed.
- C. Tan and C. Chen, Angew. Chem., Int. Ed., 2019, 58, 7192–7200 CrossRef CAS PubMed.
- Y. Zhang, T. Wang, J. Bai and W. You, ACS Macro Lett., 2021, 11, 33–38 CrossRef PubMed.
- Y. Zhang, Y. Wang and W. You, Acta Polym. Sin., 2023, 54, 1836–1843 CAS.
- Y. Zhang, Y. Wang and W. You, J. Appl. Polym. Sci., 2023, 140, e54711 CrossRef CAS.
- J. Mao, S. Wang, Y. Cheng, B. Xiao, L. Zhang, D. Ai, Y. Chen, W. Sun and J. Luo, Chem. Eng. J., 2022, 444, 136331 CrossRef CAS.
- C. Wu, A. A. Deshmukh, O. Yassin, J. Zhou, A. Alamri, J. Vellek, S. Shukla, M. Sotzing, R. Casalini, G. A. Sotzing and Y. Cao, Proc. Natl. Acad. Sci. U. S. A., 2021, 118, e2115367118 CrossRef CAS PubMed.
- A. A. Deshmukh, C. Wu, O. Yassin, A. Mishra, L. Chen, A. Alamri, Z. Li, J. Zhou, Z. Mutlu, M. Sotzing, P. Rajak, S. Shukla, J. Vellek, M. A. Baferani, M. Cakmak, P. Vashishta, R. Ramprasad, Y. Cao and G. Sotzing, Energy Environ. Sci., 2022, 15, 1307–1314 RSC.
- P. Kaner, C. Ruiz-Orta, E. Boz, K. B. Wagener, M. Tasaki, K. Tashiro and R. G. Alamo, Macromolecules, 2013, 47, 236–245 CrossRef.
- N. Naga, R. Arai, G. Kikuchi, A. Toyota, K. Noguchi, M. Sone, F. Shirae, T. Gotoh and H. Kurosu, Polymer, 2011, 52, 4857–4866 CrossRef CAS.
- H. Janani, S. F. Marxsen, M. Eck, S. Mecking, K. Tashiro and R. G. Alamo, ACS Macro Lett., 2024, 201–206, DOI:10.1021/acsmacrolett.3c00639.
- J. Lu, Y. Zhang, J. Li, M. Fu, G. Zou, S. Ando and Y. Zhuang, Macromolecules, 2023, 56, 2164–2174 CrossRef CAS.
- G. S. Fulcher, J. Am. Ceram. Soc., 1925, 8, 339–355 CrossRef CAS.
- G. Tammann and W. Hesse, Z. Anorg. Allg. Chem., 2004, 156, 245–257 CrossRef.
- A. R. Brás, M. T. Viciosa, Y. Wang, M. Dionísio and J. F. Mano, Macromolecules, 2006, 39, 6513–6520 CrossRef.
- X. Zhang, D. Zhu, H. You, Y. Hashimoto, T. Miyata, P. Chammingkwan and T. Taniike, ACS Appl. Electron. Mater., 2022, 4, 1257–1265 CrossRef CAS.
- C. Zhang, X. He and Q. Lu, Eur. Polym. J., 2023, 200, 112544 CrossRef CAS.
- C.-Y. Liu, D.-L. Li, Z.-H. Wang, Y. Li, S.-Y. Zhou, L. Xu, G.-J. Zhong, H.-D. Huang and Z.-M. Li, Macromolecules, 2023, 56, 1481–1491 CrossRef CAS.
- V. Jurečič, N. Novak, L. Fulanović and V. Bobnar, Macromolecules, 2023, 56, 1097–1104 CrossRef.
- Y.-L. Qin, P. Zhu, C.-X. Ouyang and X. Dong, Chin. J. Polym. Sci., 2023, 42, 87–96 CrossRef.
- Y. Li, C. Zhang and S. Zheng, Eur. Polym. J., 2011, 47, 1550–1562 CrossRef CAS.
- M. Wang, L. Zhang and D. Ma, Eur. Polym. J., 1999, 35, 1335–1343 CrossRef CAS.
- J. T. Garrett, R. Xu, J. Cho and J. Runt, Polymer, 2003, 44, 2711–2719 CrossRef CAS.
- T. A. Speckhard, G. V. Strate, P. E. Gibson and S. L. Cooper, Polym. Eng. Sci., 2004, 23, 337–349 CrossRef.
- R. V. Barbosa, R. B. Neto, R. S. Mauler, C. J. P. Gorga, C. G. Schneider and A. G. Simanke, J. Appl. Polym. Sci., 2005, 97, 1371–1376 CrossRef CAS.
- A. R. Aragão Melo, E. Oliveira da Silva, L. R. Menezes and M. I. B. Tavares, Polym. Test., 2018, 68, 333–339 CrossRef.
- P. A. Lovell, J. L. Stanford, Y. F. Wang and R. J. Young, Macromolecules, 1998, 31, 834–841 CrossRef CAS.
- Z. Xu and S. Zheng, Macromolecules, 2007, 40, 2548–2558 CrossRef CAS.
- Y. Miura, T. Kaneko, K. Satoh, M. Kamigaito, H. Jinnai and Y. Okamoto, Chem. – Asian J., 2007, 2, 662–672 CrossRef CAS PubMed.
- J. H. Magill, S. S. Pollack and D. P. Wyman, J. Polym. Sci., Part A: Gen. Pap., 1965, 3, 3781–3786 CrossRef CAS.
- P. R. Swan, J. Polym. Sci., 1960, 42, 525–534 CrossRef CAS.
- M. L. Dannis, J. Appl. Polym. Sci., 1959, 1, 121–126 CrossRef CAS.
- E. Zhuravlev, V. Madhavi, A. Lustiger, R. Androsch and C. Schick, ACS Macro Lett., 2016, 5, 365–370 CrossRef CAS PubMed.
Footnote |
| † Electronic supplementary information (ESI) available: Additional data of TGA, dielectric measurement, mechanical experiments for the PE derivatives and their blends. The determined elemental composition in the PE-Br/LLDPE, PE-I/LLDPE, and PE-OPh/LLDPE blends. The comparison of 1-D WAXD curves of the obtained PE derivatives and the blends from PE-Br/LLDPE to PE-OPh/LLDPE. The 1-D SAXS plots of the PE derivatives PE-Br, PE-I, and PE-OPh at room temperature. The engineering stress–strain plots of the obtained PE-Br, PE-I, PE-OPh and their blends from PE-Br/LLDPE to PE-OPh/LLDPE. Temperature dependence of the dielectric properties of PE-Br, PE-I, LLDPE, PE-I/LLDPE, and PE-OPh/LLDPE. The cooling and second heating DSC traces of LLDPE, PE-Br, PE-I, PE-OPh and their blends (PE-Br/LLDPE, PE-I/LLDPE, and PE-OPh/LLDPE) after quenching from 200 °C at a rapid rate of 50 °C min−1. See DOI: https://doi.org/10.1039/d4lp00117f |
| This journal is © The Royal Society of Chemistry 2025 |

