
 Open Access Article
 This Open Access Article is licensed under a
 Creative Commons Attribution 3.0 Unported Licence
Kinetics of charge-dependent reversible condensation of reflectin nanostructures†
Iana
Lychko‡
 ab,
Cátia Lopes
Soares‡
ab,
Arménio Jorge Moura
Barbosa
ab,
Tomás Rosa
Calmeiro
c,
Rodrigo Ferrão de Paiva
Martins
c,
Ana Margarida Gonçalves Carvalho
Dias
*ab and
Ana Cecília Afonso
Roque
*ab
ab,
Cátia Lopes
Soares‡
ab,
Arménio Jorge Moura
Barbosa
ab,
Tomás Rosa
Calmeiro
c,
Rodrigo Ferrão de Paiva
Martins
c,
Ana Margarida Gonçalves Carvalho
Dias
*ab and
Ana Cecília Afonso
Roque
*ab
aAssociate Laboratory i4HB – Institute for Health and Bioeconomy, School of Science and Technology, Universidade NOVA de Lisboa, 2829-516 Caparica, Portugal. E-mail: cecilia.roque@fct.unl.pt; margarida.dias@fct.unl.pt
bUCIBIO – Applied Molecular Biosciences Unit, Department of Chemistry, School of Science and Technology, Universidade NOVA de Lisboa, 2829-516 Caparica, Portugal
cCENIMAT|i3N, Department of Materials Science, School of Science and Technology, Universidade NOVA de Lisboa, 2829-516 Caparica, Portugal
First published on 25th November 2024
Abstract
Reflectins are unique cephalopod proteins found in specialized cells. They form fast triggerable nanostructures in vivo that play a crucial role in light reflection and camouflage. We investigated the rapid kinetics of in vitro reversible self-assembly of two recombinant reflectin sequences (R1b and R6) using pH variations as a trigger. By employing experimental and theoretical approaches across scales, we demonstrated that R6 exhibits superior reversibility and faster assembly kinetics. R6 maintained reversible assembly for up to 7 rapid pH cycles, with changes occurring in less than 20 minutes. This enhanced performance is attributed to R6's higher content of pH-sensitive residues and favorable charge distribution. Our findings impact the design of reflectin-inspired artificial biophotonic systems, offering potential applications in sensors, adaptive optics, and dynamic display technologies.
Introduction
Octopuses, squids, and cuttlefishes have an incredible capacity to blend into their environment through light manipulation processes that occur in a matter of milliseconds.1,2 Dynamic camouflage in cephalopods results from the combination of skin pigmentation with iridescence, transparency, and light scattering phenomena originating from reflective tissues – iridophores and leucophores. Reflectins are a cephalopod-specific family of structural proteins found at high concentrations in these reflective tissues (estimated concentration exceeding 380 mg mL−1![[thin space (1/6-em)]](https://www.rsc.org/images/entities/char_2009.gif) 3). In iridophores, reflectins are organized into platelets that act as biological Bragg reflectors, reflecting specific wavelengths of incident light. In leucophores, reflectins are assembled into particulate structures involved in Mie scattering and diffuse reflection.4
3). In iridophores, reflectins are organized into platelets that act as biological Bragg reflectors, reflecting specific wavelengths of incident light. In leucophores, reflectins are assembled into particulate structures involved in Mie scattering and diffuse reflection.4
Reflectins are intrinsically disordered proteins (IDPs) with an unusual sequence composition, abundant in highly polarizable amino acids such as phenylalanine, methionine, cysteine, tyrosine, tryptophan, and histidine. The canonical sequence of reflectins resembles a block copolymer. It encompasses a highly conserved N-terminal sequence followed by tandem repeats of blocks of linkers and repeating motifs (RMs), in which RMs have the typical sequence M/FDX5MDX5MDX3-4 (X = S, Y, Q, W, H, R, G). There are also other non-canonical reflectin sequences found in cephalopods iridocytes, but less prevalent.5,6 In biological tissues, reflectins form electron-dense protein microstructures7 that exhibit a high refractive index (e.g. 1.51–1.54)8–10 due to dense packing and condensation of reflectin particles.
The organization and function of reflectins found in iridophores are particularly intriguing. Iridophores are classified into two types: (i) static iridophores, in which reflectin particles remain highly condensed, resulting in single wavelength reflection;11 and (ii) dynamic iridophores, which exhibit tuneable changes in the assembly and condensation of reflectin particles, switching between reflective and non-reflective states.12 Examples of static iridophores include the light organ reflector of Euprymna scolopes13 and the eye reflector of Doryteuthis opalescens.14 Dynamic iridophores are found in animals that modulate their skin iridescence. The dynamic color modulation is triggered by acetylcholine-induced reversible phosphorylation of reflectin amino acid side chains (tyrosine, serine, and histidine).5,9 Reflectins are predominantly basic proteins with an average isoelectric point (pI) of 8.6 ± 0.5. Consequently, they are mostly positively charged at a typical physiological pH environment (∼7.2). Upon phosphorylation, protein charges are neutralized leading to the assembly, condensation and packing of reflectins from oligomers into multimers. This causes variations in the reflectin-based Bragg reflector and wavelength shifts of the reflected light, since the thickness of the platelets and the distance between them change.9
Understanding the sequence–function relationship of the in vivo reversible self-assembly of reflectins from dynamic iridophores is important to shed light onto the molecular mechanisms of biological light manipulation in cephalopods, but also to inspire the design of protein-based stimuli-responsive materials.15–17 Prior studies predicted that phosphorylation sites of reflectins directly extracted from dynamic iridophores (Doryteuthis pealeii and Doryteuthis opalescens)5,18 are primarily located in the linker sequences connecting the characteristic RMs. Later, wild-type reflectins from Doryteuthis opalescens dynamic iridophores were recombinantly produced and used to study a surrogate system of charge neutralization in vitro, mimicking the reversible phosphorylation–dephosphorylation in vivo events.19 It was shown that the reversible titration of the excess positive charges – comparable to that produced by phosphorylation – is sufficient to drive the reversible condensation and hierarchical assembly of reflectins.19 Follow-up studies with the same set-up were used to understand charge-induced condensation in a model wild-type reflectin from Doryteuthis opalescens dynamic iridophores and designed mutants. These studies established a positive correlation between the amount of histidine residues in the linkers and their ability to undergo reversible self-assembly upon pH variation.20 What remains to be clarified is if reflectins with identical canonical sequence architecture possess a similar dynamic in reversible condensation in vitro. To address this challenge, we investigate in vitro the reversible assembly as a function of pH and time for two reflectins from different species: Reflectin 1b (R1b) from Euprymna scolopes;13 and Reflectin 6 (R6) inspired by sequences found in Octopus bimaculoides.21 The novelty of this study lies in the combination of experimental and theoretical approaches to examine the conformational and morphological aspects of in vitro reflectin assembly across scales and time. Additionally, this work emphasizes the kinetics of reflectins reversible assembly for distinct engineered protein sequences, with important implications for the design of artificial stimuli-responsive biophotonic systems.
Materials and methods
Materials
Detailed information about the materials and reagents can be found in ESI.† All reagents were purchased with the highest grade.Production of recombinant reflectin proteins
Gene cloning, the recombinant production of reflectins and purification were performed according to the previously reported protocols.22 Briefly, the gene of Reflectin R1b (R1b, Uniprot entry: Q6WDN7)13 and Reflectin 6 (R6, identified as Ocbimv_skin_comp51140_c0_seq1_Scaffold210828 and deposited in Sequence Read Archive as BioProject PRJNA270931;21 accessed date: July 2019) were purchased from GeneCust (France). Both genes were codon-optimized for the E.coli expression system. R1b gene was synthesized in a transport vector (pUC57) and then cloned into an expression vector (pET15b vector (ampR), cat# 69661-3, Novagen) according to cloning protocols described in Lychko et al.22 The construct of the R6 gene was outsourced directly in pET15b with an N-terminal 6xHistidine tag and Ndel and BamHl restriction endonucleases. The recombinant proteins were expressed in E.coli and subsequently purified via immobilized metal affinity chromatography (IMAC), following the protocol outlined in Lychko et al.22 Pure protein fractions were pooled and dialyzed against water for 48 h and lyophilized. The purified proteins were analysed with 12.5% polyacrylamide SDS-PAGE gel. The purity was determined by densitometry through Image J23 and the total protein concentration was calculated with a bicinchoninic acid (BCA) protein assay kit (cat# B9643, Sigma Aldrich) as previously described in.22 Bovine serum albumin (BSA, cat# B9643, Sigma Aldrich) was used as a protein standard.In all characterization studies, we opted for aqueous buffers to dissolve reflectins. The pH of the solubilization solutions was adjusted to either 3.0 or 8.0. Such pH conditions aimed to induce charge variations in the protein residues, aligning with our research objectives and improving protein dissolution. The composition of solvents used is described below. All solvents were filtered through a 0.2 μm filter (cat# 10462200, Whatman). The identity of the proteins R1b and R6 was confirmed previously by western blot and MALDI-TOF.22
Circular dichroism (CD)
Far-ultraviolet circular dichroism (CD) was employed to assess the secondary structure of reflectins in distinct pH environments and the structural changes that occur in response to pH alterations. A Chirascan qCD spectropolarimeter was utilized to record all spectra. The measurements were conducted at a temperature of 25 °C, employing the wavelength scan mode with a 1 nm bandwidth and a step size of 1 nm within the range of 200 to 260 nm. Each sample was measured in duplicate and three accumulations were obtained, which then were averaged and smoothed. The resulting data was adjusted for solvent contributions and converted to Molar Ellipticity units ([θ], deg cm2 dmol−1) by mean of the equation: [θ] = (θobs)/(C × L × 10) where: θobs is the observed ellipticity in millidegree; C is the concentration in g L−1 and L is a path of cell in cm (0.2 cm). All data were processed using Origin (Pro), Version 2022 (OriginLab Corporation, Northampton, MA, USA). The data were then analysed using BeStSel,24 to estimate the secondary structure content.The folding of reflectins was examined in 5 mM Na-Acetate/Hac pH 3.0. Both reflectins were dissolved at a final concentration of 2 mg mL−1 and incubated overnight with constant agitation (∼100 rpm). Before analysis, protein samples were centrifuged (10000×g for 10 min) and the resulting supernatants were collected and used for measurements.
Morphological analysis of nanostructures
AFM analyses were conducted using an Asylum Research MFP-3D Stand Alone AFM system. Prior to analyses, R1b and R6 samples from reversibility studies were diluted at a ratio 1:30, resulting in a final concentration of 0.05 mg mL−1. Next, 10 μL of the resultant dilution was loaded onto a mica layer and dried overnight in a dust-free environment. Images were taken from three different regions of each sample to ensure representative results. All measurements were performed in alternate contact mode in air, using commercially available silicon AFM probes (Olympus AC160TS; k = 26 N m−1; f0 = 300 kHz) with a minimum resolution of 256 × 1024 points. AFM images were plane-fitted and analysed in Asylum Research's software packages and by Image J 31.23
Scanning transmission electron microscopy (STEM)
Scanning transmission electron microscopy analysis was performed with a Hitachi HF5000. Negative staining was performed with uranyl acetate (UA) aqueous solution, which was prepared by adding 0.2 g of solid uranyl acetate to 10 mL of Milli-Q water. Next, the solution was mixed gently to facilitate the dissolution and left to stand overnight in the fume hood, at room temperature and wrapped in aluminum foil to protect from light.During sample preparation for microscopic analysis first, the TEM carbon lacey grid (Ted Pella) was mounted on the STEM holder and transferred into a glow discharge unit (Zonetem II, Sanyu Co.) for cleaning. Next, 5 μL of R6 (at pH 8.0) solution with a final concentration of 0.05 mg mL−1 was carefully deposited on top of the grid and dried under vacuum for 5 min. The negative staining was performed by deposition of 10 μL of UA solution on top of the grid for 15 s and careful removal of the excess with the tip of the filter paper. This process was repeated two more times. Finally, the grid was dipped for a few seconds into Milli-Q water and dried under vacuum for 5 min.
The resulting STEM images were analyzed in Hitachi's native software and by Image J.23
In silico studies
Reflectin 1b structure was retrieved from AlphaFold Protein Structure Database (R1b, Uniprot entry: Q6WDN7).25,26 Reflectin 6 structure was modelled using AlphaFold2, the fasta sequence of Reflectin 6 (engineered sequence reported in Lychko et al.22) was provided as input, and the best ranked obtained model had a pLDDT < 50 for all residues as expected for an intrinsically disordered protein.000 steps using the steepest descent followed by 10000 steps using conjugate gradient algorithms. Using simulated annealing, the system was then heated to 298 K during 250 ps, followed by a 250 ps NVT equilibration at 289 K using Particle Mesh Ewald (electrostatics) and Verlet (van der Waals) algorithms with cut-off 1.0 nm. The simulation run was performed in NPT conditions at 298 K with the same equilibration parameters, at 1 atm using Parrinello–Rahman barostat, for 10 ns, with a 2 fs time step.
GROMACS tools were used for the simulation analysis to address potential energy, total energy, temperature and pressure variations during equilibration and simulation time (see Fig. S1 and S2, ESI†). Simulation trajectories were visualized with Visual Molecular Dynamics version 1.9.3 5.
Subsequently, 40 reflectin coarse-grained protein models were randomly inserted in a box of 50 × 50 × 50 nm. The box was solvated and neutralized by adding water molecules and Cl− ions. The system was minimized and equilibrated with the same conditions described before for CG-MD simulation, and the production runs were calculated for 6 μs.
The radius of gyration of the protein assembly and solvent-accessible surface area were evaluated over the trajectory using GROMACS gyrate and SASA tools, respectively. The solvent surface area was calculated with a solvent probe of 0.4 nm. Aggregation propensity (AP), for the 6 μs production runs, was determined using the following formula: SASA (first frame)/SASA (last frame). Structure visualization and tools to monitor simulations were performed as described before in All-atom MD (see Fig. S3–S6, ESI†).
Variation of % of exposed amino acid residue was calculated using the next equation: % Δ pH 3–pH 8 = % of the residue exposed at pH 3.0- % of the residue exposed at pH 8.0.
Dynamic light scattering (DLS) and zeta potential measurements
DLS experiments were conducted to examine how recombinant R1b and R6 proteins condense in solution in response to pH-induced changes in protein net charge.Firstly, the lyophilized R1b and R6 were resuspended in high-grade water (pH 5.0) to a final concentration of 4.0 mg mL−1. Protein solutions were then centrifuged (10000 x g for 15 min), and the protein content in the supernatant was quantified by BCA assay, and then diluted to 0.3 mg mL−1 in 5 mM Na-Acetate/HAc pH 3.0 or 5 mM Tris–HCl pH 8.0, upon overnight incubation at room temperature with constant magnetic stirring (∼100 rpm).
We then started to assess pH-induced reversible self-assembly by following the Levenson et al.20 protocol (Fig. 5A). Reflectin samples (0.3 mg mL−1) in 5 mM Na-Acetate/HAc pH 3.0 were dialyzed overnight against 5 mM Tris–HCl pH 8.0 (Spectra Pre-Treated RC tubing; cut-off 10 kDa), after which pH was reduced to 3.0 by adding 5% (v/v) HAc, followed by 1 h incubation. DLS measurements were taken at the start, after overnight dialysis, and 1 h post-acidification. Then we repeated the protocol, but the acidification was done by overnight dialysis (Fig. S7A, ESI†). At the beginning of the assay and following overnight incubation, small aliquots were collected for monitoring conformational changes with CD and morphological changes using AFM. Finally, we studied shorter timescales. Proteins (0.3 mg mL−1) in acidic Milli-Q water (pH 3.0) underwent four sequential pH variations: 3.0 to 8.0, 8.0 to 3.0, 3.0 to 8.0 and 8.0 to 3.0 as shown in Fig. S7B and C (ESI†). DLS measurements were taken at the beginning of the assay, then 30 and 60 min after each pH change (for R6 we also studied 20 min and 8 sequential pH cycles).
All DLS measurements were performed using the Malvern Nano Zeta-Sizer or Horiba Scientific Nano Particle Analyzer SZ-100 (173° scattering angle). For analysis, 1 mL of the prepared protein solution was loaded into disposable DLS cuvettes (cat# MAPM-F10, LabBox) and the sample was pre-equilibrated to 25 °C for 1 min. Data plots and standard deviations were calculated from an average of triplicates, with an average of 15–20 runs per measurement. pH was constantly monitored using indicator strips (range: 1–12). To adjust pH, small volumes of NaOH (1.0 M or 2.5 M) or acetic acid (5.0% or 30% v/v) were slowly added except in the cases when dialysis was performed against buffer solution. Control experiments were performed with aqueous solutions without protein and with bovine serum albumin (BSA) as a non-aggregated control protein. BSA control samples were prepared in parallel under conditions identical to reflectins. To calculate the zeta potential (ζ-potential) of reflectins, the electrophoretic mobility was measured through folded capillary zeta cells (DTS 1061 ZetaSizer, Malvern), thus zeta-potential is calculated by applying Henry's equation: 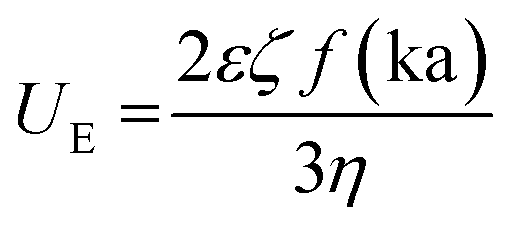 where: ζ is zeta potential, UE electrophoretic mobility, η medium viscosity, ε is dielectric constant and f(ka) is Henry's function that according to Smoluchowski's approximation is 1.5. The R1b and R6 net charge at different pH was calculated using the primary amino acid sequence and the web protein tool Prot pi v 2.2.29.151.
Results and discussion
Reflectin sequences with pH-triggerable residues
The selection of protein sequences for this study was based on the reflectins canonical sequence and the distinct number of histidine residues. Levenson and colleagues studied native reflectin sequences from dynamic iridophores and related mutants in vitro, highlighting the role of His protonation state, as well as His number and location in the protein sequence, as a surrogate of reversible phosphorylation events that trigger the dynamic self-assembly of reflectins in vivo.19,20 Our study employs a similar approach to investigate reflectin protein sequences from different animal species. However, we recognize that these in vitro approaches have limitations that cannot be directly extrapolated to in vivo environments. In particular, the difference in charge between phosphorylated residues (−2) and acidic residues (−1), may affect electrostatic interactions and protein condensation. We focus on Reflectin 1b (R1b) identified in the light organ reflector of Euprymna scolopes13 and Reflectin 6 (R6) inspired by proposed sequences from Octopus bimaculoides.21,27Both selected proteins have multiple conserved Repeating Motifs (RMs) typical of reflectins, characterized by the low-complexity sequence M/FDX5MDX5MDX3-4 (X = S, Y, Q, W, H, R, G). R1b and R6 contain 4 and 3 conserved RMs, respectively, along with the highly conserved N-terminal domain MEPMSRMTMDFQ/HGRY/LMDSQGRM/IVDP (Fig. 1). The RMs are linked by regions of varying amino acid composition and length.13
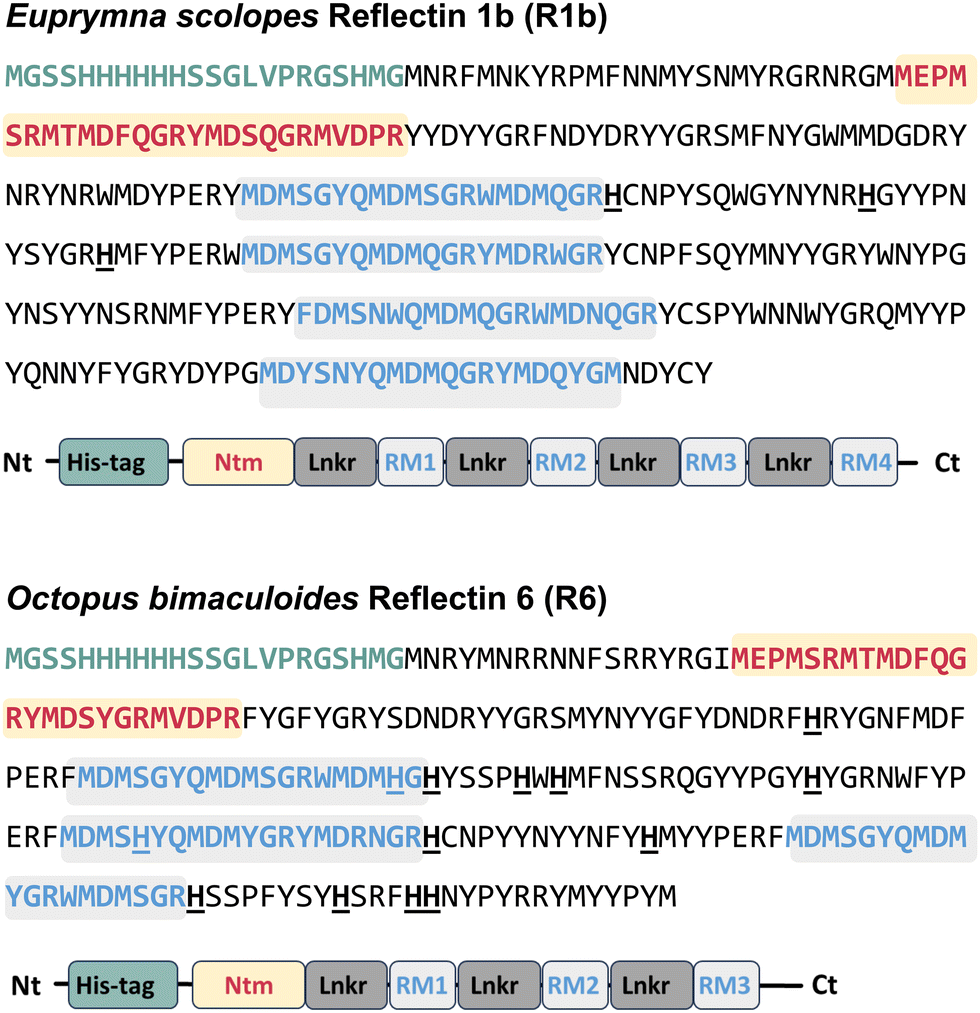 | ||
| Fig. 1 Sequences of the recombinantly expressed R1b and R6 used in this study and schematical representation of their sequence structure. The conserved N-terminal motifs (Ntm) and reflectin repeating motifs (RM) are highlighted in red and blue respectively. Histidine tag (His-tag) together with the sequence used as spacer between tag and reflectin sequence is represented in green. Linkers (Lnkr) are shown in dark grey. Histidine residues of the wild-type sequence are highlighted in bold and underlined. | ||
The sequence composition of R1b and R6 is similar to other known reflectins characterized by high levels of rare residues like tyrosine, methionine, and arginine, and low levels of common aliphatic residues like alanine, isoleucine, leucine, and lysine (Fig. S8A, ESI†). R1b and R6 stand out from previously studied reflectins from Doryteuthis due to their higher aromatic content, with 27% in R1b and 26% in R6, compared to 18% in Doryteuthis reflectins. Additionally, they have relatively lower histidine levels, with 1% for R1b and 5% for R6, compared to 8–9% in Doryteuthis proteins. Thus R1b and R6 possess an amino acid sequence that promote protein–protein interactions and higher-order assemblies through weak short-range interactions (e.g. π–π, cation–π, and sulphur–π).5,28,29 The amino acid distribution significantly differs between the RMs and linker regions (Fig. S8B, ESI†). The RMs are rich in methionine, comprising 25–28% of their residues, while the linker regions are enriched in tyrosine and phenylalanine and have a relatively higher abundance of proline and asparagine compared to the RMs.
The selected R1b and R6 sequences differ in their histidine content, with R1b containing 3 residues (1% of the total sequence) and R6 containing 13 residues (5% of the total sequence), primarily in the linker regions. This excludes the conserved 6-histidine tag at the N-terminal, which is present in both proteins. On the other hand, it should be noted that the predicted number of phosphorylation sites in Ser and Tyr residues (22 and 21 for R1b and R6, respectively) and location (majorly located in the linker regions, Fig. S8C and Table S1, ESI†) are similar between the two reflectin sequences. This suggests that both protein sequences would theoretically have the same potential for charge-tunability in vivo as charge condensation is triggered by acetylcholine-induced phosphorylation. Therefore, they represent interesting models to study in vitro charge-induced assembly by surrogate pH variation.
The two reflectin sequences used in this study were recombinantly produced by overexpression as inclusion bodies (IBs) in Escherichia coli Rosetta (DE3) cells (Fig. S9, ESI†). The resultant IBs-containing pellets were solubilized in buffers with denaturing agents and purified under denaturing conditions by immobilized metal affinity chromatography (IMAC) (Fig. S10, ESI†). This step yielded approximately 158 ± 2 and 173 ± 4 mg of pure protein/L of culture for R1b and R6 respectively, with an estimated purity above 90% (Fig. S11, ESI†). These results were in line with our previous report.22 It is important to note that we opted to maintain the His-tag throughout the experimental and computational studies. Removing the His-tag increases production costs, which is not desirable when considering the application of recombinant reflectin sequences for in vitro artificial biophotonic systems.
Evaluation of reflectin assemblies formed at two different protonation states
Reflectins are described as IDPs as they lack a stable canonical secondary structure and display dynamic conformational behaviour.28 Previous studies on reflectins suggested that the RMs tend to fold into ordered structures, such as α-helices or β-sheet.30
Our CD spectroscopy studies at pH 3.0, showed R1b and R6 mainly adopt a disordered conformation, indicated by the minimum negative signal peak at ∼200 nm (Fig. 2A). Conformation prediction revealed a slightly higher proportion of turns and disordered structures for R1b while R6 had higher predicted helix and strand content, suggesting that R6 has a more compact structure.
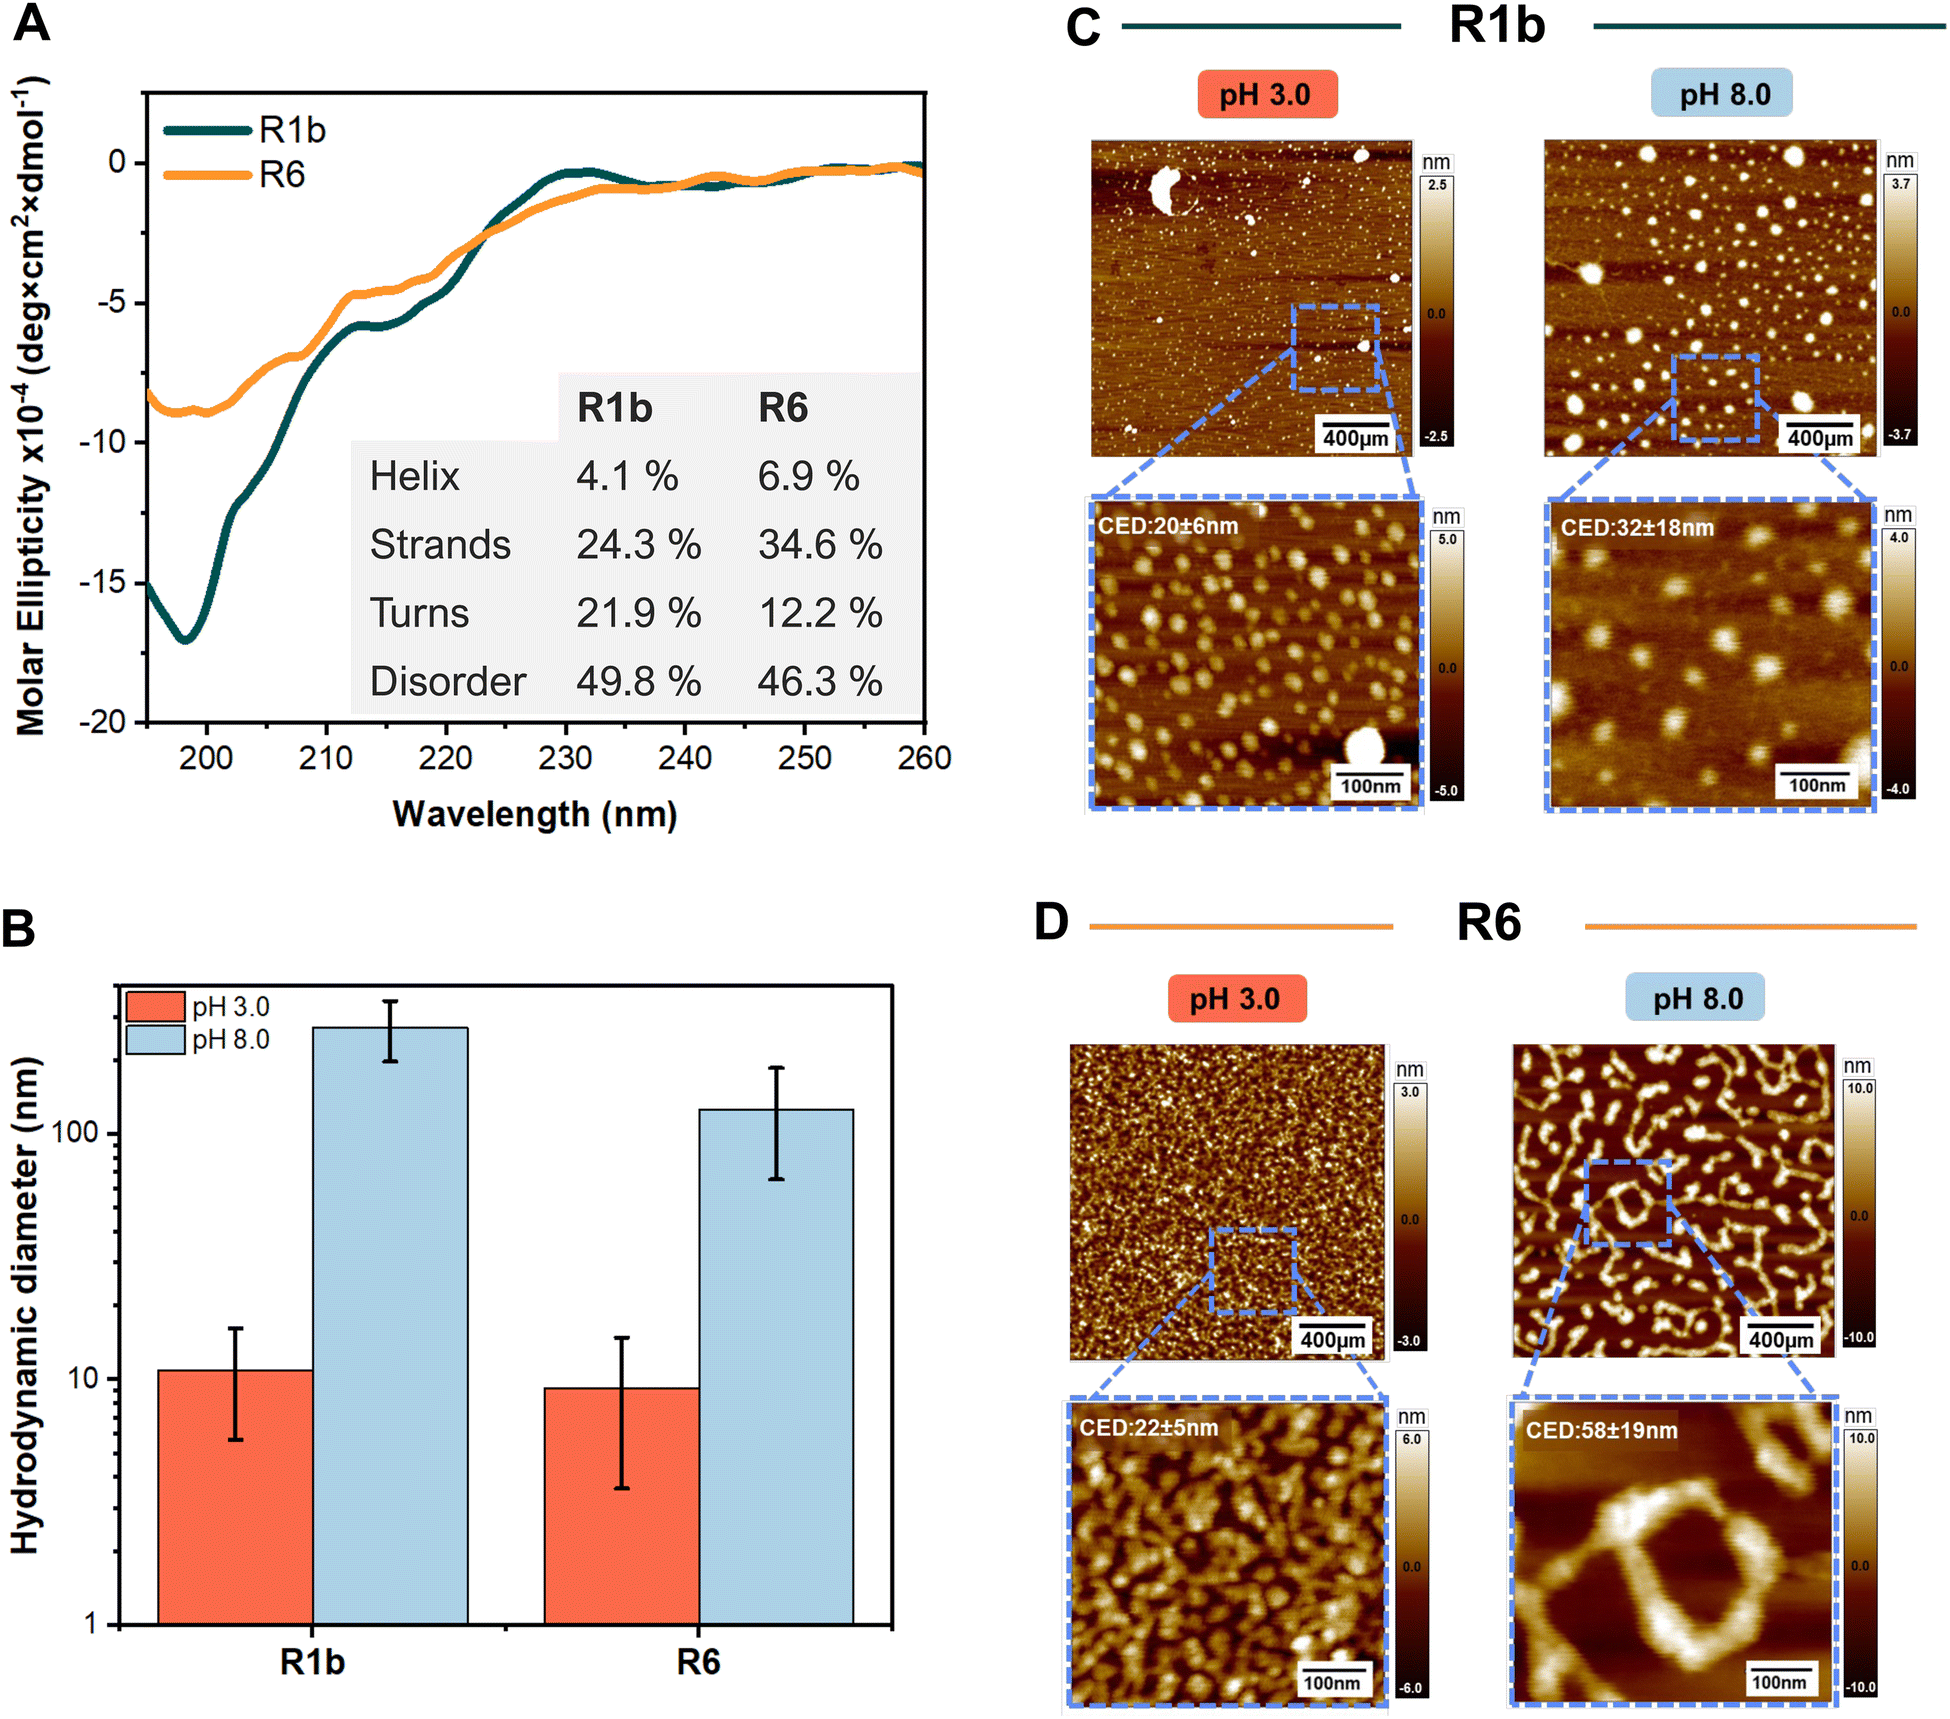 | ||
| Fig. 2 The analysis of structural characteristics, and assembly of R1b and R6 under different pH conditions. (A) Far-UV Circular Dichroism spectra of the R1b and R6 at pH 3.0. Inset contains the prediction of the secondary structure through the BeStSel web tool.24 (B) Average hydrodynamic diameter obtained during DLS measurements. Representative AFM images of R1b (C) and R6 (D) particles under different pH and showing the zoom-in in specific regions and the average values of the circular equivalent diameter (CED). Each set: 400 nm overview (top) with 100 nm magnified inset (bottom, blue box). Scale bars: 400 nm (top), 100 nm (bottom). Color scale indicates height. CDE was determined using particle analysis in the ImageJ software.23 | ||
These results align well with previously reported secondary structures for distinct reflectin isoforms.12,31 The prediction of the turns can be attributed to the presence of small polar and hydrophilic residues in the linkers (e.g. Pro and Gly) in the linkers.32,33 In basic conditions (pH 8.0), it was not possible to assess the secondary structure due to high protein aggregation and low solubility.
To further characterize the assembly behaviour of R1b and R6, we performed dynamic light scattering (DLS) and zeta potential measurements at both acidic and basic pH conditions.
At pH 3.0, DLS analysis revealed that R1b and R6 formed small assemblies with hydrodynamic diameters of 11.4 ± 5.1 nm and 9.2 ± 5.6 nm, respectively (Fig. 2B). These sizes and moderated polydispersity (PDI between 0.20 and 0.48 see Table S2 and Fig S12, ESI†) suggest the formation of oligomeric structures rather than large aggregates. Zeta potential measurements at this pH showed positive values of +27 ± 6 mV for R1b and +57 ± 25.0 mV for R6, indicating that the proteins carry a net positive charge in acidic conditions.
At pH 8.0, which is close to the estimated isoelectric points of R1b (pI 8.9) and R6 (pI 9.3), we observed changes in protein behaviour. Both proteins formed visible precipitates and showed an increase in particle size. DLS measurements revealed large assemblies with average hydrodynamic diameters of 272.9 ± 75.6 nm for R1b and 125.7 ± 60.4 nm for R6. Zeta potential measurements at this pH (+10 ± 15 mV for R1b and −8 ± 6 mV for R6, see Table S2, ESI†) indicated reduced electrostatic repulsion between protein nanoparticles compared to pH 3.0, explaining the increased aggregation. In contrast, bovine serum albumin (BSA), used as a negative control, showed no significant size variations at different pH conditions (dH ≈ 9.6–11.4 nm, see Fig S13A, ESI†).
Subsequently, we evaluated the morphology of the protein nano-assemblies by AFM. This approach involved the deposition of 40-times diluted protein solutions on a substrate followed by solvent evaporation. In acidic environments (pH 3.0), both R1b and R6 formed small round-shape particles with low polydispersity, with an average diameter of 20–22 nm (Fig. 2C and D). AFM imaging at pH 8.0 revealed that reflectin nanoparticles assembled into slightly larger nanostructures with the size of 32 ± 18 nm for R1b and 58 ± 19 nm for R6. The formed structures exhibited irregular shapes and higher polydispersity (Fig. 2C and D). Analysis of the AFM images also confirmed that reflectin nanoparticles present a slightly elliptical shape, as previously reported in the literature.34
It is important to note the differences in particle sizes observed between DLS and AFM techniques. These are primarily attributed to three factors: crowding effects, differences between the two measurement techniques (dHvs. CED), and presence/evaporation of the solvent.
At pH 3.0, R1b monomers were spherical with a radius of gyration (Rg) of ∼2.0 nm, while at pH 8.0, they formed ellipsoidal structures with an Rg of ∼2.7 nm (Fig. 3A). In contrast, R6 monomers remained spherical with an Rg of ∼1.9 nm at both pH levels (Fig. 3B). These values are consistent with the dimensions reported for monomers of reflectin A2 from Doryteuthis pealeii determined through simulations.35 Moreover, they align with scanning transmission electron microscopy (STEM) measurements for R6 at pH 8.0, where monomers form spherical nanoparticles with an average diameter of 2.5 ± 0.5 nm (Fig. S14, ESI†).
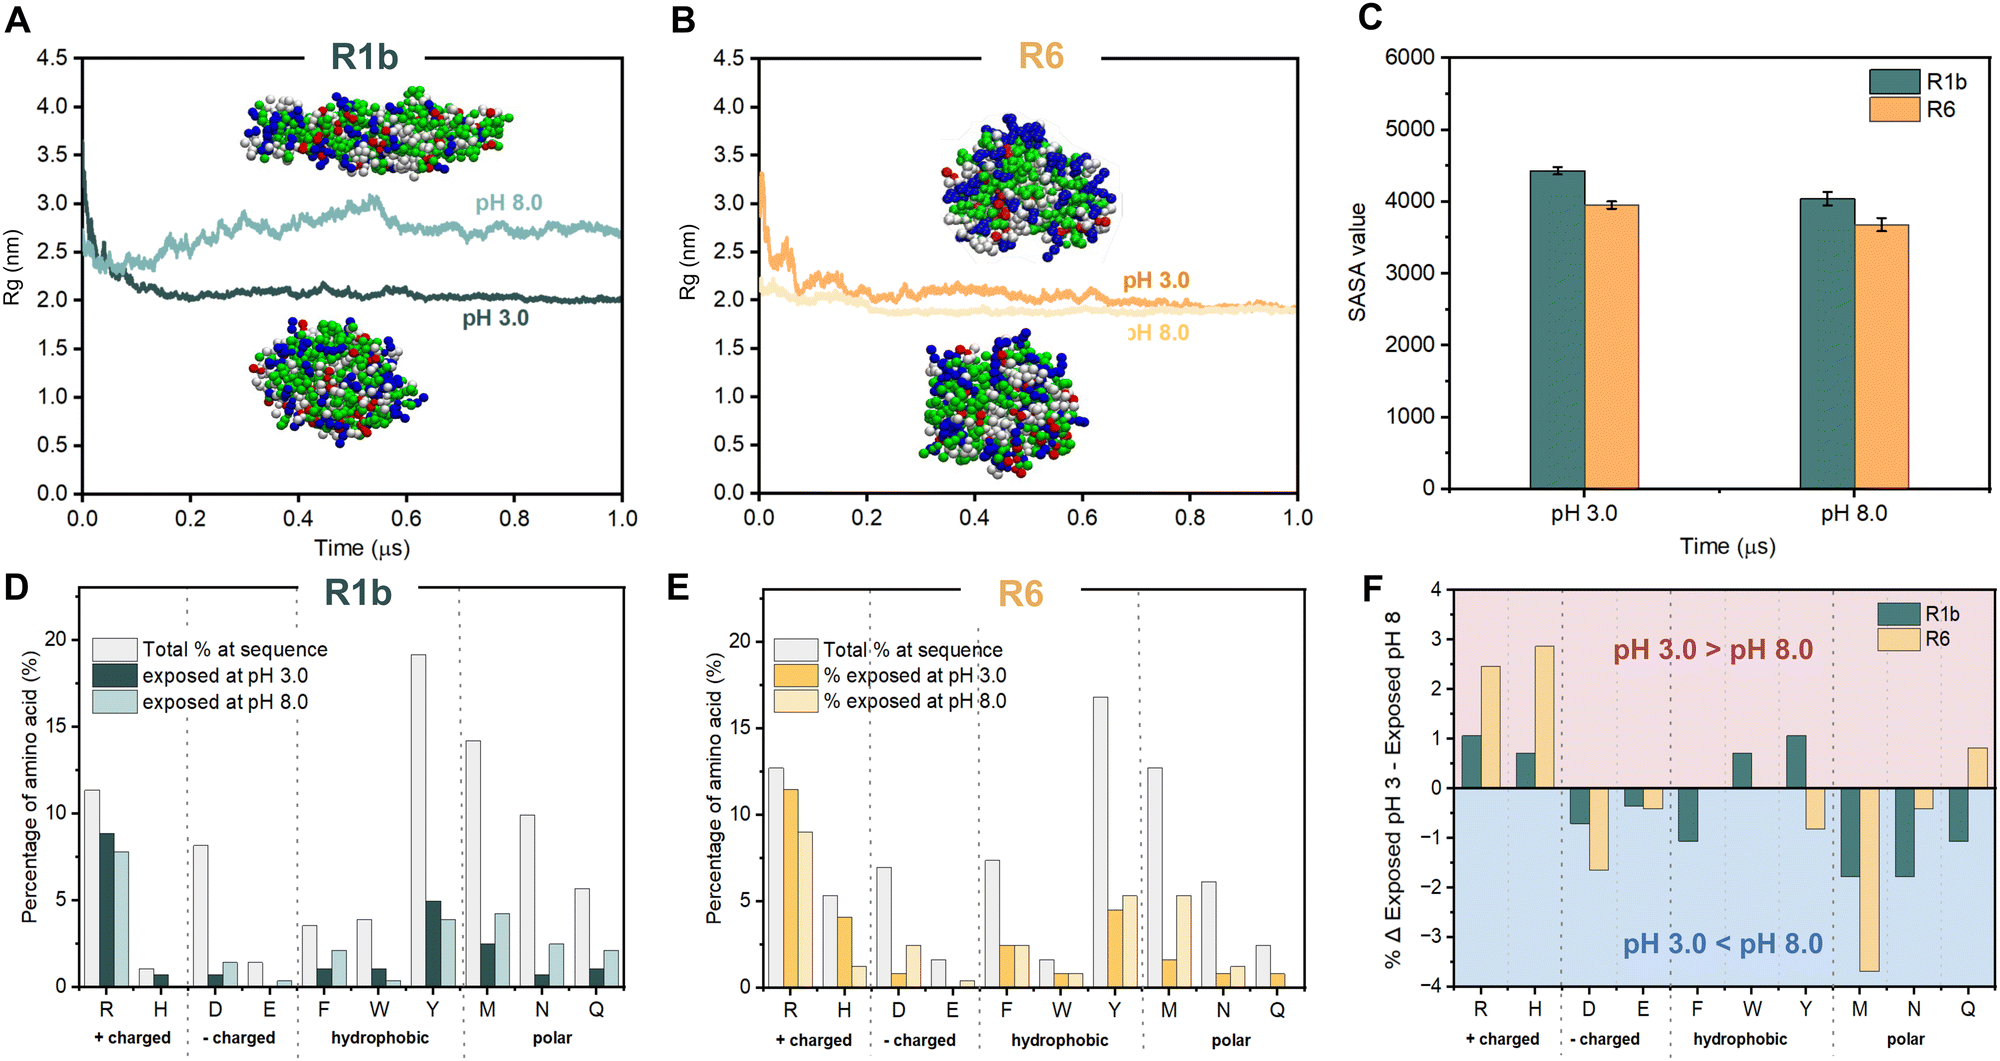 | ||
| Fig. 3 Reflectins’ coarse-grained model after MD simulation at different pH conditions and analysis of the exposed residues: pH 3.0 and pH 8.0. The radius of gyration (Rg) of R1b (A) and R6 (B) over simulation time and coarse-grained model after MD simulation. For each CG model, residue color is chosen according to residue type: basic residues (blue); acidic residues (red); hydrophobic residues (white), and polar residues (green). (C) Average SASA values for R1b and R6 were calculated at pH 3.0 and 8.0. Percentage of solvent-exposed amino acid for R1b (D) and R6 (E) calculated in silico with CG modelling for individual monomers. (F) Variation of % of exposed amino acid residue between pH 3.0 and 8.0 (calculated using eqn (3)). A positive variation (Δ >0): protein exposes a higher percentage of determinant residue at pH 3.0 than at pH 8.0. A variation value equal to 0 (Δ = 0): exposed residue remains unchanged. A negative variation (Δ <0): protein exposes a higher percentage of determinant residue at pH 8.0 than in pH 3.0. | ||
Afterwards, to get insight into R1b and R6 assembly, we conducted CG simulations for an ensemble of 40 reflectins. Protein monomers are self-organized into a variety of structural assemblies, from dimers to oligomers or even larger nanostructures (see Fig. S15, ESI†). Analysis of solvent-accessible surface area (SASA) over the simulation runs (6 μs) confirmed this trend, showing a progressive decrease in total SASA value until stabilization (Fig. 3C and Fig. S15, ESI†). The comparison between the two pH levels revealed that both proteins showed slightly lower SASA values at pH 8.0, as well as higher aggregation propensity values (1.6 for R1b and 1.4 for R6 at pH 8.0 and 1.3 for both proteins at pH 3.0). These results are consistent with this pH being closer to the estimated isoelectric point and suggest a higher tendency for R1b and R6 to form larger and more compact structures.
The analysis of the solvent-accessible residues (Fig. 3D–F) revealed distinct patterns for both proteins across pH conditions. In more detail, at pH 3.0, most basic residues are exposed to the solvent; while acidic, hydrophobic (e.g. Phe, Trp, Tyr and Met) and polar (e.g., Asn and Gln) residues are predominantly buried. Moreover, R6 exposes a higher percentage of positively charged Arg and His in comparison to R1b (Fig. 3F). In contrast, at pH 8.0, the exposure of the acidic residues increases together with some hydrophobic and polar residues while basic residues get more buried.
Our combined experimental data and in silico simulations confirmed a pH-dependent assembly mechanism for reflectins R1b and R6. Combining insights from our work and prior investigation, Fig. 4 illustrates the proposed mechanism for the observed behavior of these proteins. More specifically, at low pH, protonation of His and Arg residues results in a high positive net charge, contributing to particle stability through electrostatic repulsion. However, exposed hydrophobic and aromatic residues simultaneously promote attractive interactions, leading to the formation of multimeric structures detected in DLS. As pH increases to 8.0, approaching the proteins' isoelectric points, deprotonation of His, Asp, and Glu residues reduces the net charge and zeta potential. This charge neutralization, in combination with increased exposure to hydrophobic residues, reduces repulsive forces while enhancing attractive interactions. As a consequence, at pH 8.0, reflectin particles tend to condense and precipitate due to the prevalence of attractive forces. The assembly process is driven by various interactions, including π–π stacking, cation–π interactions, hydrogen bonding, van der Waals and hydrophobic interactions, involving residues such as Phe, Trp, Tyr, Met, Asn, and Gln. This pH-responsiveness underlies the unique self-assembly properties of reflectin proteins.
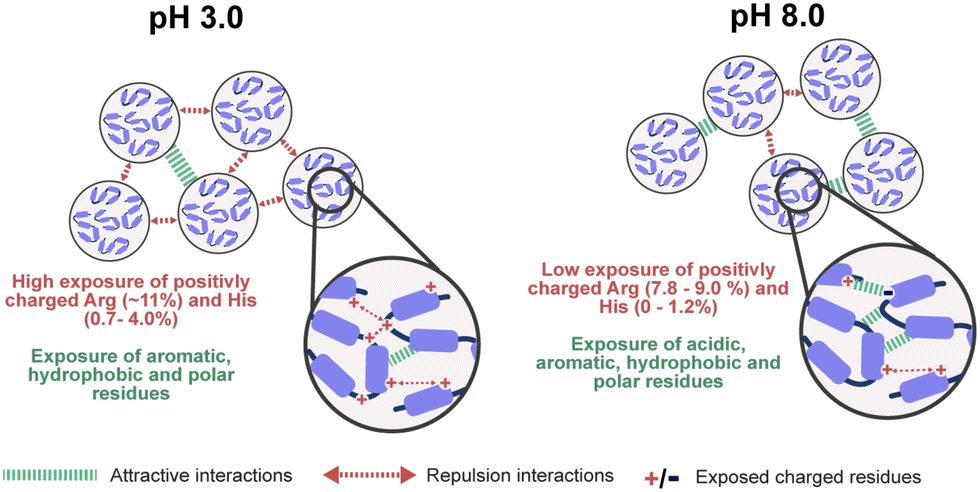 | ||
| Fig. 4 Proposed scheme of reflectins self-assembly at different pH conditions. At acidic conditions, reflectins expose aromatic, hydrophobic, and polar residues contributing to attractive interactions. At the same time, proteins highly expose positively charged residues (such as Arg and His) leading to a high level of repulsion interactions and maintaining particle stability in solution. Contrary at pH 8.0 the exposure of positively charged residues decreases, resulting in an increase in attractive interactions (e.g. π–π stacking, cation–π interactions, hydrogen bonds, hydrophobic, and van der Waals). | ||
We first investigated the reversibility of protein assembly in response to pH changes, adapting a protocol previously described by Levenson et al.20 As illustrated in Fig. 5A, proteins were initially prepared at pH 3.0, dialyzed to pH 8.0 overnight, and then returned to pH 3.0 with a 1-hour incubation period. DLS measurements revealed distinct behaviors between the two proteins. R6 exhibited reversible assembly under sequential pH variations, consistently returning to its initial size (Fig. 5B). In contrast, R1b demonstrated limited reversibility under the tested conditions (Fig. 5B). Upon transitioning from pH 3.0 to 8.0, it showed an initial response with a 3.5-fold size increase. However, when returning to pH 3.0, the assembly size decreased only by 1.4-fold, failing to restore its original dimensions. Subsequent pH variations did not induce significant changes in R1b assembly size. Nonetheless, these data underscore the adaptable and dynamic nature of reflectins in contrast to other proteins such as BSA that did not show significant size changes when tested in identical conditions (see Fig. S13B, ESI†).
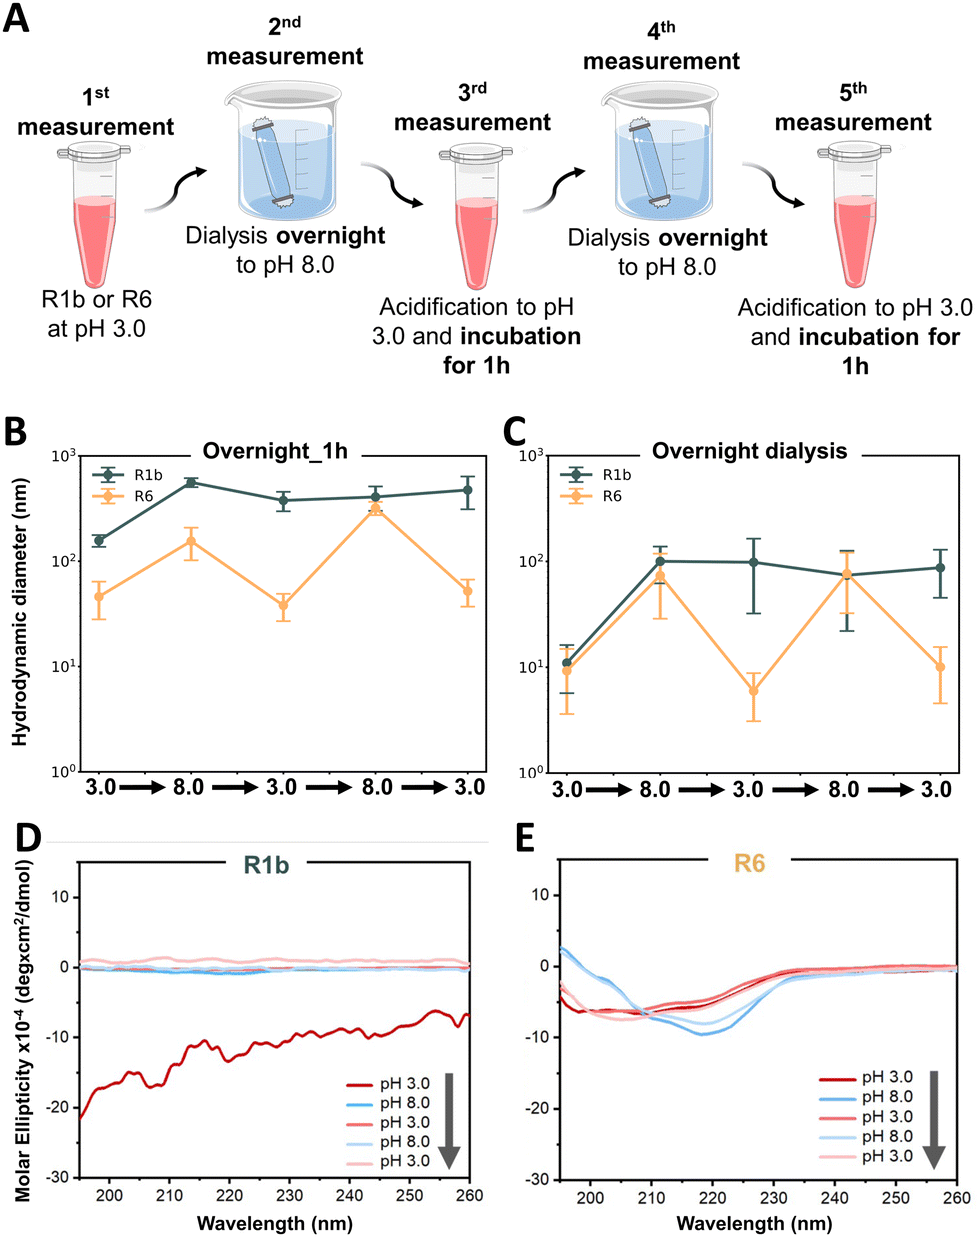 | ||
| Fig. 5 Reversibility of reflectin self-assembly under cyclic pH treatments. (A) Schematic representation of the experimental strategy. Protein samples were subjected to alternating pH conditions (3.0 and 8.0) and analysed at each stage. Overnight dialysis was used for pH transitions to 8.0, while acidification to pH 3.0 was followed by 1h incubation. (B) DLS measurements of hydrodynamic diameter for R1b and R6 with 1 h incubation after acidification and (C) with overnight dialysis for all pH transitions. Data points represent the mean value of measured hydrodynamic diameter ± standard deviation of triplicate measurements for each sample. (D)–(E) Far-UV circular dichroism (CD) spectra monitoring conformational changes of R1b (D) and R6 (E) throughout pH cycles. The grey arrow indicates the sequence of pH variations. | ||
To investigate whether R1b required extended time to fully reverse its assembly, we conducted a follow-up study using overnight dialysis for each pH transition between 3.0 and 8.0 (see Fig. S7A, ESI†). This extended equilibration period was applied to both proteins. However, despite the increased incubation time, the obtained results were similar to our initial observations (Fig. 5C). R6 continued to consistently show reversibility, while R1b presented limited ability to return to its original assembly size after the first change from pH 3.0 to 8.0. This finding suggests that the difference in reversibility between R6 and R1b is likely due to their sequence differences, namely the different percentage of pH-sensitive amino acid residues.
In parallel, we monitored reflectins conformation using CD spectroscopy. After the first pH change from 3.0 to 8.0, R1b showed irreversible conformational change and exhibited a low signal, which might indicate precipitation and reduced stability in the solution (Fig. 5D). On the contrary, R6 demonstrates reversible folding variations (Fig. 5E). At pH 3.0, R6 displayed a mixture of disordered (characterized by a negative minimum of ∼200 nm) with the characteristics of β-sheets and α-helices (negative peaks at ∼216–217 nm and between ∼207–209 nm) (see Fig. S16, ESI†). Upon transition to pH 8.0, R6 adopts a more ordered structure dominated by β-sheets (evidenced by a minimum negative peak at 219 nm). These variations were consistent along the pH cycles (see Fig. S16, ESI†) confirming a controlled shift in R6 folding from a flexible state at pH 3.0 to a more compact structure at pH 8.0.
The obtained CD results provide a molecular-level explanation for the observed differences in assembly. R6's ability to reversibly alter its secondary structure in response to pH changes likely underlies its consistent assembly reversibility. Conversely, R1b irreversible conformational change and aggregation explain its limited ability to restore its initial assembly state. Additionally, AFM images of both proteins (Fig. 6 and Fig. S17, ESI†) aligned closely with our DLS observations, providing visual confirmation of the assembly behaviors. R6 consistently formed small, uniform particles at pH 3.0 and larger, spherical assemblies at pH 8.0, demonstrating good reversibility across multiple pH transitions. The final state of R6 at pH 3.0 closely resembled its initial condition, confirming its ability to restore its original assembly.
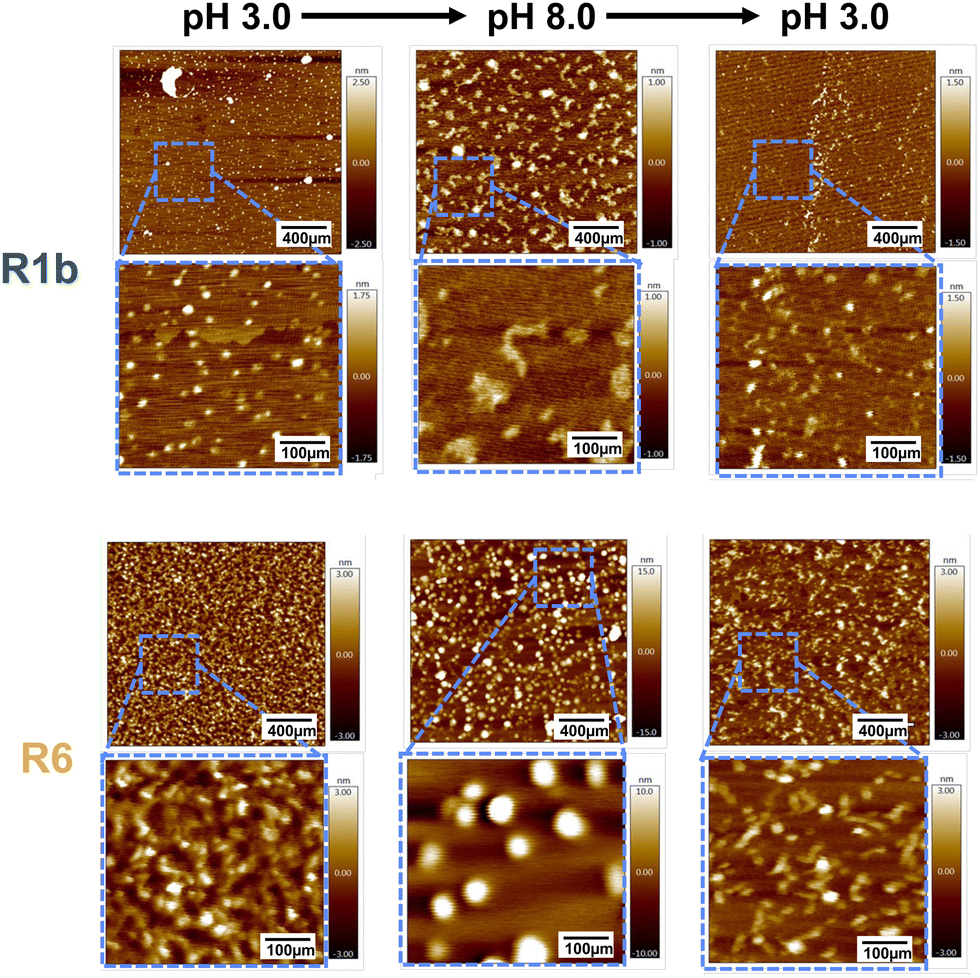 | ||
| Fig. 6 Morphological changes in reflectin assemblies during pH-induced reversibility study. Overnight dialysis was used for all pH transitions. AFM height images of R1b (top) and R6 (bottom) assemblies through the first two cycles between pH 3.0 and 8.0. R1b shows limited reversibility with increasing heterogeneity over cycles. R6 exhibits consistent reversibility, forming larger assemblies at pH 8.0 and returning to small, uniform particles at pH 3.0. Color scale indicates height. | ||
In contrast, R1b formed larger structures at pH 8.0, these were more irregular compared to R6 spherical assemblies. Upon returning to pH 3.0, R1b particles became smaller but did not fully recreate their initial state. With subsequent pH cycles, R1b showed increasing variability in its structures.
To further investigate the kinetics of assembly and disassembly, we conducted DLS studies with shorter incubation times of only 1 hour (Fig. 7A) and 30 minutes (Fig. 7B) between each pH variation. Similarly to our previous findings, only R6 demonstrated reversible assembly behavior. This suggests that R6 conformational changes and assembly processes occur relatively fast, allowing it to adapt and respond rapidly to environmental changes.
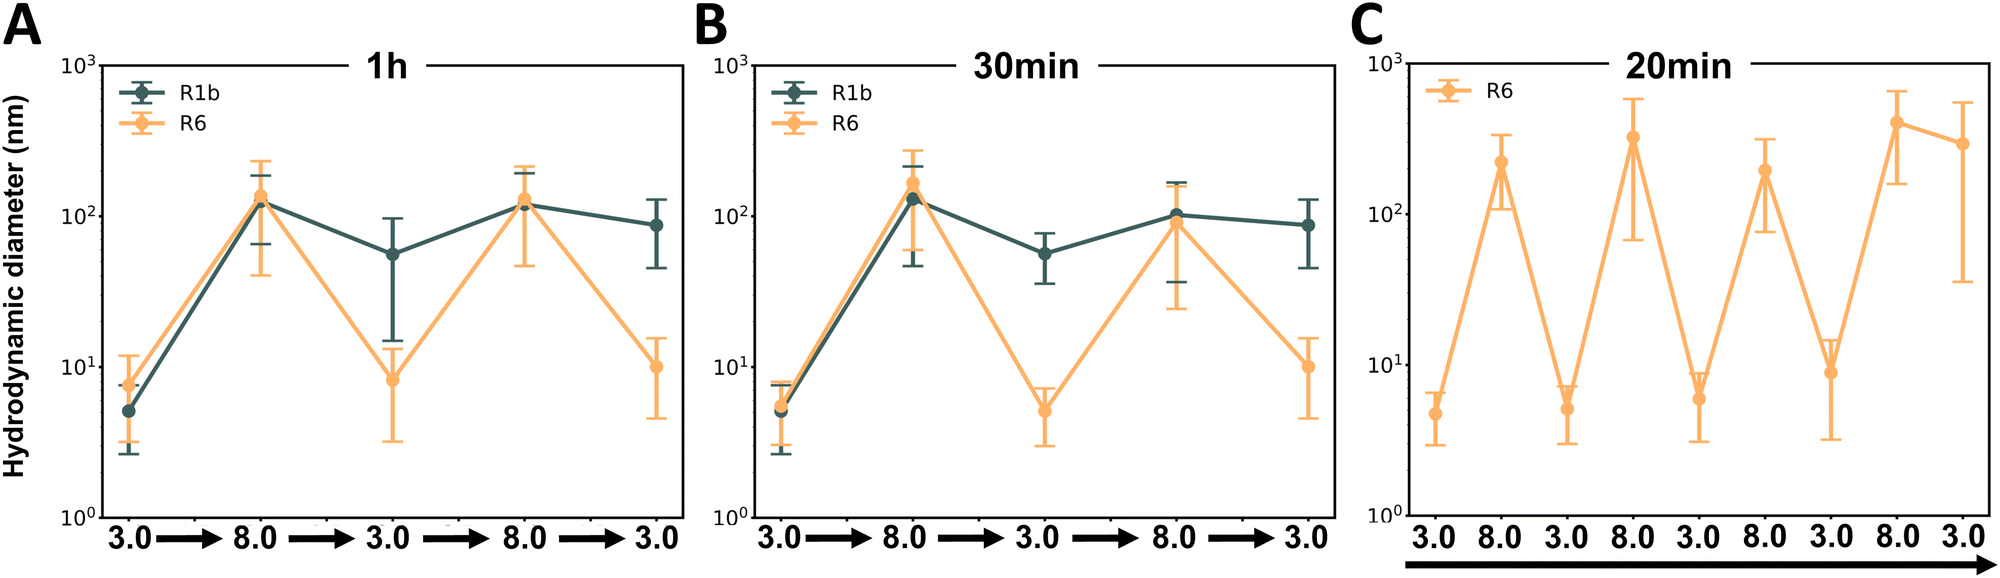 | ||
| Fig. 7 Assays to study pH-responsive assembly kinetics of reflectins R1b and R6. Hydrodynamic diameter variations were measured by DLS after pH changes between 3.0 and 8.0. (A) R1b and R6 with 1-hour incubations. (B) R1b and R6 with 30-minute incubations. (C) R6 only, with 20-minute incubations over 8 pH cycles. Data points represent the mean value of measured hydrodynamic diameter ± standard deviation of triplicate measurements for each sample. | ||
To explore the limits of R6 reversibility, we performed a final study where R6 solution underwent eight consecutive pH changes (see Fig S7C, ESI†) and performed DLS measurements just 20 minutes after each pH alteration. Interestingly R6 maintained its reversible assembly behavior throughout seven out of eight cycles (Fig. 7C). In the final cycle, the protein was not able to reach the expected size of the assemblies, indicating a potential limit to its reversibility under rapid, repeated pH changes.
Our results highlight significant differences in the assembly kinetics and mechanisms between R6 and R1b. One of the key factors contributing to the enhanced pH sensitivity of R6 and reversible self-assembly is its higher content of histidine residues, a characteristic previously noted by Levenson et al. for various reflectins.20 However, our findings reveal that the overall distribution and exposure of charged residues may also play a crucial role in R6's responsive behavior.
R6 exhibits a higher percentage of exposed charged residues compared to R1b (Fig. 3D), including not only histidines but also lysines, arginines, and acidic amino acids. This distribution likely maintains a delicate balance between attractive and repulsive forces, facilitating the rapid disruption and reformation of specific inter- and intra-molecular interactions in response to pH changes. Consequently, R6 demonstrates the ability to reversibly assemble and disassemble within timeframes as short as 20 minutes, resulting in a highly efficient and interesting responsive system.
Nonetheless, the limitations observed in the reversibility of R6 after multiple pH cycles suggest a potential vulnerability to repeated stress. Since reflectins are characterized as IDPs, which are known for their dynamic conformation,28 this reduced responsiveness could be attributed to irreversible conformational changes and incomplete disassembly that occur after repeated cycling.
Conclusions
The findings presented here highlight the importance of sequence composition and solvent-exposed residues in determining the in vitro kinetic and dynamic properties of reflectins. This study demonstrates the enhanced reversible self-assembly and conformational dynamics of R6 reflectin compared to R1b, which remains consistent across multiple pH cycles. Although R1b was responsive to pH variations, it shows limited reversibility over repeated cycles. These findings suggest that the difference in reversibility between two reflectins is not merely a function of kinetics, but likely occurs due to intrinsic differences in their sequence and inter-molecular interactions. The differences in reversibility between R1b and R6 provide valuable insights for protein engineering. Moreover, these insights have significant implications for the design of bio-inspired, stimuli-responsive photonic systems based on reflectins consensus sequences. However, while R6 demonstrates robust and quick responses, the observed constraints of its reversibility must be considered in practical applications. Therefore, further research into the mechanistic details of reflectin behavior in the presence of stimuli will help to understand the factors that limit R6 repetitive response. This will enhance our ability to mitigate these limitations and employ these proteins for advanced biophotonic technologies and other innovative applications.Author contributions
I. L.: methodology, investigation, validation, visualization, formal analysis, writing – original draft & editing; C. L. S: methodology, investigation, validation, formal analysis, writing – original draft & editing; A. J. M. B.: methodology, supervision, validation, writing – review & editing; T. R. C: investigation, formal analysis, writing – review & editing; R. F. P. M.: funding acquisition, resources; A. M. G. C. D.: methodology, supervision, writing – review & editing; A. C. A. R.: methodology, resources, supervision, funding acquisition, writing – review & editing.Data availability
The data supporting this article have been included as part of the ESI.†Conflicts of interest
There are no conflicts to declare.Acknowledgements
This work has received funding from Fundação para a Ciência e Tecnologia (Portugal) for projects PTDC/BII-BIO/28878/2017, PTDC/CTM-CTM/3389/2021, CPCA/15912/2022, and Research Unit on Applied Molecular Biosciences – UCIBIO (UIDP/04378/2020 and UIDB/04378/2020) and Associate Laboratory Institute for Health and Bioeconomy – i4HB (LA/P/0140/2020), and the support of INCD funded by FCT and FEDER under the project 01/SAICT/2016 no 02215. The authors thank FCT/MEC for the research fellowship SFRH/BD/147388/2019 for I. L. and 2022.11305.BD for C. S.Notes and references
- O. Shamilyan, I. Kabin, Z. Dyka, M. Kuba and P. Langendoerfer, 2021 10th Mediterranean Conference on Embedded Computing (MECO), 2021 DOI:10.1109/MECO52532.2021.9459727.
- R. Hanlon, Curr. Biol., 2007, 17, 400–404 CrossRef PubMed.
- D. G. DeMartini, M. Izumi, A. T. Weaver, E. Pandolfi and D. E. Morse, J. Biol. Chem., 2015, 290, 15238–15249 CrossRef CAS PubMed.
- D. E. Morse and E. Taxon, Appl. Phys. Lett., 2020, 117(22), 220501 CrossRef CAS.
- M. Izumi, A. M. Sweeney, D. DeMartini, J. C. Weaver, M. L. Powers, A. Tao, T. V. Silvas, R. M. Kramer, W. J. Crookes-Goodson, L. M. Mäthger, R. R. Naik, R. T. Hanlon and D. E. Morse, J. R. Soc., Interface, 2010, 7, 549–560 CrossRef CAS PubMed.
- J. J. Loke, S. Hoon and A. Miserez, ACS Appl. Mater. Interfaces, 2022, 14, 21436–21452 CrossRef CAS PubMed.
- D. Khago, J. C. Bierma, K. W. Roskamp, N. Kozlyuk and R. W. Martin, J. Phys.: Condens. Matter, 2018, 30, 435101 CrossRef.
- L. Phan, R. Kautz, J. Arulmoli, I. H. Kim, D. T. T. Le, M. A. Shenk, M. M. Pathak, L. A. Flanagan, F. Tombola and A. A. Gorodetsky, ACS Appl. Mater. Interfaces, 2016, 8, 278–284 CrossRef CAS.
- D. G. DeMartini, D. V. Krogstad and D. E. Morse, Proc. Natl. Acad. Sci. U. S. A., 2013, 110, 2552–2556 CrossRef CAS.
- R. T. Hanlon, L. M. Mäthger, G. R. R. Bell, A. M. Kuzirian and S. L. Senft, Bioinspiration Biomimetics, 2018, 13, 035002 CrossRef.
- D. Pringgenies and J. M. Jørgensen, Acta Zool., 1994, 75, 305–309 CrossRef.
- A. R. Tao, D. G. DeMartini, M. Izumi, A. M. Sweeney, A. L. Holt and D. E. Morse, Biomaterials, 2010, 31, 793–801 CrossRef CAS PubMed.
- W. J. Crookes, L.-L. Ding, Q. L. Huang, J. R. Kimbell, J. Horwitz and M. J. McFall-Ngai, Science, 2004, 303, 235–238 CrossRef CAS PubMed.
- A. L. Holt, A. M. Sweeney, S. Johnsen and D. E. Morse, J. R. Soc., Interface, 2011, 8, 1386–1399 CrossRef.
- C. Xu, G. T. Stiubianu and A. A. Gorodetsky, Science, 2018, 359, 1495–1500 CrossRef CAS.
- Y. Lu, P. Pratakshya, A. Chatterjee, X. Jia, D. D. Ordinario, L. Phan, J. A. Cerna Sanchez, R. Kautz, V. Tyagi, P. Patel, Y. Van Dyke, M. K. Dao, J. P. Kerr, J. Long, A. Allevato, J. Leal-Cruz, E. Tseng, E. R. Peng, A. Reuter, J. Couvrette, S. Drake, F. G. Omenetto and A. A. Gorodetsky, APL Mater., 2020, 8(10), 101113 CrossRef CAS.
- L. Phan, D. D. Ordinario, E. Karshalev, W. G. Walkup IV, M. A. Shenk and A. A. Gorodetsky, J. Mater. Chem. C, 2015, 3, 6493–6498 RSC.
- D. G. DeMartini, M. Izumi, A. T. Weaver, E. Pandolfi and D. E. Morse, J. Biol. Chem., 2015, 290, 15238–15249 CrossRef CAS PubMed.
- R. Levenson, C. Bracken, N. Bush and D. E. Morse, J. Biol. Chem., 2016, 291, 4058–4068 CrossRef CAS.
- R. Levenson, C. Bracken, C. Sharma, J. Santos, C. Arata, P. Kohl, Y. Li and D. E. Morse, bioRxiv, 2018, 1–23 Search PubMed.
- A. Andouche, Y. Bassaglia, S. Baratte and L. Bonnaud, Dev. Dyn., 2013, 242, 560–571 CrossRef CAS PubMed.
- I. Lychko, C. L. Soares, A. M. G. C. Dias and A. C. A. Roque, Sep. Purif. Technol., 2023, 315, 123736 CrossRef CAS.
- C. A. Schneider, W. S. Rasband and K. W. Eliceiri, Nat. Methods, 2012, 9, 671–675 CrossRef CAS PubMed.
- A. Micsonai, É. Moussong, F. Wien, E. Boros, H. Vadászi, N. Murvai, Y.-H. Lee, T. Molnár, M. Réfrégiers, Y. Goto, Á. Tantos and J. Kardos, Nucleic Acids Res., 2022, 50(W1), W90–W98 CrossRef CAS PubMed.
- M. Varadi, S. Anyango, M. Deshpande, S. Nair, C. Natassia, G. Yordanova, D. Yuan, O. Stroe, G. Wood, A. Laydon, A. Zídek, T. Green, K. Tunyasuvunakool, S. Petersen, J. Jumper, E. Clancy, R. Green, A. Vora, M. Lutfi, M. Figurnov, A. Cowie, N. Hobbs, P. Kohli, G. Kleywegt, E. Birney, D. Hassabis and S. Velankar, Nucleic Acids Res., 2022, 50, D439–D444 CrossRef CAS.
- J. Jumper, R. Evans, A. Pritzel, T. Green, M. Figurnov, O. Ronneberger, K. Tunyasuvunakool, R. Bates, A. Žídek, A. Potapenko, A. Bridgland, C. Meyer, S. A. A. Kohl, A. J. Ballard, A. Cowie, B. Romera-Paredes, S. Nikolov, R. Jain, J. Adler, T. Back, S. Petersen, D. Reiman, E. Clancy, M. Zielinski, M. Steinegger, M. Pacholska, T. Berghammer, S. Bodenstein, D. Silver, O. Vinyals, A. W. Senior, K. Kavukcuoglu, P. Kohli and D. Hassabis, Nature, 2021, 596, 583–589 CrossRef CAS PubMed.
- C. B. Albertin, S. Medina-Ruiz, T. Mitros, H. Schmidbaur, G. Sanchez, Z. Y. Wang, J. Grimwood, J. J. C. Rosenthal, C. W. Ragsdale, O. Simakov and D. S. Rokhsar, Nat. Commun., 2022, 13, 1–14 Search PubMed.
- R. Levenson, C. Bracken, C. Sharma, J. Santos, C. Arata, B. Malady and D. E. Morse1, J. Biol. Chem., 2019, 294, 16804–16815 CrossRef CAS PubMed.
- R. M. C. Vernon, P. A. Chong, B. Tsang, T. H. Kim, A. Bah, P. Farber, H. Lin and J. D. Forman-Kay, eLife, 2018, 7, 1–48 CrossRef.
- R. Levenson, D. G. Demartini, D. E. Morse, R. Levenson, D. G. Demartini and D. E. Morse, APL Mater., 2017, 5, 1–11 Search PubMed.
- Z. Guan, T. Cai, Z. Liu, Y. Dou, X. Hu, P. Zhang, X. Sun, H. Li, Y. Kuang, Q. Zhai, H. Ruan, X. Li, Z. Li, Q. Zhu, J. Mai, Q. Wang, L. Lai, J. Ji, H. Liu, B. Xia, T. Jiang, S. J. Luo, H. W. Wang and C. Xie, Curr. Biol., 2017, 27, 2833–2842 CrossRef CAS.
- F. Krieger, A. Möglich and T. Kiefhaber, J. Am. Chem. Soc., 2005, 127, 3346–3352 CrossRef CAS PubMed.
- A. M. C. Marcelino and L. M. Gierasch, Biopolymers, 2008, 89, 380–391 CrossRef CAS PubMed.
- R. Levenson, C. Bracken, C. Sharma, J. Santos, C. Arata, P. Kohl, Y. Li and D. E. Morse, bioRxiv, 2018, 1–23 Search PubMed.
- A. Chatterjee, P. Pratakshya, A. L. Kwansa, N. Kaimal, A. H. Cannon, B. Sartori, B. Marmiroli, H. Orins, Z. Feng, S. Drake, J. Couvrette, L. A. Le, S. Bernstorff, Y. G. Yingling and A. A. Gorodetsky, ACS Biomater. Sci. Eng., 2023, 9, 978–990 CrossRef CAS PubMed.
Footnotes |
| † Electronic supplementary information (ESI) available. See DOI: https://doi.org/10.1039/d4ma00788c |
| ‡ These authors contributed equally. |
| This journal is © The Royal Society of Chemistry 2025 |