DOI:
10.1039/D4MA00954A
(Paper)
Mater. Adv., 2025,
6, 1051-1066
Fabrication of active and intelligent bio-based edible films using encapsulated beetroot powders for smart packaging
Received
20th September 2024
, Accepted 18th December 2024
First published on 6th January 2025
Abstract
To address food waste and promote sustainable food packaging, pH-sensitive edible films were developed using Opuntia ficus-indica mucilage (OM) and cellulose nanofibers (CNFs) incorporated with varying concentrations of the encapsulated beetroot waste extract (EB) (0.5%, 1%, 1.5%, and 2%). Based on the percentages of EB, the films were labelled as OM/CNF/EB (2%), OM/CNF/EB (1.5%), OM/CNF/EB (1%), OM/CNF/EB (0.5%), and OM/CNF (control). The films were prepared using the solvent casting method, and the impact of EB on the films’ mechanical properties, physical characteristics, and pH sensitivity was subsequently evaluated. The physicochemical properties of the film were analyzed using X-ray diffraction (XRD), scanning electron microscopy (SEM), and Fourier transform infrared (FTIR) spectroscopy to confirm the successful integration of EB into the OM polymer matrix. Furthermore, the incorporation of EB at varying concentrations significantly enhanced the film properties, including moisture content (28.20–57.77%), water solubility (11.52–56.15%), swelling test (80.12–83.18%), antioxidant activity (14.33–21.53%) and water vapor permeability (0.39–0.89 g m−1 s−1 Pa−1). The films exhibited pH-sensitive color changes, transitioning from red to yellow within a pH range of 1 to 13, making them suitable for intelligent packaging applications. Notably, the 2% EB film effectively monitored the freshness of hake medallions, with a distinct color change correlating with spoilage indicators by day 4. These findings underscore the potential of OM/EB films for enhancing postharvest preservation.
1. Introduction
The global food waste crisis, particularly the alarming loss of fruits and vegetables, has become a pressing concern. According to the UN Food Waste Index Report 2021–22, nearly half of all household food waste consists of these perishables.1 One notable vegetable that has received increased attention due to its nutritional benefits is the red beetroot, with approximately 30% of its yield discarded as processing by-products, exemplifying this issue.2 This waste is especially concerning when considering beetroot's rich bioactive profile, which includes betalains, flavonoids, and polyphenols. These compounds offer significant health benefits and industrial applications.3,4 Therefore, valorising beetroot by-products for sustainable food production and packaging is crucial, aligning with circular economy principles.2,5
Innovative packaging technologies, such as active and intelligent packaging, have emerged as sustainable alternatives to conventional, non-degradable materials. These technologies enhance food quality, extend shelf life, and enable real-time monitoring of freshness, addressing environmental concerns and improving food safety.6,7 Natural biopolymers like proteins, polysaccharides, and lipids are promising for biodegradable and non-toxic edible films. Among these, Opuntia ficus-indica mucilage (OM) is particularly suitable due to its stability, structural integrity, and moisture retention properties.8–10 Derived from widely available cactus species, OM contributes to waste management and sustainable food preservation, particularly in active and intelligent packaging systems.11 To enhance their functionality, natural pH indicators, derived from fruits and vegetables, are gaining popularity due to their cost-effectiveness, responsiveness, and safety. These indicators change color in response to pH shifts, providing a reliable freshness indicator.12,13 Betalains, abundant in beetroot, are particularly suited for this purpose due to their vibrant, pH-sensitive hues and non-toxic, antioxidant, and antimicrobial properties.14–22 However, their sensitivity to extreme conditions necessitates stabilization techniques like encapsulation.2,23 Encapsulating agents such as maltodextrin enhance betalain stability while imparting film-forming properties.2
Building on our previous work,2 this study aimed to develop active and intelligent bio-based edible films by incorporating an encapsulated beetroot waste extract (EB) into OM and cellulose nanofiber (CNF) matrices. We assessed the effects of EB on the physical, chemical, pH-sensitive, antimicrobial, antioxidative, and ammonia-sensitive properties of the films. Additionally, the potential of OM/CNF/EB films as pH indicators for monitoring the freshness of hake medallions was evaluated.
2. Methods and materials
2.1 Plant materials and reagents
Opuntia ficus-indica cladodes were collected from the Ubali Pomegranate Farm in Bynespoort, Pretoria (25°38′31.9′′ S, 28°27′33.0′′ E), and low-quality beetroots, considered postharvest waste, were obtained from the Johannesburg Farmers Market, Johannesburg, South Africa (26.2298°S, 28.0800°E). Samples were transported to the Postharvest Research Laboratory at the University of Johannesburg. The beetroots were sliced into thin slices, rinsed in 1% acetic acid, dried in an oven at 40 ± 2 °C until a constant weight was achieved, and then crushed into a fine powder. All reagents utilized in this study were procured from Sigma-Aldrich, South Africa, and were used as received without any additional purification. These include acetic acid, ethanol, maltodextrin, hydrochloric acid, cellulose nanofibers, sodium hydroxide, ammonia, calcium chloride, potassium sulphate, boric acid, sodium acetate, bromocresol green, peptone water, sodium chloride, 2,2-diphenyl-1-picrylhydrazyl (DPPH), methanol (absolute), ferric chloride, gallic acid, Folin–Ciocalteu's phenol reagent, and 2,3,6-tris[2-pyridyl]-5-triazine sodium acetate.
2.2 Extraction of plant materials
2.2.1
Opuntia ficus-indica cladode mucilage.
The Opuntia ficus-indica cladodes were prepared following the method by Shinga and Fawole.24 Summarily, the cladodes were peeled, chopped into cubes and placed in a 500 mL beaker. This was then microwaved for 4 min. The resulting warm cladodes were blended, and the thick consistency was centrifuged using a 45 mL centrifuge tube at 8000 rpm, 4 °C for 15 min using a Thermo Scientific Biofuge Stratos (UK). Then, the somewhat colorless mucilage at the top of the tubes was collected, freeze-dried, and ground into a green powder.
2.2.2 Betalain-rich beetroot waste extract.
As previously reported by Mkhari et al.,2 beetroot waste powder (25 g) was combined with 250 mL of 50% aqueous ethanol containing 0.5% acetic acid to obtain an extract rich in betalain pigment. The mixture was ultrasonicated at room temperature for 30 min at maximum power (700 W) and 40 kHz frequency using a Labotec ultrasonic bath (Johannesburg, South Africa), filtered through a 47 mm Whatman filter paper, and concentrated under reduced pressure (150 mbar) at 40 ± 2 °C using a BUCHI Rotavapor R-300 (Flawil, Switzerland) until complete ethanol evaporation.
2.3 Encapsulation of the beetroot waste extract
Beetroot waste extract was mixed with 10% (w/v) maltodextrin (MT) at room temperature (25 °C) using a magnetic stirrer. The samples were then homogenized for 45 s at 60 °C and 0.01 millibar before being frozen at −20 °C for 24 h. Subsequently, the samples were freeze-dried for 48 h at −20 °C using a Buchi Lyovapor L-200 Freeze Dryer (Postfach, CH-9230, Flawil, Switzerland). The freeze-dried materials were ground into a powder with particle sizes greater than one millimeter.
2.4 Characterization of the encapsulated beetroot waste extract (EB)
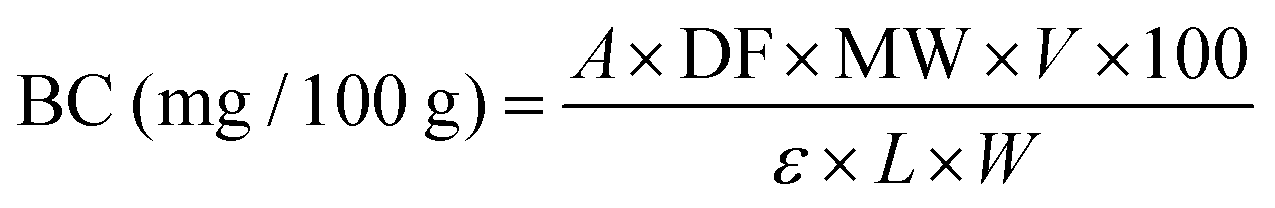
2.4.1 Total betalain content.
The total betalain content of EB was determined using the method proposed by Wybraniec and Mizrahi.25 The EB was dissolved in distilled water and filtered, and the absorbance of the filtrate was measured at 538 nm using a UV-visible spectrophotometer (SP-UV 300, Shanghai, China). The total betalain content was calculated using eqn (1):| | 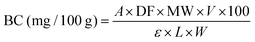 | (1) |
V is the volume of the pigment solution in mL, MW stands for the molecular weight of betanin (550 g mol−1), BC denotes the betanin content in milligrams per 100 g, A indicates the absorbance at 538 nm, DF represents the dilution factor, L signifies the cuvette path length (1 cm), and W represents the weight of the encapsulated beetroot waste extract powder in grams.
2.4.2 pH-sensitivity characteristics.
To determine the pH-sensitivity characteristics of EB, three milligrams of the dried extract were dissolved in 20 mL of buffer solutions with pH values ranging from 4 to 13 for 30 min. The color of the solutions was captured using a digital camera, and their visible absorption spectra, ranging from 400 to 700 nm, were recorded using a UV-visible spectrophotometer (Lambda 35, PerkinElmer Inc., MA, USA) as described by Jamróz et al. (2019).26
2.5 Preparation of Opuntia ficus-indica mucilage/CNF/encapsulated beetroot waste extract (EB) films (OM/CNF/EB films)
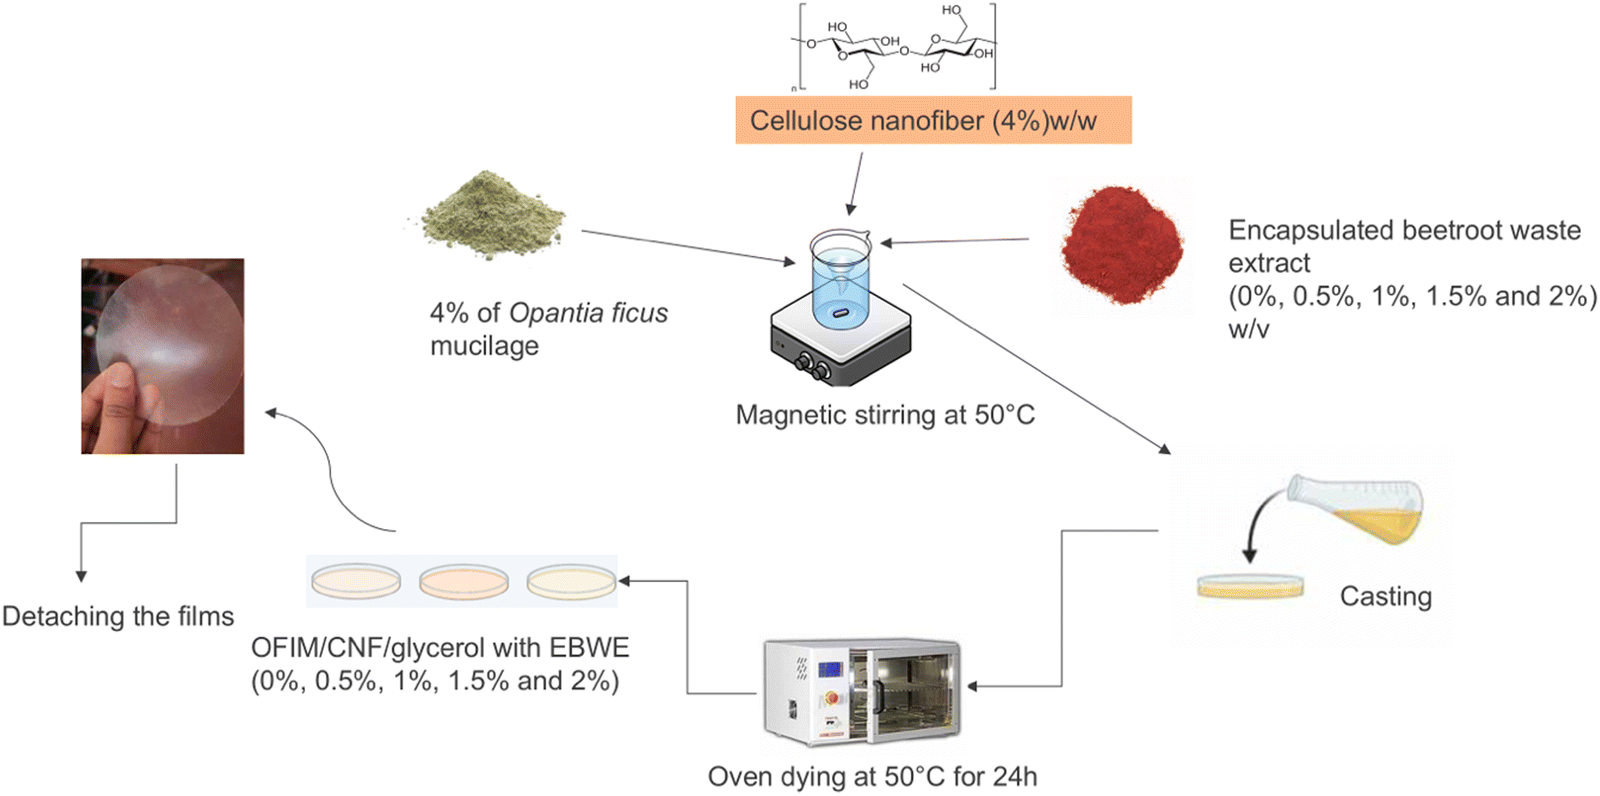
Mucilage powder (4%) was added to distilled water and continuously stirred for 2 h at room temperature to ensure proper hydration, as seen in Fig. 1. Subsequently, 4% cellulose nanofibers (CNFs) (w/w, Opuntia ficus-indica mucilage powder, (OM)) and EB at concentrations of 2%, 1.5%, 1%, 0.5%, and control without EB (w/v) were added, resulting in the following formulations: OM/CNF/EB (2%), OM/CNF/EB (1.5%), OM/CNF/EB (1%), OM/CNF/EB (0.5%), and control OM/CNF. The mixture was homogenized for 30 min using a Stuart SHM2 homogenizer (Staffordshire, UK) and then ultrasonically treated for 30 min using a Labotec Sonic Clean ultrasonic cleaner (Johannesburg, Gauteng Province, South Africa) to remove internal bubbles. The film-forming solutions (30 mL) were poured into Petri dishes and dried for 24 h at 50 °C using an EcoTherm Economy drying oven from Labotec (Cape Town, South Africa). After drying, the films were carefully peeled off and stored in a desiccator at 25 °C and 60% relative humidity.
 |
| | Fig. 1 Schematic diagram showing the formulation of OM/CNF/EB at various concentrations. | |
2.6 Characterization of OM/CNF/EB films
2.6.1 Color properties.
The color properties of the films, including redness/greenness (a*), lightness (L*), and yellowness/blueness (b*), were measured using a calibrated chromometer (CR-10 Plus, Konica Minolta, Osaka, Japan). The overall color difference was calculated using eqn (2), with the film without EB, OM/CNF serving as the standard. Each measurement was performed in triplicate.| | | ΔE = [(L − L*)2 + (a − a*)2 + (b − b*)2]1/2 | (2) |
2.6.2 Thickness and density.
The film thickness was measured using a digital micrometer. Each sample treatment was replicated five times, with three random measurements taken from each film sample and averaged. Film density was calculated using volume and weight, where film volume was computed from the film area and thickness. This was done following the method by Leta et al.27
2.6.3 Moisture content.
The moisture content was determined by the oven-drying method. The film sample was weighed before and after drying in an EcoTherm Economy oven (Labotec, Cape Town, South Africa) at 105 °C until a constant weight was achieved. The film specimen was divided into equal quarters. Moisture content was calculated using eqn (3):18| | 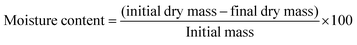 | (3) |
2.6.4 Water solubility.
With minor modifications, the water solubility (WS) of each film sample was determined using the ratio of soluble matter to starting dry matter.18 Film samples (2 cm × 2 cm) were dried at 105 °C for 24 h in an EcoTherm Economy oven (Labotec, Cape Town, South Africa). The dried samples were then submerged in 50 mL of distilled water and left at 25 °C for 2 h while agitated at 68 rpm. The samples were oven-dried again at 105 °C for 24 h to determine the final dry weight. Water solubility was calculated using eqn (4).| |  | (4) |
2.6.5 Degree of swelling.
The degree of swelling was calculated using the method by Wang et al.28 with minor modifications. Squares of film samples (0.1 g) were immersed in 40 mL of pure water in a 50 mL glass beaker at room temperature (25 °C) for 24 h. After immersion, the residual was filtered and weighed to assess the degree of swelling.29
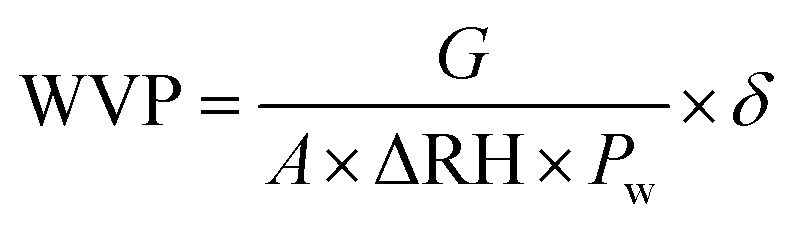
2.6.6 Water vapor permeability (WVP).
Water vapor permeability (WVP) was measured using a gravimetric technique according to the ASTM E96-92 standard by Alboofetileh et al. (2013).29 Film specimens were enclosed above a round aperture within a glass container filled with dry calcium chloride (heated at 200 °C for 2 hours). The setup was stored in a desiccator with a concentrated potassium sulphate solution (98% humidity) at 25 °C. The samples were weighed at specific intervals over three days. The WVP was calculated using eqn (5).| | 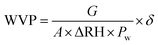 | (5) |
where the average thickness of the film is shown by δ (m); G (g s−1) stands for the permeation rate, which is obtained through the linear regression of the mass recorded experimentally over time; A (6.36 × 10⁻⁵ m2) indicates the permeation area; ΔRH (0.98) denotes the disparity between the relative humidity outside and inside the permeation cell; and Pw is the partial water vapor pressure at the assay temperature (3.168 × 10³ Pa). Three determinations were made for each category of film.
2.6.7 Film colorimetric response to pH adjustments.
To verify the film's color response to pH fluctuations, the films were exposed to buffer solutions with pH values ranging from 4 to 13 for 15 min. Visual color changes were recorded using a digital camera and a Minolta chromometer (CR-200, Osaka, Japan) was used to measure the color properties (a* and b*) of the films.
2.6.8 Film colorimetric response to ammonia.
Films (2 cm × 2 cm) were placed 1 cm above the headspace of 80 mL of 25% extra-pure ammonia solution for 10 to 60 min. A Konica Minolta chromometer (CR-10, Osaka, Japan) was used to measure the color properties (L*, a*, b*) of the films after 60 min of exposure. The total color differences (ΔE) were calculated using eqn (6), and the color change was documented.| | | ΔE = ((ΔL*)2 + (Δa*)2 + (Δb*)2)1/2 | (6) |
2.6.9 Mechanical properties.
The film sample (60 × 8 mm) was tested using a texture analyzer (Agrosta, South Africa). Eqn (7) was utilized to determine the film's tensile strength:| | | Tensile strength (MPa) = F/(x × w) | (7) |
where w is the film width (mm), x is the film thickness (mm), and F is the stress at the film break (N).
2.6.10 Opacity and transparency of light.
A UV spectrophotometer (Spectrum Instruments, SP-UV 300, Shanghai, China) was used to measure the films' optical barrier qualities throughout a 400–800 nm wavelength range. As previously described by Aloui et al.,30 the films were sliced into 1 cm × 3 cm strips for testing, placed perpendicularly in a plastic cuvette, and assessed against a blank cuvette as a reference to quantify light transmittance through the films. Eqn (8) was used to calculate opacity by dividing the absorbance at 600 nm by the film thickness.| |  | (8) |
The A600 value corresponds to the absorbance recorded at a wavelength of 600 nm, while X denotes the thickness of the film samples measured in millimetres.
2.6.11 Scanning electron microscopy (SEM) for morphology.
Film samples (0.5 × 0.5 cm) were sputter-coated with gold and secured to a copper column for observation using double-sided tape. For cross-sectional analysis, the films were broken with tweezers after being frozen in liquid nitrogen. The surface and cross-sectional morphology of the films were investigated at 500× and 100× magnifications using a TESCAN Vega 3 scanning electron microscope (Borno, Czech Republic) with an accelerating voltage of 20 kV.
2.6.12 XRD pattern of the films.
An X-ray diffractometer (D8 ADVANCE, Bruker, Germany) employing Cu Kα radiation at a voltage of 40 kV and a current of 30 mA was used to evaluate the films. According to Zamudio-Flores et al.,31 the scanning range (2θ) was from 0 to 80° with a scanning speed of 2° min−1.
2.6.13 Fourier transform infrared (FTIR) analysis.
The FT-IR spectrum of the films was obtained using the KBr dispersive method on a PerkinElmer Spectrum 1000 (Varian Inc., USA). Film samples were ground into a powder after being frozen in liquid nitrogen and lyophilized under vacuum. FT-IR analysis was conducted in the wavenumber range of 4000 to 500 cm−1 at a resolution of 4 cm−1.
2.6.14 Total phenolic content.
The total phenolic content was determined using the Folin–Ciocalteu method.32 A mixture of 2.5 mL of 10% Folin–Ciocalteu reagent, 1 mL of supernatant, and 2 mL of 7.5% (w/v) sodium carbonate solution was incubated at 50 °C for 5 min. The absorbance at 760 nm was measured, and the total phenolic content was reported in μg of gallic acid equivalents (GAE) per mg using a standard curve of gallic acid.
2.6.15 Antioxidant activity.
A 500 mg film sample was agitated in 10 mL of distilled water at 50 °C for 4 h, then centrifuged (ThermoF Scientific, Biofuge, Stratos, UK) at 12![[thin space (1/6-em)]](https://www.rsc.org/images/entities/char_2009.gif) 000×g for 5 min at 4 °C. The total phenolic content and antioxidant activity of the supernatant were assessed using DPPH and FRAP assays. For the DPPH inhibition assay, a modified version of Zhang et al.18 was used. The reaction system included 3 mL of a 0.1 mM DPPH ethanol solution and 1 mL of supernatant. The absorbance at 517 nm was measured after 30 min of reaction at 25 °C in the dark, and the DPPH inhibition rate was expressed as a percentage. For the FRAP assay, 3 mL of FRAP solution and 1 mL of supernatant were used. The FRAP solution comprised TPTZ (10 mM) in HCl (40 mM), FeCl3·6H2O (20 mM), and acetate buffer (0.3 M, pH 3.6) in a 1:1:10 (v/v/v) ratio. The absorbance at 593 nm was measured after 30 minutes of incubation at 25 °C in the dark. FRAP results were expressed in Mm TE per g DM using a standard curve of FeSO4·7H2O.
000×g for 5 min at 4 °C. The total phenolic content and antioxidant activity of the supernatant were assessed using DPPH and FRAP assays. For the DPPH inhibition assay, a modified version of Zhang et al.18 was used. The reaction system included 3 mL of a 0.1 mM DPPH ethanol solution and 1 mL of supernatant. The absorbance at 517 nm was measured after 30 min of reaction at 25 °C in the dark, and the DPPH inhibition rate was expressed as a percentage. For the FRAP assay, 3 mL of FRAP solution and 1 mL of supernatant were used. The FRAP solution comprised TPTZ (10 mM) in HCl (40 mM), FeCl3·6H2O (20 mM), and acetate buffer (0.3 M, pH 3.6) in a 1:1:10 (v/v/v) ratio. The absorbance at 593 nm was measured after 30 minutes of incubation at 25 °C in the dark. FRAP results were expressed in Mm TE per g DM using a standard curve of FeSO4·7H2O.
2.6.16 Antimicrobial activity.
The agar diffusion assay was used to determine the antimicrobial effectiveness of the films against four foodborne pathogens.33 Bacterial cultures were grown in nutrient broth at 37 °C for 24 h. A 0.2 mL aliquot of each bacterial culture (106 CFU per mL) was spread on lysogeny broth agar plates. Film samples (6 mm diameter) were placed on the agar surface and incubated at 37 °C for 24 h. The inhibition zone diameter was measured to assess antimicrobial activity.
2.7 Hake medallions spoilage trial
2.7.1 Experimental layout.
A 2 × 2 cm film sample with OM/CNF/EB (2%) was placed into the headspace of a clear polyethylene terephthalate (PET) container punnets 11.5 × 4.5 cm (from Zibo Containers) containing 30 g of hake medallions to evaluate freshness. The container was maintained at 6 °C for eight days. The chemical and microbiological characteristics of the fillets were assessed on days 0, 2, 4, 6, and 8 of storage, with each measurement conducted in triplicate. The film responses were monitored using a chromometer as described previously (Fig. 2).
 |
| | Fig. 2 Schematic diagram of the hake medallions during the storage period. | |
2.7.2 TVB-N contents.
The steam distillation method was used to evaluate TVB-N (total volatile basic nitrogen) contents.34 Hake medallion samples (10 g) were blended with 100 mL of distilled water using a portable blender. The mixture was allowed to settle for 30 min at room temperature while being continuously stirred with a magnetic stirrer (Fried Freed Electric BIOX1 Magnetic Stirrer). The mixture was then filtered using a Whatman filter paper (7.0 cm, circles, England). The filtrate was made alkaline by adding 10 mL of 10 g L−1 NaOH, and distillation was performed for 5 min. The distillate was collected in an Erlenmeyer flask containing 25 mL of 2% boric acid solution with 2 drops of bromocresol green and titrated with 0.01 mol L−1 hydrochloric acid solution. The TVB-N content was calculated using eqn (9):| |  | (9) |
where V1 is the tested sample's titration volume (mL); the blank titration volume is V2 (mL); the exact HCl concentration, expressed in mol L−1, is C; and m is the hake medallions sample's weight (in grams). Every analysis was carried out three times over to increase the models' accuracy.
2.7.3 pH study on hake medallions.
The pH of the hake medallions was measured using a digital pH meter (Insmark LS128, Mumbai, India) after mixing a 10 g sample with 90 mL of distilled water.
2.7.4 Evaluation of microbial spoilage quality.
To evaluate microbial spoilage, a sample of 11 g of fish was homogenized with 99 mL of sterilized peptone water (10 g of peptone and 5 g of NaCl in 1 L of distilled water, pH 7.2–7.3) using a Stuart SHM2 ultra-homogenizer (Staffordshire, UK) for 30 s. Serial dilutions (10−3 to 10−6) were prepared by mixing with peptone water. A 1 mL aliquot of each diluent was plated on a sterilized standard plate agar (23.5 g of agar in 1 L of distilled water). The plates were incubated in triplicate for 72 h at 20 °C. Colony-forming units (CFU) per gram of fish were reported as total aerobic psychrotrophic plate count values after counting the colonies with a colony counter.
2.8 Statistical analysis
The results of the triplicate samples are expressed as the mean ± standard error (SE). Data analysis was conducted using the STATISTICA software (STATISTICA v13, TIBC, Palo Alto, CA 94304, USA) and one-way ANOVA. Duncan's multiple range test was used to separate the means, with a significance level set at 5%.
3. Results and discussion
3.1 Characterization of the encapsulated beetroot waste extract
3.1.1 Total betalain content in the encapsulated beetroot waste extract (EB).
Betalains are the secondary compounds responsible for the red hue and various biological effects of beetroot. The total betalain content of EB was found to be 357.38 mg g−1, which is 182.38 mg g−1 higher than the betalain content reported for beetroot extract35 which ranged from 100 mg/100 g of fresh beetroot to 38 mg/100 g when dried and. The variation in the results can be attributed to the encapsulation of the betalain used in this study. Ravanchi et al.36 reported that the encapsulation of betalains from beetroot using xanthan gum resulted in a 1.3-fold increase in betalain recovery during freeze drying, while maltodextrin significantly enhances the stability of betalains to a considerable extent.36 Janiszewaska et al.37 also reported better recovery of betalains from beetroot juice through encapsulation.37 Other differences could be in the extraction methods, solvents used, incorporation of carriers, as well as the harvest maturity and cultivar of beetroot used.35
3.1.2 pH sensitivity of the encapsulated beetroot waste extract (EB).
The color variations and UV-vis absorption spectra of EB in different pH media are presented in Fig. 3(a) and (b). The UV-vis spectra of EB solutions showed progressive peaks between 500 and 535 nm at pH levels of 4, 5, and 7, with a peak at 540 nm at pH 6. The EB solutions exhibited a stable red color within the pH range of 4–7, affirming the stability of betalains in this range.38,39 Recent research indicates that the stability of betalains is closely tied to pH, showing stability from pH 3 to 7 but reduced stability under alkaline conditions.40 Similarly, betalains extracted from red pitaya peels exhibit a significant absorption peak at 535 nm within the pH range of 3 to 7.41 The distinctive peak observed between 500 and 535 nm signifies the presence of betacyanins, suggesting that betacyanins are the primary constituents in EB. These findings align with those reported by Castellar et al.42 and Fathordoobady et al.43 Furthermore, EB showed a purple color change at pH 8 to 11 and a yellow color change at pH 13 (Fig. 3(b)). The color alterations noted in EB solutions across various pH levels, particularly from pH 8 to 13, could be linked to changes in the chemical composition of betacyanin12 (Fig. 3(c)). The distinctive color changes signify the presence of betalain (purple) and betaxanthin (yellow) as the main components in EB.
 |
| | Fig. 3 UV-Vis spectra of EB captured in various pH media of 4–13 (a), colour alterations of the EB (b), and the process by which betacyanin undergoes colour change under alkaline conditions (c). | |
3.2 Properties of OM/CNF/EB films
3.2.1 Colour properties.
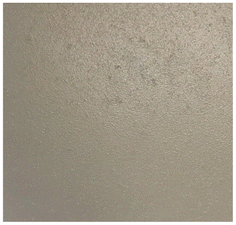
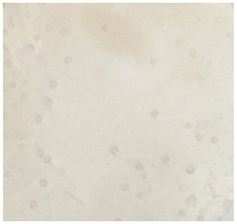
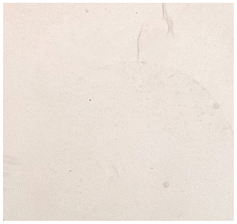
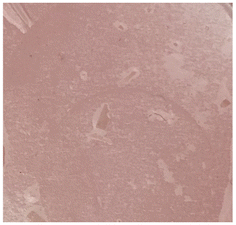
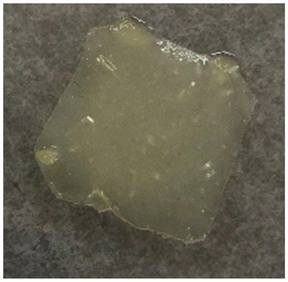
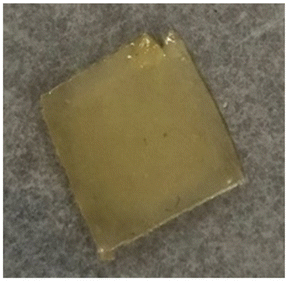
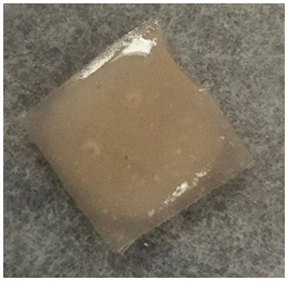
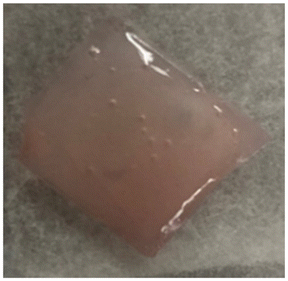
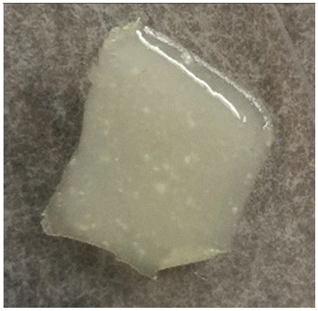
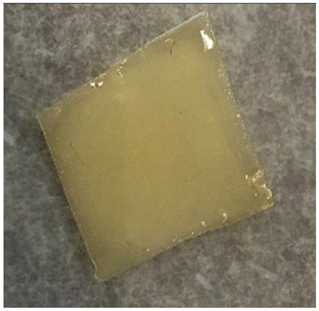
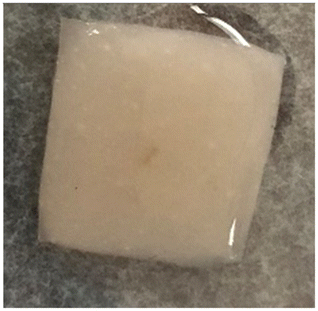
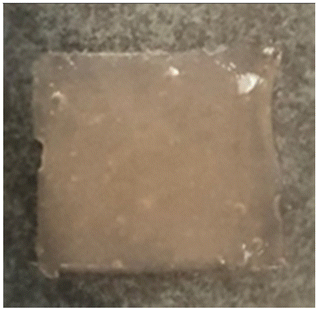
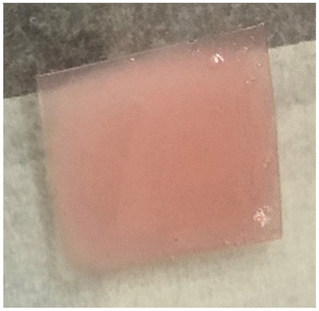
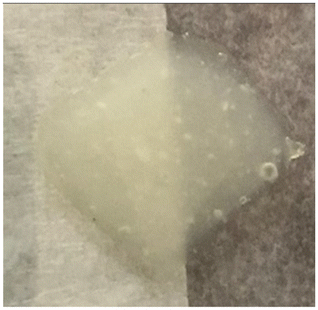
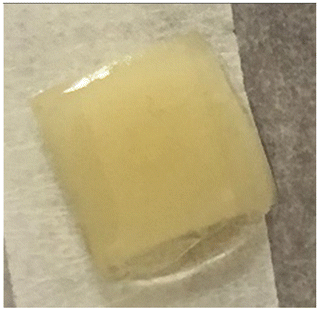
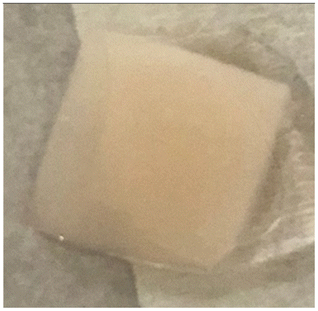
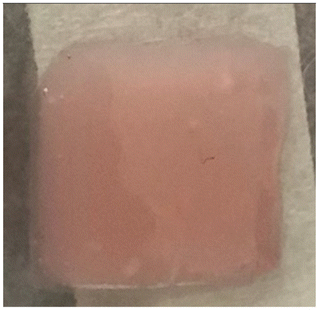
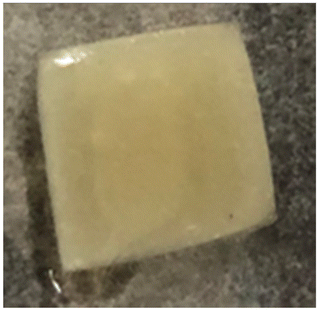
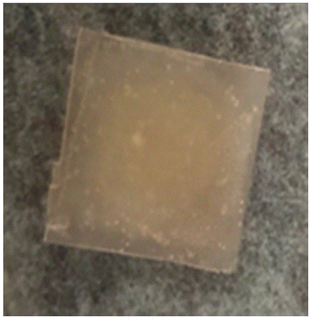
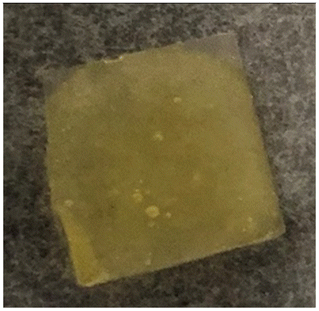
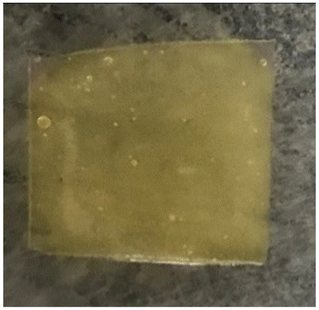
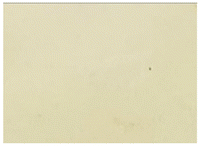
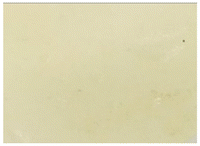
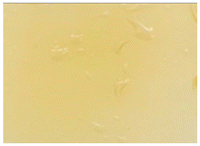
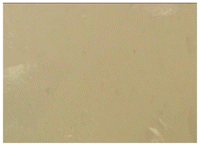
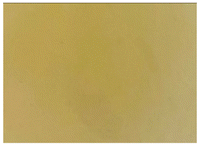
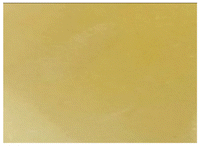
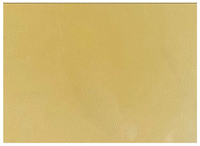
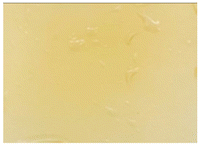
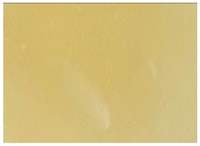
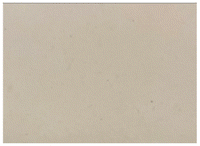
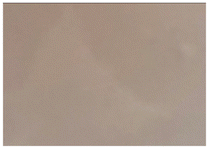
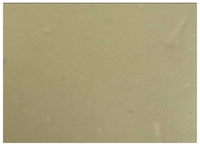
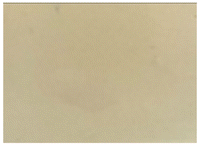
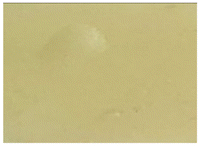
According to Ortega et al.,44 two crucial visual characteristics of packaging films that can affect consumer choices about contained food are the color of the outer layer and the way light flows through them. Thus, the color qualities of the indicator films, which were influenced by the quantity of EB added, are presented in Table 1. The film's a* value increased from −2.26 to −2.42 upon the addition of EB (0.5%) to the OM/CNF/mixture. This change manifested as a red hue on the film's surface. As the EB concentration increased, the red color intensity in the films also increased, reaching its peak at EB (2%), due to a significant rise in the a* value to 22.5. A comparable color was observed when glucomannan-PVA films were infused with pitaya peel extract.45 Lozano-Navarro et al. (2018)46 also reported that chitosan-starch films infused with beetroot or pitaya extract exhibited a red-pink coloration. The L* (lightness) value decreased from 96.30 in the OM/CNF/films without EB to 78.60 in the films with EB (2%), indicating a darker appearance as the concentration of EB increased. This aligns with the red hue of the betacyanin pigmentation derived from EB, resulting in a noticeable red appearance on the film's surface. The b* values, representing yellowness/blueness, were significantly different (p < 0.05), and the variability in these values could be attributed to the low concentration of EB. The total color difference (ΔE) increased with the addition of EB, rising from 4.48 in the OM/CNF films to 30.25 in the OM/CNF/EB (2%) films. This increase in ΔE indicates a more pronounced color change at higher EB concentrations, highlighting the incorporation of betacyanins into biopolymeric films known for their reddish pigment properties.40,47,48 Similar findings were observed by Iahnke et al.,49 who noted that the incorporation of beetroot residue powder led to a consistent improvement in the a* and ΔE values of gelatin-based films, showing a linear enhancement.
Table 1 Color properties of OM/CNF/films with various concentrations of EB
| Films samples |
L* |
a* |
b* |
ΔE |
Photograph |
| The values show the mean ± SE of experiments conducted in triplicate (n = 3). Duncan's multiple range test indicates that values in rows with different superscripts (a–e) are significantly different (p < 0.05). Lightness (L*), redness (a*), yellowness (b*), and the total colour difference (ΔE), cellulose nanofiber (CNF), and encapsulated beetroot waste extract (EB). |
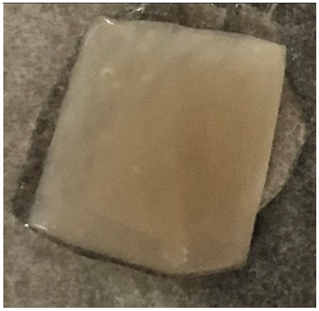
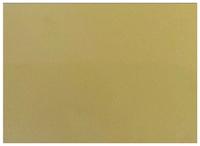
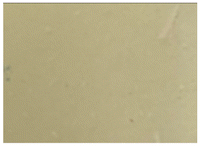
| OM/CNF |
96.30 ± 0.17a |
−2.26 ± 0.04d |
14.27 ± 0.47b |
— |

|
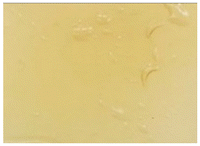
| OM/CNF/EB (0.5%) |
92.67 ± 0.39b |
−2.42 ± 0.19d |
16.84 ± 0.04a |
4.48 ± 0.17d |

|
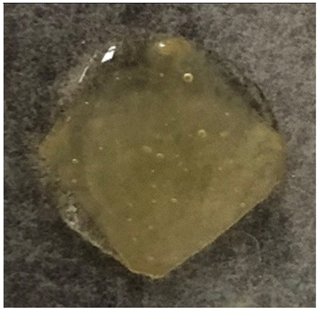
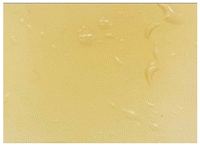
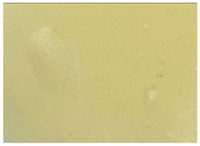
| OM/CNF/EB (1%) |
92.67 ± 0.39b |
2.88 ± 0.34c |
4.33 ± 0.15d |
11.29 ± 0.50c |

|
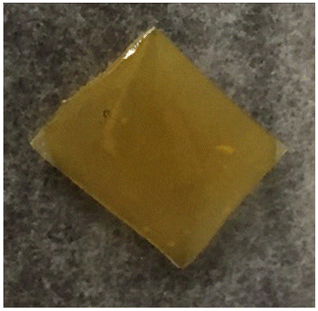
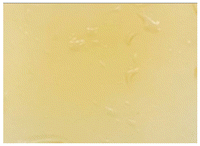
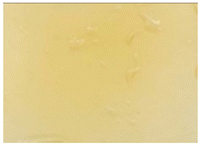
| OM/CNF/EB (1.5%) |
97.16 ± 0.14a |
4.85 ± 0.23b |
2,78 ± 0.11e |
13.55 ± 0.42b |

|
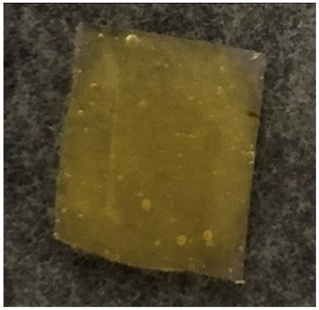
| OM/CNF/EB (2%) |
78.60 ± 1.54c |
22.5 ± 1.29a |
11.31 ± 0.93c |
30.25 ± 1.49a |

|
3.2.2 Film thickness, density and tensile strength.
The introduction of EB into the OM/CNF did not significantly (p > 0.05) enhance the thicknesses of the films in comparison to the control OM/CNF film (Table 2). However, a slight significant (p < 0.05) change was noted with the OM/CNF/EB (1.5%) film. The slight variation in the thickness of the film resulted from the films having a low concentration of EB. Other reports, such as those by Jamróz et al.26 and Iahnke et al.,49 observed that the thickness of furcellaran and gelatin films was enhanced upon the incorporation of betalain beetroot extract due to the creation of a more intricate film matrix.50 The density of the OM/CNF films varied between 0.13 g mL−1 and 0.26 g mL−1, with higher densities observed in films containing greater concentrations of EB (Table 2). This increase in density indicates increased compaction in the film matrix, which is supported by the microstructures shown in Fig. 3. Tensile strength (TS), a critical aspect of the films' mechanical properties, decreased significantly (p < 0.05) with the incorporation of EB (Table 2). The TS of the control film was 5.18 MPa, which dropped to 2.03 MPa in the film with 2% EB. This reduction in TS aligns with findings by Prietto et al.,51 who noted a decrease in the mechanical strength of corn starch films with the addition of anthocyanins (0.07 mg mL−1) from red cabbage and black bean seed coats. The reduction in TS can be attributed to the weakening of intermolecular interactions within the film matrix, negatively impacting the mechanical properties.51 Similarly, Prietto et al.51 observed a decline in TS of chitosan and polyvinyl alcohol films when red cabbage anthocyanins (25%) were incorporated. Nevertheless, another report like those of Qin et al.50 reported that betalains from red pitaya peel (0.32%) enhanced the TS of starch-PVA films by reducing intermolecular interactions between adjacent macromolecules. This discrepancy can be attributed to differences in the film matrices and the specific interactions between EB and the OM/CNF matrix used in this study.11
Table 2 Thickness, density, tensile strength and opacity of the OM/CNF films containing different concentrations of EB
| Film sample |
Thickness (mm) |
Density (g mL−1) |
Tensile strength (MPa) |
Opacity |
| The values show the mean ± SE of experiments conducted in triplicate (n = 3). Duncan's multiple range test indicates that values in rows with different superscripts (a–d) are significantly different (p < 0.05). |
| OM/CNF |
0.19 ± 0.02a |
0.13 ± 0.01b |
5.18 ± 0.65a |
0.36 ± 0.05d |
| OM/CNF/EB (0.5%) |
0.19 ± 0.11a |
0.08 ± 0.02b |
4.23 ± 0.35b |
0.42 ± 0.02d |
| OM/CNF/EB (1%) |
0.17 ± 0.02a |
0.21 ± 0.03a |
3.91 ± 0.24a,b |
0.62 ± 0.05c |
| OM/CNF/EB (1.5%) |
0.10 ± 0.06b |
0.26 ± 0.02a |
2.45 ± 0.21c |
0.74 ± 0.02b |
| OM/CNF/EB (2%) |
0.19 ± 0.01a |
0.26 ± 0.02a |
2.03 ± 0.05c |
0.90 ± 0.04a |
The OM/CNF films without EB displayed low opacity, indicating higher transparency. However, the films' opacity increased with increasing EB concentration, as indicated in Table 2, with the OM/CNF/EB (2%) film being the most opaque. This result agrees with Saroha et al. (2024),35 who found that incorporating beetroot (EB) into PVOH/methoxy-Kaolin films increased the film opacity. Similar results were observed in chitosan/starch films with extracts from various sources and ethylene–vinyl alcohol-based films containing beetroot extract rich in betalains.52
3.2.3 Moisture content, water vapour permeability, water solubility and swelling degree.
The OM/CNF films without EB exhibited the lowest moisture content at 19.91%. In contrast, the films containing EB showed significantly higher moisture content, reaching 57.77% for the 2% EB films (p < 0.05). This increase in moisture content can be attributed to the strong affinity of mucilage for moisture due to its hydrophilic nature and the substantial number of hydroxyl groups on the polysaccharides chain.11 Additionally, the presence of CNF enhances the films' water uptake ability.53 However, Jamróz et al.26 observed a decrease in the moisture content of furcellaran films when beetroot extracts were added. Similarly, Qin et al.50 and Naghdi et al.12 found that moisture content decreased with the incorporation of betalains from red pitaya peel and betacyanin from paper flowers in starch-based films. These variations in moisture content could be due to the different active ingredients used in the film formulations.11
Packaging films must regulate moisture exchange in and out of food to maintain the desired moisture content.50 Water vapor permeability (WVP) is a key factor in food packaging as it quantifies how effectively the films can resist water transfer or other moisture-absorbing substances.54 Low WVP is essential for extending the shelf life of food items.12,41 However, a higher WVP can be advantageous in films designed for use as sensors,48 as it enables quick detection of humidity changes and real-time monitoring. This is crucial for intelligent packaging applications, where rapid responses to moisture fluctuations can preserve product quality and prevent spoilage. Various film properties, including interactions between functional groups within the film components, film thickness, and overall film matrix integrity, significantly impact WVP.31,41,55 Film without EB exhibited the minimum WVP (0.39 × 10⁻¹⁰ g m−1 s−1 Pa−1), as shown in Table 3. The addition of EB led to a significant increase in WVP (p < 0.05). Bertuzzi et al.56 noted that the WVP of starch-based films is influenced by water activity and thickness, and it fluctuates with changes in moisture content. The increase in WVP in EB films can be linked to the potent hydrophilic bonds formed between EB and the OM/CNF combination, attributed to the hydrophilic characteristics of betalains. Reports such as those by Zamudio-Flores et al.31 found that the inclusion of beetroot extracts significantly elevated the WVP of oxidized starch films, a phenomenon also associated with the hydrophilic properties of betalains. Conversely, other studies like those by Iahnke et al.49 and Qin et al.50 found that the addition of beetroot residue powder and red pitaya peel decreased the WVP of gelatin-based and starch-polyvinyl alcohol (SP) films, respectively.
Table 3 Moisture content (MC), water vapour permeability (WVP), water solubility (WS), and swelling test (ST) of the OM/CNF incorporated with EB at different concentrations
| Film samples |
MC (%) |
WVP × 1010 (g (m s Pa)−1) |
WS (%) |
ST (%) |
| The values (n = 3) show the mean of the replicated tests. Duncan's multiple range test indicates that values in rows with different superscripts (a–e) are significantly different (p < 0.05). Moisture content (MC), water vapor permeability (WVP), water solubility (WS) and swelling test (ST). |
| OM/CNF |
19.91 ± 0.70e |
0.39 ± 0.09b |
11.52 ± 1.25e |
80.12 ± 0.50b |
| OM/CNF/EB (0.5%) |
28.20 ± 0.81d |
0.42 ± 0.06b |
17.76 ± 0.86d |
81.14 ± 0.89a,b |
| OM/CNF/EB (1%) |
44.44 ± 0.88c |
0.52 ± 0.07b |
33.64 ± 1.56c |
81.71 ± 0.56a,b |
| OM/CNF/EB (1.5%) |
55.55 ± 0.82b |
0.75 ± 0.13a |
37.71 ± 0.30b |
81.01 ± 0.73b |
| OM/CNF/EB (2%) |
57.77 ± 0.99a |
0.89 ± 0.12a |
56.15 ± 1.47a |
83.18 ± 0.86a |
The results indicate that incorporating EB significantly altered the properties of the OM/CNF films. Water solubility significantly increased with higher EB concentrations, with 56.15% in the OM/CNF/EB (2%) film (p < 0.05). This increase in solubility may be due to a reduction in interconnected hydrogen bonds and increased available space within the polymer matrix caused by the EB incorporation.57 The increased water solubility of OM/CNF films could also be linked to the hydrophilicity of betalains in EB, as noted by Wang et al. (2019).58 Similarly, Yong et al. (2019)59 found that adding purple-fleshed sweet potato extract to a chitosan matrix increased water solubility due to glycerol and other hydrophilic components within the chitosan. Additionally, the swelling degree of the films increased as the concentration of EB increased, likely due to the films' enhanced water absorption properties. The swelling degree increased from 80.12% in the OM/CNF films without EB to 83.18% in the 2% EB films. Thakur et al. (2022)60 observed that adding anthocyanin to polyvinyl alcohol-based films increased their moisture content, dissolution rate, and swelling index.
3.3 Characterization of the mucilage OM/CNF/EB composite films
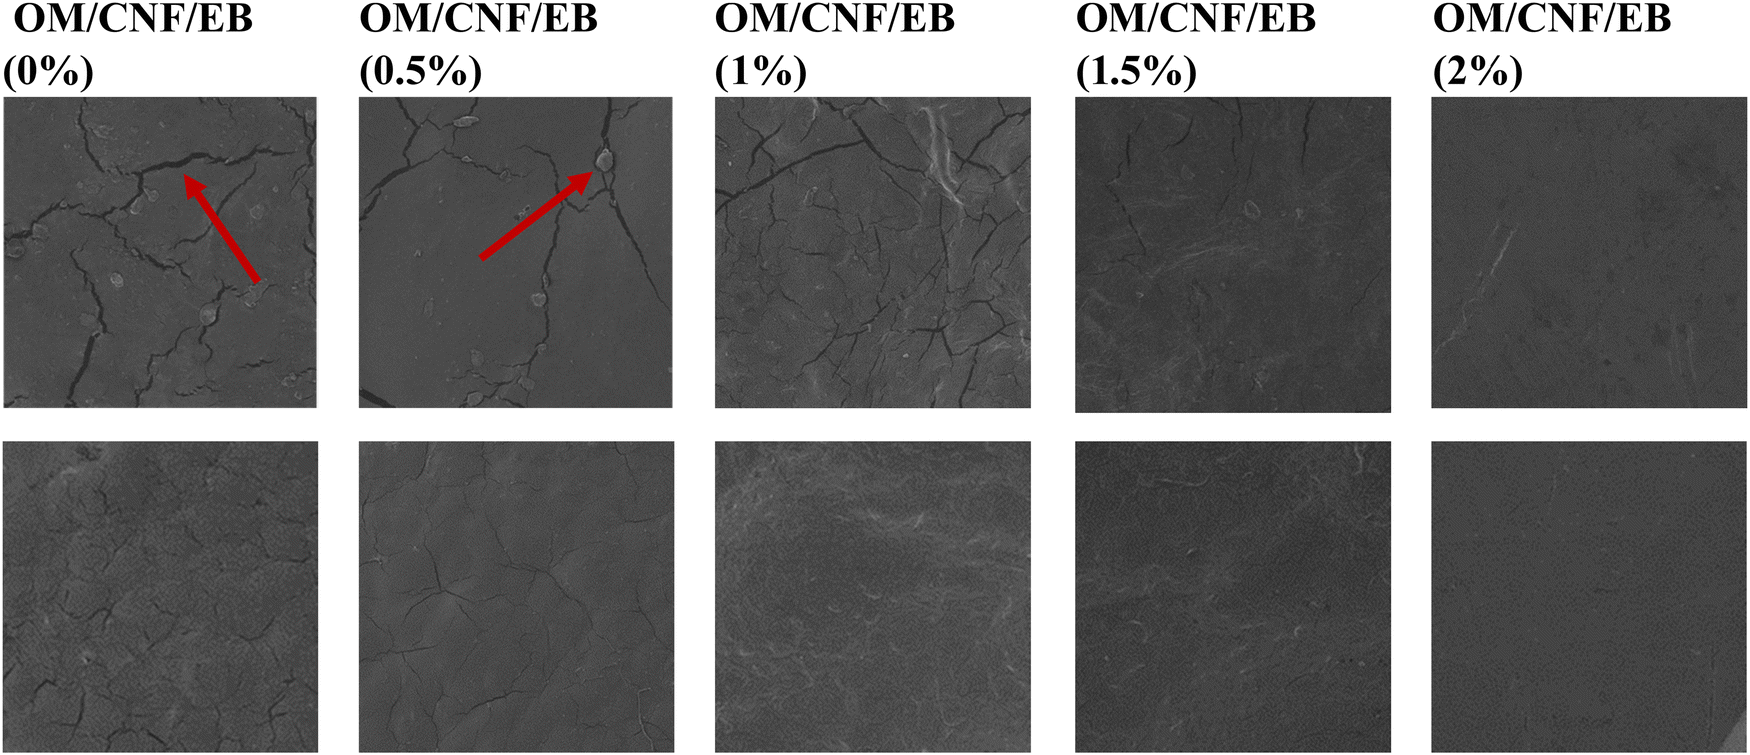
3.3.1 Microstructure of the OM/CNF/EB films.
The OM/CNF films without EB exhibited rough, uneven surfaces with cracks and noticeable small particles, indicating immiscibility between the film-forming components, as depicted in Fig. 4. However, as the concentration of EB increased, there was a noticeable improvement in the surface texture of the films. The surface gradually became smoother and more even, exhibiting fewer cracks. Notably, at a 2% addition of EB, all cracks were concealed, suggesting an increased level of homogeneity within the film matrix.
 |
| | Fig. 4 Scanning electron microscopic (SEM) surface micrographs of OM/CNF-based films at different EB concentrations at a magnification of 500× and 100×. | |
Overall, the addition of EB demonstrated excellent compatibility between EB and the OM/CNF film matrix. This is attributed to the hydrogen bonds formed between the EB and the polysaccharide mucilage. Yao et al. (2021)13 reported that the inclusion of various extracts contributed to a greater level of compatibility and uniformity in the films. Similarly, Zhai et al.53 found that anthocyanins from roselle enhanced the interaction between starch and PVA, improving film properties. The SEM analysis thus confirms that EB incorporation significantly enhances the microstructural properties of the OM/CNF films.
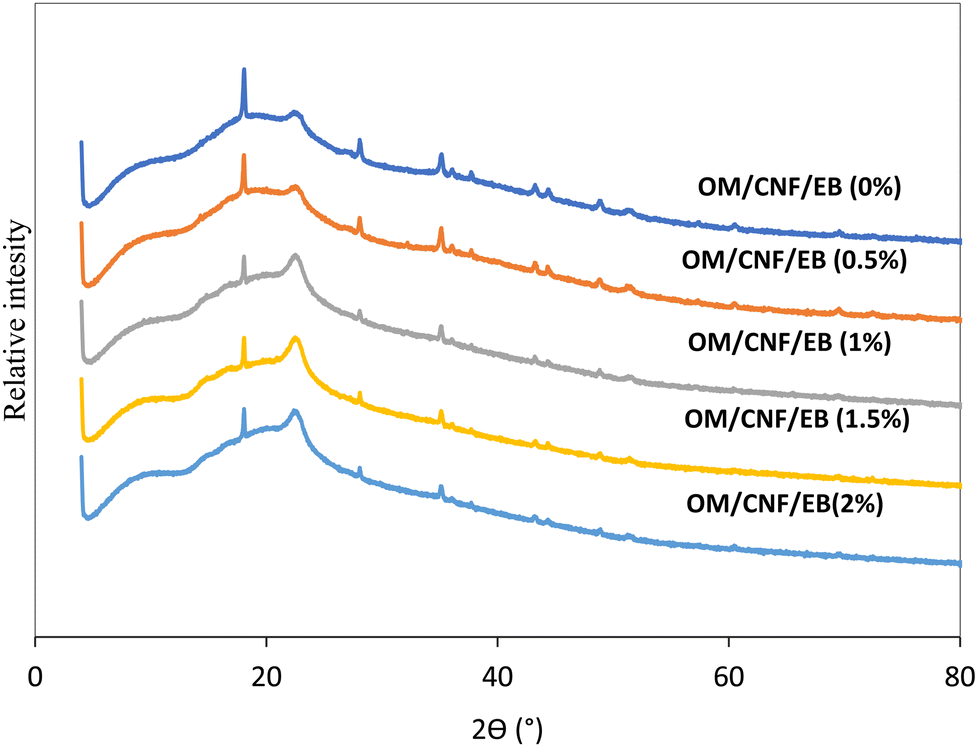
3.3.2 XRD analysis of the OM/CNF films with and without EB.
The X-ray diffraction (XRD) analysis presented in Fig. 5 revealed the impact of EB on the crystalline structure of the OM/CNF films. The control film exhibited a prominent diffraction peak at 18.0° suggesting strong crystallinity, and relatively small peaks at 28.27°, 35.36°, 43.72°, and 52.06°, attributed to what indicating its semi-crystalline nature.58 A subtle weak peak at 60.96° was also observed. However, as the concentration of EB increased, the subtle peak at 69.96° disappeared, indicating a reduction in the crystalline degree of the films.59,60 This reduction is likely due to strong intermolecular interactions between EB and the other components in the film matrix.61 These findings align with the SEM results, which showed that the microstructures of the EB films were more evenly distributed (Fig. 4). Recent research has indicated that betalains, specifically betacyanin, display a broad peak around 20°, suggesting an amorphous structure.41 Our findings also displayed a wide diffraction peak at 22.61°, indicating that the structure was amorphous and that EB was integrated into the OM/CNF matrix, as the subtle peak associated with the polysaccharide mucilage structure disappeared.31,53 Gutiérrez et al.61 noted a decline in the crystallinity of films when beetroot powder was added to plantain flour. Conversely, Qin et al.41 reported that incorporating betalains from the peel of red pitaya (Hylocereus polyrhizus) could enhance the crystalline thickness of starch/polyvinyl alcohol films. This suggests that the specific combinations of betacyanin and film matrices can influence the crystallinity of the films.
 |
| | Fig. 5 X-ray diffraction (XRD) patterns of the OM/CNF films at different concentrations of EB. | |
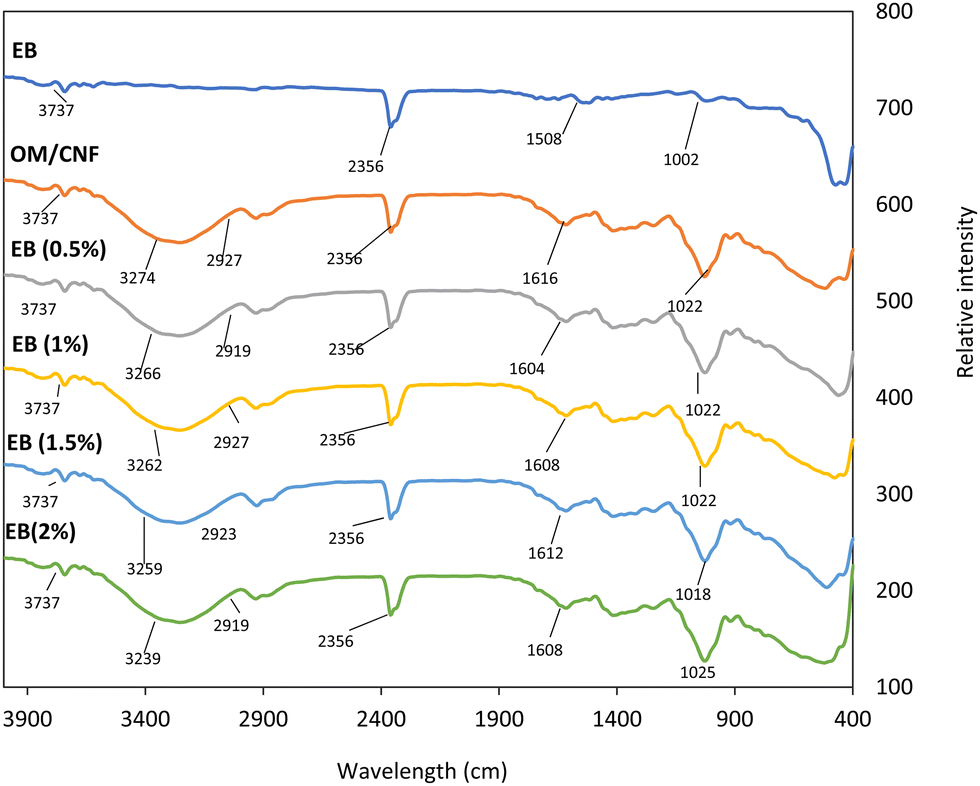
3.3.3 FT-IR spectra of the OM/CNF film with EB at various concentrations.
The FT-IR spectra reveal the functional groups present in the film. The distinctive patterns of starch bands, including the stretching vibration of O–H bonds found at 3274 cm−1, were identified in the OM/CNF film, as shown in Fig. 6. This aligns with the molecular makeup of mucilage or starch, which is a linear polysaccharide with many hydroxyl groups.55,62,63 The C–H bond exhibits an asymmetric stretching vibration at a wavenumber of 2927 cm−1. The peaks observed at 1508 cm−1, 1616 cm−1, and 1022 cm−1 correspond to the stretching vibrations of C![[double bond, length as m-dash]](https://www.rsc.org/images/entities/char_e001.gif) C, CN, and C–O–C bonds in betacyanin, respectively.46,64 Furthermore, the O–H stretching band shifted to a lower wavenumber (3239 cm−1) rather than increasing in intensity, buttressing the findings of Tran et al. (2017),65 who reported a similar shift when red beetroot powder was added to starch films. Conversely, Gutiérrez et al. (2016)61 observed a decrease in the O–H stretching band and an elevation to a higher wavenumber when beet powder was added to films made of native or phosphated plantain flour. The addition of EB to the OM/CNF films results in noticeable changes in the functional groups.65 The spectra of the films with increasing concentrations of EB (0.5%, 1%, 1.5%, and 2%) show shifts and variations in the intensity of the peaks corresponding to the functional groups. For instance, the O–H stretching band at 3274 cm−1 in the control film (OM/CNF) shifts to lower wavenumbers in films with EB, indicating strong interactions between the hydroxyl groups of mucilage and CNF with the betacyanin in EB. This interaction likely contributes to the improved film homogeneity observed in the SEM images. The spectra also reveal the presence of CC, CN, and C–O–C bonds in the films with EB, suggesting that the betacyanin is well integrated into the film matrix. The changes in the FT-IR spectra, particularly the shifts in the O–H stretching bands, align with earlier studies that indicated the FT-IR spectra of films rich in betacyanins are influenced by the type of matrix and the chemical composition of the betacyanins.31,53
C, CN, and C–O–C bonds in betacyanin, respectively.46,64 Furthermore, the O–H stretching band shifted to a lower wavenumber (3239 cm−1) rather than increasing in intensity, buttressing the findings of Tran et al. (2017),65 who reported a similar shift when red beetroot powder was added to starch films. Conversely, Gutiérrez et al. (2016)61 observed a decrease in the O–H stretching band and an elevation to a higher wavenumber when beet powder was added to films made of native or phosphated plantain flour. The addition of EB to the OM/CNF films results in noticeable changes in the functional groups.65 The spectra of the films with increasing concentrations of EB (0.5%, 1%, 1.5%, and 2%) show shifts and variations in the intensity of the peaks corresponding to the functional groups. For instance, the O–H stretching band at 3274 cm−1 in the control film (OM/CNF) shifts to lower wavenumbers in films with EB, indicating strong interactions between the hydroxyl groups of mucilage and CNF with the betacyanin in EB. This interaction likely contributes to the improved film homogeneity observed in the SEM images. The spectra also reveal the presence of CC, CN, and C–O–C bonds in the films with EB, suggesting that the betacyanin is well integrated into the film matrix. The changes in the FT-IR spectra, particularly the shifts in the O–H stretching bands, align with earlier studies that indicated the FT-IR spectra of films rich in betacyanins are influenced by the type of matrix and the chemical composition of the betacyanins.31,53
 |
| | Fig. 6 FTIR spectra of OM/CNF films containing varying concentrations of EB. | |
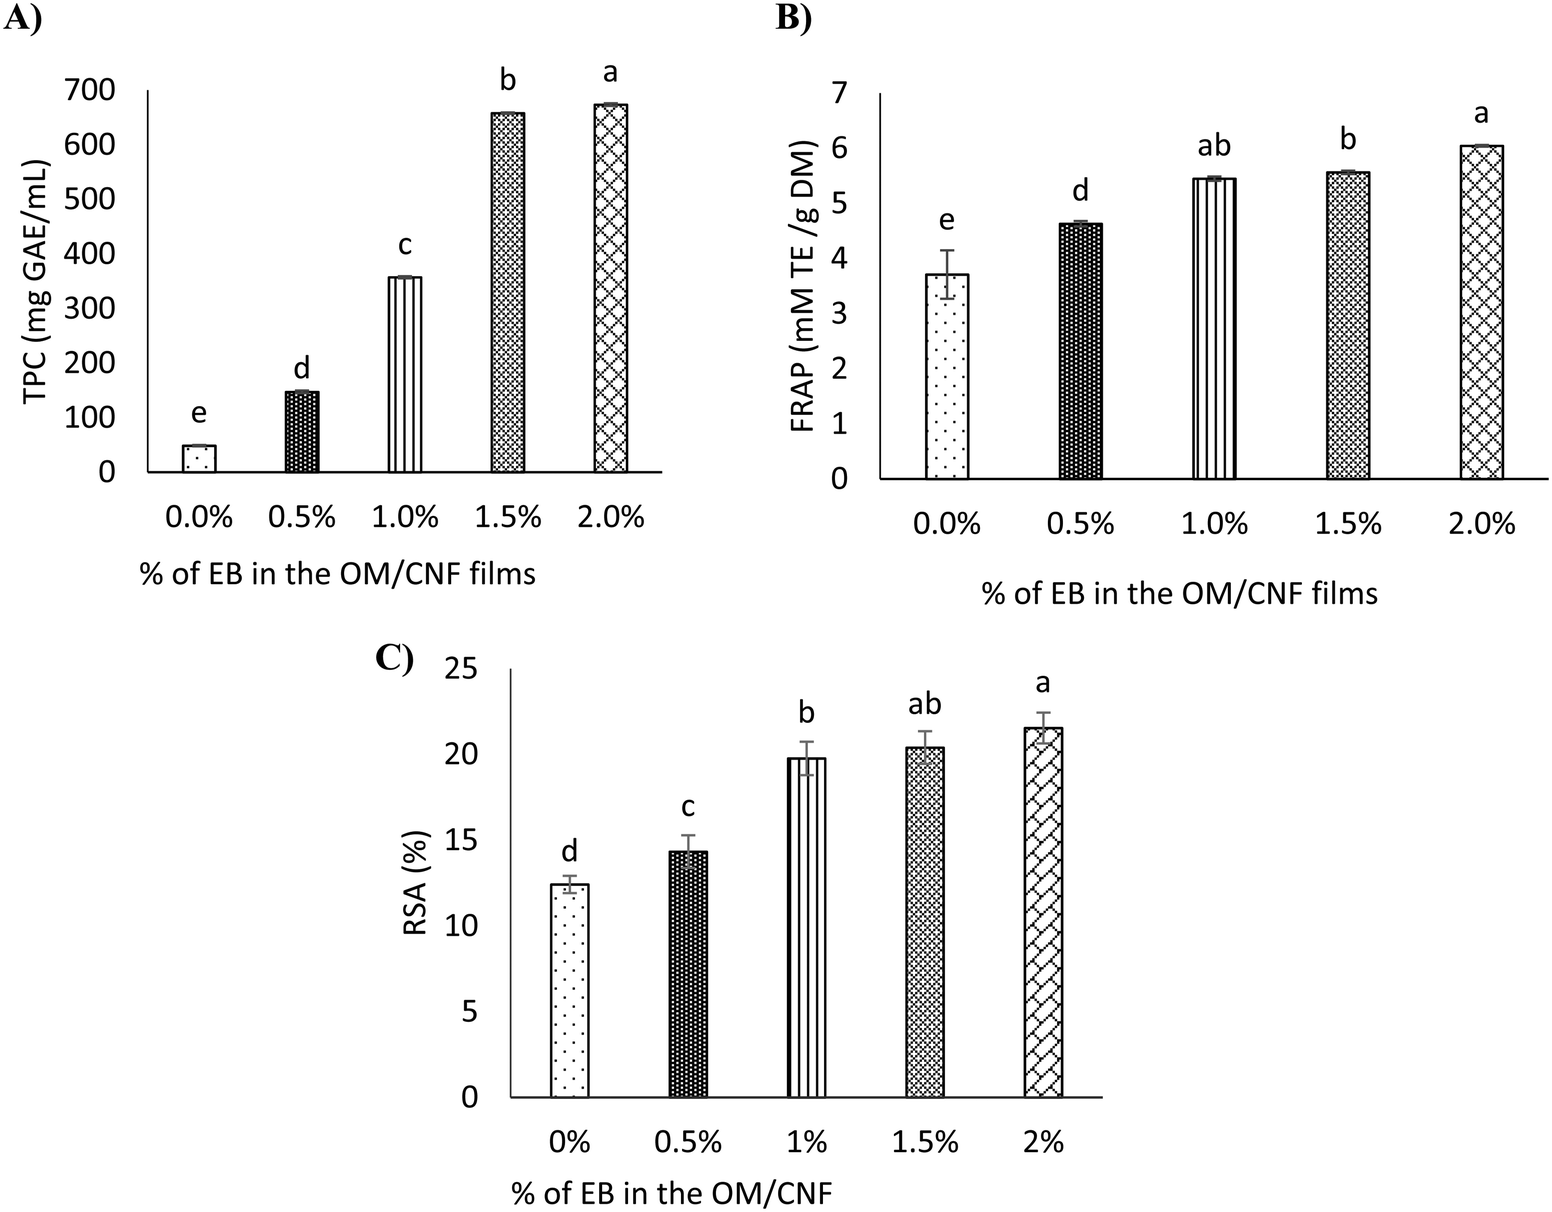
3.3.4 Antioxidant activity of OM/CNF films with EB at various concentrations.
The TPC of the OM/CNF films without EB was relatively low, as shown in Fig. 7A. However, as the concentration of EB increased, the TPC also increased significantly, ranging from 48.72 to 673.43 mg GAE per mL, (Fig. 7A). The film with the highest EB concentration (2%) exhibited the highest TPC. This increase in TPC is attributed to the elevated levels of phenolic compounds in beetroot, which are effectively incorporated into the film matrix.66 The findings are consistent with the study by Chaari et al.,66 who reported an increase in TPC content from 21.85 to 23 mg GAE per mL in gelatin-sodium alginate films containing beetroot. The high TPC in the films suggests that EB is a rich source of phenolic compounds, which contribute to the antioxidant properties of the films.67 Furthermore, the ferric reducing antioxidant power (FRAP) test results, depicted in Fig. 7B, reveal a significant increase in antioxidant activity, with values rising from 6.8 to 22.1 mM TE per g DM upon the incorporation of EB into the mucilage/CNF/glycerol films. This increase in FRAP is indicative of the strong reducing power of the films, which is enhanced by the presence of betalains and other phenolic compounds in EB. Similarly, Rodríguez-Félix et al. (2022)67 reported increased FRAP and DPPH radical scavenging activity when betalain extract was added to zein films. This suggests that the antioxidant properties of the mucilage/CNF/glycerol films are significantly enhanced by the addition of EB, making these films effective in providing antioxidant protection.
 |
| | Fig. 7 The OM/CNF films with EB antioxidant activity (A) total phenolic content (TPC), (B) ferric reducing antioxidant power (FRAP) and (C) DPPH radical scavenging activity (RSA). Duncan's multiple range test reveals that distinct letters atop the vertical bars denote notable differences in mean (p < 0.05) across three replicates (n = 3). The standard deviation of the mean is represented by vertical bars on each column. EB, beetroot waste extract powder. | |
DPPH, a nitrogen-cantered radical, is commonly employed as a standard substrate for evaluating the radical scavenging ability of various compounds.41,68 As shown in Fig. 7C, the OM/CNF film without EB exhibited a relatively low ability to scavenge DPPH radicals. However, the radical scavenging capacity significantly increased with higher concentrations of EB in the films, particularly at the 2% EB concentration. This increase could be attributed to the rich betalain content present in EB, which enhances the film's antioxidant properties. The findings are consistent with previous studies, such as those by Iahnke et al.,49 who reported an enhancement of DPPH radical scavenging activity in gelatin-based films with the addition of beetroot powdered residue. The antioxidant properties of the films are closely linked to the presence of betalains and phenolic compounds found in the beetroot residue powder used. Similarly, Qin et al.41 demonstrated that the antioxidant properties of compounds in red pitaya (Hylocereus polyrhizus) peel extracts are significantly influenced by the presence of betalains. The antioxidant effectiveness of betacyanins, specifically, is largely determined by the ability of their phenolic hydroxyl groups to donate electrons.69 This electron-donating ability enhances the films' capacity to neutralize free radicals, thereby increasing their antioxidant activity. The effectiveness of films containing antioxidant substances depends on the active sites within these compounds, how well these sites interact with the polymers, and how efficiently the active components are released.41 Furthermore, Cai et al.70 proposed that the antioxidant efficacy of betacyanins is influenced by the arrangement of hydroxyl groups and the degree of glycosylation. Their study revealed that betacyanins of the gomphrenin type exhibited greater antioxidant activity than those of the betanin and amaranthine types. This suggests that the structural arrangement of betalains in EB plays a crucial role in enhancing the antioxidant properties of the films.
3.4 OM/CNF films with EB at various concentrations response to ammonia
Smart indicators rely on their ability to change color in response to specific acidic or basic substances, such as ammonia and acetic acid.71 The quality deterioration of protein-rich foods, like seafood and meat, often occurs due to increased pH levels and the emission of biogenic amines and ammonia.72 Ammonia, in particular, can simulate the release of volatile nitrogen compounds that occur when animal-derived products deteriorate.68 When these films become permeable to ammonia, ammonia hydrolyzes and produces hydroxyl ions, causing the films to turn alkaline.68 Upon exposure to ammonia gas, the films demonstrated significant color changes, transitioning from a reddish hue to yellow or brown, as illustrated in Table 5. This color shift is consistent with previous research findings, where films containing betacyanin turned brown or yellow upon exposure to ammonia, indicating the breakdown of betacyanins in the presence of ammonia.41,72 Jamróz et al.26 also reported that the hue of furcellaran films containing beetroot extract shifted from red to yellow when exposed to ammonia. The observed color changes in the smart films likely result from the interaction between evaporating NH3 and water trapped within the film matrix. This interaction may produce NH4+ and OH− ions, which influence the film's color.53
Table 5 Color changes in the OM/CNF with EB during a 60-minute ammonia exposure
| Films |
Time (min) |
| 0 |
10 |
20 |
30 |
40 |
50 |
60 |
ΔE |
| The values (n = 3) show the mean of the replicated tests. Duncan's multiple range test indicates that values in ΔE column with different superscripts (a–d) are significantly different (p < 0.05). Total color difference (ΔE). |
| OM/CNF |

|

|

|

|

|

|

|
46.12 ± 0.42b |
| OM/CNF/EB (0.5%) |

|

|

|

|

|

|

|
46.97 ± 0.49b |
| OM/CNF/EB (1%) |

|

|

|

|

|

|

|
51.06 ± 0.69a |
| OM/CNF/EB (1.5%) |

|

|

|

|

|

|

|
42.58 ± 0.33c |
| OM/CNF/EB (2%) |

|

|

|

|

|

|

|
21.84 ± 1.34d |
The total color difference (ΔE) after 60 min of exposure revealed that the film containing 1% EB had the highest ΔE compared to other concentrations, as indicated in Table 5. In contrast, the OM/CNF and OM/CNF/EB (0.5%) did not exhibit significant color changes. The OM/CNF/EB (1.5%) and OM/CNF/EB (2%) films showed the lowest ΔE values. The differences in ΔE could be influenced by factors such as the film matrix, the concentration of ammonia, and the stability of EB. Despite the OM/CNF/EB (1%) film showing the highest ΔE, the film containing 2% EB exhibited the most distinct visible color changes, making it more applicable as an ammonia indicator. The clear visible color change in these films upon exposure to ammonia indicates their suitability for real-world applications in monitoring the quality of such foods.
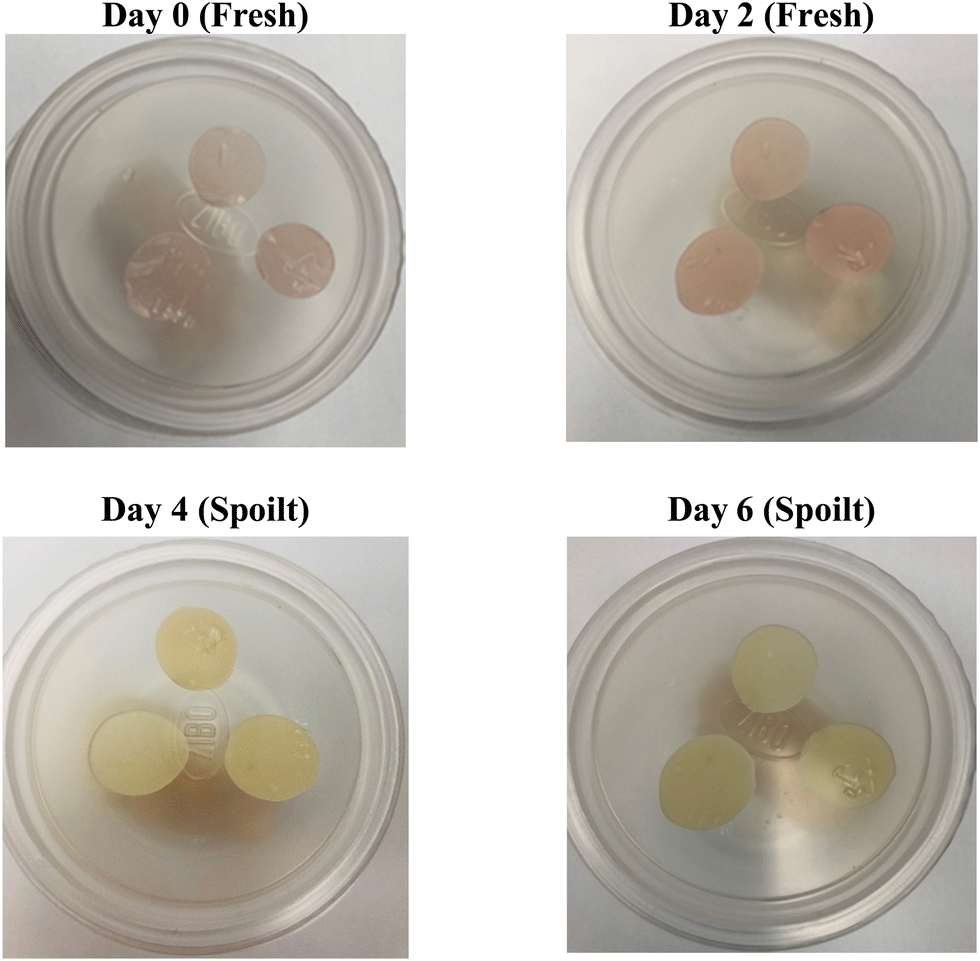
3.5 Effectiveness of OM/CNF/EB (2%) films in assessing the quality of hake medallions
Tracking the color transformation of OM/CNF/EB (2%) as a quality indicator over the storage period of hake medallions revealed a steady shift in color from reddish to yellow on the 4th day, with the film turning completely yellow on the 6th day. This color change coincided with the point at which the fish became microbially and chemically spoiled. As shown in Table 6, the a* value (indicating redness) of the film gradually decreased over time, while the b* value (indicating yellowness) increased. This trend aligns with the observed color changes in the film (Fig. 8). The total color difference (TCD) increased significantly from 0 on the first day to 12.98 on the 6th day, making the color changes easily visible to the human eye. However, the TCD showed minimal change on the 2nd day, as the fish was still fresh and suitable for consumption, as indicated by the TVB-N value (Fig. 9). This observation is consistent with the earlier findings where the OM/CNF/EB (2%) film exhibited a noticeable shift from reddish to yellow when exposed to ammonia, as shown in Table 5. Consequently, the OM/CNF/EB (2%) film can serve as an effective visual indicator of spoilage in hake medallions, with color changes correlating with an increase in TVB-N levels and microbial counts. As previously noted by Jamróz et al.,26 furcellaran films combined with beetroot extract were effective in monitoring the quality of fish. Similarly, Ardiyansyah et al.45 used glucomannan-PVA films containing dragon extract to monitor fish spoilage. These findings support the potential use of OM/CNF/EB (2%) films as an intelligent indicator for assessing the freshness of protein-rich animal products like hake medallions.
Table 6 Color shifts of the OM/CNF/EB (2%) films during the storage period of the hake medallions
| Days |
a* value |
b* value |
TCD |
Colony-forming units log10 (CFU) per g |
| The values (n = 3) show the mean of the replicated tests. Duncan's multiple range test indicates that values in each column with different superscripts (a–d) are significantly different (p < 0.05). Redness (a*), yellowness (b*), total color difference (ΔE) and colony forming units. |
| 0 |
8.3 ± 0.29a |
14.10 ± 0.2d |
0.00 ± 0d |
3.94 ± 0.05c |
| 2 |
8.2 ± 0.1b |
15.53 ± 0.40c |
7.46 ± 1.15c |
5.16 ± 0.001b |
| 4 |
3.4 ± 0.1c |
21.93 ± 0.25b |
9.47 ± 0.91b |
7.10 ± 0.09a |
| 6 |
0.17 ± 0.1d |
24.4 ± 0.2a |
12.98 ± 0.29a |
7.42 ± 0.001a |
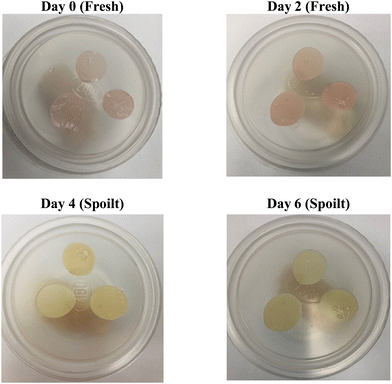 |
| | Fig. 8 Visual color shifts of the OM/CNF/EB (2%) films during the storage period of the hake medallions. | |
 |
| | Fig. 9 Total volatile basic nitrogen (TVB-N) and pH of the hake medallions during the 6-day storage period at 6 °C. | |
The deterioration in fish freshness during storage is primarily due to bacterial spoilage and biochemical processes, which are exacerbated by the high-water activity and pH levels typical of fish.73 The total viable count (TVC) of the hake medallions increased during storage from 3.94logCFU per g on day 0 to 7.42 log CFU per g on day 6. This rise in TVC was expected, as the films do not inhibit spoilage but serve as indicators of spoilage progression. Similar increases in microbial spoilage were observed by Naghdi et al. and Otálora González et al.12,74 when using starch betacyanin films and cassava starch films containing anthocyanin from betalain to monitor the spoilage of Caspian sprats and other fish.
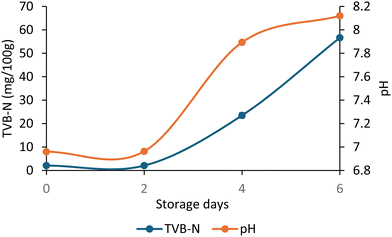
Total volatile basic nitrogen (TVB-N) is a key metric for determining fish quality, encompassing alkaline substances produced during spoilage, such as trimethylamine and ammonia. These compounds contribute to the sensory disapproval of the fish, often imparting undesirable tastes.75 As shown in Fig. 8, during the storage period of the hake medallions, the TVB-N value increased from 2.10 mg/100 g on day 0 to 23.48 mg/100 g by day 4, indicating that the fish was no longer fresh. A clear correlation between TVB-N and pH was observed, with pH levels rising from 6.96 to 8.12 as TVB-N increased. The rise in pH over time is likely linked to microbial activity generating nitrogen-based substances.73,76 According to the Chinese Standard GB 2733–2015, the maximum permissible TVB-N level for fish is 20 mg g−1, a threshold that was exceeded on the 4th day of storage. These findings align with the changes observed in color, pH, and microbial growth, suggesting that hake medallions should be consumed within two days when refrigerated at 15 °C or below.
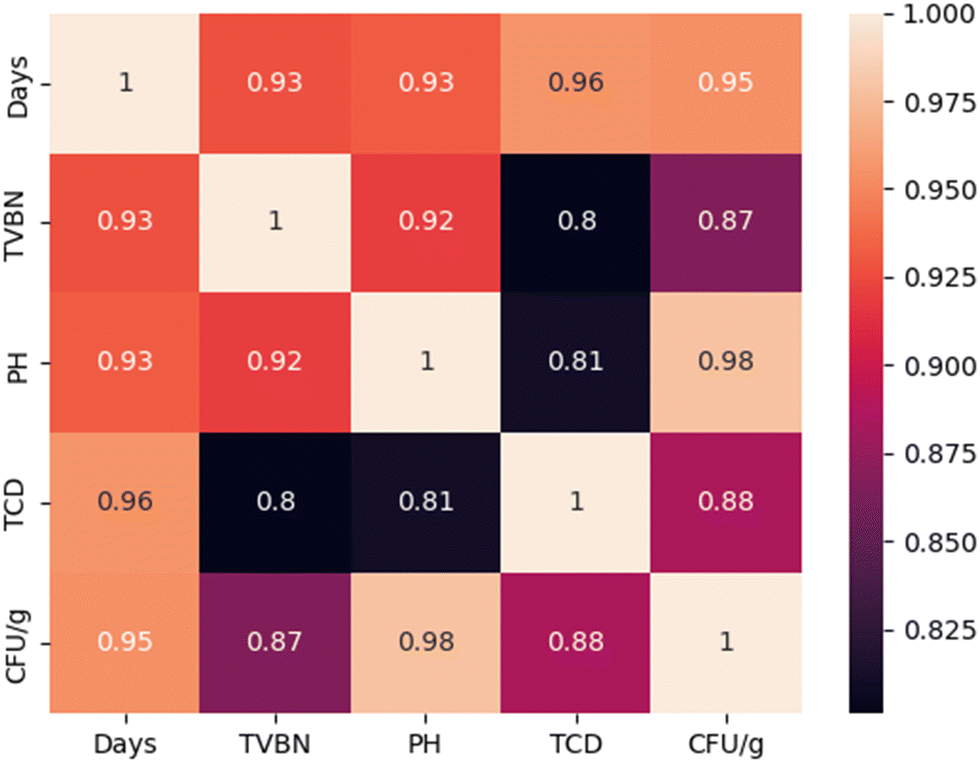
The results presented in Fig. 10 demonstrate the relationship between the total color difference (TCD) of the OM/CNF/glycerol films containing 2% EB and three key spoilage indicators of hake medallions, including total volatile basic nitrogen (TVB-N), pH, and colony-forming units (CFU) per gram. A strong positive correlation was observed between TCD and TVB-N (R2 = 0.8), indicating that as TVB-N levels increased, the TCD of the films also increased. The relationship suggests that higher levels of TVB-N, which indicate advanced spoilage, correspond to more pronounced color changes in the films. This finding supports the use of OM/CNF/EB (2%) as a reliable indicator of fish spoilage, reflecting the accumulation of volatile nitrogenous compounds during the degradation of protein-rich foods. Jamróz et al.26 also reported that furcellaran films combined with beetroot extract might be utilized to track the freshness of fish. Additionally, a strong positive correlation was found between TCD and pH, with an R2 value of 0.81, indicating a strong relationship. This implies that as the pH of the hake medallions increases, which typically occurs during spoilage due to the production of alkaline substances, the TCD of the films also rises. This relationship highlights the film's responsiveness to changes in the alkalinity of the environment, further validating its effectiveness as a spoilage indicator. The strongest relationship (R2 = 0.88) was observed between TCD and the logarithmic value of CFU (log10 CFU per g), suggesting a significant increase in the film's TCD with rising microbial counts. This strong relationship indicates that the films are highly sensitive to microbial spoilage, making them effective in detecting bacterial growth in the hake medallions.
 |
| | Fig. 10 Correlation coefficient matrix for the total color difference, pH, total volatile count, and storage days. | |
4. Conclusion
This study developed innovative food packaging films by incorporating various amounts of betalain-rich encapsulated beetroot waste (0.5%, 1%, 1.5%, and 2%) as pH indicator (EB) into a matrix of Opuntia ficus mucilage (OM) and cellulose nanofibers (CNFs). The films exhibited enhanced moisture content (57.77%), water solubility (56.15%), antioxidant activity (21.53%), and pH sensitivity, with the most significant improvements seen with 2% EB. While EB reduced tensile strength, it improved surface morphology and did not impart antimicrobial properties. However, the films were highly responsive to ammonia, making them suitable for intelligent packaging. The 2% EB film showed distinct color changes, effectively monitoring the spoilage of hake medallions. This research demonstrates the potential of using agricultural waste for eco-friendly intelligent packaging, aligning with SDG goal 12 (responsible consumption and production). Furthermore, it contributes to the circular bioeconomy by reducing food and packaging waste, promoting resource efficiency, and minimizing environmental impact. This study thus supports the use of a sustainable waste management approach while also highlighting the promise of biobased materials in advancing eco-friendly, intelligent food packaging solutions.
Data availability
The article contains all the related data and information.
Conflicts of interest
The authors declare no conflict of interest regarding the publication of this article. All funding sources supporting the research work are acknowledged within the manuscript, and there are no financial, personal, or professional relationships that could be perceived as influencing the work reported in this article. The authors confirm that the research was conducted independently and in accordance with the ethical guidelines of the RSC.
Acknowledgements
This work is based on research supported by the National Research Foundation of South Africa (Ref: SPAR231013155231) and the University Research Committee at the University of Johannesburg.
References
- D. Hoehn, I. Vázquez-Rowe, R. Kahhat, M. Margallo, J. Laso, A. Fernández-Ríos, I. Ruiz-Salmón and R. Aldaco, Resour., Conserv. Recycl., 2023, 188, 106671 CrossRef.
- T. Mkhari, T. Kaseke and O. A. Fawole, Front. Nutr., 2023, 10, 1235372 CrossRef PubMed.
- L. Chen, Y. Zhu, Z. Hu, S. Wu and C. Jin, Food Sci. Nutr., 2021, 9, 6406 CrossRef CAS PubMed.
- X. Yao, J. Liu, H. Hu, D. Yun and J. Liu, Food Hydrocolloids, 2022, 124, 107305 CrossRef CAS.
- S. Jane, M. M. O. P. Vaishnav, S. John, S. John and S. J. Monica, Int. J. Pharma Res. Health Sci., 2017, 5, 1974–1979 Search PubMed.
- S. Hussain, R. Akhter and S. S. Maktedar, Sustainable Food Technol., 2024, 2, 1297–1364 RSC.
- M. Chen, T. Yan, J. Huang, Y. Zhou and Y. Hu, Int. J. Biol. Macromol., 2021, 179, 90–100 CrossRef CAS.
- B. Hassan, S. A. S. Chatha, A. I. Hussain, K. M. Zia and N. Akhtar, Int. J. Biol. Macromol., 2018, 109, 1095–1107 CrossRef CAS PubMed.
- U. Urbizo-Reyes, M. F. San Martin-González, J. Garcia-Bravo and A. M. Liceaga, Int. J. Biol. Macromol., 2020, 163, 854–864 CrossRef CAS PubMed.
- X. Yao, H. Hu, Y. Qin and J. Liu, Food Hydrocolloids, 2020, 106, 105896 CrossRef CAS.
- F. Mannai, L. Mechi, F. Alimi, A. K. D. Alsukaibi, M. N. Belgacem and Y. Moussaoui, Int. J. Biol. Macromol., 2023, 252, 126456 CrossRef CAS.
- S. Naghdi, M. Rezaei and M. Abdollahi, Int. J. Biol. Macromol., 2021, 191, 161–170 CrossRef CAS PubMed.
- X. Yao, Y. Qin, M. Zhang, J. Zhang, C. Qian and J. Liu, Int. J. Biol. Macromol., 2021, 183, 358–368 CrossRef CAS.
- D. Yun, Y. He, H. Zhu, Y. Hui, C. Li, D. Chen and J. Liu, Int. J. Biol. Macromol., 2022, 205, 141–153 CrossRef CAS.
- S. Roy, H. J. Kim and J. W. Rhim, Int. J. Biol. Macromol., 2021, 183, 305–315 CrossRef CAS PubMed.
- J. H. Cheng, Q. Dai, D. W. Sun, X. A. Zeng, D. Liu and H. Bin Pu, Trends Food Sci. Technol., 2013, 34, 18–31 CrossRef CAS.
- S. Roy and J. W. Rhim, Food Hydrocolloids, 2021, 114, 106566 CrossRef CAS.
- K. Zhang, T. S. Huang, H. Yan, X. Hu and T. Ren, Int. J. Biol. Macromol., 2020, 145, 768–776 CrossRef CAS PubMed.
- T. Sawicki, J. Juśkiewicz and W. Wiczkowski, Molecules, 2017, 22, 2137 CrossRef.
- F. R. de Mello, C. Bernardo, C. O. Dias, L. Gonzaga, E. R. Amante, R. Fett and L. M. B. Candido, Cienc. Rural, 2014, 45, 323–328 CrossRef.
- Y. Y. Yong, G. Dykes, S. M. Lee and W. S. Choo, LWT, 2018, 91, 491–497 CrossRef CAS.
- R. M. Martinez, D. T. Longhi-Balbinot, A. C. Zarpelon, L. Staurengo-Ferrari, M. M. Baracat, S. R. Georgetti, R. C. Sassonia, W. A. Verri and R. Casagrande, Arch. Pharmacal Res., 2015, 38, 494–504 CrossRef CAS.
- N. Chhikara, K. Kushwaha, S. Jaglan, P. Sharma and A. Panghal, Cereal Chem., 2019, 96, 154–161 CrossRef CAS.
- M. H. Shinga and O. A. Fawole, Int. J. Biol. Macromol., 2023, 245, 125550 CrossRef CAS.
- S. Wybraniec and Y. Mizrahi, J. Agric. Food Chem., 2002, 50, 6086–6089 CrossRef CAS PubMed.
- E. Jamróz, P. Kulawik, P. Guzik and I. Duda, Food Hydrocolloids, 2019, 97, 105211 CrossRef.
- T. B. Leta, J. O. Adeyemi and O. A. Fawole, Mater. Res. Express, 2024, 11, 055402 CrossRef CAS.
- J. Wang, X. Zhou, Q. Zhou, S. Cheng, B. Wei and S. Ji, Postharvest Biol. Technol., 2017, 131, 10–15 CrossRef CAS.
- M. Alboofetileh, M. Rezaei, H. Hosseini and M. Abdollahi, J. Food Eng., 2013, 117, 26–33 CrossRef CAS.
- H. Aloui, A. R. Deshmukh, C. Khomlaem and B. S. Kim, Food Hydrocolloids, 2021, 113, 106508 CrossRef CAS.
-
P. B. Zamudio-Flores, E. Ochoa-Reyes, J. De, J. Ornelas-Paz, J. M. Tirado-Gallegos, L. A. Bello-Pérez, A. Rubio-Ríos and R. G. Cárdenas-Felix, Caracterización Fisicoquímica, Mecánica Y Estructural De Películas De Almidones Oxidados De Avena Y Plátano Adicionadas Con Betalaínas Physicochemical, Mechanical, And Structural Features Of Oxidized Oat And Banana Starch Films Enriched With Betalains.
- Z. A. Maryam Adilah, B. Jamilah and Z. A. Nur Hanani, Food Hydrocolloids, 2018, 74, 207–218 CrossRef CAS.
- Y. Qin, Y. Liu, H. Yong, J. Liu, X. Zhang and J. Liu, Int. J. Biol. Macromol., 2019, 134, 80–90 CrossRef CAS PubMed.
- M. Lotfi, H. Tajik, M. Moradi, M. Forough, E. Divsalar and B. Kuswandi, LWT, 2018, 92, 576–583 CrossRef CAS.
- V. Saroha, S. Raghuvanshi, H. Khan and D. Dutt, Food Biophys., 2024, 19, 191–206 CrossRef.
- K. Ravichandran, R. Palaniraj, N. M. M. T. Saw, A. M. M. Gabr, A. R. Ahmed, D. Knorr and I. Smetanska, J. Food Sci. Technol., 2014, 51, 2216–2221 CrossRef CAS.
- E. Janiszewska, Powder Technol., 2014, 264, 190–196 CrossRef CAS.
- H. M. C. Azeredo, Int. J. Food Sci. Technol., 2009, 44, 2365–2376 CrossRef CAS.
- A. Gengatharan, G. A. Dykes and W. S. Choo, LWT, 2015, 64, 645–649 CrossRef CAS.
- J. Liu, H. Wang, M. Guo, L. Li, M. Chen, S. Jiang, X. Li and S. Jiang, Food Hydrocolloids, 2019, 94, 1–10 CrossRef CAS.
- Y. Qin, Y. Liu, X. Zhang and J. Liu, Food Hydrocolloids, 2020, 100, 105410 CrossRef CAS.
- R. Castellar, J. M. Obón, M. Alacid and J. A. Fernández-López, J. Agric. Food Chem., 2003, 51, 2772–2776 CrossRef CAS.
- F. Fathordoobady, H. Mirhosseini, J. Selamat and M. Y. A. Manap, Food Chem., 2016, 202, 70–80 CrossRef CAS PubMed.
- F. Ortega, L. Giannuzzi, V. B. Arce and M. A. García, Food Hydrocolloids, 2017, 70, 152–162 CrossRef CAS.
- Ardiyansyah, M. W. Apriliyanti, A. Wahyono, M. Fatoni, B. Poerwanto and W. Suryaningsih, IOP Conf. Ser. Earth Environ. Sci., 2018, 207, 012038 CrossRef.
- J. I. Lozano-Navarro, N. P. Díaz-Zavala, C. Velasco-Santos, J. A. Melo-Banda, U. Páramo-García, F. Paraguay-Delgado, R. García-Alamilla, A. L. Martínez-Hernández and S. Zapién-Castillo, Materials, 2018, 11, 120 CrossRef.
- H. Dong, Z. Ling, X. Zhang, X. Zhang, S. Ramaswamy and F. Xu, Sens. Actuators, B, 2020, 309, 127752 CrossRef CAS.
- S. Huang, Y. Xiong, Y. Zou, Q. Dong, F. Ding, X. Liu and H. Li, Food Hydrocolloids, 2019, 90, 198–205 CrossRef CAS.
- A. O. E. S. Iahnke, T. M. H. Costa, A. De Oliveira Rios and S. H. Flôres, J. Appl. Polym. Sci., 2021, 138, 47224 Search PubMed.
- Y. Qin, Y. Liu, X. Zhang and J. Liu, Food Hydrocolloids, 2020, 100, 105410 CrossRef CAS.
- L. Prietto, T. C. Mirapalhete, V. Z. Pinto, J. F. Hoffmann, N. L. Vanier, L. T. Lim, A. R. Guerra Dias and E. da Rosa Zavareze, LWT, 2017, 80, 492–500 CrossRef CAS.
- M. J. Cejudo-Bastante, C. Cejudo-Bastante, M. J. Cran, F. J. Heredia and S. W. Bigger, Food Packag. Shelf Life, 2020, 24, 100502 CrossRef.
- X. Zhai, J. Shi, X. Zou, S. Wang, C. Jiang, J. Zhang, X. Huang, W. Zhang and M. Holmes, Food Hydrocolloids, 2017, 69, 308–317 CrossRef CAS.
- J. Long, W. Zhang, M. Zhao and C. Q. Ruan, Carbohydr. Polym., 2023, 321, 121267 CrossRef CAS PubMed.
- C. L. Luchese, N. Sperotto, J. C. Spada and I. C. Tessaro, Int. J. Biol. Macromol., 2017, 104, 11–18 CrossRef CAS.
- M. A. Bertuzzi, E. F. Castro Vidaurre, M. Armada and J. C. Gottifredi, J. Food Eng., 2007, 80, 972–978 CrossRef CAS.
- Sucheta, S. K. Rai, K. Chaturvedi and S. K. Yadav, Food Hydrocolloids, 2019, 91, 127–135 CrossRef CAS.
- X. Wang, H. Yong, L. Gao, L. Li, M. Jin and J. Liu, Food Hydrocolloids, 2019, 89, 56–66 CrossRef CAS.
- H. Yong, X. Wang, R. Bai, Z. Miao, X. Zhang and J. Liu, Food Hydrocolloids, 2019, 90, 216–224 CrossRef CAS.
- R. Thakur, V. Gupta, T. Ghosh and A. B. Das, Food Packag. Shelf Life, 2022, 33, 100914 CrossRef CAS.
- T. J. Gutiérrez, J. Suniaga, A. Monsalve and N. L. García, Food Hydrocolloids, 2016, 54, 234–244 CrossRef.
- I. Choi, J. Y. Lee, M. Lacroix and J. Han, Food Chem., 2017, 218, 122–128 CrossRef CAS PubMed.
- P. Ezati, H. Tajik and M. Moradi, Sens. Actuators, B, 2019, 285, 519–528 CrossRef CAS.
- S. N. A. Kumar, S. K. Ritesh, G. Sharmila and C. Muthukumaran, Arabian J. Chem., 2017, 10, S2145–S2150 CrossRef CAS.
- T. N. Tran, A. Athanassiou, A. Basit and I. S. Bayer, Food Chem., 2017, 216, 324–333 CrossRef CAS.
- M. Chaari, K. Elhadef, S. Akermi, B. Ben Akacha, M. Fourati, A. Chakchouk Mtibaa, M. Ennouri, T. Sarkar, M. A. Shariati, M. Rebezov, S. Abdelkafi, L. Mellouli and S. Smaoui, Antioxidants, 2022, 11, 2095 CrossRef CAS.
- F. Rodríguez-Félix, J. A. Corte-Tarazón, S. Rochín-Wong, J. D. Fernández-Quiroz, A. M. Garzón-García, I. Santos-Sauceda, D. F. Plascencia-Martínez, L. H. Chan-Chan, C. Vásquez-López, C. G. Barreras-Urbina, A. Olguin-Moreno and J. A. Tapia-Hernández, J. Food Eng., 2022, 334, 111153 CrossRef.
- J. Zhang, X. Zou, X. Zhai, X. W. Huang, C. Jiang and M. Holmes, Food Chem., 2019, 272, 306–312 CrossRef CAS PubMed.
- J. Taira, E. Tsuchida, M. C. Katoh, M. Uehara and T. Ogi, Food Chem., 2015, 166, 531–536 CrossRef CAS PubMed.
- Y. Cai, M. Sun and H. Corke, J. Agric. Food Chem., 2003, 51, 2288–2294 CrossRef CAS PubMed.
- M. Ahmed, I. Bose, Nousheen and S. Roy, Int. J. Biomater., 2024, 7949258 CAS.
- H. Yong and J. Liu, Food Packag. Shelf Life, 2020, 26, 100550 CrossRef.
- M. Moradi, H. Tajik, H. Almasi, M. Forough and P. Ezati, Carbohydr. Polym., 2019, 222, 115030 CrossRef CAS PubMed.
- C. M. Otálora González, L. I. Schelegueda, V. M. Pizones Ruiz-Henestrosa, C. A. Campos, M. F. Basanta and L. N. Gerschenson, Foods, 2022, 11, 3361 CrossRef.
- H. Z. Chen, M. Zhang, B. Bhandari and C. H. Yang, LWT, 2019, 99, 43–49 CrossRef CAS.
- P. Ezati, H. Tajik, M. Moradi and R. Molaei, Int. J. Biol. Macromol., 2019, 132, 157–165 CrossRef CAS PubMed.
|
| This journal is © The Royal Society of Chemistry 2025 |
Click here to see how this site uses Cookies. View our privacy policy here. 
 Open Access Article
 This Open Access Article is licensed under a Creative Commons Attribution-Non Commercial 3.0 Unported Licence
 ab and
Olaniyi A.
Fawole
*ab
ab and
Olaniyi A.
Fawole
*ab