 Open Access Article
PDMS-based flexible and conductive composite films containing modified PEDOT:PSS coated channels as a potential neural conduit†
Orhan Gokalp
Buyukuysal
 a,
Busra
Kilic
 b,
Cagatay
Karaaslan
 ab,
Dincer
Gokcen
 c,
Cem
Bayram
 d and
Halil Murat
Aydin
*ae
aBioengineering Division, Institute of Science, Hacettepe University, Ankara, Turkey. E-mail: hmaydin@hacettepe.edu.tr; Tel: +90 312 297 78 00
bDepartment of Biology, Molecular Biology Section, Hacettepe University, Ankara, Turkey
cDepartment of Electrical and Electronics Engineering, Hacettepe University, Ankara, Turkey
dNanotechnology and Nanomedicine Division, Institute of Science, Hacettepe University, Ankara, Turkey
eBioengineering Division and Centre for Bioengineering, Hacettepe University, 06800, Ankara, Turkey
First published on 4th February 2025
Abstract
Neurological injuries cause the nervous system to malfunction, significantly impacting living standards. Conductive polymers aim to ensure the continuity of nervous system activities and their treatments through specially designed materials. Their soft structure, ability to combine with other polymers, load transfer capacity and biochemical composition enable them to be used in living tissues. Within the scope of this study, conductive and flexible composite films based on PEDOT:PSS aqueous dispersion (PPAD) (poly(3,4-ethylene dioxide thiophene):poly(styrene sulfonate)) were synthesized and combined in different proportions using bis(trifluoromethane)sulfonimide lithium (LiTFSI) salt as a chemical additive. Films were formed by pouring the PDMS polymer into a mold with a special electronic design printed with a 3D printer. Afterwards, the film channels were coated with modified PPAD and PPAD-LiTFSI by dip-coating and spin-coating methods and 1.1 mm thick composite films with channels 0.4 mm wide, 62.8 mm long and 0.1 mm deep were obtained. Several modifications including ion exchange, lyophilization, redispersion, and ethylene glycol (EG) addition have been applied to dispersions. As a consequence, particle size distribution, zeta potential, pH of dispersions, film conductivities and film biocompatibilities were modified as desired. Additionally, lyophilization and redispersion processes have been shown to mostly preserve material properties and extend the shelf life. Furthermore, analyses applied to normal materials were also conducted on samples kept for 12 months (12M), and the effects of time on the materials under different storage conditions were compared. Moreover, as a result of conductivity measurements, it was seen that the PPAD-RAL-EG had a conductivity of 4.67561 S m−1 and was among the values that can be used in nerve tissue. Finally, we investigated the in vitro cell culture behaviour of the films using MTT analysis, LDH analysis, ethidium bromide calcein staining and alamar blue assay with the L929 and SH-SY5Y cell lines. The composite films were found to be biocompatible. In conclusion, the shelf life of PEDOT:PSS has been extended, allowing it to be used when necessary, and a composite production and modification method that has the potential to be used in peripheral nerve injuries has been introduced to the literature.
1. Introduction
Peripheral nerves are frequently exposed to physical injuries due to traffic and construction accidents, natural disasters, injuries during wars, and side effects after surgical operations. Peripheral nerve injuries are a globally common clinical problem, affecting millions of people worldwide each year. These injuries, which cause serious nerve defects, can lead to lifelong disabilities in patients, as well as a decrease in quality of life and cause major socioeconomic and psychological problems.1–3More than 5 million cases of peripheral nerve injuries occur annually worldwide, with 300![[thin space (1/6-em)]](https://www.rsc.org/images/entities/char_2009.gif) 000 of these cases in Europe alone. In the US, more than 20 million Americans suffer from nerve injury problems, with total costs exceeding $150 billion, and 500
000 of these cases in Europe alone. In the US, more than 20 million Americans suffer from nerve injury problems, with total costs exceeding $150 billion, and 500![[thin space (1/6-em)]](https://www.rsc.org/images/entities/char_2009.gif) 000 surgical procedures are performed annually, creating a $1.5 billion market each year for peripheral nerve repair alone.4,5
000 surgical procedures are performed annually, creating a $1.5 billion market each year for peripheral nerve repair alone.4,5
It was determined that 31.3% of the patients spent between 3000 and 10![[thin space (1/6-em)]](https://www.rsc.org/images/entities/char_2009.gif) 000 dollars a year and 15.1% spent more than 10
000 dollars a year and 15.1% spent more than 10![[thin space (1/6-em)]](https://www.rsc.org/images/entities/char_2009.gif) 000 dollars a year. Considering the drug expenses required and the direct and indirect costs, it is clear that the financial responsibility imposed on society by peripheral nerve injuries is significant.
000 dollars a year. Considering the drug expenses required and the direct and indirect costs, it is clear that the financial responsibility imposed on society by peripheral nerve injuries is significant.
The regeneration capacity of the PNS is generally limited as it depends on complex processes to occur and is a slow, time-dependent process. Therefore, after injury or trauma, patients can often experience loss of sensory or motor function and suffer from neuropathic pain.6
Functionalized neural scaffolds and conduits can support nerve regeneration by providing neuroprotection, antioxidation, increased vascular regeneration, and immune regulatory effects.7 Polymeric materials of synthetic origin are one of the most common solutions used to repair functions in damaged nerve tissues and provide neuromodulation. Polymers can be used as nerve conduits and nerve guide channels by modifying their functionality. Polymer-based conduits come in many different shapes, contents, functions and designs because they have many processing methods, are suitable for use with different materials, can provide the desired mechanical and chemical properties and can be modified.
Conductive polymers, especially, can be used as flexible platforms that enable the production of improved materials for the diagnosis and treatment of various neurological diseases and injuries.8 Applications of electrically conductive polymers as bio-interfaces are promising for nerve probes and directed cell growth.9 These materials can convert signals from ionic to electronic and vice versa. They can be used both intracorporeally and on the body surface. Moreover, their soft structure, charge transfer abilities and improvable composition allow them to integrate well into both solid substrates and living tissues.10 Conductive polymers have an alternative conjugated structure of carbon–carbon double bonds which contributes to providing high electron affinities and electronic characteristic behavior such as efficient ionization potentials.11
PEDOT can exhibit good biocompatibility with modifications, high conductivity, and hydrophilicity suitable for cell adhesion. Therefore, it is used in nerve tissue engineering.12 Among the conductive polymers in the literature and industry, poly(3,4-ethylene dioxythiophene):poly(styrene sulfonate) (PEDOT:PSS) is one of the most successful polymers. PEDOT:PSS has properties such as high conductivity and stability, easy and successful film formation ability, and modifiable flexibility.13 The properties of PEDOT:PSS can be modified by changing the PSS concentration. This can be achieved by adding low molecular weight PSS to polymeric complexes and changing the dispersion medium, which increases the function of PEDOT:PSS.14 The structure composition ratio between PEDOT and PSS changes the electrical conductivity and number of nanoparticles and significantly affects the polymer structure.15 Additionally, PEDOT:PSS can be synthesized as an aqueous dispersion.
To increase the stretchability of PEDOT, plasticizers such as PSS, Zonyl, and Triton need to be added. PEDOT becomes more stretchable with higher plasticizer concentration, but excessive increase in plasticizer concentration may result in decreased conductivity. It has been found that various small molecule ionic additives can form effective combinations for PEDOT:PSS to provide both high flexibility and conductivity. Bis(trifluoromethane)sulfonimide lithium (LiTFSI) salt is a hydrophilic salt that can be used to adjust the polymer morphology and doping of the polymer. Apart from this, it promotes effective phase separation between PEDOT and PSS and increases the crystallinity of PEDOT-rich areas.16
Insulating polymers in fillers for thermoelectric composites have become promising materials because they have good flexibility and can efficiently separate the dependence between electrical conductivity, Seebeck coefficient, and thermal conductivity.17 Moreover, in composites, localized formation of non-conductive domains of polymers can allow the creation of conductive patterns in non-conductive films to produce flexible electronic devices.18 Moreover, conductive polymers can be incorporated into non-conductive polymers to contribute to structural properties and electrical conductivity, strengthen cell bonding, create directed cell growth, and impart properties such as proliferation and differentiation.19
PDMS is a polymer with characteristic properties because it consists of an inorganic siloxane backbone and organic methyl groups attached to silicone. Since it has a very low glass transition temperature, it exhibits fluid behavior at room temperature unless cross-linked. It is an inert material and it attracts great attention because of its low cost, rapid prototyping and easy casting procedure and it is suitable for tissue surfaces, protein and cell modelling.20,21 Additionally, it has high biocompatibility. It can be used in cell culture, microdevices, organ-on-a-chip models, and implantable devices or as parts thereof. With its ability to form composites by combining with other materials, it can be used to eliminate the biocompatibility problems of implants.20,22
In light of our hypothesis in this study, a flexible and conductive composite nerve conduit with high potential was developed by combining the conductive PEDOT:PSS polymer with flexible and insulating PDMS polymer. PEDOT:PSS aqueous dispersion (PPAD) was synthesized and modified by ion exchange which decreased the particle size and increased the stability and was also modified by bis(trifluoromethane) sulfonimide lithium salt (LiTFSI) addition, increasing the hydrophilicity. PPAD's properties were preserved over time through lyophilization and redispersion processes (otherwise, particles aggregate and particle size increases and also, properties such as uniform film making ability, conductivity, and zeta potential deteriorate) and comparative studies were carried out. As a result, within the scope of this study, a conductive and flexible PEDOT:PSS-PDMS composite with very high potential for use in nerve tissue was produced, and with various modifications, it was made suitable for biological applications, while its material properties were also improved. In addition to these advantages, the possibility of use at any time was provided with the lyophilization and redispersion protocol, and a shelf life was provided that offered the possibility of use over a longer period while preserving the properties of PEDOT:PSS to a large extent.
2. Materials and methods
2.1. PEDOT:PSS aqueous dispersion (PPAD) synthesis
The PPAD synthesis was optimized to 120 mL in total. EDOT monomer (0.5 wt%) and PSS aqueous solution (PSS wt% 1.67) were used in a PSS/EDOT molar ratio of 2.3, and sodium persulfate 1.2245 g and iron(II) sulfate heptahydrate 0.24 g were added to different beakers. 20 mL of deionized water was added to each beaker. They were mixed with a magnetic stirrer for 1 hour.After 1 hour, the aqueous solutions in the beakers were transferred into a three-necked round bottom flask, and the solution was mixed with deionized water to a total of 120 mL. The flask was placed on a magnetic stirrer and nitrogen gas was turned on after the thermometer was fixed at 25 °C. The reaction was continued for 24 hours at room temperature with strong magnetic stirring and a continuous flow of nitrogen gas.
2.2. Ion exchange of PPAD
The presence of sodium and iron ions in the PPAD can cause effects such as aggregate formation and pH change and also affect the conductivity and stability of the polymer films. Therefore, anion exchange resin and cation exchange resin were used to remove sodium and iron ions from the dispersion.Using a dialysis membrane breaks direct contact of the dispersions with the resins. The method involves weighing the ion exchange resins into a large glass container and cutting the contact with the PPAD by filling it into the dialysis membrane and placing it in the same glass container.
The resins were first washed with deionized water several times until the color of the washing water became transparent. Afterwards, the cation resin was activated with 5% HCl solution and the anion resin was activated with 1 N NaOH solution.
The volume of PPAD filled into the dialysis membrane is 120 mL. 500 mL deionized water and 150 g cation exchange resin were added to the glass container. The ion exchange process was continued for 12 hours on a magnetic stirrer, with strong stirring and at room temperature, and the deionized water in the glass container was refreshed with a new one every hour throughout the process. The anion exchange process was completed using the same protocol and 150 g anion exchange resin.
2.3. PPAD-LiTFSI synthesis
While under strong magnetic stirring, 16 g was taken from the PPAD with a glass pipette and 4 g LiTFSI was measured on a precision balance to be 20% by weight and both were added to a beaker. It was mixed with a magnetic stirrer for 2 hours at room temperature. After these processes, PPAD/LiTFSI was lyophilized and stored at −80 °C. Since LiTFSI is a very hydrophilic chemical, it is quickly affected by the humidity in the air and begins to lose its solid form and retain moisture. For this reason, the process of weighing LiTFSI and adding it to the dispersions was completed as quickly as possible, so that the desired amount of LiTFSI could be used.2.4. Lyophilization
Optimal drying of the dispersions is of great importance in terms of particle ratio determination and their behavior with the chemical additives (LiTFSI) with which they will be mixed in the following steps. The dispersions were kept in an ultra-low temperature freezer at −80 °C for 12 hours before the lyophilization process. Afterwards, they were placed in the freeze dryer and subjected to lyophilization under low pressure (0.080 mbar) and low temperature (−80 °C). The purpose of this application is to prevent the nanoparticles in dispersion from aggregating after a certain period of time and to ensure that the material properties remain relatively stable while extending the storage life. Lyophilization times varied depending on the amount of dispersions, but on average, complete drying was achieved within 72 hours. Lyophilized materials were stored at −80 °C.2.5. Redispersion and ethylene glycol (EG) doping
The polymers, which were lyophilized and stored at −80 °C, were redispersed before the coating process. Lyophilized polymers were weighed and added to deionized water in the solid content ratios given in the results section and mixed with an overhead stirrer at 700 rpm at room temperature for 24 hours. Samples were taken from aqueous redispersions for various characterization analyses, and EG was added at a EG![[thin space (1/6-em)]](https://www.rsc.org/images/entities/char_2009.gif) :
:![[thin space (1/6-em)]](https://www.rsc.org/images/entities/char_2009.gif) aqueous dispersion ratio of 1
aqueous dispersion ratio of 1![[thin space (1/6-em)]](https://www.rsc.org/images/entities/char_2009.gif) :
:![[thin space (1/6-em)]](https://www.rsc.org/images/entities/char_2009.gif) 5 by weight and directly used in coating processes.
5 by weight and directly used in coating processes.
2.6. PDMS preparation
PDMS polymer SYLGARD® 184 PDMS (Sigma Aldrich) is supplied as a kit with the polymer and curing agent in a single package. The polymer and curing agent were mixed at the supplier's recommended ratio of 1![[thin space (1/6-em)]](https://www.rsc.org/images/entities/char_2009.gif) :
:![[thin space (1/6-em)]](https://www.rsc.org/images/entities/char_2009.gif) 10. 1 mL of the PDMS polymer, which is a viscous liquid, was poured onto the 3D mold and the polymerization process was allowed to complete over 24 hours. The resulting PDMS film was removed by cutting the ends of the 3D mold with a scalpel.
10. 1 mL of the PDMS polymer, which is a viscous liquid, was poured onto the 3D mold and the polymerization process was allowed to complete over 24 hours. The resulting PDMS film was removed by cutting the ends of the 3D mold with a scalpel.
2.7. 3D mold design with electronic channels
The 3D mold for the PDMS film was drawn using design software. As seen in Fig. 1, the black part is the electronic design, the yellow part is the mold surface and the red part is the mold walls. The reason why the mold walls have a height difference of 0.60 mm from the electronic design is that a 0.60 mm gap is created between the electronic channels with a height of 0.20 mm and the walls with a height of 0.80 mm. It was aimed to form an insulating film base covering the channels by filling this gap when PDMS is poured. Deeper channels may negatively affect the mechanical properties of the films.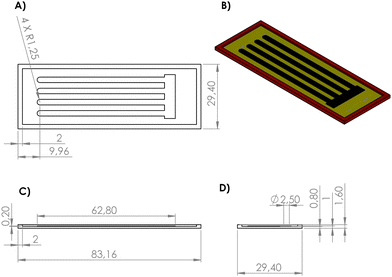 | ||
| Fig. 1 Technical drawing showing the 3D PETG mold and the electronic design inside. Dimensions are in mm. (A) Top view. (B) Isometric view. (C) Front view. (D) Left side view. | ||
2.8. Oxygen plasma process
Before coating the aqueous dispersions on the electronic channels, PDMS films were soaked in 70% ethyl alcohol and rinsed with deionized water. Then, the PDMS film surface except for the polymer channels to be coated with conductive polymers was covered with double-sided tape. By exposing PDMS to oxygen plasma for 5 minutes using BD-20V (Electro-Technic Products (ETP), USA), surface hydrophilicity was increased to facilitate the interaction between the dispersions and the surface and a more comfortable coating surface was provided.2.9. Obtaining composite films by dipping and spin coating
All synthesized dispersions were spin-coated onto insulating polymer channels using the spin-coating method. For the coating process, the non-coating surfaces of the PDMS films were glued to the center of the table fixed on a homemade rotating disk with autoclave tape. The films were immersed in each dispersion (dipping) and the dispersions were allowed to interact with the channels separately for a total of 10 minutes at room temperature, and then the turntable was plugged in and the rotation process was started from 0 to 1000 rpm. The spin-coating process was stopped and restarted 5 times in 10-second periods. Afterwards, the films were re-dipped into the dispersions and the spin-coating process was stopped and restarted 5 times in 10-second periods, as done in the above protocol. However, the final spinning process was stopped and completed after reaching 4500 rpm.During the rotation process, the dispersions adhering to the channels tend to be blown outwards due to centrifugal force. As the amount of dispersion decreases outward and proceeds from the surface, the polymer channels begin to become thinly coated.23 By taking advantage of this physical phenomenon, a very thin polymer film with electronic conductivity was obtained in the channels. After the spin-coating process was completed, the films were annealed in a 50 °C oven for 3 hours without using a vacuum. This process was repeated for each dispersion.
2.10. Solid content ratio determination
After the synthesis, while the dispersion was vigorously stirred, 5 mL of the dispersion was taken and transferred to an empty test tube, which had previously been weighed and noted. The test tube was weighed again with the dispersion, lyophilized and weighed again after completely drying. The aim here is to calculate the proportions of the main synthesized PPAD solid particles based on the amount of solid particles in 5 mL of aqueous dispersion.2.11. Particle size distribution and zeta potential analysis
Particle size distribution and zeta potential analyzes were used to measure the particle size distribution and electrical potential of nanoparticles in dispersions. Since PPAD and other dispersions created from this polymer are polymers in the form of nanoparticles that exist as colloids in water, they do not behave like a solution, and therefore, as they are kept in water, the nanoparticles begin to aggregate over time and combine. Therefore, dispersions that are not lyophilized should be subjected to the necessary analyzes and necessary applications should be made without wasting much time. For this reason, the lyophilization (freeze-drying) process has become mandatory. Particle size distribution analyzes were performed using a Zetasizer Nano ZSP (Malvern Instruments, UK) at various time intervals to examine the aggregate formation and potential change processes accordingly. Before analysis, samples were diluted 1![[thin space (1/6-em)]](https://www.rsc.org/images/entities/char_2009.gif) :
:![[thin space (1/6-em)]](https://www.rsc.org/images/entities/char_2009.gif) 10.000 with deionized water. In zeta analyses, the refractive index and absorption value parameters required by the device were entered as 1.5 and 0.01, respectively.
10.000 with deionized water. In zeta analyses, the refractive index and absorption value parameters required by the device were entered as 1.5 and 0.01, respectively.
2.12. pH measurements of aqueous dispersions
pH measurements were carried out for the samples at various stages including after the synthesis of aqueous dispersions, after redispersion following lyophilization, after EG addition before coating and their 12-month-old samples, using a Starter 3100 (Ohaus, USA). The aim was to understand the effect of each treatment applied to the dispersions on the pH value.2.13. Atomic absorption spectroscopy (AAS)
Atomic absorption spectroscopy was performed to measure the efficiency of ion exchange resins in removing iron and sodium ions from PPAD. Analyzes were carried out on the basis of absorption for iron ion determination and density for sodium ion determination. The samples were diluted with deionized water at ratios of 1![[thin space (1/6-em)]](https://www.rsc.org/images/entities/char_2009.gif) :
:![[thin space (1/6-em)]](https://www.rsc.org/images/entities/char_2009.gif) 10, 1
10, 1![[thin space (1/6-em)]](https://www.rsc.org/images/entities/char_2009.gif) :
:![[thin space (1/6-em)]](https://www.rsc.org/images/entities/char_2009.gif) 50 and 1
50 and 1![[thin space (1/6-em)]](https://www.rsc.org/images/entities/char_2009.gif) :
:![[thin space (1/6-em)]](https://www.rsc.org/images/entities/char_2009.gif) 100. Results are provided in Section S2.1 (ESI†).
100. Results are provided in Section S2.1 (ESI†).
2.14. Fourier-transform infrared spectroscopy (FTIR)
FTIR was used to understand the chemical composition of both the dispersions and PDMS films and to detect the functional groups they contain. Since the samples must be in a solid state for FTIR analysis, the samples were taken from the dispersions while mixing to contain a sufficient amount of solid particles, kept at −80 °C and dried by lyophilization. Measurements were carried out in the wave number range of 4000–500 cm−1. Results are provided in Section S2.2 (ESI†).2.15. Scanning electron microscopy (SEM)
After combining conductive polymer dispersions with PDMS films, the junction points of the composite films, coating quality, thickness examinations and surface imaging were evaluated with a SEM using GAIA3 Triglav (Tescan, Czech Republic) and images were taken. SEM was also used to measure the thickness of the channel coatings of the final composite films.2.16. Electrical characterization (resistivity, conductivity and resistance)
The resistivity properties of the films and based on these values, their conductivity properties, were measured and interpreted using a four-point probe 2450 Source Meter (Keithley Tektronix, USA). Measurements were carried out at room temperature and under constant current. For resistivity measurements, probes were placed in the center region of the drop-cast coated dispersions on glass lamellae, and multiple measurements were taken from the adjacent points within the center region.The resistivities (ρ) of the samples are determined using eqn (1); where d is the gap between the probes and is equal to 2.7 mm in our setup; V and I are the voltage and current values between specific probes.
 | (1) |
The conductivity (σ) is obtained from eqn (2).
| σ [S m−1] = 1/ρ | (2) |
Conventional resistance measurements were performed at each channel of the samples to identify the mechanical effect on electrical properties. To correlate the mechanical effect and electrical measurements, resistance measurements were taken under two conditions: (1) before any mechanical stimulation and (2) after stretching (25% tension – 2 cm in total) and releasing the sample. To clarify, post-stretching measurements were recorded when the composite films were released. Results for the resistance measurements are provided in Section S2.3.1 (ESI†).
2.17. Contact angle measurements
The hydrophilicity of the composite films was determined by contact angle measurements using a Theta Attension (Biolin Scientific, Sweden). Surface wettability was calculated based on the angle formed by a deionized water drop of standard size and volume with the film surface.2.18. Degradation and swelling tests
Degradation and swelling behaviors of the obtained films were examined. Analysis procedures (ESI,† 1.1 and 1.2) and results (ESI,† 2.4 and 2.5) for both tests are provided in the ESI.†2.19. In vitro cytocompatibility analysis
Mouse fibroblast-like L929 cell lines and Human Neuroblastoma SH-SY5Y cell lines were used in in vitro cell culture studies. The effects of PPAD-RAL-EG-PDMS and PPAD-LiTFSI-RAL-EG-PDMS on L929 and PPAD-RAL-EG-12M-PDMS and PPAD-LiTFSI-RAL-EG-12M-PDMS on SH-SY5Y viability and cytotoxicity were examined by MTT and LDH assay and EtBr/Calcein AM fluorescence staining. In addition, cell-material interaction was evaluated for 12M samples by Alamar Blue analysis for 14 days.The aim here is to address the potential loss of certain material properties due to a 12-month waiting period. Considering that the 12M groups are expected to exhibit effects on Human Neuroblastoma SH-SY5Y cells that are parallel to, but slightly lower in biocompatibility compared to the non-waited groups, the analyses will focus directly on the 12M groups. This approach aligns with the expectation that the results for the non-waited groups will demonstrate higher biocompatibility.
Cells were treated with film extracts for 24 hours. After incubation, the medium was incubated with MTT (0.5 mg mL−1) for 3 hours at 37 °C. Formazan crystals were dissolved by adding a dimethyl sulfoxide solution (Molecular Biology Grade, Sigma-Aldrich). The intensity of formazan crystals was measured at 570 nm using the EnSightTM Multimode Microplate Reader (PerkinElmer, Massachusetts, USA).
PPAD-RAL-EG-12M-PDMS and PPAD-LiTFSI-RAL-EG-12M-PDMS films were stained with Calcein-AM/propidium iodide (Sigma, USA) for live/dead imaging on the 1st, 4th, 7th, and 14th days after cell seeding using the SH-SY5Y cell line. At the end of the days determined, the films were washed and incubated with the indicated dyes for 10 min. The films were then re-washed and examined using a EVOS Flood fluorescence microscope (Thermo Fisher, USA).
Human neuroblastoma SH-SY5Y cells (ATCCRL-2266) were cultured in Gibco's DMEM/F12 Medium and seeded on PPAD-RAL-EG-12M-PDMS and PPAD-LiTFSI-RAL-EG-12M-PDMS films at a density of 3 × 10⁴ cells per scaffold for 14 days. Alamar Blue Solution (Invitrogen, USA) was administered on the 1st, 4th, 7th, and 14th days post-cell seeding and incubated for 4 hours to assess cell viability. Following incubation, the absorbance values of the solutions were measured using a Multimode Plate Reader (PerkinElmer, USA) at a wavelength of 570/600 nm.
3. Results and discussion
Samples before ion exchange are called BIE, and samples after ion exchange are called AIE (e.g. PPAD-BIE and PPAD-AIE).Samples redispersed after lyophilization are called RAL (e.g. PPAD-RAL) and samples redispersed after lyophilization after 12 months are called RAL-12M (e.g. PPAD-RAL-12M).
To compare lyophilized and non-lyophilized samples, samples kept in dispersion form at +4 degrees for 2 months were named 2M (e.g. PPAD-AIE-2M) and samples kept in dispersion form at +4 degrees for 12 months were named 12M (e.g. PPAD-AIE-12M).
EG suffix was added to the samples with ethylene glycol addition (e.g. PPAD-EG).
3.1. Solid content ratio determination
The results obtained with 3 samples from 5 mL show that PPAD have an average 3.37 g of solid particles in 120 mL PPAD. In other words, the solid content ratio is 2.81%.The solid content of PEDOT:PSS aqueous solution (CLEVIOS PH1000), sold as a commercial product, is in the range of 1.0–1.3 wt%.27 The reason behind the synthesized PPAD solid content ratio being higher than this product is due to the usage of a higher PSS ratio.
Increasing the ratio of PSS to PEDOT increases conductivity up to a point. However, after a certain level, this balance is disrupted and increasing the PSS ratio decreases the conductivity.15 During PEDOT:PSS synthesis, SO42− ions are formed. A higher PSS ratio provides more SO42− ions to the dispersion. SO3− ions in PSS carry only one negative charge, which provides polaronicity, while SO42− ions are doubly charged, which provides bipolarity in PEDOT chains. Increasing the amount of SO42− ions increases the bipolaron population, which leads to increased conductivity.28 As the amount of protons held in PSS increases due to the use of a high PSS ratio, the conductivity increases further.29
3.2. Particle size distribution analysis
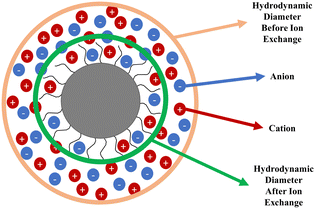
It is known that aqueous dispersions of conductive polymers form aggregates over time and therefore the particle size increases and the zeta potential decreases.30 The only difference between PPAD-BIE and PPAD-AIE samples is the execution of the ion exchange process. There are different data in the literature about the particle size of PEDOT:PSS with different properties, but according to the literature, the average can be given in the range of approximately 137 nm31 and 363–493 nm.32As seen in Fig. 2, there was a decrease in particle size after ion exchange. While the particle size of PPAD-BIE was 3580 nm, this value decreased after ion exchange and reached 190 nm in PPAD-AIE. This is due to the anions and cations removed from the dispersion. Anions and cations can affect the hydrodynamic diameter of PPAD particles (Fig. 3). There are reports in the literature that aggregate formation can increase with increasing ionic strength and large size ranges can be obtained, thus larger hydrodynamic diameters are achieved.33,34
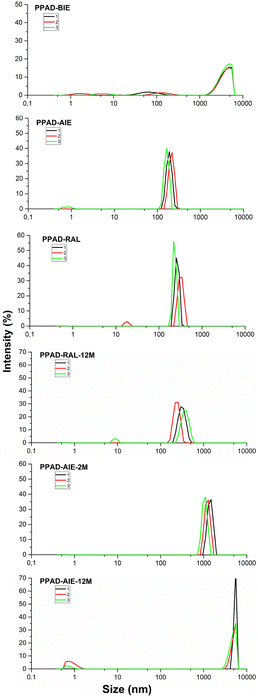 | ||
| Fig. 2 PPAD-BIE, PPAD-AIE, PPAD-RAL, PPAD-RAL-12M, PPAD-AIE-2M and PPAD-AIE-12M particle size results. | ||
As seen in Fig. 2, the particle size increased by 60–80 nm from 190 nm in the PPAD-AIE, to 255 nm in the PPAD-RAL. But compared to PPAD-2M which has a particle size of 1106 nm, the particle size was largely maintained within functional limits i.e. the optimum properties. Lyophilization appears to be a much more efficient method than keeping dispersions in aqueous form, although there is some increase in particle size compared to the non-lyophilized versions.
As can be understood from Fig. 2, when PPAD-RAL-12M and PPAD-RAL samples were compared, it was seen that the redispersing after the lyophilization process largely preserved the particle sizes even after 12 months. The particle sizes for PPAD-RAL and PPAD-RAL-12M samples are 255 nm and 295 nm, respectively.
In addition, when PPAD-AIE-2M and PPAD-AIE-12M samples were compared, the particle size of the sample kept at +5 °C without any intervention for 12 months (PPAD-AIE-12M) gradually increased. The particle sizes for PPAD-AIE-2M and PPAD-AIE-12M samples were 1106 nm and 4801 nm, respectively.
There are similar results for the PPAD-LiTFSI group, although there is an increase in size compared to the PPAD group (Fig. 4). It is observed that in PPAD-LiTFSI, there is a wider range of particle size distribution which are 190 nm, 396 nm and 5560 nm. In PPAD-LiTFSI-RAL, there is convergence on two close ranged areas which are 712 nm and 1106 nm and the particle size increases, but it is size efficient compared to PPAD-LiTFSI-2M which are 1484 nm and 2669 nm. Therefore, it can be interpreted that the lyophilization process tends to preserve the material particle size.
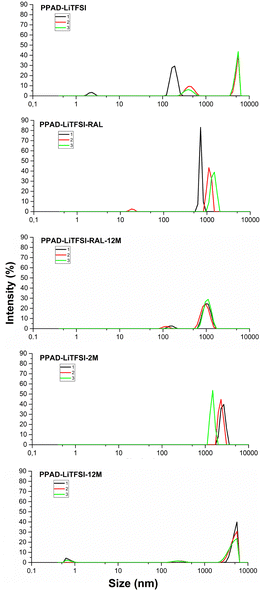 | ||
| Fig. 4 PPAD-LiTFSI, PPAD-LiTFSI-RAL, PPAD-LiTFSI-RAL-12M, PPAD-LiTFSI-2M and PPAD-LiTFSI-12M particle size results. | ||
Moreover, it is noteworthy that the size distribution around 4000 nm seen in the PPAD-LiTFSI sample is not seen in the LSR group. It can be interpreted that the reason for this is that mechanical mixing with the overhead stirrer reduces particle size.
The rotation of a mixing apparatus imparting mechanical energy to the solution can be used to separate the aggregate. The dispersion responds to such mechanical action and the flow of the medium produces shear stresses. Therefore, a suitable mixer with a high rotation speed, i.e. high rpm, can be used to produce dispersions with a smaller particle size.35
One study reported that the particle size decreased from 550 nm to 50 nm upon vortexing the PEDOT:PSS dispersion.36 Additionally, in another study, it was observed that by subjecting 2 different PEDOT:PSS dispersions to ultrasonication, the particle size decreased from 535 nm to 223 nm and from 427 nm to 210 nm, respectively.37 In another study, PEDOT:PSS particles with particle sizes of 20–25 nm, 70–85 nm and 650–970 nm became 25–35 nm and 350–460 nm, respectively, when samples were subjected to strong sonication. They also reported that particles with larger diameters disappeared in SEM images.38 Thus, it appears that mechanical interventions such as overhead stirring, ultrasonication, and vortexing can shorten polymer chains and reduce particle size.
As seen in Fig. 4, when PPAD-LiTFSI-RAL and PPAD-LiTFSI-RAL-12M samples were compared, it was seen that the redispersing after the lyophilization process largely preserved the particle sizes even after 12 months, nearly the same success as the PPAD group. The particle sizes for the PPAD-LiTFSI-RAL and PPAD-LiTFSI-RAL-12M samples are 712–1106 nm and 955–1106 nm, respectively.
In addition, when PPAD-LiTFSI-2M and PPAD-LiTFSI-12M samples were compared, the particle size of the sample kept at +5 °C without any intervention for 12 months gradually increased. The particle sizes of the PPAD-LiTFSI-2M and PPAD-LiTFSI-12M samples were 1484–2669 nm and 4801–5560 nm, respectively.
3.3. Zeta potential analysis
Zeta potential analyzes were crucial to examine the effects of ion exchange processes on dispersions and also to understand stabilities of the dispersions. It has been shown that moving the zeta potential away from 0 (in the − or + direction) causes a significant reduction in particle size and, as a result, good dispersibility in water due to the greater amount of PSS.15The only difference between PPAD-BIE and PPAD-AIE samples is the ion exchange process. As seen in Fig. 5, a large difference emerged in the zeta potential after ion exchange between PPAD-BIE (−29.7 mV and +12.5 mV) and PPAD-AIE (−59.5 mV). In general, materials with a zeta potential between −30 mV and +30 mV indicate that they have an unstable structure, while materials with a zeta potential higher than +30 mV or lower than −30 mV indicate that they have a stable structure.39
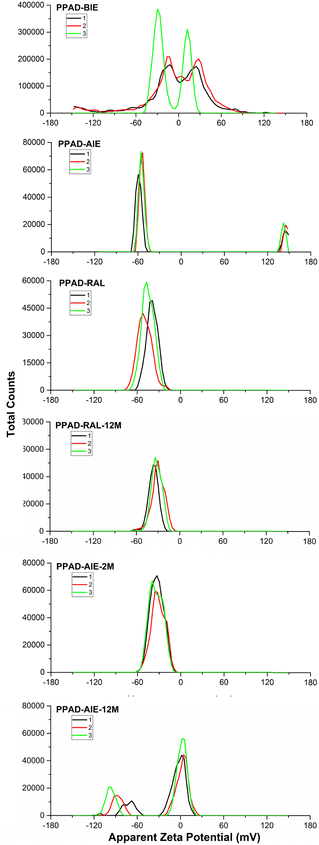 | ||
| Fig. 5 PPAD-BIE, PPAD-AIE, PPAD-RAL, PPAD-RAL-12M, PPAD-AIE-2M and PPAD-AIE-12M zeta potential results. | ||
The zeta potential with a high negative value indicates that a negatively charged PSS-rich layer covers the surface of PEDOT:PSS colloidal particles, which is responsible for the stability of the aqueous dispersions.15 It is reported in the literature that zeta potential measurements of PEDOT:PSS are affected by pH changes and that the negative value of zeta potential gradually increases as pH values increase from 2 to 7.40 Additionally, it has been observed that increasing the salt (NaCl) concentration reduces the PEDOT:PSS zeta potential.41 The strengthening of the zeta potential can be explained by the removal of Na+ ions from PPAD in the ion exchange process.
Zeta potential analysis results of PPAD-AIE, PPAD-RAL and PPAD-2M samples are compatible with the particle size results. Although the PEDOT:PSS zeta potential has different values in the literature, it has been observed to have a −mV value and matches the values obtained in our research.42,43 It is noteworthy that the potential of the RAL group decreased from −45 mV to −33 mV in the 2M group. It is evident that the potential begins to decrease as the particle size increases when size distribution and zeta potential graphs are compared. Based on these results, it can be interpreted that the effect of redispersion after lyophilization on PPAD is a much more efficient method compared to leaving it in the aqueous form.
As seen in Fig. 5, when PPAD-RAL-12M and PPAD-RAL samples were compared, it was seen that the redispersion after the lyophilization process largely preserved the zeta potential even after 12 months similar to the particle size distribution results. The zeta potentials for PPAD-RAL and PPAD-RAL-12M samples are −45 mV and −37 mV, respectively.
In addition, when PPAD-AIE-2M and PPAD-AIE-12M samples were compared, the zeta potential of the sample kept at +5 °C without any intervention for 12 months was destabilized. The zeta potentials for PPAD-AIE-2M and PPAD-AIE-12M samples were −33 mV and −8 mV, respectively. There are also peaks at −88 mV but this is most likely because the PPAD-AIE-12M sample is not stable and starts to aggregate.
It is seen that the redispersion process after lyophilization exhibits similar effects in the PPAD-LiTFSI group, and the potential value decreases from around −21 mV in the RAL sample to around −12 mV in the 2M sample. In the PPAD-LiTFSI group, there is fluctuation during measurement (zeta potential of PPAD-LiTFSI is −70 mV and +101 mV). This is thought to be due to the addition of LiTFSI. Specific ion adsorption, a special process that can change electrostatic particle interactions, can enable surface charge reversal, depending on the signs of the natural surface charge and the adsorbing ion. This process can lead to situations such as the sign reversal of the zeta potential induced by alkali metal cations such as Li+ and Na+.44 It is thought that this phenomenon causes both negative and positive potential measurements in the PPAD-LiTFSI sample.
As seen in Fig. 6, similar results were obtained in zeta potential measurements of PPAD-LiTFSI groups. When PPAD-LiTFSI-RAL and PPAD-LiTFSI-RAL-12M samples were compared, it can be said that the redispersing after the lyophilization process kept the material's zeta potential stable. The zeta potentials for the PPAD-LiTFSI-RAL and PPAD-LiTFSI-RAL-12M samples were −21 mV and −14 mV, respectively.
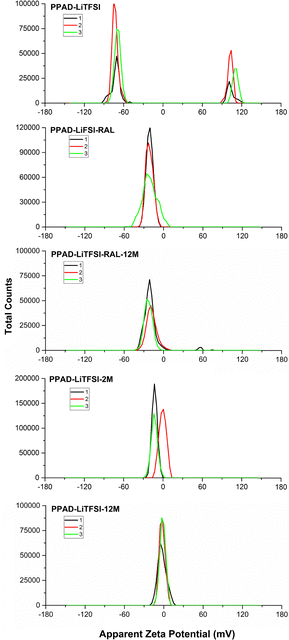 | ||
| Fig. 6 PPAD-LiTFSI, PPAD-LiTFSI-RAL, PPAD-LiTFSI-RAL-12M, PPAD-LiTFSI-2M and PPAD-LiTFSI-12M zeta potential results. | ||
In addition, when PPAD-LiTFSI-2M and PPAD-LiTFSI-12M samples were compared, the zeta potential of the sample kept at +5 °C without any intervention for 12 months decreased nearly to zero. The zeta potentials for the PPAD-LiTFSI-2M and PPAD-LiTFSI-12M samples were −12 mV and −3 mV, respectively.
3.4. pH measurements of aqueous dispersions
pH measurements of the synthesized PPAD before and after the ion exchange process can reveal that the dialysis membrane is a successful method for the ion exchange process. pH measurements before and after ion exchange for PPAD show that anion and cation exchanges change the pH value in aqueous dispersions from acidic to neutral.Studies on the pH of PPAD have revealed that the proton (H+) concentration in solution behaves as a function of polymer concentration. It has been shown that the acidity distribution (acid level) originates from PSS and may depend on the inversely proportional level of proton concentration due to the polyelectrolyte properties of the polymer. The more protons interact with the PSS chains, the more successfully the negative charges in the PSS backbone are balanced, and therefore the interaction between positively charged PEDOT and PSS is reduced. As a result, the planar PEDOT backbone is deformed more and electron transfer through PEDOT chains is made simpler and easier (increases conductivity). Less polymer concentration resulting from the use of less PSS and the resulting increased release of protons into the dispersion by PSS causes an increase in the electrostatic attraction between the negatively charged PSS chains and the positive PEDOT backbone. This electrostatic attraction can also change the planarity of the PEDOT backbone and reduce the intramolecular electron transfer capacity, i.e. conductivity, of the polymer.29
Due to the use of a high PSS ratio during synthesis, protons were more difficult to release from PSS chains, which increased the number of protons in the chains and increased the conductivity, while fewer protons were included in the dispersion and the number of protons released was reduced while the conductivity was kept high.
In addition, the known average pH of PPAD is between 1.6 and 1.7, and literature suggests that the reason synthesized PPAD has a low pH value (more acidic) is the sulfonic acid groups formed due to the use of higher PSS. A sudden increase in pH from 1.10 to 4.45 levels indicates the neutralization of acid groups by base groups.45
The reason for this pH increase is that the OH− ions released into the PPAD during the ion exchange process are more than the H+ ions, and these OH− ions combine with the H+ ions already in the PPAD and the newly added H+ ions to form water molecules, and therefore the pH value increases. In addition, the pH of PPAD-LiTFSI obtained by adding LiTFSI to ion-exchanged PPAD approached neutral.
As a result, the pH difference between PPAD-BIE and PPAD-AEI samples, where the only difference between them is the ion exchange process, was revealed as an indicator of the success of the ion exchange processes (Table 1).
| 1. Measurement | 2. Measurement | 3. Measurement | Average pH | |
|---|---|---|---|---|
| PPAD-BIE | 1.12 | 1.10 | 1.08 | 1.10 ± 0.02 |
| PPAD-AIE | 4.40 | 4.46 | 4.50 | 4.45 ± 0.05 |
| PPAD-LiTFSI | 5.52 | 5.53 | 5.55 | 5.53 ± 0.01 |
In addition, the pH change in PPAD and PPAD-LiTFSI groups as a result of the redispersion process after lyophilization was examined (Table 2).
| 1. Measurement | 2. Measurement | 3. Measurement | Average pH | |
|---|---|---|---|---|
| PPAD-RAL | 5.80 | 5.79 | 5.78 | 5.79 ± 0.009 |
| PPAD-LiTFSI-RAL | 5.60 | 5.62 | 5.63 | 5.61 ± 0.015 |
Within the scope of long-term stability tests, 12-month stored versions of PPAD-RAL, PPAD-AIE, PPAD-LiTFSI-RAL and PPAD-LiTFSI samples were studied. While the PPAD-RAL and PPAD-LiTFSI-RAL samples were stored in lyophilized form at −80 °C, the PPAD-AIE and PPAD-LiTFSI samples were stored as aqueous dispersions at +5 °C and were named PPAD-RAL-12M, PPAD-LiTFSI-RAL-12M, PPAD-AIE-12M and PPAD-LiTFSI-12M, respectively (Table 3).
| 1. Measurement | 2. Measurement | 3. Measurement | Average pH | |
|---|---|---|---|---|
| PPAD-RAL | 5.80 | 5.79 | 5.78 | 5.79 ± 0.009 |
| PPAD-RAL-12M | 5.48 | 5.46 | 5.46 | 5.46 ± 0.011 |
| PPAD-AIE | 4.40 | 4.46 | 4.50 | 4.45 ± 0.05 |
| PPAD-AIE-12M | 6.04 | 6.04 | 6.02 | 6.03 ± 0.011 |
| PPAD-LiTFSI-RAL | 5.60 | 5.62 | 5.63 | 5.61 ± 0.015 |
| PPAD-LiTFSI-RAL-12M | 5.38 | 5.42 | 5.36 | 5.38 ± 0.030 |
| PPAD-LiTFSI-12M | 5.79 | 5.81 | 5.82 | 5.80 ± 0.015 |
Finally, the final pH values after adding ethylene glycol at a ratio of 1![[thin space (1/6-em)]](https://www.rsc.org/images/entities/char_2009.gif) :
:![[thin space (1/6-em)]](https://www.rsc.org/images/entities/char_2009.gif) 5 by weight to the dispersions before the coating process are summarized in the table below (Table 4).
5 by weight to the dispersions before the coating process are summarized in the table below (Table 4).
| pH after synthesis | RAL pH | Final pH with EG addition | |
|---|---|---|---|
| PPAD-AIE | 4.45 ± 0.05 | 5.79 ± 0.009 | 7.28 ± 0.015 |
| PPAD-LiTFSI | 5.53 ± 0.01 | 5.61 ± 0.015 | 5.70 ± 0.011 |
After the last process, which is EG addition, the final product pH of the PPAD group was 7.28, while the final product pH of the PPAD-LiTFSI group was 5.70. This shows that PPAD-RAL-EG, the final product of the PPAD group, is within physiological pH limits, while PPAD-LiTFSI-RAL-EG is out of the pH limits. It was also observed that the 12-month storage process in RAL groups maintained the pH, although there was a slight decrease.
3.5. Imaging composite films with SEM
In the SEM images of the PPAD-PDMS sample, cracks that occur after stretching are seen primarily in the coatings on certain film surfaces. These cracks reduce the connections between the polymer coatings and in some areas completely break them off, thus causing a decrease in conductivity. Fig. 7A shows the cracks of the PPAD-RAL-EG and Fig. 7B shows the same area with increased magnification. In the enlarged image (Fig. 7B) of the cracks, the morphological differences between the crack walls of PDMS and PPAD polymers are clearly observable.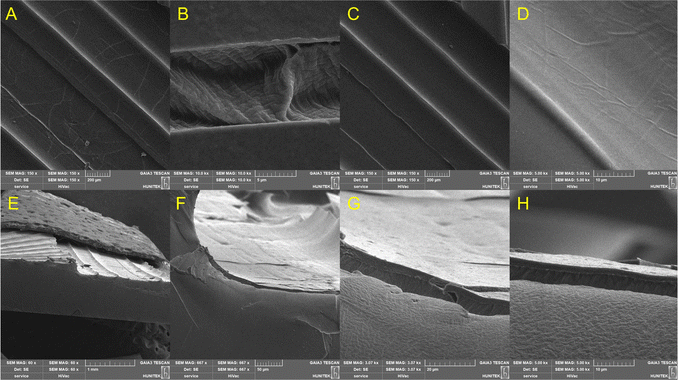 | ||
| Fig. 7 SEM images of the PPAD-RAL-EG-PDMS composite. (A)–(D) The top view. (E)–(H) The cross-sectional view. | ||
Fig. 7C and D show the undamaged coating surface after stretching on the same sample. Since the coating on the PDMS is very thin, the continuous and smooth structure of the PPAD-RAL-EG coating in Fig. 7D draws attention. This image shows that the coating has been successfully applied.
Fig. 7E–H are the cross-sectional images of the PPAD-RAL-EG-PDMS film. In these images, the smoothness of the PPAD coating is more clearly understood. In increased magnifications of the section, the continuous structure formed by the PPAD-RAL-EG thin film coating on the PDMS sample can be seen. In Fig. 7H, the light grey area below is the cut surface of the PDMS film. Morphologically, it matches the PDMS structure in other images. The dark grey section above the light grey region consists of two parts. The section below the dark grey area also belongs to the PDMS film and is also consistent with the morphology in other PDMS images. The upper horizontal part is the PPAD-RAL-EG coating itself and the morphological appearance of the coating matches the literature.46,47
Since the crack formation is chaotic and based on many factors, it cannot be predicted what size the cracks will be in which region. However, it can be said that the crack density, especially in the PPAD group, is not dominant throughout the sample. It is seen that the cracks that form are generally of similar width and therefore they are consistent.
Another important point is that cracks form in a direction perpendicular to the tensile axis. This causes new resistance centers to form along the film surface, causing an applied electric current to follow a new route of least resistance.
As seen in Fig. 8, which is the modified version of Fig. 7A, a total of 10 different regions were measured for crack width. The measurements are found as follows. Region 1 (14.43 μm), Region 2 (6.46 μm), Region 3 (5.81 μm), Region 4 (7.11 μm), Region 5 (9.48 μm), Region 6 (3.87 μm), Region 7 (7.32 μm), Region 8 (9.05 μm), Region 9 (8.62 μm) and Region 10 (4.74 μm).
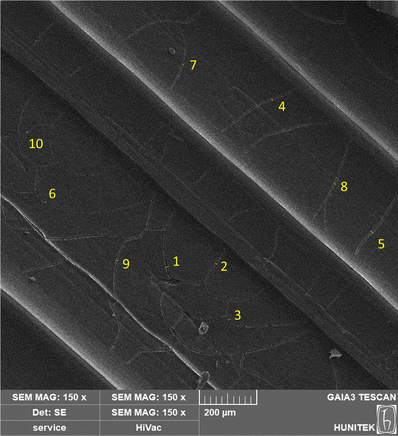 | ||
| Fig. 8 SEM image of PPAD-RAL-EG-PDMS composite cracks numbered (modified version of Fig. 7A). | ||
When the cracks in Fig. 8 are examined, it is seen that the largest crack does not exist except for a very small region and has a width of 14.43 μm (Region 1), while the smallest crack has a width of 3.87 μm (Region 6). The average crack width of 10 different regions was measured as 7.68 μm and the standard deviation was measured as 2.98 μm. When the largest crack, which is 14.43 μm wide, was excluded from the calculations by considering that it was observed in a single region, the average crack width was measured as 6.94 μm and the standard deviation was measured as 1.92 μm.
Lastly, considering the results of in vitro studies carried out for 14 days by seeding SH-SY5Y cells directly onto the films, it was observed that the possible coating separation from the film surface would not have a cytotoxic effect on the cells. The fact that the dispersion pH is within physiological limits also contributes greatly to biocompatibility. Furthermore, when the degradation test (ESI,† Fig. S6), pH change during the degradation test (ESI,† Fig. S7) and swelling test (ESI,† Fig. S8) analyses included in the ESI† document are examined, it is seen that the films are subject to very low levels of degradation, therefore, the pH change during this degradation is at very low levels, and values are still obtained between physiological pH limits, and the swelling behavior of the films is also very low.
This means, that even if some parts of the coating are detached from films which have very low levels of degradation, the residue released to the surrounding tissue would not cause cytotoxic effects.
In Fig. 9A–D, the cracked structure of the PPAD-LiTFSI-RAL-EG coating, which primarily appears in the coatings on the film surfaces, draws attention. Although these dense-looking structures do not show intense cracking after stretching due to the accumulation of the irregularly formed coating, they prevent the direct appearance of the PDMS surface and allow the conductive polymer structure, which is the continuation of the layer underneath, to be visible.
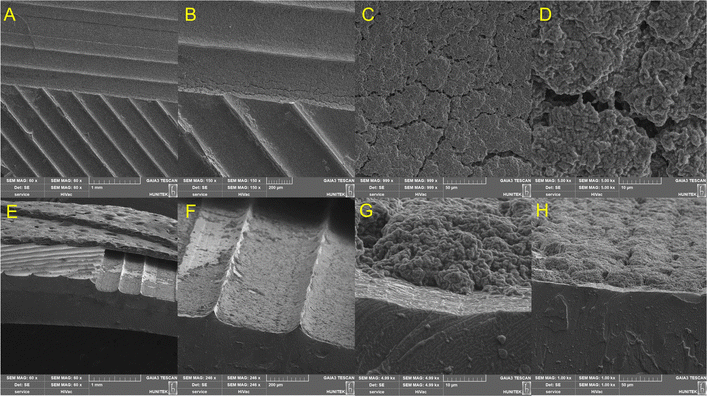 | ||
| Fig. 9 SEM images of the PPAD-LiTFSI-RAL-EG-PDMS composite. (A)–(D) The top view. (E)–(H) The cross-sectional view. | ||
The morphological appearance of the PPAD-LiTFSI polymer coating on PDMS matches the literature.48 In addition, according to Fig. 9E–H, it can be commented that the coating of the PPAD-LiTFSI-RAL-EG-PDMS composite could have been smoother. It should be taken into consideration that spin-coating parameters can be made more suitable for PPAD-LiTFSI, and also that different ratios of the amount of EG added and the amount of LiTFSI used in the initial synthesis may change the coating properties.
For the PPAD-LiTFSI group, the cracks are not as intense as in the PPAD group due to the coating being thick and not smooth. The cracks in this group have an intense morphology resulting from the flexing of the high-thickness PPAD-LiTFSI coatings stacked on top of each other. Therefore, the cracks in this group are chaotic and multi-directional when examined individually, but when examined collectively in terms of the general coating, they formed in a direction parallel to the tensile axis.
As understood from the thick coating and other characterizations, the conductivity is already low in the PPAD-LiTFSI group. The cracks can negatively affect the conductivity. In addition, as mentioned above, new resistance centers form along the film surface, causing an applied electric current to follow a new route of the least resistance pathway. In other words, the current will always prefer the path of least resistance.
The PPAD group, as seen in other characterizations, has much better film obtaining properties and a much smoother coating. Therefore, its conductivity is high. Again, for the PPAD group, the current will always prefer the path of lowest resistance. The formation of cracks may negatively affect the conductivity, but since the coating is generally smooth and the cracks have not spread over the surface, the conductivity of the PPAD group will be much more stable than the PPAD-LiTFSI group.
When PPAD-RAL-EG-PDMS and PPAD-LiTFSI-RAL-EG-PDMS films are compared, it is seen that PPAD-RAL-EG-PDMS exhibits a much better performance in all analyses (e.g. conductivity, coating quality, particle size disturbance, zeta potential, cell culture results). It can be commented that the PPAD group will show much more successful performance in the long term as well as in the short term, especially in cell adhesion and proliferation to the conductive polymer coating in the channels. Cell culture experiments for 14 days show that cells can adhere to the material and therefore proliferate on the surface. This is an expected outcome because the coating on the channels both interrupts the connection of the hydrophobic PDMS with the cells and provides a rough and appropriately hydrophilic surface to which the cells will likely adhere. Similar results were obtained for the PPAD-LiTFSI group, however, both Alamar Blue assay and fluorescence microscopy images show lower levels of cell proliferation. These results, as well as in other analyses in the manuscript, show that the coating quality and therefore cell adhesion and proliferation were much more successful in the PPAD group.
3.6. Coating thickness measurements with SEM
Coating thicknesses of PPAD-RAL-EG-PDMS and PPAD-LiTFSI-RAL-EG-PDMS composites were measured via SEM images. When Fig. 10 is examined, it is seen that the PPAD-RAL-EG-PDMS composite has the thinnest coating with an average thickness of 1.93 μm. In the literature, it is seen that different applications cause coatings with different thicknesses, from 0.006–0.268 μm49 to 12.9 μm.50 It can be interpreted that the obtained thickness is thicker than the spin-coating method, but thinner than the drop-casting (13.31 μm)51 method from the literature, as the thickness is obtained using both dipping and spin-coating, and has a relatively successful value. This result shows that the spin-coating process and the coating ability and stability of the dispersion are successful. Channel coating thickness measurements of PPAD-RAL-EG show that parallel results are obtained when compared with conductivity measurements, zeta analyses and other characterization results, and it is confirmed that it is the most efficient group.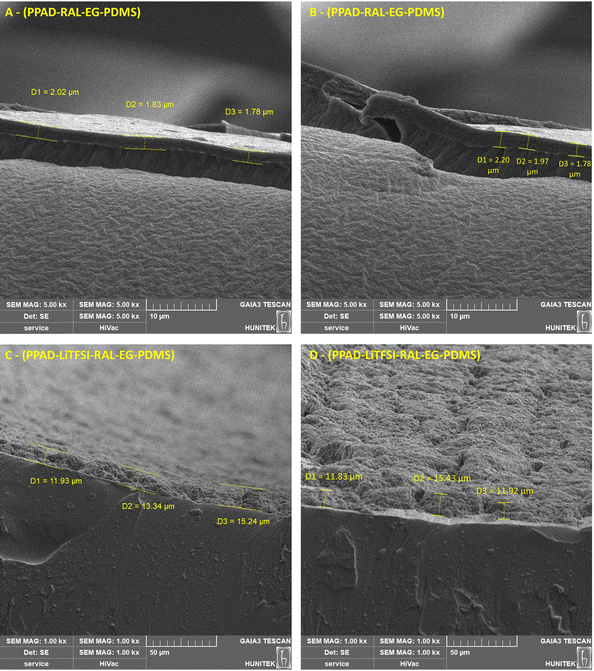 | ||
| Fig. 10 Coating thickness measurements (A) and (B) PPAD-RAL-EG-PDMS, and (C) and (D) PPAD-LiTFSI-RAL-EG-PDMS. | ||
Although the coating thickness of PPAD-LiTFSI-RAL-EG-PDMS also varies in the literature, the average coating thickness of the resulting composite is 13.28 μm, which is higher than the thickness of the drop-casting samples from the literature (11.10 μm).51 This shows that additional dipping and spin-coating optimizations specific to PPAD-LiTFSI-RAL-EG should be made in coating studies. As a solution to obtain thinner coatings, it is thought that the expected time can be increased after dipping the PDMS film in the dispersion to increase the interaction between the two polymers.
3.7. Conductivity and resistivity measurements
The effects of the samples kept for 2 months (2M), 12 months (12M), the redispersion process after lyophilization (RAL), and the EG addition (EG) on the resistivities and conductivities of the dispersions were studied on drop-cast samples. Due to the use of a high PSS ratio during synthesis, protons were more difficult to release from PSS chains, which increased the number of protons in the chains and increased the conductivity, while fewer protons were included in the dispersion and the number of protons released was reduced while the conductivity was kept high.29 According to resistivity measurements, it was seen that the EG addition reduced the resistivity values in PPAD-RAL and PPAD-LiTFSI-RAL samples. This shows the expected effect on the reduction of resistivity with EG addition.52,53Due to excessive PSS usage, protons are trapped in the PSS chains. This allows fewer protons to be released into the dispersion. As a result, the conductivity of PEDOT:PSS increases.
While obtaining the film from PEDOT:PSS, the water evaporates and the PEDOT:PSS complexes form a film layer and become insoluble. Meanwhile, some of the free PSS dissolved in the solvent becomes a liquid phase in the structure. When the film is completely dried, the free PSS separates from the PEDOT:PSS complexes and forms a kind of outer ring around the PEDOT:PSS film.54
When EG is added to PEDOT:PSS, EG enables the removal of free PSS from the polymer structure. This allows PEDOT to redistribute over the non-free PSS chains in the structure. By removing free PSS from the polymer, better bonding of the PEDOT-rich chains to each other is ensured.
The boiling point of EG is higher than that of water. Therefore, when EG is added to the PEDOT:PSS dispersion, a much slower evaporation occurs compared to water.
The increase in conductivity is closely related to the chemical structure of the solvent. Compounds with two or more polar groups are much more efficient conductivity enhancers. It is thought that the interactions between the dipoles of such solvents and the dipoles or charges of the polymer chains provide morphological change.55 EG has polar O–H groups and the polarity of EG causes its oxygen to be much more electronegative compared to its hydrogen. Therefore, the electron pair in the O–H bond is polarized towards the oxygen. As a result, the oxygen becomes partially negatively charged and the hydrogen becomes partially positively charged. Since opposite charges attract each other, this means that the EG molecules are attracted to each other and it becomes difficult for them to be separated from each other. The boiling point of EG increases due to this polarity.
Normally, PEDOT:PSS particles are surrounded by free PSS. However, the regions with PSS-rich chains swell after the addition of EG and the PEDOT-rich regions are more connected to each other by removing free PSS from the structure. Thus, a better connection is provided between the PEDOT-rich particles and a linear conformation is achieved.55
In addition, due to the proton retention of the non-free PSS in the chain structure, the conductivity is increased due to the better-connected PEDOT chains coming into contact with the high-proton PSS.
In the electrical characterization of the PPAD group, in addition to the samples in the other groups, the resistivity and conductivity measurements of the sample without ion exchange were performed. For the PPAD group lyophilization followed by redispersion when necessary and completing the final process before coating with the EG addition proved to be much more efficient, resulting in a higher conductivity than the rest of the samples. As can be seen from Fig. 11 and Fig. 12, long-term stability tests have also been completed. As seen in these tests, the PPAD-AIE-12M sample was kept in aqueous form for 12 months after synthesis, the PPAD-RAL-12M sample was lyophilized after synthesis and redispersed after 12 months, and the PPAD-RAL-EG-12M sample obtained by adding EG to the PPAD-RAL-12M before coating were studied.
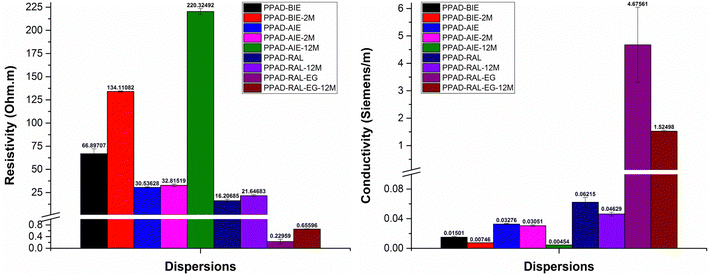 | ||
| Fig. 11 PPAD group's resistivity and conductivity measurements including PPAD-BIE, PPAD-BIE-2M, PPAD-AIE, PPAD-AIE-2M, PPAD-AIE-12M, PPAD-RAL, PPAD-RAL-12M, PPAD-RAL-EG and PPAD-RAL-EG-12M. | ||
There are several expected results of keeping samples in a lyophilized state for 12 months. The first of these is that the ability to obtain films may decrease due to the increase in the potential for aggregate formation while the materials are redispersed as the time they are kept in the lyophilized state increases.
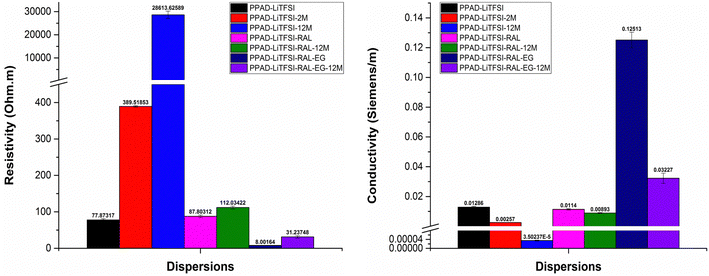
When the resistivity and conductivity results of the two groups that were kept in the lyophilized state for 12 months were examined, a 25.52% loss in conductivity was detected for the PPAD-RAL (0.06215 S m−1) and PPAD-RAL-12M (0.04629 S m−1) samples, while a 21.67% loss in conductivity was detected for the PPAD-LiTFSI-RAL (0.0114 S m−1) and PPAD-LiTFSI-RAL-12M (0.00893 S m−1) samples. Although the PPAD-RAL group lost 3.85% more conductivity compared to the PPAD-LiTFSI-RAL group, it is important that the PPAD-LiTFSI-RAL group has much lower conductivity in terms of conductivity values.
A comparison of the final samples obtained with EG addition to these groups was also made. While there was a 67.38% loss in conductivity for samples PPAD-RAL-EG (4.67561 S m−1) and PPAD-RAL-EG-12M (1.52498 S m−1), there was a 74.21% loss in conductivity for samples PPAD-LiTFSI-RAL-EG (0.12513 S m−1) and PPAD-LiTFSI-RAL-EG-12M (0.03227 S m−1). The PPAD-RAL-EG group lost 6.83% less conductivity compared to the PPAD-LiTFSI-RAL-EG group. In terms of conductivity values, again, it is important that the PPAD-LiTFSI-RAL group has much lower conductivity.
It is expected that the group with higher conductivity will lose more conductivity compared to the group with lower conductivity, because the increase in the conductivity difference means that greater losses may occur. However, it is crucial to understand that the conductivity of the PPAD group is still much higher than that of the PPAD-LiTFSI group.
Some loss in conductivity was already observed in the RAL-12M samples. It has been stated before that the reason for this is aggregate formation. As a result of the addition of EG to these 12M groups with aggregate formation, the conductivity could not be increased as much as in the samples that had no aggregate formation which are RAL samples.
In the electrical measurements of the RAL-12M groups, it was observed that the lyophilization process preserved the material properties even though they lost some of their properties and had better conductivity compared to the non-lyophilized groups. It was also observed that the EG additive provided higher conductivity to the PPAD-RAL-EG-12M (1.52498 S m−1) group compared to the other groups, except for the PPAD-RAL-EG (4.67561 S m−1) group.
Although there was a loss of conductivity in the PPAD-RAL-EG-12M (1.52498 S m−1) sample, its conductivity value is still above the minimum of 0.08–1.3 S m−1 required for use in nerve tissue, so it is still suitable for use as a potential neural conduit even after 12 months.
In addition, considering the conductivity loss of non-lyophilized groups, it was seen that the lyophilization process preserved the material properties despite some loss and therefore was essential. Otherwise, the material properties will be affected even more adversely.
Furthermore, it was observed that the PPAD-LiTFSI-12M group exhibited very high resistivity and therefore very low conductivity due to the fact that it was kept as an aqueous dispersion for 12 months after synthesis. In addition, even at high rpm in the redispersing processes in the PPAD-LiTFSI-RAL-12M and PPAD-LiTFSI-RAL-EG-12M groups, the aggregate formation was observed even macroscopically and smooth redispersing could not be obtained.
PPAD-RAL-EG, PPAD-RAL-EG-12M, PPAD-RAL, PPAD-RAL-12M, PPAD-AIE, PPAD-AIE-2M, PPAD-BIE, PPAD-BIE-2M and PPAD-AIE-12M dispersions have the lowest resistivity and therefore the highest conductivity, respectively, in line with the characterization of aqueous dispersions.
The PPAD-LiTFSI group showed similar results compared to the PPAD group. Lyophilization and then redispersing when necessary and completing the final process before coating with EG addition appears to be much more efficient and results in higher conductivity than those of the samples kept for 2 months, 12 months and the samples without ion exchange. PPAD-LiTFSI-RAL-EG, PPAD-LiTFSI-RAL-EG-12M, PPAD-LiTFSI, PPAD-LiTFSI-RAL, PPAD-LiTFSI-RAL-12M, PPAD-LiTFSI-2M and PPAD-LiTFSI-12M dispersions have the lowest resistivity and therefore the highest conductivity, respectively.
Considering the ultimate conductivity of conductive polymers, the most conductive polymer is PPAD-RAL-EG with 4.67561 S m−1 and the conductivity of PPAD-LiTFSI-RAL-EG is 0.12513 S m−1. When these values are examined, the most suitable polymer for use as a potential neural conduit is PPAD-RAL-EG, which also has the highest conductivity. PPAD-LiTFSI-RAL-EG can also be used as a potential neural conduit, but efficiency is expected to decrease since it has less conductivity and less pH compatibility compared to PPAD-RAL-EG.
Considering that the conductivity of nerve tissue is approximately in the range of 0.08–1.3 S m−1,56 the reason why the conductivity values of these 2 polymers are considered suitable for use in nerve tissue is that materials with conductivity similar to or higher than the conductivity value of nerve tissue could transmit electrical signals to neurons. This is due to nerve tissue transfer ability.57
3.8. Contact angle measurements
After each conductive polymer sample was drop-cast onto glass coverslips, contact angle measurements were performed on them. The reason why PDMS films coated with conductive polymers have not been studied is that the coatings in the channels of the insulating films are very thin and therefore water drops form an angle directly according to the hydrophobicity of the PDMS films. Contact angle measurements of insulating polymers were carried out directly on pure PDMS films. A surface with a contact angle of less than 90° is considered hydrophilic, and a surface with a contact angle of greater than 90° is considered hydrophobic.58Measurements of samples without and with EG additive were compared and it was seen that the addition slightly increased the coating hydrophobicity of the conductive polymers in the PPAD group. The reason for this may be that EG slows down the crystallization process as it evaporates from the surface after coating and provides better stacking of the conductive polymer chains.53 This decrease in hydrophilicity is related to the rearrangement of PSS chains and PEDOT particles being oriented and packed together to form a crystal structure, thus becoming more hydrophobic.59 There are reports in the literature that the contact angle increases with the EG addition.60 These results show that the contact angles of conductive polymers match the literature.
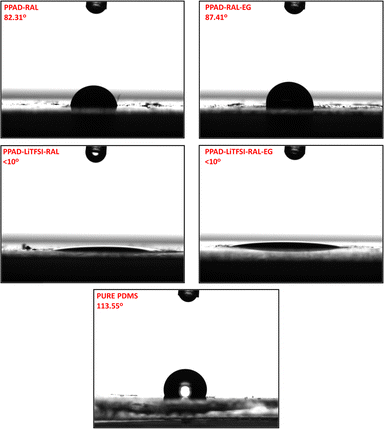
When the contact angle measurements of PPAD-RAL (82.31°) and PPAD-RAL-EG (87.41°) samples were compared (Fig. 13), it was observed that the EG addition had an increasing effect of 5.10°. In addition, it is seen that PPAD is characterized in the literature in the range of 78°–90° within the standard deviations in contact angle measurements61 and the results are compatible with the literature.
Furthermore, the same EG effect is seen in PPAD-LiTFSI-RAL (<10°) and PPAD-LiTFSI-RAL-EG (<10°) samples. The high hydrophilicity of LiTFSI can be shown as the reason why LiTFSI-added samples are so hydrophilic.62
Efficient results matching the literature were also obtained in pure PDMS samples. The PDMS contact angle was measured at 113.55°, above the hydrophobicity limit. In the literature, there are ranges where the contact angle of PDMS is reported from 105° to 122° according to different applications.63,64
3.9. In vitro cytocompatibility analysis
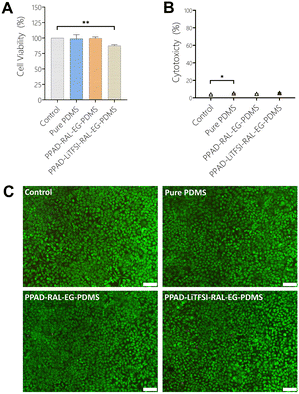
When the MTT analysis results with L929 cells (Fig. 14A) were examined, it was seen that Pure PDMS (98.88%) and PPAD-RAL-EG-PDMS (98.9%) had the most cell viability, while PPAD-LiTFSI-RAL-EG-PDMS (87.47%) had slightly less cell viability compared to them. However, it was revealed that all films had cell viability above 90%, and as a result, they did not have a cytotoxic effect. It has already been reported in the literature that PEDOT doped with PSS, fibrinogen or hyaluronic acid is not cytotoxic in cell culture.65 There are also reports in the literature proving that there is no correlation between higher elution concentration for PPAD and lower viability of cells.66 These results are a good indication that the composite film coatings are non-toxic. In addition, PDMS has already been well studied in the literature and is known to be non-cytotoxic.67According to the LDH test results with L929 cells (Fig. 14B), Pure PDMS (5.1%) and PPAD-RAL-EG-PDMS (4.5%) were found to have less cytotoxicity compared to PPAD-LiTFSI-RAL-EG-PDMS (5.6%). However, it was revealed that both PPAD-RAL-EG-PDMS and PPAD-LiTFSI-RAL-EG-PDMS had cytotoxicity below 10%, and they had slight necrotic effects. It has been reported in the literature that PDMS has high cell metabolic activity and low LDH release activity.68
In Fig. 14C, in which L929 cells used for PPAD-RAL-EG-PDMS and PPAD-LiTFSI-RAL-EG-PDMS are examined, almost no red-stained cells are visible and almost all of the cells are seen to be alive (green) and having the appropriate morphology. These images show that both PPAD-RAL-EG-PDMS and PPAD-LiTFSI-RAL-EG-PDMS films are biocompatible. As shown in the LDH and MTT analysis, the biocompatibility of PDMS-based composite films was found to be high and cell viability was proven by fluorescence microscopy images.
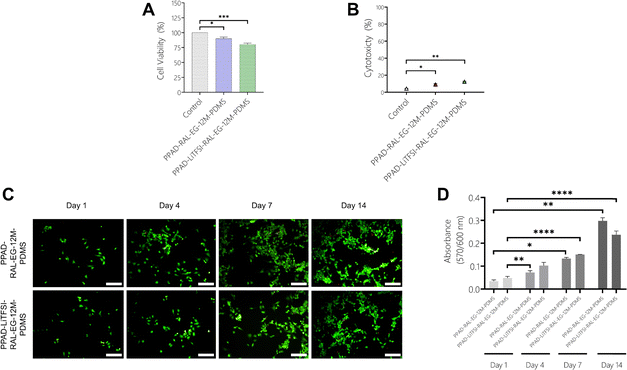
In the MTT test using SH-SY5Y cells (Fig. 15A), cell viability was obtained as 100% for control, 89% for PPAD-RAL-EG-12M-PDMS and 80% for PPAD-LiTFSI-RAL-EG-12M-PDMS. Cell viability drops from 98.9% in PPAD-RAL-EG-PDMS to 89% in PPAD-RAL-EG-12M-PDMS, which is just below the 90% limit. Cell viability drops from 87.47% in PPAD-LiTFSI-RAL-EG-PDMS to 80% in PPAD-LiTFSI-RAL-EG-12M-PDMS. The reason for this decrease in cell viability of the two groups is again the different effects of the 12-month waiting periods on the groups.
In the LDH test using SH-SY5Y cells (Fig. 15B), cytotoxicity was obtained as 4.31% for the control, 9.21% for PPAD-RAL-EG-12M-PDMS and 12.34% for PPAD-LiTFSI-RAL-EG-12M-PDMS. PPAD-RAL-EG-12M-PDMS appears to be more biocompatible than PPAD-LiTFSI-RAL-EG-12M-PDMS with cytotoxicity below 10%. As mentioned in previous analyses, the 12-month waiting period of the PPAD-LiTFSI-RAL-EG-12M-PDMS group is thought to be responsible for this increased cytotoxicity due to the decrease in coating quality, particle aggregation and more unstable pH. A slight increase in cytotoxicity was also observed in the PPAD-RAL-EG-12M-PDMS group in comparison to the LDH test made with L929 cells, but as mentioned in previous analyses, this group appears to be less affected by the 12-month waiting period.
Fluorescence microscopy images (Fig. 15C) of PPAD-RAL-EG-12M-PDMS and PPAD-LiTFSI-RAL-EG-12M-PDMS films using SH-SY5Y cells show that the cells proliferate proportionally throughout the 14-day analysis and the cell density increases on both films.
The results obtained from the Alamar Blue assay (Fig. 15D) show that there is a constant increase in the fluorescence intensity of both PPAD-RAL-EG-12M-PDMS and PPAD-LiTFSI-RAL-EG-12M-PDMS groups, indicating that the number of cells increases on the materials. The increase in absorbance values proves that the metabolic activity of the cells increases in direct proportion to time, indicating that the films do not have toxic effects on the cells.
4. Conclusion
After PEDOT:PSS aqueous dispersion synthesis, the unwanted ions (iron and sodium) formed during the synthesis were removed with ion exchange resins, thus reducing the particle size from 3580 nm to 190 nm, strengthening the zeta potential from −29.7 mV and +12.5 mV to −59.5 mV, and increasing the metabolic suitability by bringing the pH value closer to neutral (from 1.10 to 4.45). In addition, the shelf life has been successfully extended by lyophilizing the aqueous dispersion to prevent potential aggregation problems and use it when necessary by redispersing it with deionized water, thereby preserving its properties to a great extent. In addition, pH measurements show that the salt content in the dispersions decreases with the removal of ions and the dispersions move from acidic to neutral due to the formation of water molecules by ion exchange resins. The importance of lyophilization is that by freezing the polymer very quickly and drying it in this state, aggregate formation is prevented and thus the shelf life of the polymer can be extended to a much longer period while preserving its properties. For example, when PPAD and PPAD kept for 12 months were compared, their properties such as particle size, pH, conductivity and zeta potential were 255 nm and 295 nm, 5.79 and 5.46, 4.67561 S m−1 and 1.52498 S m−1, and −45 mV and −37 mV, respectively. Lyophilized polymers can be used when necessary and therefore unnecessary consumption of consumables and chemicals can be avoided. It has been observed that the lyophilization and redispersion process preserves the product properties to a great extent.Considering the samples kept for 12 months, it can be seen that the PPAD-RAL-EG-PDMS film, which initially exhibited high performance, was able to maintain its properties at a good level despite experiencing various downgrading after 12 months. This provides us with the information that lyophilization is crucial to extend the shelf life of aqueous dispersions while preserving their reusability.
By considering all characterization studies, the most efficient and optimum group among the studied groups emerges as PPAD-LSR-EG-PDMS. Thus, a modified, flexible PPAD-LSR-EG-PDMS composite film as a potential neural conduit, which is compatible with the literature, has high conductivity and high biocompatibility suitable for peripheral nerve injuries, has been successfully produced.
In conclusion, with the PDMS composite coated with PEDOT:PSS that was produced and modified, we have presented an improvable, potential new platform that can be used to connect the proximal and distal nerve endings resulting from nerve injuries, and demonstrated its safety in vitro.
Data availability
The data used in this article have been included in the ESI.†Conflicts of interest
There are no conflicts to declare.Acknowledgements
We would like to specially thank Bogac Kilicarslan for his help with the SEM measurements, FTIR analysis and 3D printer and thank Dr Soner Cakmak for his help with the coating device (rotating disk). The authors also would like to acknowledge the support provided by Turkish Scientific and Research Council (TÜBİTAK) 1004 - Center of Excellence Support Prog - High Technology Platforms in Priority Fields (Project number: 22AG004, Next Generation Biomaterial Technologies Research Network for Healthy Life).References
- X. Gu, Front. Med., 2015, 9, 401–411 CrossRef PubMed.
- X. Gu, F. Ding and D. F. Williams, Biomaterials, 2014, 35, 6143–6156 CrossRef CAS PubMed.
- V. Chiono and C. Tonda-Turo, Prog. Neurobiol., 2015, 131, 87, DOI:10.1016/j.pneurobio.2015.06.001.
- P. Meena, A. Kakkar, M. Kumar, N. Khatri, R. K. Nagar, A. Singh, P. Malhotra, M. Shukla, S. K. Saraswat, S. Srivastava, R. Datt and S. Pandey, J. Cell Tissue Res., 2021, 383(2), 617, DOI:10.1007/s00441-020-03301-x.
- J. Moskow, B. Ferrigno, N. Mistry, D. Jaiswal, K. Bulsara, S. Rudraiah and S. G. Kumbar, Bioact. Mater., 2019, 4, 107, DOI:10.1016/j.bioactmat.2018.09.001.
- H. Cao, T. Liu and S. Y. Chew, Adv. Drug Delivery Rev., 2009, 61, 1055–1064 CrossRef CAS PubMed.
- X. Zhang, W. Qu, D. Li, K. Shi, R. Li, Y. Han, E. Jin, J. Ding and X. Chen, Adv. Mater. Interfaces, 2020, 7(14), 2000225, DOI:10.1002/admi.202000225.
- R. Green and M. R. Abidian, Adv. Mater., 2015, 27(46), 7620, DOI:10.1002/adma.201501810.
- S. C. Luo, E. M. Ali, N. C. Tansil, H. H. Yu, S. Gao, E. A. B. Kantchev and J. Y. Ying, Langmuir, 2008, 24, 8071–8077 CrossRef CAS PubMed.
- A. Sanchez-Sanchez, I. del Agua, G. G. Malliaras and D. Mecerreyes, Smart Polymers and Their Applications, Elsevier, 2019, pp. 191–218 Search PubMed.
- N. Sultana, H. C. Chang, S. Jefferson and D. E. Daniels, J. Pharm. Invest., 2020, 50, 437, DOI:10.1007/s40005-020-00485-w.
- D. Kai, M. P. Prabhakaran, G. Jin and S. Ramakrishna, J. Biomed. Mater. Res., Part A, 2011, 99, 376–385 CrossRef PubMed.
- Y. Wen and J. Xu, J. Polym. Sci., Part A: Polym. Chem., 2017, 55(7), 1121, DOI:10.1002/pola.28482.
- T. W. Lee and Y. Chung, Adv. Funct. Mater., 2008, 18, 2246–2252 CrossRef CAS.
- T. Horii, H. Hikawa, M. Katsunuma and H. Okuzaki, Polymer, 2018, 140, 33–38 CrossRef CAS.
- Y. Wang, C. Zhu, R. Pfattner, H. Yan, L. Jin, S. Chen, F. Molina-Lopez, F. Lissel, J. Liu, N. I. Rabiah, Z. Chen, J. W. Chung, C. Linder, M. F. Toney, B. Murmann and Z. Bao, Sci. Adv., 2017, 1–10 CrossRef.
- S. Han, S. Chen and F. Jiao, Compos. Commun., 2021, 28, 100914, DOI:10.1016/j.coco.2021.100914.
- S. B. Abel, E. Frontera, D. Acevedo and C. A. Barbero, Polymers, 2023, 15(1), 205, DOI:10.3390/polym15010205.
- M. Uz and S. K. Mallapragada, J. Indian Inst. Sci., 2019, 99, 489–510 CrossRef.
- S. Torino, B. Corrado, M. Iodice and G. Coppola, Inventions, 2018, 3(3), 65, DOI:10.3390/inventions3030065.
- A. Bernard, E. Delamarche, H. Schmid, B. Michel, H. R. Bosshard and H. Biebuyck, ACS J. Surf. Colloids, 1998, 14(9), 2225–2229, DOI:10.1021/la980037l.
- E. Leclerc, Y. Sakai and T. Fujii, Biomed. Microdevices, 2003, 5, 109 CrossRef CAS.
- N. Sahu and S. Panigrahi, Indian J. Phys., 2009, 83, 493 CrossRef CAS.
- T. Mosmann, J. Immunol. Methods, 1983, 65, 55 CrossRef CAS PubMed.
- I. Keranov, T. G. Vladkova, M. Minchev, A. Kostadinova, G. Altankov and P. Dineff, J. Appl. Polym. Sci., 2009, 111, 2637–2646 CrossRef CAS.
- M. M. Khoobi, H. Naddaf, E. Hoveizi and T. Mohammadi, J. Biomed. Mater. Res., Part A, 2020, 108, 1944–1954 CrossRef CAS PubMed.
- S. H. Chung, D. H. Kim, H. Kim, H. Kim and S. W. Jeong, Mater. Today Commun., 2020, 23 DOI:10.1016/j.mtcomm.2019.100867.
- H. Shi, C. Liu, Q. Jiang and J. Xu, Adv. Electron. Mater., 2015, 1, 1500017 CrossRef.
- O. P. Dimitriev, Y. P. Piryatinski and A. A. Pud, J. Phys. Chem. B, 2011, 115, 1357–1362 Search PubMed.
- A. W. M. Diah, J. P. Quirino, W. Belcher and C. I. Holdsworth, Electrophoresis, 2014, 35, 1976–1983 CrossRef CAS PubMed.
- B. Somboonsub, M. A. Invernale, S. Thongyai, P. Praserthdam, D. A. Scola and G. A. Sotzing, Polymer, 2010, 51, 1231–1236 CrossRef CAS.
- S. B. Rauer, D. J. Bell, P. Jain, K. Rahimi, D. Felder, J. Linkhorst and M. Wessling, Adv. Mater. Technol., 2022, 7(1), 2100836, DOI:10.1002/admt.202100836.
- J. Jiang, G. Oberdörster and P. Biswas, J. Nanopart. Res., 2009, 11, 77–89 CrossRef CAS.
- R. Tian, G. Yang, H. Li, X. Gao, X. Liu, H. Zhu and Y. Tang, Phys. Chem. Chem. Phys., 2014, 16, 8828–8836 RSC.
- K. Sukchol, S. Thongyai, P. Praserthdam and G. A. Sotzing, Microelectron. Eng., 2013, 111, 7–13 Search PubMed.
- R. P. Raja Ashok, M. S. Thomas and S. Varughese, Soft Matter, 2015, 11, 8441–8451 RSC.
- S. Zhang, Z. Yu, P. Li, B. Li, F. H. Isikgor, D. Du, K. Sun, Y. Xia and J. Ouyang, Org. Electron., 2016, 32, 149–156 CrossRef.
- R. Gangopadhyay, B. Das and M. R. Molla, RSC Adv., 2014, 4, 43912–43920 RSC.
- P. Singh, A. Raman and N. Kumar, Silicon, 2020, 12(8), 1769–1777, DOI:10.1007/s12633-019-00284-5.
- N. A. Chopan and H. T. N. Chishti, Int. J. Environ. Anal. Chem., 2022, 104(9), 2148–2164, DOI:10.1080/03067319.2022.2059365.
- E. Montibon, L. Järnström and M. Lestelius, Cellulose, 2009, 16, 807–815 CrossRef CAS.
- M. Horikawa, T. Fujiki, T. Shirosaki, N. Ryu, H. Sakurai, S. Nagaoka and H. Ihara, J. Mater. Chem. C, 2015, 3, 8881–8887 RSC.
- J. Štulík, R. Polanský, A. Hamáček, S. Nešpůrek, P. Slepička, Z. Kolská and V. Švorčík, Sens. Actuators, B, 2018, 275, 359–366 CrossRef.
- Y. Zhang, A. Narayanan, F. Mugele, M. A. Cohen Stuart and M. H. G. Duits, Colloids Surf., A, 2016, 489, 461–468 Search PubMed.
- Y. Mochizuki, T. Horii and H. Okuzaki, Effect of pH on Structure and Conductivity of PEDOT/PSS, Trans. Mater. Res. Soc. Jpn., 2012, 37, 307 Search PubMed.
- M. Namkoong, H. Guo, M. S. Rahman, D. Wang, C. J. Pfeil, S. Hager and L. Tian, npj Flexible Electron., 2022, 6, 41, DOI:10.1038/s41528-022-00170-y.
- A. Closson, H. Richards, Z. Xu, C. Jin, L. Dong and J. X. J. Zhang, IEEE Sens. J., 2021, 21, 26277–26285 CAS.
- C. K. Lee and Y. J. Park, ACS Appl. Mater. Interfaces, 2016, 8, 8561–8567 CrossRef CAS PubMed.
- F. Zabihi, Y. Xie, S. Gao and M. Eslamian, Appl. Surf. Sci., 2015, 338, 163–177 CrossRef CAS.
- T. Stöcker, A. Köhler and R. Moos, J. Polym. Sci., Part B: Polym. Phys., 2012, 50, 976–983 CrossRef.
- X. Li, Z. Liu, Z. Zhou, H. Gao, G. Liang, D. Rauber, C. W. M. Kay and P. Zhang, ACS Appl. Polym. Mater., 2021, 3, 98–103 CrossRef CAS.
- G. H. Kim, L. Shao, K. Zhang and K. P. Pipe, Nat. Mater., 2013, 12, 719–723 CrossRef CAS PubMed.
- G. Prunet, F. Pawula, G. Fleury, E. Cloutet, A. J. Robinson, G. Hadziioannou and A. Pakdel, Mater. Today Phys., 2021, 18, 100402, DOI:10.1016/j.mtphys.2021.100402.
- L. Ouyang, C. Musumeci, M. J. Jafari, T. Ederth and O. Inganäs, ACS Appl. Mater. Interfaces, 2015, 7, 19764–19773 CrossRef CAS PubMed.
- M. N. Gueye, A. Carella, J. Faure-Vincent, R. Demadrille and J.-P. Simonato, Prog. Mater. Sci., 2020, 108, 100616 CrossRef CAS.
- P. Zarrintaj, S. Manouchehri, Z. Ahmadi, M. R. Saeb, A. M. Urbanska, D. L. Kaplan and M. Mozafari, Carbohydr. Polym., 2018, 187, 6610, DOI:10.1016/j.carbpol.2018.01.060.
- A. Saberi, F. Jabbari, P. Zarrintaj, M. R. Saeb and M. Mozafari, Biomolecules, 2019, 9(9), 448, DOI:10.3390/biom9090448.
- C. Li, J. Zhang, J. Han and B. Yao, Sci. Rep., 2021, 11(1), 459, DOI:10.1038/s41598-020-80729-9.
- M. Getnet Tadesse, C. Loghin, Y. Chen, L. Wang, D. Catalin and V. Nierstrasz, Smart Mater. Struct., 2017, 26(6), 065016, DOI:10.1088/1361-665X/aa6f25.
- T. M. Huang, S. Batra, J. Hu, T. Miyoshi and M. Cakmak, Polymer, 2013, 54, 6455–6462 CrossRef CAS.
- C. Duc, A. Vlandas, G. G. Malliaras and V. Senez, Soft Matter, 2016, 12, 5146–5153 RSC.
- B. Tan, S. R. Raga, A. S. R. Chesman, S. O. Fürer, F. Zheng, D. P. McMeekin, L. Jiang, W. Mao, X. Lin, X. Wen, J. Lu, Y. B. Cheng and U. Bach, Adv. Energy Mater., 2019, 9, 1901519, DOI:10.1002/aenm.201901519.
- A. Chiolerio, P. Rivolo, S. Porro, S. Stassi, S. Ricciardi, P. Mandracci, G. Canavese, K. Bejtka and C. F. Pirri, RSC Adv., 2014, 4, 51477–51485 RSC.
- M. T. Khorasani, H. Mirzadeh and Z. Kermani, Appl. Surf. Sci., 2005, 242, 339–345 CrossRef CAS.
- A. R. Harris and G. G. Wallace, Adv. Funct. Mater., 2018, 28(12), 1700587, DOI:10.1002/adfm.201700587.
- M. Asplund, E. Thaning, J. Lundberg, A. C. Sandberg-Nordqvist, B. Kostyszyn, O. Inganäs and H. Von Holst, Biomed. Mater., 2009, 4(4), 045009, DOI:10.1088/1748-6041/4/4/045009.
- D. S. Lee, S. J. Kim, J. H. Sohn, I. G. Kim, S. W. Kim, D. W. Sohn, J. H. Kim and B. Choi, Chin. J. Polym. Sci., 2012, 30, 242–249 CrossRef CAS.
- E. Pedraza, M. M. Coronel, C. A. Fraker, C. Ricordi and C. L. Stabler, Proc. Natl. Acad. Sci. U. S. A., 2012, 109, 4245–4250 CrossRef CAS PubMed.
Footnote |
| † Electronic supplementary information (ESI) available. See DOI: https://doi.org/10.1039/d4ma01205d |
| This journal is © The Royal Society of Chemistry 2025 |

