DOI:
10.1039/D4MR00091A
(Paper)
RSC Mechanochem., 2025, Advance Article
Scaling theory for the kinetics of mechanochemical reactions with convective flow†
Received
13th August 2024
, Accepted 1st December 2024
First published on 7th December 2024
Abstract
Deep understanding of reaction kinetics in mechanochemical conditions is crucial to further advance this field of solid-state chemistry. However, a formidable challenge owing to the complexity of these systems, in particular the kinetic effects of mechanical stress, makes this problem very complex. In this study, we developed a scaling theory to understand the kinetics of mechanochemical reactions by considering convective flows driven by applied mechanical stress, with the assumption that the product behaves as a fluid with the applied mechanical stress in a ball mill. This theory predicts that the rates of mechanochemical reactions are regulated by the dissolution of reactants in the product-rich phase formed between two reactants, and that mechanical force-induced convective flows enhance reaction rates by reducing the thickness of the product-rich phase. This scaling model provides a fundamental approach to understanding the effect of mechanical stress on mechanochemical organic reactions in ball milling.
Introduction
Recently, mechanochemical organic synthesis using ball milling has attracted significant attention as it provides a more efficient, energy-saving, and environmentally-friendly alternative to conventional solution-based approaches using organic solvents. In this approach, strong mechanical agitation by ball milling grinds the reactants, reagents and catalysts, resulting in highly efficient mechanochemical organic reactions (Fig. 1a). Synthetic chemists have demonstrated that many organic reactions can be performed efficiently under mechanochemical conditions using ball milling.1–13 Often, stronger mechanical inputs accelerate these reactions.14 However, the effects of mechanical force on microscopic (molecular) and macroscopic (solid-particle) processes under mechanochemical reaction conditions are not well understood.15 To further advance the field of mechanochemical synthesis, a theoretical understanding of the force-dependent reaction kinetics in mechanochemical organic transformations is crucial.
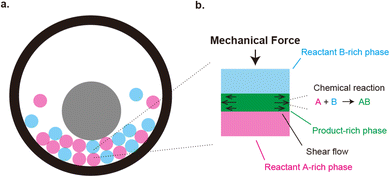 |
| | Fig. 1 (a) Geometry of mechanochemical synthesis by ball milling. Reactants (magenta and cyan) and a metal ball (gray) are placed in a chamber. The synthesis is performed by shaking the chamber. Mechanical forces are applied to the reactants due to the collision between the ball and reactants and/or between reactants. (b). Mechanochemical reactions happen at the interface between the reactants. This produces the product-rich phase (green) at the interface between the two reactant solids (cyan and magenta). A small volume of solvent added to the system acts as plasticizer of the product-rich phase. The applied mechanical stress drives shear flow in the product-rich phase. | |
To understand the effects of mechanical force on reaction kinetics, a separate discussion of the microscale processes at the molecular level and the macroscale processes in the physical mixing of a reaction mixture is important.15 At the molecular level, the applied mechanical force can directly activate the starting materials and catalysts, thereby decreasing the required activation energy of the reactions. It is probably the case of the reaction of polymeric compounds, where macroscopic mechanical stresses can be transmitted due to their large size (∼10–100 nm).15–21 In contrast, how the mechanical force activates the reactions of small molecules remains unclear,14 except in a single molecule type experimental system designed to apply mechanical force to a pair of reactant molecules by using cantilever22 or simply by applying mechanical stress to crystals.23,24
In the ball-milling reaction of small molecules, the mechanical force can also affect the macroscale mixing processes and accelerate mechanochemical reactions.14,25,26 The molecular dynamics simulations have revealed that the plasticity of the colliding solid reactant particles probably play a key role in the mixing of reactants.25,26 This may be somewhat analogous to early molecular dynamics simulations that showed that the mechanical force larger than the critical loading is necessary to adhere two solid particles.27,28 However, these molecular dynamics simulations treat the mixing of reactant molecules at the early time scale before mechanochemical reactions occur. Mechanochemical reactions lead to the formation of a product-rich phase at the interface between the two reactant-rich solid phases (Fig. 1b). We have recently shown that the kinetics of mechanochemical reactions is regulated by the dissolution of the reactant molecules into the product-rich phase.29 Interestingly, the addition of a small volume of solvent often increases the reactivity of solid reactants.30 This is probably because the solvent wets the surfaces of reactant solids and acts as plasticizer of the product-rich phase produced there. If it is the case, the applied mechanical force drives the plastic convective flows in the product-rich phase (Fig. 1b). Motivated by these insights, we formulate a scaling theory for the kinetics of mechanochemical reactions by considering the convective flows as well as the diffusive flows (fluxes) of reactant and product molecules.
The convective flows are average motion of molecules driven by applied stress (via the development of the gradient of hydrostatic pressure), while the diffusive flows (fluxes) are relative motion of different molecular species driven by concentration gradient (via the development of the gradient of osmotic pressure).31 Our theory predicts that for cases in which the reaction is diffusion-limited, the convective flows accelerate the reaction. This is because the convective flows decrease the thickness of the product-rich phase and thus increase the concentration gradient of the reactants, accelerating the diffusive flow of reactants. In contrast, for cases in which the reaction is rate-limited, where the reaction rate is determined by the local concentration (rather than the concentration gradient) of the reactants, the convective flows do not accelerate the reaction. This is because the convective flows do not change the local concentration of the reactants.
Mechanochemical reaction without convection
We previously reported a detailed calculation of the reaction kinetics of solid reactants without applied mechanical force.29 We here reformulate it in a simple scaling theory. This theory predicts the kinetics of the chemical reaction A + B → AB between reactant molecules A and B, which form distinct solid phases at the initial condition, see Fig. 2a. We set the coordinate system, in which the x–y plane (z = 0) is located at the interface between A and B at the initial condition and thus the z axis is normal to this interface. The reaction system is characterized by the volume fractions of reactant A, ψA(z), reactant B, ψB(z), and product AB, ψAB(z). The volume fraction ψB(z) of the reactant B is defined aswhere cB and vB are the concentration and volume of reactant B, respectively. The volume fractions, ψA(z) and ψAB(z), are defined in similar manners. For simplicity, we treat cases in which (1) the thermodynamic properties, such as the volume per molecule, melting point, latent heat, heat capacity, as well as the diffusion constant of the reactants A and B are symmetric; (2) the reaction is diffusion-limited; (3) the system is incompressible, ψA(z) + ψB(z) + ψAB(z) = 1; (4) the volume per product AB molecule is the sum of the volume per molecule of A and B; and (5) the changes in the volume per molecule upon phase transition and mixing are negligible. With these assumptions, (1) the volume fractions of A and B are symmetric with respect to the x–y plane, and (2) reactant A does not penetrate the B-rich region (z > 0) and vice versa, see Fig. 2b. We thus analyze only the volume fraction ψB(z) of the reactant B in z > 0, where the volume fraction of the product is 1 − ψB(z) because of the incompressibility of the system. The incompressibility condition approximately represents the fact that the system is filled with reactants and products, in contrast to the reactions in a dilute solution. This treatment neglects small changes of volume per molecule by applied force due to the elastic deformation of solids.
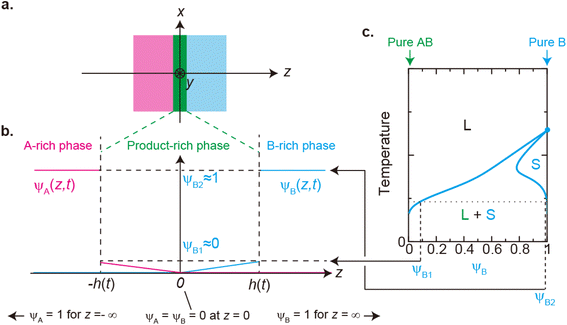 |
| | Fig. 2 (a) Coordinate system set at the interface between the reactants A and B. The x–y plane (z = 0) is set at the middle of the layer of the product-rich phase (green) where the reactant–reactant interface was located at the initial condition. The z-axis is normal to the interface. (b) Volume fraction profile of A (magenta) and B (cyan). The volume fraction of B is symmetric with the volume fraction of A at z = 0. (c) Miscibility phase diagram of B and product AB [reproduced from Fig. 4a in ref. 29]. The region labeled as L + S is delineated by the binodal lines (cyan lines). In this region, the system is separated into a liquid region with the volume fraction ψB1 and a solid region with the volume fraction ψB2: the values of the volume fraction of reactant B at the temperature. The binodal lines cross with the line of ψB = 1 at the melting temperature. The system is a uniform liquid in the region labeled as “L” and is a uniform solid in the region labeled as “S”. We treat the low temperature, at which the values of the volume fraction at the binodal lines are ψB1 ≈ 0 and ψB2 ≈ 1. | |
The chemical reaction occurs at the interface between the A-rich and B-rich phases. A product-rich phase is thus produced between these reactant-rich phases. For cases in which the reactant B and the product AB do not form a eutectic, the product molecules are excluded from the B-rich phase to stabilize their solid state, see also Fig. 2c. The volume fraction ψB of reactant B thus cannot take the values between the two binodal values ψB1 and ψB2 (phase separation), see Fig. 2b.31,32 The volume fraction ψB follows the diffusion equation31
| |
 | (2) |
where Π(
ψB) is the osmotic pressure.
kB is the Boltzmann constant and
T is the absolute temperature. The boundary conditions to impose the solution of
eqn (2) are (1)
ψB = 0 at
z = 0, because the reaction is diffusion-limited, and (2)
ψB = 1 for
z → ∞.
Eqn (2) implies that the osmotic pressure Π(
ψB), rather than the volume fraction
ψB, are continuous across the system. Because of the instability of phase separation discussed above, the volume fraction
ψB jumps between
ψB1 and
ψB2, see
Fig. 2b.
29,33,34 The consistency of the jump and
eqn (2) is also discussed in Sec. S1 in ESI.
† Indeed, the osmotic pressure is equal at the two binodal values,
ψB1 and
ψB2, and this ensures the continuity of the osmotic pressure as well as the continuity of the chemical potential (local equilibrium). The jump in the volume fraction
ψB defines the interface between the product-rich and reactant-rich phases and the position
z =
h(
t) of this interface.
In the limit of low temperature, the two binodal values have asymptotic limits ψB1 ≈ 0 and ψB2 ≈ 1. In the product-rich phase, 0 < z < h(t), the volume fraction ψB is thus much smaller than unity and the osmotic pressure follows the van't Hoff's law,  . The diffusive flux
  represented by the volume of B molecules passing through a unit area per unit time, is proportional to the concentration gradient (volume fraction gradient) of these molecules
| |
 | (3) |
where we assumed that the volume fraction profile is approximately linear. The reactant B molecules are transported from the interface between the reactant B-rich and product-rich phases. The volume fractions at the reactant–product interface are fixed at the binodal values
ψB1 (≈0) and
ψB2 (≈1), the position
h(
t) of the reactant–product interface shifts as the number of B molecules decreases due to flux
| |
 | (4) |
From
eqn (3) and
(4), the position
h(
t) of the reactant–product interface can be derived in the form
| |
 | (5) |
In diffusion-limited reactions, the reaction rate S (defined by the volume of products produced per unit time and unit area) is equal to the flux of reactant molecules, S = −JB. By using eqn (3) and (5), the reaction rate is derived as the form
| |
 | (6) |
with
| |
 | (7) |
Eqn (6) and
(7) are indeed equal to the asymptotic form of the reaction rate derived by using the mean field theory.
29 Eqn (6) predicts that the rate of reactions between solid reactants is smaller than the rate of reactions between liquid reactants by the factor of
α, see also the solid and broken black lines in
Fig. 3.
ψB1 is the volume fraction of reactant molecules dissolved in the product-rich phase, implying that the mechanochemical reactions of solid reactants are regulated by the dissolution of reactants in the product-rich phase, see the solid lines in
Fig. 3. The rate of reactions between the solid reactants decreases with time because the thickness
h(
t) of the product-rich phase increases with time, which decreases the concentration gradient of the reactant molecules, see
eqn (3) and
(5).
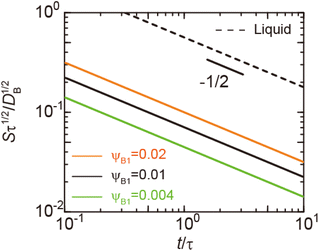 |
| | Fig. 3 Reaction rate S, defined by the volume of products produced per unit time and unit area (at the reactant–reactant interface, z = 0), as a function of time as evaluated using eqn (6) and (7) (double logarithm). The calculations were performed for the volume fraction ψB1 = 0.004 (green), 0.01 (solid black), and 0.02 (orange). The broken black line is the reaction rate for cases in which both reactants and products are liquid. We rescaled time t with a rescaling factor τ to make both axes dimensionless although there is no characteristic time scale, see eqn (6). The rescaling factor τ is arbitrary and acts as the unit of time. This treatment is consistent because the reaction rate S is also rescaled by τ−1/2. The short black line indicates the slope of −1/2. | |
Mechanochemical reaction with convection
Now we consider the contribution of the mechanical stress σ⊥, applied by balls in the direction normal to the interface, as an extension of the scaling theory developed in the previous section. We use a cylindrical coordinate system, with which the position in the system is represented by the radial coordinate r, the azimuthal angle ϕ, and z, see Fig. 4. The cross section normal to the z-axis is assumed to be circular with radius r0, which corresponds to the grain size of A and B. We treat cases in which the length scale of the system in the radial direction is larger than the thickness of the product-rich phase, r0 ≫ h(t). The thin film geometry of the system allows us to decouple the force balance in the lateral and normal directions. The applied mechanical stress is balanced with the hydrostatic pressure and the gradient of hydrostatic pressure drives convective shear flow in the product-rich phase (the lubrication approximation).31,32 The details of the lubrication approximation is also summarized in Sec. S2 in the ESI.† The convective flow in the product-rich phase can be analyzed by the Stokes equation:| |
 | (8) |
which represents the balance of the forces due to the hydrostatic pressure p(r) and the forces due to the mechanical stress. The hydrostatic pressure p(r) is determined by the incompressibility condition:| |
 | (9) |
where vr and vz are the r- and z-components of the velocity field, respectively. The boundary conditions for solving eqn (8) and (9) are vr = 0 and vz = −V(t) at z = h(t) (the non-slipping boundary condition)31,32 and  and vz = 0 at z = 0 (because of the symmetry of the system). This approach is effective for the time scale in which the thickness of the product-rich phase becomes larger than the molecular length scale.
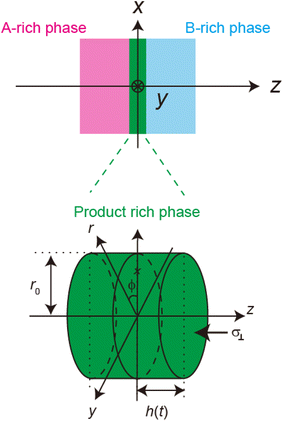 |
| | Fig. 4 Cylindrical coordinate system used to represent the velocity field in the product-rich phase. The plane z = 0 is located at the middle of the product-rich phase, where the interface between the reactants A and B is located at the initial condition. The reactant–reactant interface is assumed to be circular with radius r0, which corresponds to the grain size of A and B. The mechanical stress σ⊥ is applied normal to the interface. | |
The constitutive relationship between the stress σrz and the velocity field depends on the rheological properties of the reactants and products. For simplicity, we treat the reactant-rich solid phase as a rigid-body and the product-rich phase as a viscous fluid with the scale of the mechanical stress applied by the balls. The latter assumption is motivated by the fact that a small volume of solvent added to the system can act as a plasticizer for the product-rich phase.33 In such cases, the deformation of the reactant-rich phase is negligible and eqn (8) and (9) are only effective in the product-rich phase, 0 < z < h(t), where
| |
 | (10) |
where
ηAB is the viscosity of the product-rich phase. Because the volume fraction of solvent added to the system as well as that of the reactants are small, we assume that the solvent only acts as a plasticizer of the product, but the viscosity of the product-rich phase is mostly determined by the product.
By using eqn (8)–(10) with the forementioned boundary conditions, the velocity field is derived in the forms
| |
 | (11) |
| |
 | (12) |
(
Fig. 5). The boundary condition,
vz = −
V(
t) at
z =
h(
t), leads to the form
| |
 | (13) |
where
V(
t) is the time evolution of the thickness
h(
t) of the product-rich phase due to the applied mechanical stress. By integrating
eqn (13), the hydrostatic pressure
p(
r) is derived in the form
| |
 | (14) |
The hydrostatic pressure of the product-rich phase is balanced with the applied mechanical stress
σ⊥,
| |
 | (15) |
Eqn (15) represents the time evolution
V(
t) of the thickness of the product-rich phase with the applied mechanical stress
σ⊥.
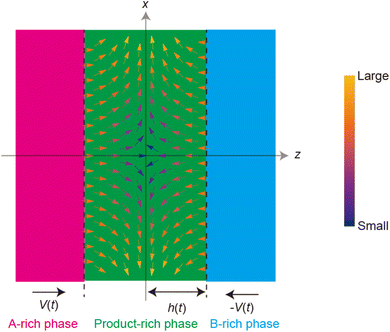 |
| | Fig. 5 Vector plot of the velocity field in the product-rich phase, see eqn (11) and (12). The direction of the arrows represents the direction of the flow at the position and the color of the arrows represents the magnitude of the flow (see the legend). | |
With the contribution of the applied mechanical stress, the time evolution of the thickness h(t) of the product-rich phase has the form
| |
 | (16) |
For constant applied mechanical stress
σ⊥, by using
eqn (16), the thickness
h(
t) is derived as follows (
Fig. 6a):
| |
 | (17) |
where
| |
 | (18) |
| |
 | (19) |
The scale
σ0 of the mechanical stress applied by the balls has the form
| |
 | (20) |
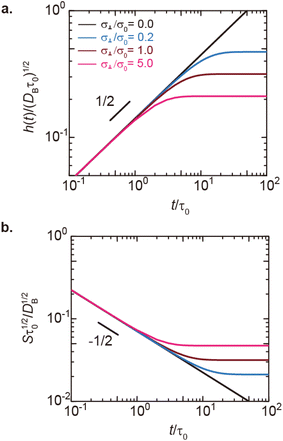 |
| | Fig. 6 (a) Thickness h(t) of the product-rich phase and (b) reaction rate S(t) as functions of time, as evaluated by using eqn (17) and (21), respectively (double logarithm). The numerical calculations were performed for σ⊥/σ0 = 0.0 (black), 0.2 (cyan), 1.0 (brown), and 5.0 (magenta) and for the volume fraction ψB1 = 0.01. The time scale τ0 (=r02/DB) was used to rescale time and reaction rate in dimensionless values. The short black line in (a) and (b) indicates the slopes of 1/2 and −1/2, respectively. | |
The reaction rate is equal to the flux of reactant molecules, S = −JB, and thus has the form
| |
 | (21) |
with
| |
 | (22) |
see
Fig. 6b and
7. The dissolution of the reactant molecules into the product-rich phase and the contribution of the applied mechanical stress are taken into account in
eqn (22) via ψB1 and
σ⊥, respectively.
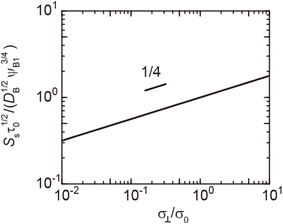 |
| | Fig. 7 Reaction rate Ss for the steady state as a function of the applied mechanical stress σ⊥/σ0, as evaluated using eqn (20). The short black line indicates the slop of 1/4. | |
In the short time scale, t < τs, eqn (21) has an asymptotic form, which is equal to eqn (6). This implies that the applied mechanical stress σ⊥ does not accelerate the mechanochemical reaction in this time scale, see Fig. 6b. In the long time scale, t > τs, the reaction rate is constant, S = Ss. In contrast to the case without applied mechanical stress, the reaction rate continues to decrease with time, see the black and brown lines in Fig. 6b. The constant reaction rate results from the fact that the diffusive flux JB of reactant B is balanced by the convection flow V(t) in this time scale. This keeps the thickness of the product-rich phase constant, h(t) = hs, see Fig. 6a. The time scale τs of the crossover decreases with increasing applied mechanical stress σ⊥, see eqn (19). The reaction rate Ss at the steady state thus increases with applied mechanical stress σ⊥, see the cyan, brown, and magenta lines in Fig. 6.
Our theory predicts that the convective flows decrease the thickness of the product-rich phase and thus increase the concentration gradient of the reactants. One may wonder where the mass in the product-rich phase has gone. The flow field in the product-rich phase is directed in the radial direction, see Fig. 5 and eqn (11). The mass in the product-rich phase is flown out from the region between the reactant A- and B-rich phases, 0 < r < r0. The volume of molecules flown out from this region per unit time is
| |
 | (23) |
which is indeed equal to the volume of molecules that decrease in the region per unit time, the second term of
eqn (16) multiplied by the area π
r02 of the region. Our theory thus is effective for cases in which the chamber has enough space so that molecules in the product-rich phase can flown out.
Contribution of convective flows and dissolution to rate-limited reactions
Finally, we consider whether convective flows accelerate mechanochemical reactions for cases in which the reactions are rate-limited. In the case of rate-limited reactions, the volume fraction is uniform in the reactant- and product-rich phases and is given by the equilibrium condition, in which the osmotic pressure as well as the chemical potentials of each of the reactants are uniform over the entire system, see Fig. 8. If the reactant-rich phase is a rigid-body solid and the product-rich phase is a viscous liquid, as was assumed in the previous section, the applied mechanical stress drives the convective flows in the product-rich phase. However, because the composition of the product-rich phase is uniform, the convective flows do not change the volume fraction and thus do not affect the reaction rate.
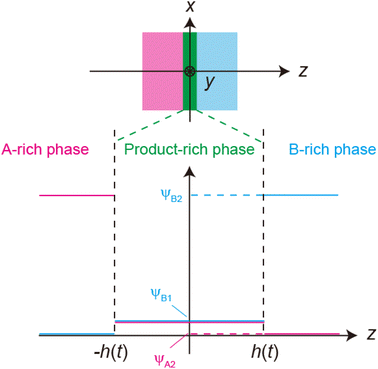 |
| | Fig. 8 Volume fraction profile for the case of rate-limited reactions. | |
Because the convective flows do not affect the reaction rate in the rate-limited regime, we here analyze the reaction rate for σ⊥ = 0. The time evolution of the thickness h(t) of the product-rich phase is given by the form
| |
 | (24) |
The right-hand side of
eqn (24) is the reaction rate
S, defined as the volume of converted reactant B per unit time. The first and second terms in the right side of
eqn (24) are the reaction rates in the product-rich and two reactant-rich phases, respectively.
k is the rate constant.
L0 is the system size.
ψA1 and
ψB1 are the volume fractions of reactant A and B in the product-rich phase, respectively (
ψA1 =
ψB1 due to the assumed symmetry of reactants).
ψB2 (≈1) and
ψA2 are the volume fractions of reactant A and B in the reactant B-rich phase, respectively.
Eqn (24) is effective only for
h(
t) <
L, where the product-rich phase coexists with the reactant-rich phases. For the case of
h(
t) =
L0, the product-rich phase no longer coexists with the reactant-rich phases and thus the mechanochemical reaction follows simple second-order kinetics,
| |
 | (25) |
The right-hand side of
eqn (25) is the reaction rate
S for
h(
t) =
L0.
Eqn (24) leads to the thickness h(t) in the form
| |
 | (26) |
for
t <
τc and
h(
t) =
L for
t >
τc. The crossover time
τc is derived as
| |
 | (27) |
by using the limiting condition of the coexistence,
h(
τc) =
L0. The reaction rate is derived as
| |
 | (28) |
for
t <
τc, and
| |
 | (29) |
for
t >
τc.
Eqn (28) is derived by substituting
eqn (26) into the right-hand side of
eqn (24). To derive
eqn (29), we first derive the volume fraction
ψAB of the products by solving
eqn (25) with the incompressibility condition,
ψA +
ψB +
ψAB = 1, and the symmetry
ψA =
ψB of reactants, and then substitute the result into the right-hand side of
eqn (25).
Eqn (28) and (29) predict that the reaction rate S decreases with time for cases in which the volume fraction ψA1 of reactants is very small, ψB1 < ψA21/2 (blue line in Fig. 9). In contrast, for cases in which the volume fraction ψA1 is relatively large, ψB1 > ψA21/2, the reaction rate S increases with time for t < τc and then decreases steeply for t > τc (red line in Fig. 9). Therefore, the kinetics of the mechanochemical reactions change dramatically depending on the volume fractions of reactant molecules dissolved into the product-rich phases, ψB1 and ψA1, and the other reactant-rich phase ψA2, see Fig. 9.
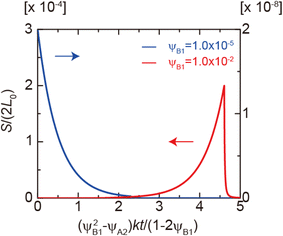 |
| | Fig. 9 Reaction rate as functions of time t for ψB1 = 1.0 × 10⁻² (red lines) and 1.0 × 10⁻⁵ (blue lines) in the rate-limited regime. The volume fraction ψA2 was fixed at 1.0 × 10⁻⁸. We used eqn (28) and (29) for the calculations. | |
Discussion
We have constructed a scaling theory of the kinetics of mechanochemical reactions by taking into account the convection driven by the applied mechanical stress in an extension of our previous theory of mechanochemical reactions.29 The latter theory predicts that a product-rich phase is produced between the reactant-rich phases and that the increase in the product-rich phase governs the time evolution of the reaction rate. Our theory predicts that the applied mechanical stress accelerates the mechanochemical reaction by suppressing the increase in the thickness of the product-rich phase for cases in which the reaction is diffusion-limited, see Fig. 10. The acceleration does not happen for cases in which the mechanochemical reaction is rate-limited because the volume fraction is uniform in the product-rich phase. Although we treated cases in which the reactant-rich phase is a rigid-body and the product-rich phase is a viscous fluid, eqn (8) can be used to study the dependence of the reaction rate on the rheological properties of these materials if the constitutive relationship between the shear stress σrz and the strain rate (or strain) for the reactants and products are determined. When both reactants and products are viscous fluids, the convective flow driven by the applied mechanical stress accelerates the mechanochemical reaction by increasing the area of the interface at which the reaction occurs. However, we do not treat such a case here because it is a widely known effect.
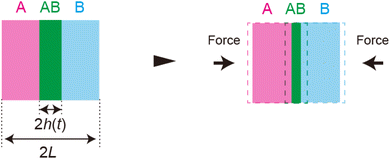 |
| | Fig. 10 Applied mechanical force decreases the thickness of the product-rich phase, which enhances the fluxes of reactants. | |
For simplicity, we studied the reactions in two asymptotic regimes—diffusion- and rate-limited reactions. It is instructive to discuss the conditions under which such asymptotic reactions happen. In general, the time evolution of the volume fraction is determined by both diffusion and reaction:
| |
 | (30) |
In the diffusion-limited regime, the first term in
eqn (30) (diffusion) is smaller than that of the second term (reaction rate) for −
h(
t) <
z <
h(
t). This condition is satisfied if

, where we used

and
kψAψB ≈
kψA1ψB1, see the orange area in
Fig. 11. In the rate-limited reaction, the entire system is at the thermodynamic equilibrium and thus (i)
ψA =
ψA1 for 0 <
z <
h(
t) and (ii)
ψA =
ψA2 for
z >
h(
t), see
Fig. 8. The first condition corresponds to cases in which the first term in
eqn (30) is larger than the second term for 0 <
z <
h(
t) and thus is satisfied for

. To evaluate the second condition, we derive the volume fraction of reactant A in the reactant B-rich phase,
| |
 | (31) |
by solving
eqn (30) with
ψB ≈ 1 for
z >
h(
t) and
ψA =
ψA2 at
z =
h(
t). The equilibrium condition
ψA =
ψA2 is satisfied for the entire reactant-rich phase,
z >
h(
t), when the size of the reactant-rich phase
L(
t) −
h(
t) is relatively small,

, see the purple area in
Fig. 11.
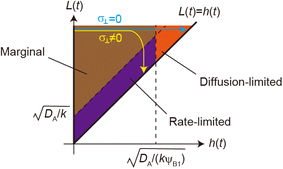 |
| | Fig. 11 The diagram of reaction regimes with respect to the thickness of the product-rich phase h(t) and the size of the system L(t). The reaction is diffusion-limited for  (orange) and rate-limited for (orange) and rate-limited for  and and  (purple). There is a marginal regime for (purple). There is a marginal regime for  and and  (brown). The entire system is converted to the product at h(t) = L. The trajectory of the system is shown for σ⊥ = 0 (light blue) and σ⊥ ≠ 0 (yellow) schematically. (brown). The entire system is converted to the product at h(t) = L. The trajectory of the system is shown for σ⊥ = 0 (light blue) and σ⊥ ≠ 0 (yellow) schematically. | |
The above regime analysis implies that our asymptotic analysis does not cover the case in which  and
and  , see the brown area in Fig. 11. In this marginal regime, the product-rich phase is at the thermodynamic equilibrium, while the reactant A penetrates the B-rich phase only by the distance
  , see eqn (31). The kinetic equation of the reaction thus has the form:
| |
 | (32) |
where the right side of
eqn (32) is the reaction rate
S. By solving
eqn (29), the reaction rate is derived as the form
| |
 | (33) |
where we used the symmetry of the reactants,
ψA1 =
ψB1, and
ψB2 ≈ 1.
Eqn (33) implies that the reaction rate increases with time, regardless of the extent of the dissolution of the reactants into the product-rich phase, in contrast to the rate-limited reaction regime, see also
eqn (28).
The above argument showed that the reaction regime is determined by the thickness h(t) of the product-rich phase and the thickness of the system L(t), see Fig. 11. Without the applied mechanical stress, the thickness h(t) of the product-rich phase increased with time, while the thickness of the system L(t) is constant L0. If the thickness L(t) is relatively large, the reaction starts from the marginal regime and shows crossover to the diffusion-limited regime, see the light blue line in Fig. 11. With the convective flow driven by the applied mechanical stress σ⊥, the thickness h(t) of the product-rich phase increases with time, while the size L(t) of the system decreases with time
| |
 | (34) |
This implies that if the mechanical stress that drives the convective flow is relatively large, the reaction crossovers to the rate-limited regime, instead of the diffusion-limited regime, see the yellow line in Fig. 11. The convective flow can accelerate mechanochemical reactions also by converting the crossover of regimes.
The characteristic stress σ0 and time τs are important quantity predicted by our theory, see eqn (19) and (20). By using experimental parameters shown in Table 1, the characteristic stress σ0 is estimated as 8 × 10⁻⁸ Pa, which is much smaller than estimated value of applied stress, 1 kPa. This implies that the effect of the applied stress is significant. The ratio τs/ηAB of the time scale to the viscosity ηAB is estimated as 0.2 Pa−1. This implies that even when the viscosity of the product-rich phase is as large as 5, the time scale τs is reasonably small ∼1 s. Mechanical forces are applied many times during an experiment. The effect of mechanical forces is additive because the reaction rate depends only on the thickness of the product-rich phase, see eqn (16). The reaction acceleration is probably effective if the experimental time scale is larger than the time scale τs.
Table 1 Estimated values of parameters used in our theory. The diffusion constant was estimated using the Stokes–Einstein relationship DB = kBT/(6πηABa), where the molecular size a of B is estimated to be 1 nm. The applied mechanical stress was estimated by the displacement (4 cm) and frequency (30 Hz) of oscillation as well as the diameter (7 mm) and the mass (1.6 g) of the balls used in typical experiments. We used the value of the dissolved volume fraction ψB1 of biphenyl estimated in our previous study22
| Symbol |
Meaning |
Values |
| DBηAB |
Thermal force |
2 × 10⁻¹³ [N] |
| σ⊥ |
Applied mechanical stress |
1 [kPa] |
| r0 |
Reactant grain size |
1 [mm] |
| ψB1 |
Reactant volume fraction |
2 × 10⁻⁵ |
Our present theory is by no means complete because a couple of mechanical effects are not taken into account in this theory: first, solid reactants and catalysts are ground by applied mechanical stress. This increases the area of the interface at which the mechanochemical reaction occurs. The physics behind the breaking of solid reactants during the kneading process is very different from that of our present theory, and its contribution to the kinetics of the mechanochemical reaction will be discussed elsewhere. Second, the shear stress applied to the solid components in the system modulates the stability of the solid state of these components. When the stress σ⊥ is applied normal to the interface between the reactant-rich and product-rich phases, the shear stress generated by the convective flows is
| |
 | (35) |
see
eqn (11), which is small for cases in which the aspect ratio
h/
r0 of the system is small. Third, the incompressibility condition is only an approximation, particularly for solids. The state equations of the reactants and products, and thus additional assumptions, are necessary to treat the finite compressibility. Evaluating the compressive and shear stresses is worth studying in the future to bridge the gap between the macroscopic experimental parameters and the molecular-level understanding of the reactions. Forth, the forces are applied to the reactants and products by the oscillation of balls. The viscoelasticity and/or inertia may be significant depending on the materials properties of reactants and products and can be taken into account in an extension of our theory. Finally, recent simulations showed that the anisotropy due to the crystal surfaces plays an important role in the mixing of reactants.
26 Our present scaling theory provides an important step to understand the mechanism of the force-driven acceleration of mechanochemical reactions using ball milling.
Data availability
All the results are given by equations in this manuscript. Figures were the plots of these equations.
Author contributions
All the authors conceived the study and wrote/revised the manuscript. T. Y. constructed the theoretical model and performed calculations.
Conflicts of interest
There are no conflicts to declare.
Acknowledgements
This work was supported by JSPS KAKENHI Grant Number 24H00453 (K. K.), 24H01832 (K. K.), 24H01050 (K. K.), 22K18333 (H. I.), 22H00318 (H. I.), by JST CREST Grant Number JPMJCR19R1 (H. I.), and by JST FORREST Grant Number JPMJFR201I (K. K.) and JPMJFR2221 (Y. H.). The Institute for Chemical Reaction Design and Discovery (ICReDD), which has been established by the World Premier International Research Initiative (WPI), MEXT, Japan.
References
- S. L. James, C. J. Adams, C. Bolm, D. Braga, P. Collier, T. Friščić, F. Grepioni, K. D. M. Harris, G. Hyett, W. Jones, A. Krebs, J. Mack, L. Maini, A. G. Orpen, I. P. Parkin, W. C. Shearouse, J. W. Steed and D. C. Waddell, Mechanochemistry: opportunities for new and cleaner synthesis, Chem. Soc. Rev., 2012, 41, 413–447 RSC.
- G.-W. Wang, Mechanochemical organic synthesis, Chem. Soc. Rev., 2013, 42, 7668–7700 RSC.
- J.-L. Do and T. Friščić, Mechanochemistry: A Force of Synthesis, ACS Cent. Sci., 2017, 3, 13–19 CrossRef CAS PubMed.
- J. G. Hernández and C. Bolm, Altering Product Selectivity by Mechanochemistry, J. Org. Chem., 2017, 82, 4007–4019 CrossRef PubMed.
- T.-X. Métro, J. Martinez and F. Lamaty, 1,1’-Carbonyldiimidazole and Mechanochemistry: A Shining Green Combination, ACS Sustainable Chem. Eng., 2017, 5, 9599–9602 CrossRef.
- T. K. Achar, A. Bose and P. Mal, Mechanochemical synthesis of small organic molecules, Beilstein J. Org. Chem., 2017, 13, 1907–1931 CrossRef CAS PubMed.
- O. Eguaogie, J. S. Vyle, P. F. Conlon, M. A. Gîlea and Y. Liang, Mechanochemistry of nucleosides, nucleotides, and related materials, Beilstein J. Org. Chem., 2018, 14, 955–970 CrossRef CAS PubMed.
- J. L. Howard, Q. Cao and D. L. Browne, Mechanochemistry as an emerging tool for molecular synthesis: what can it offer?, Chem. Sci., 2018, 9, 3080–3094 RSC.
- J. Andersen and J. Mack, Mechanochemistry and organic synthesis: from mystical to practical, Green Chem., 2018, 20, 1435–1443 RSC.
- C. Bolm and J. G. Hernández, Mechanochemistry of Gaseous Reactants, Angew. Chem., Int. Ed., 2019, 58, 3285–3299 CrossRef CAS PubMed.
- A. C. Jones, J. A. Leitch, S. E. Raby-Buck and D. L. Brown, Mechanochemical techniques for the activation and use of zero-valent metals in synthesis, Nat. Synth., 2022, 1, 763–775 CrossRef CAS.
- V. Martinez, T. Stolar, B. Karadeniz, I. Brekalo and K. Užarević, Advancing mechanochemistry synthesis by combining milling with different energy sources, Nat. Rev. Chem., 2023, 7, 51–65 CrossRef CAS.
- K. Kubota, Exploring Novel Synthesis Concepts and Strategies Using Mechanochemistry, Bull. Chem. Soc. Jpn., 2023, 96, 913–930 CrossRef CAS.
- L. Vugrin, M. Carta, S. Lukin, E. Meštrović, F. Delogu and I. Halasz, Mechanochemical reaction kinetics scales linearly with impact energy, Faraday Discuss., 2023, 241, 217–229 RSC.
- Y. S. Zholdassov, R. W. Kwok, M. A. Shlain, M. Patel, M. Marianski and A. B. Braunschweig, Kinetics of primary mechanochemical covalent-bond-forming reactions, RSC Mechanochem., 2024, 1, 11–32 RSC.
- J. Li, C. Nagamani and J. S. Moore, Polymer Mechanochemistry: From Destructive to Productive, Acc. Chem. Res., 2015, 48, 2181–2190 CrossRef CAS PubMed.
- K. M. Wiggins, J. N. Brantley and C. W. Bielawski, Polymer Mechanochemistry: Force Enabled Transformations, ACS Macro Lett., 2012, 1, 623–626 CrossRef CAS.
- Q. Mu and J. Hu, Polymer mechanochemistry: from single molecule to bulk materials, Phys. Chem. Chem. Phys., 2024, 26, 679–694 RSC.
- J. Jiang, K. Kubota, M. Jin, Z. J. Wang, T. Nakajima, H. Ito, J. P. Gong and S. Maeda, Mechanochemistry: Quantitation of Activation Force and Systematic Discovery of Reaction Sites Utilizing Two Forces, ChemRxiv, 2022, preprint, DOI:10.26434/chemrxiv-2022-fr09l.
- K. Kubota, N. Toyoshima, D. Miura, J. Jiang, S. Maeda, M. Jin and H. Ito, Introduction of a Luminophore into Generic Polymers via Mechanoradical Coupling with a Prefluorescent Reagent, Angew. Chem., Int. Ed., 2021, 60, 16003–16008 CrossRef CAS.
- K. Kubota, J. Jiang, Y. Kamakura, R. Hisazumi, T. Endo, D. Miura, S. Kubo, S. Maeda and H. Ito, Using Mechanochemistry to Activate Commodity Plastics as Initiators for Radical Chain Reactions of Small Organic Molecules, J. Am. Chem. Soc., 2024, 146, 1062–1070 CrossRef CAS.
- Y. S. Zholdassov, L. Yuan, S. R. Garcia, R. W. Kwok, A. Boscoboinik, D. J. Valles, M. Marianski, A. Martini, R. W. Carpick and A. B. Braunschweig, Acceleration of Diels-Alder Reactions by Mechanical Distortion, Science, 2023, 380, 1053–1058 CrossRef CAS.
- H. Yan, F. Yang, D. Pan, Y. Lin, J. N. Hohman, D. Solis-Ibarra, F. H. Li, J. E. P. Dahl, R. M. K. Carlson, B. A. Tkachenko, A. A. Fokin, P. R. Schreiner, G. Galli, W. L. Mao, Z.-X. Shen and N. A. Melosh, Sterically controlled mechanochemistry under hydrostatic pressure, Nature, 2018, 554, 505–510 CrossRef CAS PubMed.
- Y. Wang, X. Dong, X. Tang, H. Zheng, K. Li, X. Lin, L. Fang, G. Sun, X. Chen, L. Xie, C. L. Bull, N. P. Funnell, T. Hattori, A. Sano-Furukawa, J. Chen, D. K. Hensley, G. D. Cody, Y. Ren, H. H. Lee and H. Mao, Pressure-Induced Diels–Alder Reactions in C6H6-C6F6 Cocrystal towards Graphane Structure, Angew. Chem., Int. Ed., 2019, 58, 1468–1473 CrossRef CAS.
- M. Ferguson, M. S. Moyano, G. A. Tribello, D. E. Crawford, E. M. Bringa, S. L. James, J. Kohanoff and M. G. D. Pópolo, Insights into mechanochemical reactions at the molecular level: simulated indentations of aspirin and meloxicam crystals, Chem. Sci., 2019, 10, 2924–2929 RSC.
- M. Ferguson and T. Friščić, Exploring mechanochemistry of pharmaceutical cocrystals: effect of incident angle on molecular mixing during simulated indentations of two organic solids, Phys. Chem. Chem. Phys., 2024, 26, 9940 RSC.
- T. Iwasaki, Application of Molecular Dynamics Simulation to Interface Stabilization in Thin Film Devices, JSME Int. J., Ser. B, 2004, 47, 470–476 CrossRef CAS.
- A. Ukwatta and A. Achuthan, A molecular dynamics (MD) simulation study to investigate the role of existing dislocations on the incipient plasticity under nanoindentation, Comput. Mater. Sci., 2014, 91, 329–338 CrossRef.
- T. Yamamoto, K. Kubota and H. Ito, Dissolution-limited reactions in solid-state synthesis, J. Soc. Rheol., Jpn., 2024, 52, 161–170 CrossRef CAS.
- K. Kubota, T. Seo, K. Koide, Y. Hasegawa and H. Ito, Olefin-accelerated solid-state C–N cross-coupling reactions using mechanochemistry, Nat. Commun., 2019, 10, 111 CrossRef.
- M. Doi, Soft Matter Physics, Oxford University Press, Oxford, UK, 2013 Search PubMed.
- S. A. Safran, Statistical Thermodynamics of Surfaces, Interfaces, and Membranes, Westview Press, Boulder, CO, 2003 Search PubMed.
- T. Yamamoto, T. Yamazaki and T. Hirose, Phase separation driven by production of architectural RNA transcripts, Soft Matter, 2020, 16, 4692–4698 RSC.
- N. Nakagawa and S. Sasa, Liquid-Gas Transitions in Steady Heat Conduction, Phys. Rev. Lett., 2017, 119, 260602 CrossRef.
|
| This journal is © The Royal Society of Chemistry 2025 |
Click here to see how this site uses Cookies. View our privacy policy here.  Open Access Article
 *a,
Koji Kubota
 ab,
Yu Harabuchia and
Hajime Ito
 ab
ab


 . The diffusive flux
  represented by the volume of B molecules passing through a unit area per unit time, is proportional to the concentration gradient (volume fraction gradient) of these molecules


 and vz = 0 at z = 0 (because of the symmetry of the system). This approach is effective for the time scale in which the thickness of the product-rich phase becomes larger than the molecular length scale.


 , where we used
  and kψAψB ≈ kψA1ψB1, see the orange area in Fig. 11. In the rate-limited reaction, the entire system is at the thermodynamic equilibrium and thus (i) ψA = ψA1 for 0 < z < h(t) and (ii) ψA = ψA2 for z > h(t), see Fig. 8. The first condition corresponds to cases in which the first term in eqn (30) is larger than the second term for 0 < z < h(t) and thus is satisfied for
  . To evaluate the second condition, we derive the volume fraction of reactant A in the reactant B-rich phase,
 , see the purple area in Fig. 11.
 and
and  , see the brown area in Fig. 11. In this marginal regime, the product-rich phase is at the thermodynamic equilibrium, while the reactant A penetrates the B-rich phase only by the distance
  , see eqn (31). The kinetic equation of the reaction thus has the form:


