 Open Access Article
Creative Commons Attribution 3.0 Unported Licence
Eu3+-doped ZnO quantum dots: structure, vibration characteristics, optical properties, and energy transfer process
T. T. T.
Huong
*ad,
N. T.
Sa
a,
N. T. M.
Thuy
b,
P. V.
Hao
c,
N. H.
Thao
c,
N. T.
Hien
 d and
N. X.
Ca
 *d
*d
aHa Noi University of Industry, Ha Noi, Vietnam. E-mail: huongttt@haui.edu.vn
bFaculty of Physics, TNU-University of Education, Thai Nguyen, Vietnam
cFaculty of Physics, Ha Noi Pedagogical University 2, Vinh Phuc, Vietnam
dInstitute of Science and Technology, TNU-University of Sciences, Thai Nguyen, Vietnam. E-mail: canx@tnus.edu.vn
First published on 12th December 2024
Abstract
This article studies the synthesis, as well as the structural, vibrational, and optical properties of Eu3+-doped ZnO quantum dots (QDs) and investigates the energy transfer mechanism from the ZnO host to Eu3+ ions using Reisfeld's approximation. Eu3+-doped ZnO QDs at varying concentrations (0–7%) were successfully prepared using a wet chemical method. The successful doping of Eu3+ ions into the ZnO host lattice, as well as the composition and valence states of the elements present in the sample, were confirmed through X-ray diffraction (XRD) and X-ray photoelectron spectroscopy (XPS) analyses. XRD results demonstrated the crystalline nature of the ZnO QDs, revealing their wurtzite (WZ) structure with no secondary phases. XPS analysis provided further confirmation of the presence of Eu3+ ions within the ZnO host, with clear signals corresponding to the Zn, O, and Eu elements. The valence states of Eu were verified as trivalent (Eu3+), confirming the successful doping of Eu3+ ions, as evidenced by the characteristic Eu 3d peaks in the XPS spectra. Raman spectroscopy (RS) was employed to analyze the vibrational modes, revealing shifts in ZnO lattice vibrations due to Eu3+ incorporation, indicating strong coupling between Eu3+ ions and the ZnO host. Optical properties were studied using UV-Vis absorption, photoluminescence (PL) spectroscopy, and PL decay spectroscopy, showing a significant enhancement of red emission, attributed to the 5D0 → 7F2 transition of Eu3+ ions under UV excitation. Using Judd–Ofelt (JO) analysis, the intensity parameters (Ω2, Ω4, Ω6) were derived, providing insights into the asymmetry of the Eu3+ ion's local environment and the radiative transition probabilities. Energy transfer processes between the ZnO host and Eu3+ dopants were examined, showing efficient sensitization of Eu3+ through excitation of the ZnO host, with an optimal Eu3+ doping level maximizing luminescence. Eu3+-doped ZnO QDs, which emit in the visible light region and are non-toxic, have great potential for applications in photonic devices, light-emitting diodes, and bioimaging.
1. Introduction
Semiconductor quantum dots (QDs) are nanoscale particles that exhibit unique optical and electronic properties due to quantum confinement effects, where the motion of charge carriers (electrons and holes) is restricted in all three spatial dimensions. This confinement leads to discrete energy levels, making QDs behave similarly to artificial atoms with tunable band gaps.1–3 Their size can be precisely controlled, allowing for the customization of their emission wavelength across a broad spectrum, from infrared to ultraviolet. Due to their remarkable photoluminescence and ability to absorb and emit light efficiently, QDs are widely used in applications such as quantum computing, biological imaging, and light-emitting diodes.3–5Zinc oxide (ZnO) QDs have attracted much research interest due to their unique optical, electronic, and chemical properties. ZnO QDs exhibit a wide bandgap (approximately 3.37 eV) and large exciton binding energy (around 60 meV), which make them highly efficient in ultraviolet (UV) light absorption and emission.6–8 They have been widely studied for use in UV lasers, light-emitting diodes, and photodetectors.4,5,7 Additionally, their good biocompatibility and low toxicity compared to other QDs, such as cadmium-based materials, make ZnO QDs particularly suitable for biomedical applications, including biosensing, bioimaging, and drug delivery.9–12 ZnO QDs also possess strong photocatalytic activity, which has been leveraged in environmental applications, such as water purification and pollutant degradation. The synthesis of ZnO QDs is relatively simple, allowing for control of their size, shape, and surface characteristics to optimize their performance in specific applications. Furthermore, ZnO QDs have shown promise in enhancing the performance of solar cells by improving light absorption and charge separation efficiency.6,8,10 Their stability, versatility, and wide range of applications make ZnO QDs an important material in nanotechnology research and innovation.7,11,12
Trivalent rare earth Eu3+ ions have been studied in many areas of materials science due to their unique luminescent properties.13,14 These ions are known for their sharp, intense emissions, particularly in the red region of the visible spectrum, which arises from 4f–4f transitions, specifically the 5D0 → 7F2 transition. The ability of Eu3+ to emit red light with high quantum efficiency has made it a popular dopant in various materials, such as phosphors for lighting and display technologies.15–17 More recently, there has been growing interest in incorporating Eu3+ ions into semiconductor QDs. The incorporation of Eu3+ ions into semiconductor QDs, such as ZnS, ZnSe, CdSe, and CdS QDs, is an exciting area of research because it allows for the creation of new luminescent materials that take advantage of both the quantum confinement effect and the distinctive emission of Eu3+.1,13,14 These doped QDs exhibit enhanced photoluminescence stability, high color purity, and the potential for multi-functional applications, such as in energy-efficient lighting, displays, and medical diagnostics.13–16 The doping of Eu3+ into ZnO QDs has attracted significant attention due to their unique structural, vibrational, and optical properties. Eu3+-doped ZnO QDs exhibit tunable emission from blue to red by simply changing the excitation wavelength.15–17 A broad blue emission from the ZnO host at around 400 nm is observed, while the characteristic red emission from Eu3+ ions (5D0 → 7F2 transition) becomes dominant under 390–395 nm excitation. This allows for the creation of different color emissions using the same material.15 For the first time, Eu-doped ZnO QDs with dual fluorescence emission are reported to be applied in luminescent solar concentrators. The obtained optical efficiency of the luminescent solar concentrators based on Eu-doped ZnO QDs is relatively high because of their high photoluminescence intensity and dual fluorescence emission. Eu3+-doped ZnO QDs demonstrate strong solid-state fluorescence, enabling high loading concentrations in polymer films without significant aggregation-induced quenching. This is crucial for applications like luminescent solar concentrators, where high QD loading is necessary to achieve high optical efficiency.16 Studies indicated that doping ZnO with Eu3+ enhanced its photocatalytic performance compared to that of pure ZnO.16,17
Although several studies investigated the doping of Eu3+ ions into the ZnO host material, there has been no study on the mechanism and nature of the energy transfer process from the ZnO host to Eu3+ ions as well as using JO theory to study the emission characteristics of Eu3+ ions in the ZnO host. In this study, we analyze in detail the structural, vibrational, and optical properties of Eu3+-doped ZnO QDs using experimental measurements and theoretical models. The Judd–Ofelt theory was employed to analyze the optical transitions and energy transfer dynamics between ZnO and Eu3+ ions. This approach will offer insights into the efficiency of energy transfer and the influence of the ZnO host on Eu3+ luminescence. The study of these processes not only clarifies the physical mechanisms but also further develops and optimizes the optical properties of Eu3+-doped ZnO materials, for their application in optoelectronic devices, bio-imaging, and energy-saving lighting.
2. Experimental
2.1. Materials
ZAT (Zinc acetate dihydrate-Zn(CH3COO)2·2H2O, 99.99%), OLA (oleylamine –C18H37N, 97%), ODE (1-octadecene-CH3(CH2)15CH![[double bond, length as m-dash]](https://www.rsc.org/images/entities/char_e001.gif) CH2, 95%), TOP (tri-n-octylphosphine-C24H51OP 97%), EuAT (europium acetate hydrate-(CH3CO2)3Eu·xH2O, 99.9%), isopropanol (70%), and toluene (99.8%) were purchased from Sigma-Aldrich.
CH2, 95%), TOP (tri-n-octylphosphine-C24H51OP 97%), EuAT (europium acetate hydrate-(CH3CO2)3Eu·xH2O, 99.9%), isopropanol (70%), and toluene (99.8%) were purchased from Sigma-Aldrich.
2.2. Synthesis of Eu3+ doped ZnO quantum dots
Eu3+-doped ZnO QDs were synthesized via a wet chemical method. The synthesis process is based on previous studies.1,2 Specifically, 0.03 mol of zinc acetate (ZAT) and europium acetate (EuAT), with the Eu3+ concentration determined by the molar ratio of Eu3+ to Zn2+, were combined with 0.015 mol of trioctylphosphine (TOP) and 50 mL of octadecene (ODE) in a three-neck flask. Argon gas (Ar) was continuously introduced into the system to eliminate residual air. Subsequently, 0.015 mol of oleylamine (OLA) was injected into the reaction flask. The reaction mixture was heated to 280 °C and maintained at this temperature for 60 minutes to achieve monodisperse Eu3+-doped ZnO QDs. The resulting QDs were purified for further characterization and analysis. The synthesized samples of ZnO, ZnO![[thin space (1/6-em)]](https://www.rsc.org/images/entities/char_2009.gif) :
:![[thin space (1/6-em)]](https://www.rsc.org/images/entities/char_2009.gif) Eu0.5%, ZnO
Eu0.5%, ZnO![[thin space (1/6-em)]](https://www.rsc.org/images/entities/char_2009.gif) :
:![[thin space (1/6-em)]](https://www.rsc.org/images/entities/char_2009.gif) Eu1%, ZnO
Eu1%, ZnO![[thin space (1/6-em)]](https://www.rsc.org/images/entities/char_2009.gif) :
:![[thin space (1/6-em)]](https://www.rsc.org/images/entities/char_2009.gif) Eu3%, ZnO
Eu3%, ZnO![[thin space (1/6-em)]](https://www.rsc.org/images/entities/char_2009.gif) :
:![[thin space (1/6-em)]](https://www.rsc.org/images/entities/char_2009.gif) Eu5%, and ZnO
Eu5%, and ZnO![[thin space (1/6-em)]](https://www.rsc.org/images/entities/char_2009.gif) :
:![[thin space (1/6-em)]](https://www.rsc.org/images/entities/char_2009.gif) Eu7% are denoted as Z0, Z0.5, Z1, Z3, Z5, and Z7, respectively.
Eu7% are denoted as Z0, Z0.5, Z1, Z3, Z5, and Z7, respectively.
2.3. Characterization
The structure of QDs was investigated using X-ray diffraction (XRD). The measurements were conducted on a SIMEMS D5005 X-ray diffractometer (Bruker, Germany) with Cu-Kα radiation (λ = 1.54056 Å). X-ray photoelectron spectroscopy (XPS) analysis was performed on a Thermo VG Escalab 250 photoelectron spectrometer. RS spectra of the dried samples were measured with a LABRAM-HR800 spectrometer (Jobin Yvon) working with wavelength λ = 488 nm (2.54 eV). Ultraviolet-visible (UV-Vis) absorption spectra of the QDs were recorded using a Jasco V-770 spectrometer (Varian). The morphology and size of the QDs were examined via transmission electron microscopy (TEM), operated at 100 kV voltage. Photoluminescence (PL), photoluminescence excitation (PLE) spectra, and decay time curves were measured using an FLS1000 spectrophotometric system equipped with a 450 W Xe lamp. All measurements were carried out at room temperature.3. Results and discussion
3.1. Structural analysis and vibration characteristics
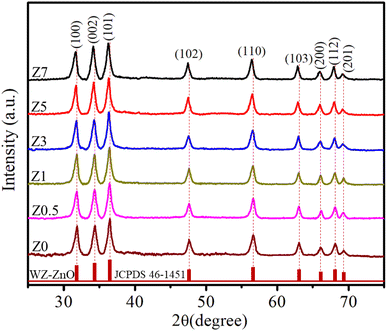
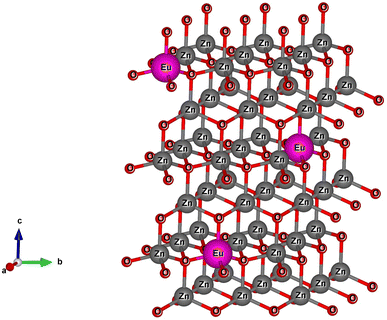
The X-ray diffraction (XRD) patterns of Z0, Z0.5, Z1, Z3, Z5, and Z7 samples are shown in Fig. 1. Diffraction peaks were observed at the (100), (002), (101), (102), (110), (103), (200), (112) and (201) lattice planes. This confirms a wurtzite structure (space group P63mc, no. 186) of all ZnO and Eu-doped ZnO QDs. All the peak positions of the crystal structure matched well with a hexagonal lattice (ICSD card no. 29272).18 There are no discernible impurity peaks in these results, confirming the phase purity of the samples. The unit cell structure of Eu3+-doped ZnO with a hexagonal configuration is illustrated in Fig. 2.Hexagonal structures are typical of ZnO QDs synthesized via the wet chemical method.1,16,18 A slight shift towards lower angles is observed in the diffraction peaks of Eu3+-doped samples (Z0.5, Z1, Z3, Z5, and Z7) compared to pure Z0 (ZnO). This shift is attributed to the substitution of smaller Zn2+ ions (radius 0.74 Å) by larger Eu3+ ions (radius 0.95 Å under 6-coordination), leading to an increase in the lattice constants.2,19 This substitution strains the ZnO lattice, causing a small expansion and a corresponding shift in the diffraction peaks to lower angles (due to the larger atomic spacing). The substitution of Zn2+ by Eu3+ ions affects the nucleation and growth rate of the QDs, as the larger Eu3+ ions induce lattice strain. The gradual shift of the peaks towards lower angles as the concentration of Eu3+ increases confirms the increasing replacement of Zn2+ ions by Eu3+. The crystallite size (D) of the QD sample was determined from the broadening of the strongest peak (101) in the XRD pattern using the Debye–Scherrer equation:1,2,20
 | (1) |
For a hexagonal wurtzite structure, the lattice constants a and c can be calculated using Bragg's law. The lattice constants are related to the Miller indices (h, k, l) by the following formula:1
 | (2) |
nλ = 2dhkl![[thin space (1/6-em)]](https://www.rsc.org/images/entities/char_2009.gif) sin sin![[thin space (1/6-em)]](https://www.rsc.org/images/entities/char_2009.gif) θ θ | (3) |
The cell volume (V) of a hexagonal unit cell can be calculated using the lattice constants a and c with the following formula:1
 | (4) |
The crystallite strain (ε) in the ZnO QDs can be estimated from the peak broadening using the Williamson–Hall equation:1,2
 | (5) |
The parameters calculated from the XRD data, including a, c, 2θ, β, V, D, and ε, are presented in Table 1. As the concentration of Eu3+ increased, the cell volume also increased, which was attributed to the larger ionic radius of Eu3+ compared to Zn2+. The Eu3+ ions occupied the lattice sites of Zn2+, leading to an increase in the interatomic distance.21–23 The results in Table 1 show that the lattice strain and the crystallite size of Eu3+-doped ZnO QDs increased with increasing Eu3+ concentration. Chemingui and colleagues proposed that higher Eu3+ concentrations cause an excess of Eu3+ ions, leading to the formation of Eu–O–Zn bonds on the ZnO surface.24 These bonds enhance crystal growth and transfer stress from the outer surface to the interior of the crystal.
| Sample | a (Å) | c (Å) | 2θ (101) | β × 10−2 (rad) | Cell volume (Å3) | D (nm) | ε × 10−3 |
|---|---|---|---|---|---|---|---|
| Z0 | 3.247 | 5.260 | 36.52° | 1.85 | 46.80 | 7.89 | 1.40 |
| Z0.5 | 3.249 | 5.263 | 36.47° | 1.85 | 46.87 | 7.89 | 1.40 |
| Z1 | 3.251 | 5.267 | 36.40° | 1.84 | 46.98 | 7.93 | 1.39 |
| Z3 | 3.253 | 5.270 | 36.34° | 1.82 | 47.06 | 8.02 | 1.38 |
| Z5 | 3.255 | 5.273 | 36.27° | 1.81 | 47.15 | 8.06 | 1.38 |
| Z7 | 3.257 | 5.277 | 36.21° | 1.79 | 47.25 | 8.15 | 1.37 |
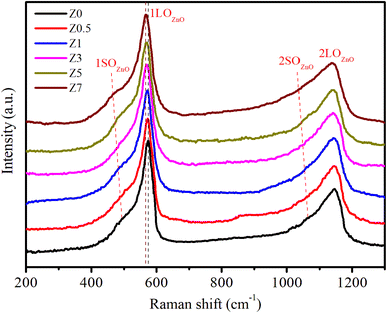
Raman scattering (RS) is a powerful tool to investigate the vibrational properties of semiconductors and to explore the effects of doping on the structural properties of materials.33Fig. 3 displays the RS spectra of ZnO and Eu3+-doped ZnO QDs. For ZnO QDs, the Raman peaks at approximately 573.11 cm−1 and 1146.56 cm−1 correspond to the first-order longitudinal optical (1LO) phonon mode and its second-order overtone (2LO).34,35 The 1LO mode of ZnO QDs is slightly redshifted compared to the 1LO mode in bulk ZnO (which is typically closer to 590 cm−1).34,35 The redshift of the Raman peak position in ZnO QDs is due to the quantum confinement effect of the nm-sized particles. The spatial confinement of phonons in QDs results in a slight red-shift and peak broadening in the Raman spectrum. In the spatial limit of optical phonons, the Raman spectra of semiconductor QDs exhibit red-shifts and peak broadening due to a relaxation of the k-vector selection rule within finite-sized QDs.36 According to the Heisenberg uncertainty principle, the fundamental Raman selection rule is relaxed in structures of finite size, allowing phonons located away from the center of the Brillouin zone to participate. The uncertainty in the phonon wavevector scales approximately as 1/L, where L is the diameter of the QD. This spatial confinement in small-diameter QDs results in red-shifts and asymmetric broadening of Raman peaks in QDs compared to their bulk material.
The 1SOZnO (first-order surface optical) phonon mode at around 493.34 cm−1 is observed in the Raman spectra of ZnO QDs.33,35 This mode is attributed to vibrations that are strongly affected by surface states. SO phonon modes in semiconductor QDs are not present in bulk materials. They arise from the vibrations of atoms at or near the surface of QDs. In ZnO QDs, the 1SO mode appears as a distinct feature around 493.34 cm−1, which is much lower in energy than the 1LO phonon modes. These surface optical phonons occur due to the strong influence of surface atoms and their interactions with the surrounding environment.33–35
For Eu-doped ZnO QDs, when the Eu3+ concentration increased from 0.5–7%, the 1LO and 1SO peaks red-shifted from 571.35 to 566.89 cm−1 and 486.89 to 466.93 cm−1, respectively. The magnitude of this red-shift increases with higher concentrations of Eu3+ dopant. Several mechanisms contribute to this red-shift: (i) the ionic radius of Eu3+ is larger than that of Zn2+, which means that substituting Eu3+ for Zn2+ introduces strain into the ZnO crystal lattice. This strain weakens the bonds between atoms, reducing the restoring force for atomic vibrations and causing the frequency of the 1LO phonon mode to decrease (red-shift). (ii) Doping with Eu3+ can introduce additional defect states, such as oxygen vacancies or interstitials. These defects disrupt the periodicity of the crystal lattice, leading to localized distortions. The increased defect density alters the lattice dynamics and softens the vibrational modes, resulting in a red-shift of the 1LO peak. (iii) In ZnO QDs, the spatial confinement of phonons due to their small size already leads to some red shifting and broadening of the 1LO mode. Increasing the Eu3+ ion concentration further enhances this effect by introducing additional stress and disorder, which increases the phonon-limiting effect, resulting in a stronger red-shift.
3.2. Elemental composition analysis
X-ray photoelectron spectroscopy (XPS) provides important information about the chemical state and elemental composition of materials, serving as a key tool to confirm the successful incorporation of impurity elements into the host material. Fig. 4a displays typical XPS survey scans of the ZnO![[thin space (1/6-em)]](https://www.rsc.org/images/entities/char_2009.gif) :
:![[thin space (1/6-em)]](https://www.rsc.org/images/entities/char_2009.gif) Eu3+7% QDs. This XPS spectrum provides strong evidence of the successful doping of Eu3+ ions into ZnO QDs. The Zn-2p, O-1s, and Eu-3d peaks confirm the presence of both the ZnO host lattice and the dopant (Eu3+). The XPS survey scan of the ZnO
Eu3+7% QDs. This XPS spectrum provides strong evidence of the successful doping of Eu3+ ions into ZnO QDs. The Zn-2p, O-1s, and Eu-3d peaks confirm the presence of both the ZnO host lattice and the dopant (Eu3+). The XPS survey scan of the ZnO![[thin space (1/6-em)]](https://www.rsc.org/images/entities/char_2009.gif) :
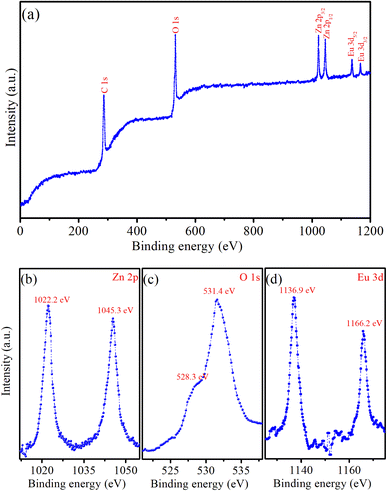
:![[thin space (1/6-em)]](https://www.rsc.org/images/entities/char_2009.gif) Eu3+7% QDs showed six peaks corresponding to the levels of C-1s, O-1s, Zn-2p3/2, Zn-2p1/2, Eu-3d5/2, and Eu-3d3/2. The detection of the C element suggests the presence of residual precursors used during the fabrication process of the QDs. Fig. 4b presents a high-resolution XPS spectrum, where the two distinct peaks at 1022.2 eV and 1045.3 eV are attributed to the Zn-2p3/2 and Zn-2p1/2 levels of the Zn element, respectively.1,2 The binding energy difference between these peaks is 23.1 eV, which is consistent with previously reported values in the literature.1,2,25 The doublet (with 2p3/2 and 2p1/2) is characteristic of Zn2+ in the ZnO lattice, confirming the presence of Zinc in the +2 oxidation state. The strong intensity of the O-1s peak corresponds to oxygen present in the ZnO lattice.1,25 This strong intensity peak is actually two very close peaks at 531.4 and 528.3 eV (Fig. 4c). This peak indicates the presence of O2− ions, which are part of the ZnO crystal structure. In ZnO
Eu3+7% QDs showed six peaks corresponding to the levels of C-1s, O-1s, Zn-2p3/2, Zn-2p1/2, Eu-3d5/2, and Eu-3d3/2. The detection of the C element suggests the presence of residual precursors used during the fabrication process of the QDs. Fig. 4b presents a high-resolution XPS spectrum, where the two distinct peaks at 1022.2 eV and 1045.3 eV are attributed to the Zn-2p3/2 and Zn-2p1/2 levels of the Zn element, respectively.1,2 The binding energy difference between these peaks is 23.1 eV, which is consistent with previously reported values in the literature.1,2,25 The doublet (with 2p3/2 and 2p1/2) is characteristic of Zn2+ in the ZnO lattice, confirming the presence of Zinc in the +2 oxidation state. The strong intensity of the O-1s peak corresponds to oxygen present in the ZnO lattice.1,25 This strong intensity peak is actually two very close peaks at 531.4 and 528.3 eV (Fig. 4c). This peak indicates the presence of O2− ions, which are part of the ZnO crystal structure. In ZnO![[thin space (1/6-em)]](https://www.rsc.org/images/entities/char_2009.gif) :
:![[thin space (1/6-em)]](https://www.rsc.org/images/entities/char_2009.gif) Eu3+ QDs, this peak may also have contributions from Eu–O bonds, particularly at higher concentrations of Eu3+. Typical peaks corresponding to Zn-2p and O-1s are evident, representing the characteristic ZnO QDs. The peaks at 1136.9 eV and 1166.2 eV are attributed to Eu-3d5/2 and Eu-3d3/2 levels, respectively (Fig. 4d).2,26 The positions of the Eu-3d5/2 and Eu-3d3/2 peaks indicate that Eu is present in its trivalent oxidation state (Eu3+). The presence of Eu in the spectrum confirms the successful doping of the ZnO QDs with Eu3+ ions.
Eu3+ QDs, this peak may also have contributions from Eu–O bonds, particularly at higher concentrations of Eu3+. Typical peaks corresponding to Zn-2p and O-1s are evident, representing the characteristic ZnO QDs. The peaks at 1136.9 eV and 1166.2 eV are attributed to Eu-3d5/2 and Eu-3d3/2 levels, respectively (Fig. 4d).2,26 The positions of the Eu-3d5/2 and Eu-3d3/2 peaks indicate that Eu is present in its trivalent oxidation state (Eu3+). The presence of Eu in the spectrum confirms the successful doping of the ZnO QDs with Eu3+ ions.
3.3. Absorption properties
The absorption spectra provide valuable information about the optical properties and energy band structures of a material. Fig. 5a displays the UV-Vis spectra of Eu3+-doped ZnO samples as the Eu3+ doping concentration varies. ZnO is a wide bandgap semiconductor with a direct bandgap of approximately 3.37 eV, corresponding to the ultraviolet (UV) region of the spectrum.1,12,15 In the absorption spectra of Z0–Z7 samples, a prominent absorption edge appears from 339.07 to 347.82 nm (see Table 2), which is attributed to the band-to-band transition, where electrons are excited from the valence band to the conduction band of the ZnO host.1,15 For ZnO QDs, the absorption shows a blue shift compared to bulk ZnO due to the quantum confinement effect. This phenomenon occurs when the size of the QDs becomes comparable to or smaller than the exciton Bohr radius. As a result, the bandgap energy increases (see Table 2), shifting the absorption edge to shorter wavelengths (higher energies). The magnitude of this shift depends on the size of the QDs; smaller QDs exhibit larger shifts.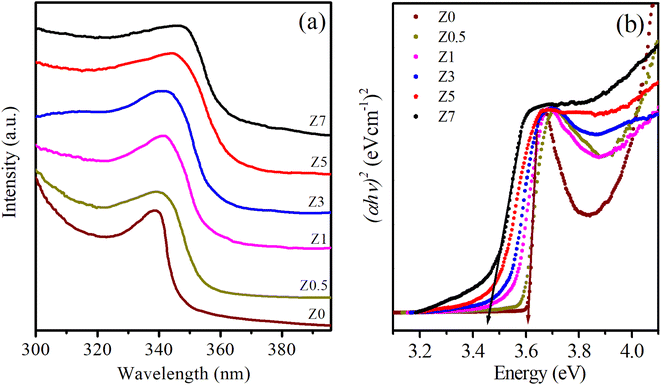 | ||
| Fig. 5 (a) UV-Vis spectra and (b) the plot of variation of (αhv)2versus energy (hv) of Eu3+-doped ZnO QDs. | ||
![[thin space (1/6-em)]](https://www.rsc.org/images/entities/char_2009.gif) :
:![[thin space (1/6-em)]](https://www.rsc.org/images/entities/char_2009.gif) Eu3+ QDs
Eu3+ QDs
| Sample | Abs peak (nm) | E g (eV) | Size (nm) | 1LOZnO (cm−1) | 1SOZnO (cm−1) |
|---|---|---|---|---|---|
| Z0 | 339.1 | 3.61 | 8.86 | 573.11 | 493.34 |
| Z0.5 | 340.6 | 3.57 | 9.76 | 571.35 | 486.89 |
| Z1 | 341.4 | 3.53 | 10.72 | 570.64 | 481.76 |
| Z3 | 342.6 | 3.49 | 11.46 | 569.83 | 478.65 |
| Z5 | 345.3 | 3.46 | 12.04 | 567.38 | 472.65 |
| Z7 | 347.8 | 3.45 | 12.20 | 566.89 | 466.93 |
When Eu3+ ions are introduced into the ZnO crystal lattice, their absorption spectra undergo significant changes. The UV-Vis spectra of Eu3+-doped ZnO QDs show a red shift of the absorption peaks as the Eu3+ concentration increases. This redshift is often attributed to lattice strain, defect formation, and the introduction of Eu3+ ions, which modify the local electronic structure.26,27 Additionally, Eu3+ ions can interact with oxygen vacancies, leading to changes in the defect states within the bandgap, further influencing the absorption spectrum.27,28 The absorption peaks become broader as the Eu3+ concentration increases, confirming that the incorporation of Eu3+ ions affects the optical transitions in the material.27–29 Eu3+ ions, which typically occupy Zn2+ sites in the ZnO lattice, introduce localized energy states within the bandgap of ZnO. These localized states affect the electronic transitions and optical properties of the QDs. The absorption bands associated with the intra-4f electronic transitions of Eu3+ ions are not visible in the 300–400 nm range of Fig. 5a. These transitions are typically much weaker than the absorption of ZnO because the intra-4f transitions of Eu3+ ions are parity-forbidden.26,28,29 The band-gap energies (Eg) for both undoped ZnO and Eu3+-doped ZnO QDs were estimated by extrapolating the linear portion of the (αhv)2versus energy (hv) plots (Fig. 5b):30
| αhv = A(hv − Eg)n | (6) |
The size of QDs was determined based on their band gap energy (Eg) using the effective mass approximation (EMA) model, which relates the size of semiconductor QDs to their band gap due to quantum confinement effects. The size of QDs was estimated using the following equation for the quantum confinement effect in a spherical particle:26,31
 | (7) |
 is the effective mass of the electron in ZnO (
 where m0 is the free electron mass).
  is the effective mass of the hole in ZnO
  ε0 is the permittivity of free space. εr is the relative permittivity of ZnO (εr ≈ 8.5), and e is the elementary charge.1,32 The sizes of the QDs were determined and given in Table 2.
3.4. Photoluminescence properties
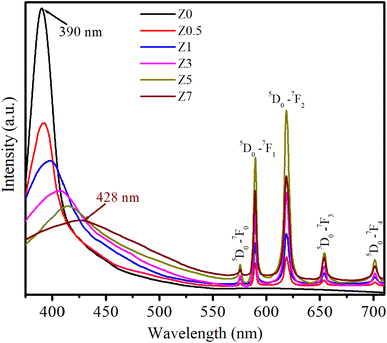
The photoluminescence (PL) spectra of ZnO and Eu3+-doped ZnO QDs under 330 nm excitation are presented in Fig. 6. The PL spectra in Fig. 6 display both the intrinsic emission of the ZnO host and the characteristic sharp emission lines of Eu3+ ions, corresponding to transitions between the excited 5D0 state and lower-energy 7FJ (J = 0, 1, 2, 3, 4) levels.2,15 The broad emission band centered around 390–428 nm, observed prominently in the undoped and doped samples, is attributed to the near-band-edge (NBE) emission of the ZnO host, which originates from excitonic recombination processes.1,18 This emission intensity decreased with increasing Eu3+ doping, suggesting that the presence of Eu3+ ions likely induces non-radiative processes or energy transfer mechanisms that quench the NBE emission of ZnO QDs. This quenching effect becomes apparent as the Eu3+ concentration increases. Fig. 6 shows that the NBE emission of the ZnO host shifts toward longer wavelengths (red-shift) with increasing Eu concentration. This red-shift is a consequence of several factors, including increased lattice stress, the formation of more defects, enhanced energy transfer between the ZnO host and the Eu3+ ions, and changes in QD size.17,18 As the Eu3+ concentration increases, these effects are enhanced, reducing the energy of the emitted photons, shifting the NBE emission toward longer wavelengths (lower energies).For Eu3+-doped ZnO QDs, the distinct peaks between 570 nm and 710 nm are characteristic of the Eu3+ ion transitions (4f transitions). These transitions are less affected by the surrounding crystal field due to the shielding by the 5s and 5p electrons. The strong emissions correspond to the transitions: 5D0 → 7F0 (575 nm), 5D0 → 7F1 (589 nm), 5D0 → 7F2 (619 nm), 5D0 → 7F3 (654 nm), and 5D0 → 7F4 (701 nm).2,17 In these transitions, 5D0 → 7F1 is a magnetic dipole transition, which is less sensitive to crystal field symmetry. The 5D0 → 7F2 is an electric dipole transition that is sensitive to the local environment, typically stronger at low-symmetry sites.13,14,26
As the Eu3+ concentration increases (0.5–5%), the intensity of these peaks, particularly the 5D0 → 7F2 transition at 619 nm, becomes more pronounced, demonstrating an effective incorporation of Eu3+ into the ZnO QDs. The 5D0 → 7F2 transition, known for its sensitivity to the asymmetry of the local crystal field, becomes dominant, suggesting that Eu3+ ions occupy sites within the ZnO lattice that lack inversion symmetry. As seen in the PL spectra, the emission intensity of Eu3+-related transitions increases as the Eu3+ concentration increases from 0.5 to 5%. However, when the Eu3+ concentration reaches 7% (sample Z7), there is a noticeable decrease in the intensity of these emissions. The observed reduction in Eu3+ emission intensity in sample Z7 is a typical example of concentration quenching. The main contributing factors are likely: (i) cross-relaxation between closely spaced Eu3+ ions, (ii) energy migration to non-radiative defects, and (iii) Eu3+ ions aggregating together instead of being evenly distributed in the ZnO host.2,13,26 These mechanisms, combined with defect formation in the ZnO host, result in the reduced efficiency of radiative recombination, leading to the observed decrease in photoluminescence intensity at high Eu3+ concentrations.
3.5. Judd–Ofelt analysis
The emission probabilities of the transitions between different levels in Eu3+ ions are key to determining the intensity parameters in the JO theory. The magnetic dipole (MD) transition (5D0 → 7F1) is nearly independent of the host material. The electric dipole (ED) transitions (5D0 → 7F2, 5D0 → 7F4, and 5D0 → 7F6) are sensitive to the host environment.2,13 Their emission probabilities AED depend on the refractive index n of the host, the energy of the transition ν, and the intensity parameters Ω2, Ω4, and Ω6. These parameters represent how the local environment (or ligand field) affects the electric dipole transitions.37,38
 | (8) |
 | (9) |
 | (10) |
 | (11) |
A MD and AED are calculated from the integrated intensities of the PL spectrum.41–43 These AMD and AED values are then used to calculate the JO parameters Ω2, Ω4, and Ω6. For the 5D0 → 7F2 transition: U(2) = 0.0033, U(4) = U(6) = 0; for the 5D0 →7F4 transition: U(2) = 0, U(4) = 0.0023, U(6) = 0; for the 5D0 → 7F6 transition: U(2) = U(4) = 0, U(6) = 0.0003.
The JO parameters Ω2, Ω4, and Ω6 are determined and given by Table 3. The Ω2 values for the ZnO![[thin space (1/6-em)]](https://www.rsc.org/images/entities/char_2009.gif) :
:![[thin space (1/6-em)]](https://www.rsc.org/images/entities/char_2009.gif) Eu3+ QDs range from 3.005 to 3.445. These values indicate a moderate degree of asymmetry and covalency around Eu3+ ions in ZnO
Eu3+ QDs range from 3.005 to 3.445. These values indicate a moderate degree of asymmetry and covalency around Eu3+ ions in ZnO![[thin space (1/6-em)]](https://www.rsc.org/images/entities/char_2009.gif) :
:![[thin space (1/6-em)]](https://www.rsc.org/images/entities/char_2009.gif) Eu3+ QDs. The highest Ω2 value is seen in Z3, indicating that the Z3 sample has the most asymmetric environment among the ZnO
Eu3+ QDs. The highest Ω2 value is seen in Z3, indicating that the Z3 sample has the most asymmetric environment among the ZnO![[thin space (1/6-em)]](https://www.rsc.org/images/entities/char_2009.gif) :
:![[thin space (1/6-em)]](https://www.rsc.org/images/entities/char_2009.gif) Eu3+ QDs, possibly due to an optimal balance between the doping concentration and host environment. The results in Table 3 show that the Ω2 values in Eu (0.5–7%)-doped ZnO samples are similar to those in CdS and ZnS semiconductor hosts. This indicates similar local asymmetry around Eu3+ ions in these II–VI semiconductor hosts. The Ω4 values in Eu-doped ZnO QDs show that the rigidity of the ZnO
Eu3+ QDs, possibly due to an optimal balance between the doping concentration and host environment. The results in Table 3 show that the Ω2 values in Eu (0.5–7%)-doped ZnO samples are similar to those in CdS and ZnS semiconductor hosts. This indicates similar local asymmetry around Eu3+ ions in these II–VI semiconductor hosts. The Ω4 values in Eu-doped ZnO QDs show that the rigidity of the ZnO![[thin space (1/6-em)]](https://www.rsc.org/images/entities/char_2009.gif) :
:![[thin space (1/6-em)]](https://www.rsc.org/images/entities/char_2009.gif) Eu3+ environment is similar to that of ZnS and La2(MoO4)3 hosts, but less rigid than the CdS host. The moderate rigidity in ZnO
Eu3+ environment is similar to that of ZnS and La2(MoO4)3 hosts, but less rigid than the CdS host. The moderate rigidity in ZnO![[thin space (1/6-em)]](https://www.rsc.org/images/entities/char_2009.gif) :
:![[thin space (1/6-em)]](https://www.rsc.org/images/entities/char_2009.gif) Eu3+ QDs allows for some flexibility, which may be beneficial for applications where mechanical or thermal adaptability is required. The parameter Ω6 is related to higher order interactions and is determined from the 5D0 → 7F6 transition in the wavelength range of about 725–735 nm. However, in Eu3+-doped materials the higher order effects are negligible, so the absence of the Ω6 parameter does not affect the analytical results.
Eu3+ QDs allows for some flexibility, which may be beneficial for applications where mechanical or thermal adaptability is required. The parameter Ω6 is related to higher order interactions and is determined from the 5D0 → 7F6 transition in the wavelength range of about 725–735 nm. However, in Eu3+-doped materials the higher order effects are negligible, so the absence of the Ω6 parameter does not affect the analytical results.
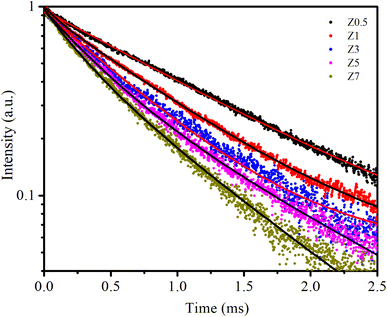 | ||
| Fig. 7 The PL decay curves of samples. The solid line is the fitted result by eqn (18). | ||
The PL decay curves are fitted to a bi-exponential decay equation, which is typically written as follows:2,13
 | (12) |
 | (13) |
The obtained values of Ai, ti, and 〈τ〉 by fitting are listed in Table 4. As seen in Table 4, the average lifetime 〈τ〉 progressively decreases from 1.11 ms in sample Z0.5 to 0.50 ms in sample Z7 as the Eu3+ ion concentration increased in the samples. A shorter average lifetime indicates faster non-radiative recombination or more efficient energy transfer processes, meaning that as the Eu3+ concentration increases, the ZnO host material more effectively transfers energy to the Eu3+ ions. This accelerates the decay of the PL, resulting in shorter lifetimes. The decrease in 〈τ〉 as Eu3+ concentration increases provides strong evidence of the energy transfer process from the ZnO host to the Eu3+ ions.
| Sample | A 1 (%) | t 1 (ms) | A 2 (%) | t 2 (ms) | <t> (ms) |
|---|---|---|---|---|---|
| ±0.42 | ±0.015 | ±0.58 | ±0.012 | ±0.014 | |
| Z0.5 | 64.53 | 1.24 | 35.47 | 0.57 | 1.11 |
| Z1 | 54.71 | 0.97 | 45.29 | 0.49 | 0.83 |
| Z3 | 59.34 | 0.77 | 40.66 | 0.44 | 0.68 |
| Z5 | 61.25 | 0.66 | 38.75 | 0.35 | 0.58 |
| Z7 | 67.33 | 0.55 | 32.67 | 0.34 | 0.50 |
The quantum efficiency of the 5D0 level of Eu3+ is a crucial parameter in evaluating the performance of Eu3+-doped materials, particularly for applications in luminescent devices. This level corresponds to the lowest excited state of Eu3+, from which radiative transitions occur to the ground state, primarily involving the 7FJ (J = 0–4) levels, resulting in the characteristic red luminescence.37,38Fig. 7 shows the decay curves of the 5D0 level of the Eu3+ ion in Eu-doped ZnO QDs. The experimental lifetime (τexp) was determined by fitting the PL decay curves using a bi-exponential function. The lifetimes of samples are presented in Table 5. The quantum efficiency (η) of the 5D0 level and the energy transfer probability (WET) from this level are determined using the following formulas:13,42
 | (14) |
 | (15) |
| Sample | τ cal | τ exp | η | W ET |
|---|---|---|---|---|
| Z0.5 | 1333 | 1110 | 83.27 | 149.02 |
| Z1 | 1388 | 830 | 59.80 | 480.18 |
| Z3 | 1259 | 680 | 54.01 | 676.31 |
| Z5 | 1366 | 580 | 42.46 | 992.07 |
| Z7 | 1402 | 500 | 35.66 | 1286.73 |
The results presented in Table 5 demonstrate a clear trend of decreasing quantum efficiency and increasing energy transfer rate with rising concentrations of Eu3+ ions in the Eu-doped ZnO QDs. As the concentration of Eu3+ increases, the average distance between Eu3+ ions decreases, intensifying the interaction between them. This enhanced interaction facilitates a more efficient energy transfer between Eu3+ ions. The observed reduction in the lifetime of the 5D0 level in Eu3+ can be attributed to the migration of excitation energy between Eu3+ ions.13,26 During this process, the Eu3+ ion in the 5D0 state relaxes to the 7F0 level by transferring its energy to a neighboring Eu3+ ion, exciting it from the 7F0 to the 5D0 state.38 This results in the migration of excitation energy through multiple Eu3+ ions before photon emission occurs. In addition to energy transfer between Eu3+ ions, the presence of defects in the material acts as an additional mechanism for luminescence quenching.39,40 These defects act as acceptor centers, which are capable of trapping excitation energy from nearby Eu3+ ions if they are close enough. Once trapped, the defects may relax back to their ground state by emitting multiphonon or infrared radiation, leading to non-radiative decay and reducing the overall luminescence of the Eu3+ ions. As the concentration of Eu3+ increases, the rate of energy trapping by defect centers also rises, resulting in a quenching effect. This is reflected in the reduction of the fluorescence lifetime and fluorescence intensity when the Eu3+ concentration exceeds 5%.
3.6. Energy transfer from the ZnO host to Eu3+ ions
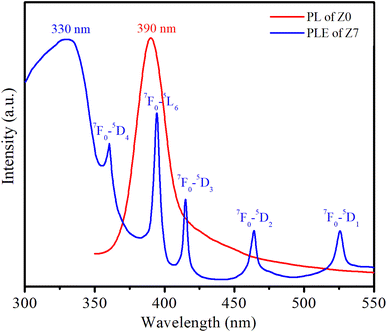
Fig. 8 shows the PL spectrum of the Z0 sample and the photoluminescence excitation (PLE) spectrum of the Z7 sample. To obtain the PLE spectrum, the emission wavelength was fixed at 619 nm, corresponding to the 5D0 → 7F2 transition of Eu3+ ions.The PLE spectrum of Z7 reveals six distinct peaks. The broad peak centered at 330 nm is related to the absorption of the ZnO host. The next five narrow peaks are transitions between the ground state 7F0 of Eu3+ and various excited states (5D4, 5L6, 5D3, 5D2, and 5D1) of the Eu3+ ions at wavelengths of 360, 394, 415, 464, and 525 nm, respectively. A strong peak in the PL spectrum of the Z0 sample is observed around 390 nm, which corresponds to the near-band-edge emission of ZnO QDs.1,15 This emission is characteristic of excitonic recombination in ZnO QDs. The 7F0 → 5L6 excitation peak of Eu3+ ions is entirely situated within the emission region of the ZnO QDs. This alignment indicates efficient energy transfer from the ZnO host material to the Eu3+ ions.17,18 The ZnO host absorbs energy and subsequently transfers it to the Eu3+ ions, facilitating their excitation. The energy transfer process from the ZnO host to the Eu3+ ions is depicted schematically in Fig. 9. The energy absorbed by the ZnO host is transferred to the Eu3+ ions, resulting in their characteristic red luminescence. This process demonstrates the efficient energy transfer between the ZnO host and the Eu3+ dopants, enhancing the luminescent properties of the material.15–17
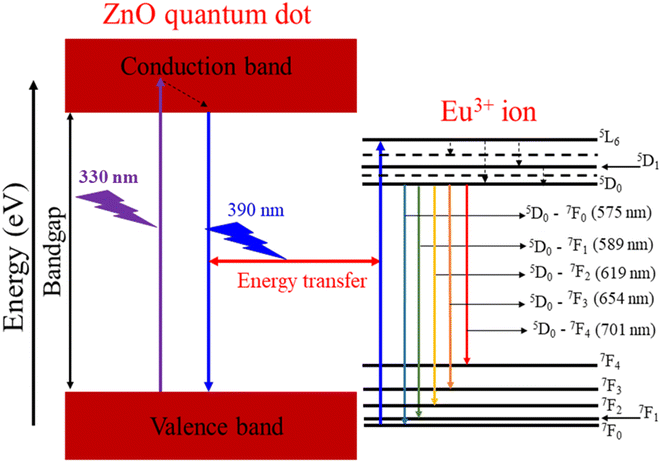
Fig. 9 illustrates the energy level diagram and energy transfer process from the ZnO QDs to Eu3+ ions. This diagram helps explain the PL and energy transfer mechanism between the ZnO host material and the Eu3+ dopant ions. When the ZnO QDs are excited by UV light (at 330 nm), electrons in the valence band of ZnO are excited into the conduction band, creating electron–hole pairs. After being excited, the electrons return to the valence band and emit a wavelength of 390 nm. Part of this radiation energy is transferred to the Eu3+ ions and excites them to move from 7F0 to 5L6. From the 5L6 state, the electrons relax non-radiatively to the 5D0 state. Then, the Eu3+ ions from the 5D0 state return to the 7FJ (J = 0–4) states and emit photons at specific wavelengths of 575, 589, 619, 654, and 701 nm corresponding to the 5D0–7F0, 5D0–7F1, 5D0–7F2, 5D0–7F3, and 5D0–7F4 transitions. It should be noted that the excitation wavelength of 330 nm used coincides with the excitation peak of the ZnO host and does not coincide with any other excitation peak of Eu3+ ions. The wavelength of 330 nm is not suitable for the excitation of Eu3+ ions.
The efficiency of energy transfer (ηET) from a ZnO host to Eu3+ ions is an important parameter that determines how effectively the ZnO host transfers its absorbed energy to the Eu3+ ions, leading to characteristic Eu3+ emission. The ηET can be calculated from the change in the PL intensity of the ZnO host using the formula:13
 | (16) |
| Sample | x | y | CCT (K) | R | η ET (%) |
|---|---|---|---|---|---|
| Z0 | 0.164 | 0.071 | 1682.06 | — | — |
| Z0.5 | 0.229 | 0.141 | 3010.63 | 1.24 | 40.9 |
| Z1 | 0.244 | 0.149 | 3209.27 | 1.20 | 54.6 |
| Z3 | 0.249 | 0.154 | 3791.77 | 1.23 | 64.73 |
| Z5 | 0.299 | 0.211 | 21957.22 | 1.36 | 70.48 |
| Z7 | 0.276 | 0.218 | 30410.34 | 1.18 | 75.4 |
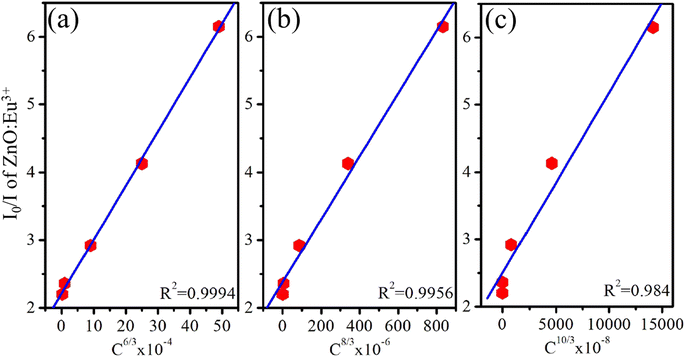
Reisfeld's approximation is a useful theoretical tool for analyzing the energy transfer (ET) process between a host material and dopant ions. Reisfeld's approximation provides a mathematical equation for determining the energy transfer efficiency (ηET) based on the concentration of the acceptor ions (Eu3+) and the distance-dependent interaction between the donor (ZnO) and acceptor (Eu3+). The general form of that relationship follows the equation:13,26
 | (17) |
3.7. CIE color coordinates
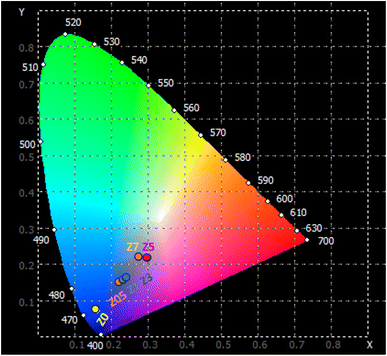
The emission characteristics of the material are represented in the CIE 1931 color space, a system used to describe colors based on human vision. The (x, y) chromaticity coordinates of the ZnO![[thin space (1/6-em)]](https://www.rsc.org/images/entities/char_2009.gif) :
:![[thin space (1/6-em)]](https://www.rsc.org/images/entities/char_2009.gif) Eu3+ QD luminescence are plotted on the CIE 1931 diagram and shown in Fig. 11. The correlated color temperature (CCT) for the samples can be determined using the McCamy approximation:46,47
Eu3+ QD luminescence are plotted on the CIE 1931 diagram and shown in Fig. 11. The correlated color temperature (CCT) for the samples can be determined using the McCamy approximation:46,47| CCT = −449n3 + 3525n2 − 6823n + 5520.33 | (18) |
The Z0.5, Z1, and Z3 samples exhibit progressively higher x and y coordinates, indicating a shift towards the green and blue regions of the chromaticity diagram. Their CCT values of 3010.63, 3209.27, and 3791.77 K, respectively, indicate their emission in the cooler, more neutral white light region. The Z5 and Z7 samples exhibit very high CCTs, indicating that they emit light in the cooler region of the spectrum (from blue to ultraviolet). These extremely high CCT values are similar to light emitted from natural sources such as a clear blue sky or daylight at high altitudes. For the human eye, the light from Z5 and Z7 appears as a vivid, pure blue. This is the type of light typically associated with strong artificial light, such as high-power blue LEDs or cool-tone backlighting in electronic devices. These optical properties make them suitable for many technological and biomedical applications, especially where strong blue or ultraviolet light is required.
4. Conclusion
Eu3+-doped ZnO QDs with concentrations varying from 0 to 7% were successfully fabricated by a wet chemical method. The synthesis, as well as structural, vibrational, and optical properties, and energy transfer mechanism from the ZnO host to Eu3+ ions were studied and explained in detail. XRD demonstrated that the Eu-doped ZnO QDs had a wurtzite structure (ICDD file no: 36-1451) with the crystallite sizes of about 7–8 nm. The valence state of the Eu ion (Eu3+) was verified through the characteristic Eu 3d peaks in XPS spectra. The 1LOZnO RS peak red-shifted from 573.11 to 566.89 cm−1 as the Eu concentration increased from 0–7%, indicating the strong binding between Eu3+ ions and the ZnO host. The PL spectra of samples display both the intrinsic emission of the ZnO host and the characteristic sharp emission lines of Eu3+ ions, corresponding to transitions 5D0 → 7F0 (575 nm), 5D0 → 7F1 (589 nm), 5D0 → 7F2 (619 nm), 5D0 → 7F3 (654 nm), and 5D0 → 7F4 (701 nm). The important parameters such as Ω2 and Ω4, branching ratios, and radiative lifetimes were determined using the Judd–Ofelt (JO) theory. The obtained Ω2 and Ω4 values indicate that the degree of asymmetry, covalent bonding, and moderate hardness around the Eu3+ ions in ZnO![[thin space (1/6-em)]](https://www.rsc.org/images/entities/char_2009.gif) :
:![[thin space (1/6-em)]](https://www.rsc.org/images/entities/char_2009.gif) Eu3+ QDs allow for flexible control of the mechanical or thermal adaptability of the material. The energy transfer process between the ZnO host and the Eu3+ dopant was shown to be highly efficient under the excitation wavelength of 330 nm, enhancing the emission of Eu3+ ions. Based on Reisfeld's approximation, the D–D interaction was determined to be the main mechanism for energy transfer from the ZnO host and the Eu3+ dopant. The energy transfer efficiency from the ZnO host and the Eu3+ dopant increases from 40.9 to 75.4% when the Eu ion concentration increases from 0.5 to 7%. These results highlight the potential of Eu3+-doped ZnO QDs for applications in photonic devices, light-emitting diodes (LEDs), and bio-imaging due to their tunable optical properties and efficient energy transfer mechanisms.
Eu3+ QDs allow for flexible control of the mechanical or thermal adaptability of the material. The energy transfer process between the ZnO host and the Eu3+ dopant was shown to be highly efficient under the excitation wavelength of 330 nm, enhancing the emission of Eu3+ ions. Based on Reisfeld's approximation, the D–D interaction was determined to be the main mechanism for energy transfer from the ZnO host and the Eu3+ dopant. The energy transfer efficiency from the ZnO host and the Eu3+ dopant increases from 40.9 to 75.4% when the Eu ion concentration increases from 0.5 to 7%. These results highlight the potential of Eu3+-doped ZnO QDs for applications in photonic devices, light-emitting diodes (LEDs), and bio-imaging due to their tunable optical properties and efficient energy transfer mechanisms.
Data availability
“The data supporting this study's findings are available on request from the corresponding author, Nguyen Xuan Ca, email: E-mail: canx@tnus.edu.vn.”Conflicts of interest
There are no conflicts to declare.Acknowledgements
This research is funded by Ha Noi University of Industry under grant number 64-2024-RD/HĐ-ĐHCN.References
- N. X. Ca, N. T. Hien, X. Fan, P. V. Do, V. H. Yen, P. V. Hao, L. K. Quynh, T. T. T. Huong and V. X. Quang, RSC Adv., 2023, 13, 27292–27302 RSC
.
- K. C. Cuong, N. T. M. Thuy, X. Fan, P. V. Hao, L. K. Quynh, T. T. T. Huong, N. T. Kien, N. T. K. Van, N. T. Hien, L. N. Dung and N. X. Ca, Chem. Phys. Lett., 2023, 832, 140896 CrossRef CAS
.
- Y. H. Zhang, M. X. Peng, L. J. Yue, J. L. Chen, F. L. Gong, K. F. Xie and S. M. Fang, J. Alloys Compd., 2021, 885, 160988 CrossRef CAS
.
- T. K. Pathak, E. Coetsee-Hugo, H. C. Swart, C. W. Swart and R. E. Kroon, Mater. Sci. Eng., B, 2020, 261, 114780 CrossRef CAS
.
- N. Fifere, A. Airinei, D. Timpu, A. Rotaru, L. Sacarescu and L. Ursu, J. Alloys Compd., 2018, 757, 60–69 CrossRef CAS
.
- A. F. V. Fonseca, R. L. Siqueira, R. Landers, J. L. Ferrari, N. L. Marana, J. R. Sambrano, F. A. La Porta, M. A. Schiavon and J. Alloy, Compd, 2018, 739, 939–947 CrossRef
.
- M. Bian, H. Zhang, J. Zhang and Z. Li, Optik, 2020, 209, 164607 CrossRef CAS
.
- A. Maity, S. Jana, S. Ghosh and S. Sharma, J. Non-Cryst. Solids, 2020, 550, 120322 CrossRef CAS
.
- N. Che Ani, M. Z. Sahdan, N. Nayan, F. Adriyanto and K. M. Wibowo, Mater. Sci. Eng., B, 2022, 276, 115536 CrossRef CAS
.
- Q. Li, Y. Zhang, M. Zhang, W. Cheng, B. Liao and M. Ying, J. Alloys Compd., 2023, 933, 167744 CrossRef CAS
.
- K. A. Malik, J. H. Malik, A. A. Bhat, I. Assadullah and R. Tomar, Vacuum, 2021, 183, 109832 CrossRef CAS
.
- N. Jin, H. Li, F. Liu and Y. H. Xie, J. Nanosci. Nanotechnol., 2016, 16, 3592–3596 CrossRef CAS
.
- P. M. Tan, N. X. Ca, N. T. Hien, H. T. Van, P. V. Do, L. D. Thanh, V. H. Yen, V. P. Tuyen, Y. Peng and P. T. Tho, Phys. Chem. Chem. Phys., 2020, 22, 6266 RSC
.
- N. T. Hien, Y. Y. Yu, K. C. Park, N. X. Ca, T. T. K. Chi, B. T. T. Hien, L. D. Thanh, P. V. Do, P. M. Tan and P. T. T. Ha, J. Phys. Chem. Solids, 2021, 148, 109729 CrossRef CAS
.
- P. O. Maldonado, A. K. Chavez-Alvarado, F. J. R. Gutierrez, J. R. Miranda, D. Y. M. Velazquez, M. A. Barron and E. G. García, Open J. Appl. Sci., 2018, 08, 441–445 CAS
.
- X. Gong, H. Jiang, M. Cao, Z. Rao, X. Zhao and A. Vomiero, Mater. Chem. Front., 2021, 5, 4746–4755 RSC
.
- M. Kumar, G. Singh and M. S. Chauhan, Ceram. Int., 2021, 47, 17023–17033 CrossRef CAS
.
- V. Kumar, V. Kumar, S. Som, M. M. Duvenhage, O. M. Ntwaeaborwa and H. C. Swart, Appl. Surf. Sci., 2014, 308, 419–430 CrossRef CAS
.
- M. Pal, N. R. Mathews, E. R. Morales, J. M. G. Jiménez and X. Mathew, Opt. Mater., 2013, 35, 2664–2669 CrossRef CAS
.
- A. L. Patterson, Phys. Rev., 1939, 56, 978 CrossRef CAS
.
- R. Singh, A. King and B. B. Nayak, Optik, 2021, 247, 167870 CrossRef CAS
.
- O. M. Ntwaeaborwa, S. J. Mofokeng, V. Kumar and R. E. Kroon, Spectrochim. Acta, Part A, 2017, 182, 42–49 CrossRef CAS
.
- L. F. Koao, F. B. Dejene, R. E. Kroon and H. C. Swart, J. Lumin., 2014, 147, 85–89 CrossRef CAS
.
- H. Chemingui, J. C. Mzali, T. Missaoui, M. Konyar, M. Smiri and H. C. Yatmaz, Desalin. Water Treat., 2021, 209, 402–413 CrossRef
.
- R. Al-Gaashani, S. Radiman, A. R. Daud, N. Tabet and Y. Al-Douri, Ceram. Int., 2013, 39, 2283–2292 CrossRef CAS
.
- N. T. M. Thuy, T. T. T. Huong, N. T. Hien, N. T. Luyen, N. T. Kien, N. T. K. Van, P. M. Tan, N. D. Vinh, T. Ngoc and N. X. Ca, Phys. Chem. Chem. Phys., 2024, 26, 25488–25500 RSC
.
- S. H. Jaafar, M. H. Mohd Zaid, K. A. Matori, Y. Yaakob and H. M. Mustapha, Braz. J. Phys., 2021, 52, 6 CrossRef
.
- F. Otieno, M. Airo, R. M. Erasmus, A. Quandt, D. G. Billing and D. Wamwangi, Sci. Rep., 2020, 10, 8557 CrossRef CAS
.
- A. Kumawat, S. Chattopadhyay and K. P. Misra, Mater. Technol., 2023, 38, 1–12 Search PubMed
.
- N. X. Ca, N. T. Hien, P. V. Do, V. H. Yen, K. C. Cuong, P. N. Thu, L. T. Lam, L. N. Dung, L. K. Quynh and P. V. Hao, RSC Adv., 2023, 13, 36455 RSC
.
- C. Vatankhah and A. Ebadi, Res. J. Recent Sci., 2013, 2, 21–24 CAS
.
- S. Baskoutas and A. F. Terzis, Mater. Sci. Eng., B, 2008, 147, 280–283 CrossRef CAS
.
- I. Perlikowski, E. Zielony, A. Lysak, R. Jakieła and E. Przeździecka, Cryst. Growth Des., 2024, 24, 6691–6700 CrossRef CAS
.
- R. F. Zhuo, H. T. Feng, Q. Liang, J. Z. Liu, J. T. Chen, D. Yan, J. J. Feng, H. J. Li, S. Cheng and B. S. Geng, J. Phys. D: Appl. Phys., 2008, 41, 185405 CrossRef
.
- T. J. Castro, A. Franco, H. V. S. Pessoni, P. A. M. Rodrigues, P. C. Morais and S. W. Silva, J. Alloys Compd., 2017, 691, 416–421 CrossRef CAS
.
- H. Richter, Z. P. Wang and L. Ley, Solid State Commun., 1981, 39, 625–629 CrossRef CAS
.
- Y. Tian, B. Chen, R. Hua, J. Sun, L. Cheng, H. Zhong, X. Li, J. Zhang, Y. Zheng, T. Yu, L. Huang and H. Yu, J. Appl. Phys., 2011, 109, 053511 CrossRef
.
- M. R. Dousti, A. R. Molla, A. C. M. Rodrigues and A. S. S. Camargo, Opt. Mater., 2017, 69, 372–377 CrossRef CAS
.
- T. Manohar, R. Naik, S. C. Prashantha, H. Nagabhushana, S. C. Sharma, H. P. Nagaswarupa, K. S. Anantharaju, C. Pratapkumar and H. B. Premkumar, Dyes Pigm., 2015, 122, 22 CrossRef CAS
.
- N. T. Q. Lien, N. N. Trac, P. V. Do and H. V. Tuyen, J. Phys. Chem. Solids, 2022, 164, 110637 CrossRef CAS
.
- V. P. Tuyen, V. X. Quang, P. V. Do, L. D. Thanh, N. X. Ca, V. X. Hoa, L. V. Tuat, L. A. Thi and M. Nogami, J. Lumin., 2019, 210, 435 CrossRef CAS
.
- S. C. Lal, A. M. Aiswarya, K. S. Sibi and G. Subodh, J. Alloys Compd., 2019, 788, 1300–1308 CrossRef CAS
.
- A. K. Sreelekshmi, S. C. Lal, S. Ganesanpotti and J. Alloy, Compd, 2022, 905, 164138 CrossRef CAS
.
- M. Łysień, K. Fiączyk, R. Tomala, F. Granek and W. Stręk, J. Rare Earths, 2019, 37, 1121–1125 CrossRef
.
- D. Thomas, H. O. Lee, K. C. Santiago, M. Pelzer, A. Kuti, L. J. Treadwell and M. Bahoura, Dalton Trans., 2022, 51, 264–273 RSC
.
- C. S. McCamy, Color Res. Appl., 1992, 17, 142 CrossRef
.
- N. T. Kien, V. D. Lam, P. V. Duong, N. T. Hien, N. T. Luyen, P. V. Do, N. T. Binh and N. X. Ca, RSC Adv., 2024, 14, 3712 RSC
.
| This journal is © The Royal Society of Chemistry 2025 |

