Regulation of closed pores in hard carbon for enhanced electrochemical sodium storage†
Ziying
Zhang
a,
Yingxinjie
Wang
b,
Kejian
Tang
a,
Zerui
Chen
b,
Xiaohui
Li
b,
Nan
Zhang
 b,
Zhenjun
Wu
*a and
Xiuqiang
Xie
 *b
*b
aCollege of Chemistry and Chemical Engineering, Hunan University, Changsha 410082, P. R. China. E-mail: wooawt@hnu.edu.cn
bCollege of Materials Science and Engineering, Hunan University, Changsha 410082, P. R. China. E-mail: xiuqiang_xie@hnu.edu.cn
First published on 6th February 2025
Abstract
The development of hard carbon materials with high plateau capacity as anode materials for sodium-ion batteries (SIBs) is crucial to improving the energy density of SIBs, while the closed pores are closely related to the low-voltage (<0.1 V) plateau capacity of hard carbon anodes. Herein, through a simple ZnO template method and acid treatment, a wealth of closed pores were created in the hard carbon material derived from camellia shells. Experimental results reveal the mechanism of sodium ions adsorption at the defect sites and the formation of sodium clusters in the closed pores, which corresponds to the slope region and the plateau region, respectively. Notably, being beneficial to the considerable closed pore content and suitable microstructure, the optimized sample exhibits a high reversible capacity of 340 mA h g−1, which is mainly contributed by the low-voltage plateau process (51%). This work provides a new strategy for precisely regulating the microstructure of biomass-derived hard carbon for sodium-ion storage.
New conceptsBiomass hard carbons are being explored as anode materials for sodium-ion batteries due to the wide availability and excellent battery features. Among them, the design of hard carbons with abundant closed pores suitable for accommodating sodium clusters is an effective strategy to improve the plateau capacity at low voltage to improve the energy density of the actual full cell. In our work, the closed pore content and microstructure parameters (layer spacing, La, Lc, AD/AG) of biomass-derived hard carbon were precisely regulated to improve the electrochemical Na+ storage performance, especially at low voltage. In order to further expand its commercialization potential, we assembled it with commercial Na3V2(PO4)3 (NVP) cathode material for full battery assembly, and finally demonstrated excellent cycling performance at high current density. These results further demonstrate the application potential of carbon materials with well-developed closed pores and provides insights into the microscopic structural regulation of closed pores in biomass-derived hard carbon materials. |
Introduction
Lithium-ion batteries (LIBs) have been widely used in various fields because of their high energy density and long cycle life.1–3 But the limited and unevenly distributed lithium resources limit their further application.4–6 As alternatives to LIBs, the advantages of low cost and abundant resources endow sodium-ion batteries (SIBs) with great competitiveness.7–10 However, graphite anodes, which are widely used in LIBs, are not suitable for SIBs due to the inherent kinetics and thermodynamic limitations.11,12 In contrast, hard carbon materials can provide satisfactory sodium-ion storage capacity due to their abundant graphite microcrystals, defects and pores.13–15 However, the complex structure of hard carbons makes it challenging to achieve precise structural regulation and improve the sodium storage capacity.16–19During the working process of SIBs, the charge–discharge curve of hard carbon is mainly divided into two regions, the high-voltage slope region (>0.1 V) and the low-voltage plateau region (<0.1 V),20,21 in which the performance in the low-voltage plateau region is essential to improve the energy density of the actual full cell.22 Previous studies have shown that plateau capacity is closely related to closed pores filling of sodium ions.23 The closed pores can not only improve the plateau capacity of hard carbons as effective active sites accommodating a large number of sodium ions, but also sieve out solvated sodium ions to limit the decomposition of electrolytes.24,25 Therefore, it is an effective strategy to improve plateau capacity by designing hard carbon with abundant closed pores suitable for accommodating sodium clusters.26–28 Increasing carbonization temperature is most commonly used to construct closed pores.29 At higher temperatures, the highly active carbon radicals can be repaired and the conjugated carbon structures will be reorganized. Consequently, a large number of open pores will be transformed into closed pores.30–32 However, the number of closed pores constructed by increasing the carbonization temperature is limited. Meanwhile, as the temperature increases, the sharp decrease in interlayer distance will limit the diffusion of sodium ions into closed pores, which is not conducive to the improvement of plateau capacity. Therefore, developing a simple and effective strategy to construct suitable porous structures remains a key factor in achieving high-capacity SIBs.
In this work, using camellia shells as raw material, hard carbon materials with high closed pores content and suitable microstructure were prepared by using the template method and acid treatment, which improved sodium-ion storage. The reversible capacity of the optimized hard carbon anode reached 340 mA h g−1 at 50 mA g−1, in which the plateau capacity was 174 mA h g−1, accounting for 51% of the total capacity. In addition, various characterization tests revealed that the high-voltage slope capacity and low-voltage plateau capacity were derived from the adsorption of sodium ions at the defect sites and the formation of sodium clusters in the closed pores, respectively.
This work highlights the application potential of carbon materials with well-developed closed pores and provides insights into the microscopic structural regulation of closed pores at the molecular level in biomass-derived hard carbon materials.
Experimental section
Materials preparation
The original camellia shells (CS) from Pingjiang County, Hunan Province were ball-milled into powder. The 1.2 g obtained powder and 0.1 g zinc acetate were dispersed in 15 mL deionized water, stirred at room temperature for 6 h, thoroughly mixed, centrifuged and freeze-dried. The dried sample was annealed at 600 °C for 2 h at a heating rate of 5 °C min−1 under an argon atmosphere. The intermediate product obtained is named ZCS6. Next, ZCS6 was placed in 1 mol L−1 hydrochloric acid solution at room temperature and stirred for 1 h, then washed with deionized water until pH = 7, dry at 60 °C, named ZHCS6. Finally, ZHCS6-13 was obtained by carbonizing ZHCS6 at 600 °C for 2 h at a heating rate of 5 °C min−1 in an argon atmosphere. ZCS6 is directly carbonized to obtain ZCS6-13, and HCS6-13 is prepared from powder that is not mixed with zinc acetate without any other steps being changed. The sample that was not mixed with zinc acetate and was not acid-treated and only carbonized by two steps was named CS6-13.Material characterization
The morphologies and elemental mapping analysis of the hard materials were studied by field emission scanning electron microscopy (SEM, JEOLJSM-7800F, Japan) and transmission electron microscopy (TEM, FEI Titan G2 60–300) with energy dispersive X-ray spectroscopy (EDS). The X-ray diffraction (XRD, Rigaku Smart Lab, USA with Cu Kα radiation) analysis and Raman (WITec, alpha300 R with a 532 nm laser source) spectra were conducted to explore the crystal structures and degrees of graphitization for the hard materials. The chemical properties of the surface were investigated by X-ray photoelectron spectroscopy (XPS, Thermo Scientific K-Alpha). The sample porosity was analyzed by the N2 absorption–desorption test (Micromeritics ASAP 2460) at 298 K, and the Brunauer–Emmett–Teller (BET) method was used to calculate the specific surface area. Closed pores were characterized by small-angle X-ray scattering (SAXS, Xenocs Xeuss 2.0). AccuPyc II 1340 instrument using helium as an analytical gas to measure the true density.Electrochemical measurements
The CR-2023 button battery was assembled in an argon atmosphere glove box (H2O < 0.01 ppm, O2 < 0.01 ppm) for electrochemical measurements. The active material, acetylene black and polyvinylidene fluoride (PVDF) were mixed at 8![[thin space (1/6-em)]](https://www.rsc.org/images/entities/char_2009.gif) :
:![[thin space (1/6-em)]](https://www.rsc.org/images/entities/char_2009.gif) 1
1![[thin space (1/6-em)]](https://www.rsc.org/images/entities/char_2009.gif) :
:![[thin space (1/6-em)]](https://www.rsc.org/images/entities/char_2009.gif) 1 mass ratio and dispersed in an appropriate amount of N-methyl-2-pyrrolidone (NMP) to make a slurry. The slurry was then coated on the copper foil and dried under vacuum at 60 °C. Finally, the resulting electrode is cut into a 12 mm circular electrode. The half-cell uses sodium foil as the counter electrode, and glass fiber (Whatman, GF/F) and 1 M NaClO4 in ethylene carbonate/diethyl carbonate (EC/DEC, 1
1 mass ratio and dispersed in an appropriate amount of N-methyl-2-pyrrolidone (NMP) to make a slurry. The slurry was then coated on the copper foil and dried under vacuum at 60 °C. Finally, the resulting electrode is cut into a 12 mm circular electrode. The half-cell uses sodium foil as the counter electrode, and glass fiber (Whatman, GF/F) and 1 M NaClO4 in ethylene carbonate/diethyl carbonate (EC/DEC, 1![[thin space (1/6-em)]](https://www.rsc.org/images/entities/char_2009.gif) :
:![[thin space (1/6-em)]](https://www.rsc.org/images/entities/char_2009.gif) 1 by volume) with 5 vol% addition of fluoroethylene carbonate (FEC) are selected as the separator and electrolyte, respectively. The galvanostatic charge/discharge profiles and galvanostatic intermittent titration technique (GITT) were carried out by the Land CT2001A system (Wuhan, China) in a voltage window of 0.01–2.8 V at 25 °C. The cyclic voltammetry (CV) measurements and electrochemical impedance spectroscopy (EIS) spectra were tested on an electrochemical workstation (CHI660E Chenhua, Shanghai) at scan rates of 0.1, 0.2, 0.4, 0.6, 0.8 and 1.0 mV s−1. The sodium-ion full cells were assembled using a ZHCS6-13 anode and a commercial Na3V2(PO4)3 (NVP) cathode at an N/P ratio of 1–1.05 (the electrolyte and separator are the same as the half-cell). The voltage ranges of charge and discharge are 1.5–4 V for full cells.
1 by volume) with 5 vol% addition of fluoroethylene carbonate (FEC) are selected as the separator and electrolyte, respectively. The galvanostatic charge/discharge profiles and galvanostatic intermittent titration technique (GITT) were carried out by the Land CT2001A system (Wuhan, China) in a voltage window of 0.01–2.8 V at 25 °C. The cyclic voltammetry (CV) measurements and electrochemical impedance spectroscopy (EIS) spectra were tested on an electrochemical workstation (CHI660E Chenhua, Shanghai) at scan rates of 0.1, 0.2, 0.4, 0.6, 0.8 and 1.0 mV s−1. The sodium-ion full cells were assembled using a ZHCS6-13 anode and a commercial Na3V2(PO4)3 (NVP) cathode at an N/P ratio of 1–1.05 (the electrolyte and separator are the same as the half-cell). The voltage ranges of charge and discharge are 1.5–4 V for full cells.
Result and discussion
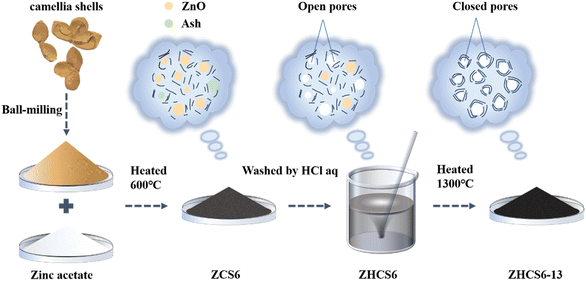
The synthesis process of ZHCS6-13 is illustrated in Fig. 1.Typically, zinc acetate was mixed with the camellia shells after ball milling, and in the process of pre-carbonization at 600 °C, ZnO particles were formed in the precursor carbon as the nanopore templates. In the subsequent acid treatment stage, excess ZnO particles and ash in the precursor were removed, creating open pores at these locations. Finally, after high temperature carbonization at 1300 °C, the open pores gradually formed closed pores, and the ZnO embedded in the precursor carbon matrix catalyzed graphitization,33 thereby promoting the development of graphite domains and facilitating the formation of closed pores. At the same time, ZnO is volatilized and removed at high temperature by carbothermal reaction (ZnO + C → Zn↑ + CO↑) to avoid excessive impurities in hard carbon affecting the electrochemical performance.34–36 Moreover, for comparison, ZCS6-13 is not treated with hydrochloric acid, and HCS6-13 is prepared from powder that is not mixed with zinc acetate with other steps unchanged. The sample prepared by the two-step carbonization but without zinc acetate and acid treatment was denoted as CS6-13.
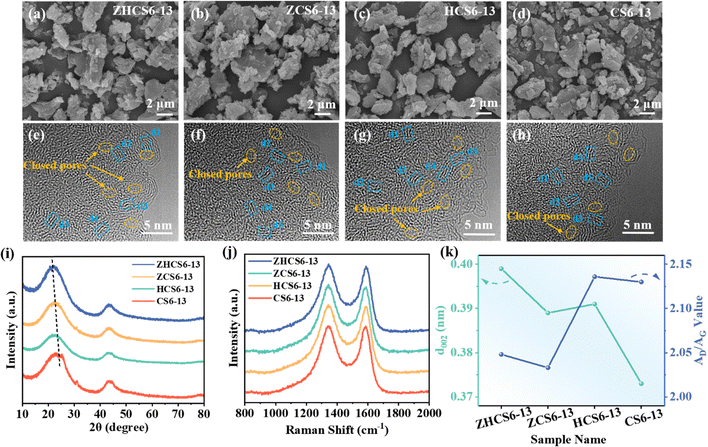
The microstructure of the prepared samples was analyzed by scanning electron microscopy (SEM) and transmission electron microscopy (TEM). As shown in Fig. 2a–d, the four samples all show irregular morphology with similar particle sizes. TEM images show that the prepared samples are composed of turbostratic graphitic domains (blue dotted box) and nanopores of varied dimensions, including open pores and closed pores (yellow dotted circle), which can be regarded as the gap between the randomly oriented turbostratic graphite domains (Fig. 2e–h). In general, pores are open when their cavities and holes are connected with the outside of the porous solid, while pores in solids that don’t communicate with the external surface and cannot be penetrated by fluids are defined as closed pores.37,38 These closed pores facilitate the storage of sodium in the plateau region to form quasi-metallic sodium clusters.39,40 These results are also evidence of the successful preparation of the hard carbon derived from camellia shells. In addition, Fig. S1 (ESI†) shows the carbon layer spacing measured by TEM, in which the average carbon layer spacing of ZHCS6-13, ZCS6-13, HCS6-13, and CS6-13 are 0.41, 0.39, 0.40, and 0.37 nm, respectively. It can be seen that the carbon layer spacing increases both after the ZnO template method or acid treatment, which is conducive to the rapid transport of ions.
The XRD and Raman tests were carried out to further distinguish the microstructure of samples. As displayed in Fig. 2i, the XRD patterns of all samples show two broad diffraction peaks at ≈ 23° and ≈ 44°, which are associated with the (002) and (100) crystalline plane of the typical graphite nanodomains in the hard carbon, respectively.41–43 Notably, the (002) peaks of the other three samples all shift to a lower degree compared with CS6-13, indicating an increase in interlayer distance,44 which is consistent with the results measured through TEM (Fig. 2k and Fig. S1, ESI†). A peak at around 32° is observed in the XRD patterns of the samples without acid treatment (ZCS6-13 and CS6-13), but it disappears in the acid-treated sample (ZHCS6-13 and HCS6-13), which is related to the inorganic compositions of the raw material.45 In addition, as shown in Fig. S2 (ESI†), the diffraction peaks of ZnO in ZHCS6 disappeared, indicating that most of the ZnO nanoparticles were removed after hydrochloric acid treatment. Meanwhile, the SEM image and the corresponding EDS mapping results further demonstrate the removal of ZnO on the surface of ZHCS6 (Fig. S3, ESI†). The residual ZnO is completely removed at a higher temperature carbonization of 1300 °C (Fig. 2i and Fig. S4, ESI†). Subsequently, to further analyze the microstructure changes of the samples, the Scherrer equations were used to calculate the average graphite domain length (La) and the graphite crystallite thickness (Lc).46 As displayed in Table S1 (ESI†), compared with that of CS6-13 (La ≈ 4.20 nm, Lc ≈ 0.98 nm), the samples treated with zinc acetate (ZHCS6-13, ZCS6-13) have the largest La (4.25 nm, 4.35 nm), Lc (0.99 nm, 1.00 nm), which indicates that ZnO can effectively promote the development of graphite domains in hard carbons. In the samples only treated with acid (HCS6-13), La (3.95 nm) and Lc (0.96 nm) values were smaller than that of CS6-13, indicating that acid treatment can hinder the development of graphite domains to a certain extent. Modulation of the defect structure of hard carbon can improve the storage capacity of hard carbon and optimize the solid electrolyte interface (SEI) film.47 Therefore, we further studied the surface defects of carbon materials using Raman spectroscopy. The Raman spectra of the samples are exhibited in Fig. 2j, where characteristic broad D and G peaks located at ∼1345 and ∼1590 cm−1 are assigned to disordered defects in the carbon layer and graphitic sp2 carbon, respectively.48,49 The Raman spectra were further fitted by the Gaussian function (Fig. S5, ESI†),50 and the calculated area ratios of D-band and G-band (AD/AG) are shown in Fig. 2k, which is used to evaluate the disorder of carbon materials. ZHCS6-13 and ZCS6-13 exhibit smaller AD/AG values (2.05, 2.03) than CS6-13, (2.13) and HCS6-13 exhibits a larger AD/AG value (2.14) compared to CS6-13 (2.13), which is consistent with the XRD results, indicating that the ZnO particles in the samples can catalyze local graphitization, while the acid treatment alone increases the disorder of the samples. However, too high degree of graphitization or disorder is not conducive to sodium ions storage.35,51 Therefore, the synthesized hard carbon only has the most suitable graphite domains and disorder when the biomass is treated simultaneously by acid treatment and ZnO template method. This is beneficial for the formation of larger interlayer spacing and abundant closed pores during the subsequent high temperature carbonization process, which provides the possibility to improve the sodium storage capacity.
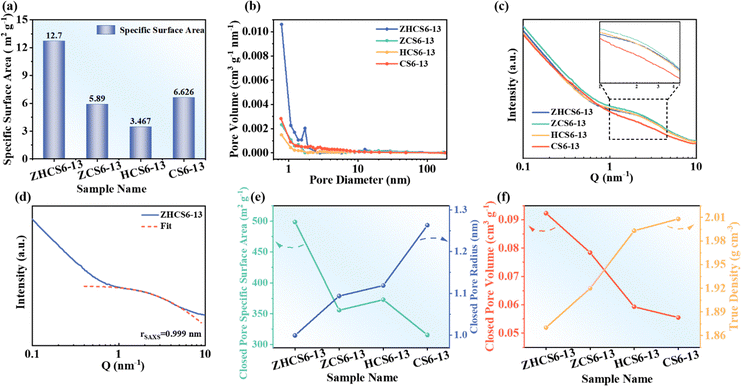
To observe the specific surface area and pore structure of the open pores (connected to the external environment), N2 adsorption–desorption tests were performed. As shown in Fig. 3a, b, Fig. S6 and Table S1 (ESI†), ZHCS6-13 has the largest specific surface area and the most abundant micropores, which are conducive to promoting the adsorption of sodium ions, thus promoting the penetration of electrolytes. The closed pore structure was investigated by small angle X-ray scattering (SAXS) and true density tests. As displayed in Fig. 3c, the four samples exhibit discernible shoulder peaks at about 0.1 Å−1 derived from nanopore (including open pores and closed pores) scattering.36,40 As shown in Fig. 3d, e, Fig. S7 and Table S1 (ESI†), the fitting and calculated results reveal that ZHCS6-13 has the smallest closed pore radius (rSAXS). Closed pores with smaller radius are more conducive to sodium ions storage, mainly because the average sodium binding energy of small clusters is stronger and the interaction with the pore wall is enhanced, which is consistent with the ionic properties of sodium.40,47 The total specific surface area (SSAXS) from open pores and closed pores can be determined from the SAXS parameters using the semi-empirical Teubner–Strey model,50,52 and by subtracting the specific surface area (SBET) measured by N2 adsorption–desorption, the closed pore specific surface area (Sclosed![[thin space (1/6-em)]](https://www.rsc.org/images/entities/char_2009.gif) pores) is obtained. As depicted in Fig. 3e, the closed pore surface area of ZHCS6-13, ZCS6-13, HCS6-13, and CS6-13 are 499, 356, 373, 315 m2 g−1, respectively. Of all the samples, ZHCS6-13 has the largest Sclosed
pores) is obtained. As depicted in Fig. 3e, the closed pore surface area of ZHCS6-13, ZCS6-13, HCS6-13, and CS6-13 are 499, 356, 373, 315 m2 g−1, respectively. Of all the samples, ZHCS6-13 has the largest Sclosed![[thin space (1/6-em)]](https://www.rsc.org/images/entities/char_2009.gif) pores, while CS6-13 has the smallest Sclosed
pores, while CS6-13 has the smallest Sclosed![[thin space (1/6-em)]](https://www.rsc.org/images/entities/char_2009.gif) pores. It is speculated that under high temperature carbonization, ZnO catalyzes large graphite domains to shrink the pores and form closed pores, and acid treatment can also help to transform some open pores into closed pores. The synergistic effects make ZHCS6-13 have the largest specific surface area of closed pores, which is essential to achieve excellent electrochemical performance.
pores. It is speculated that under high temperature carbonization, ZnO catalyzes large graphite domains to shrink the pores and form closed pores, and acid treatment can also help to transform some open pores into closed pores. The synergistic effects make ZHCS6-13 have the largest specific surface area of closed pores, which is essential to achieve excellent electrochemical performance.
The true density test is a powerful complementary tool to SAXS, and the closed pore volume (Vclosed![[thin space (1/6-em)]](https://www.rsc.org/images/entities/char_2009.gif) pores) can be calculated by comparing the true density of hard carbon (ρtrue) with that of ideal graphite, which is considered to have no closed pores and provides the highest true density (2.26 g cm−3).25,26 As shown in Fig. 3f, the trend change of the closed pore volume is consistent with the SAXS results. These results show that the ZHCS6-13 has abundant closed pores suitable for sodium ions storage by the ZnO template method and acid treatment, which is conducive to improving the sodium storage capacity and further improving the electrochemical performance.
pores) can be calculated by comparing the true density of hard carbon (ρtrue) with that of ideal graphite, which is considered to have no closed pores and provides the highest true density (2.26 g cm−3).25,26 As shown in Fig. 3f, the trend change of the closed pore volume is consistent with the SAXS results. These results show that the ZHCS6-13 has abundant closed pores suitable for sodium ions storage by the ZnO template method and acid treatment, which is conducive to improving the sodium storage capacity and further improving the electrochemical performance.
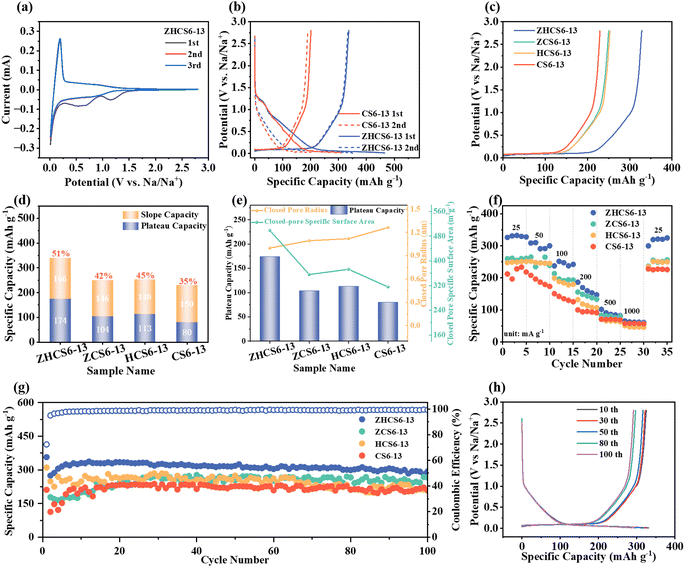
To deeply investigate the electrochemical sodium storage performance of samples, we performed electrochemical measurements in half-cells. The CV curves with a voltage range of 0.01–2.8 V were first carried out (Fig. 4a and Fig. S8, ESI†). During the initial scan, all samples showed irreversible broad peaks, which is attributed to irreversible electrolyte decomposition and SEI film formation.53 The CV curves almost overlapped in the next two cycles, suggesting that the SEI layer formation occurs primarily in the first cycle. In addition, all samples exhibit a sharp oxidation/reduction peak at around 0.1 V, corresponding to the reversible sodium filling in the closed pores.40,54 In line with the CV curve, the GCD curve for all samples is also divided into two parts, including the low-voltage plateau region and the high-voltage sloping region (Fig. 4b and Fig. S9, ESI†), corresponding to sodium ions adsorbed on defective structures and sodium ions filled in closed pore structures, respectively. The initial two cycles of charge/discharge curves of the ZHCS6-13 anode exhibit a higher degree of overlap compared with the CS6-13 anode, indicating superior sodium ion storage reversibility. Additionally, ZHCS6-13 displayed an increase in initial discharge and charge specific capacity, reaching to 465 and 337 mA h g−1, respectively, with a higher initial Coulombic efficiency (ICE) value of 73% compared with the CS6-13 anode (65%). According to previous reports,24,55 solvated sodium ions can enter open pores, but not closed pores. The accessibility of pores to solvated sodium ions usually causes significant side reactions that reduce the ICE of hard carbons. As mentioned above, although the specific surface area of open pores of ZHCS6-13 is larger than CS6-13, since the solvated sodium ions present in the electrolyte are larger than the N2, the surface area determined by gas adsorption doesn’t necessarily represent the contact area between the liquid electrolyte and the electrode active materials.56 In addition, the closed pore content of ZHCS6-13 is much higher than that of CS6-13, which results in a higher ICE for ZHCS6-13 due to the difference in pore distribution between the two. These results further suggest that ZHCS6-13 has less irreversible electrolyte decomposition and formed thinner and more stable SEI films during the initial GCD process.
As displayed in Fig. 4c and d, the increase in sodium storage ability is mainly proportion to the enhanced plateau capacities, from 80 mA h g−1 (35%) of CS6-13 to 174 mA h g−1 (51%) of ZHCS6-13. To further investigate the effect of closed pores structure on plateau capacity, we further explore the relationship between the specific surface area and the mean radius of closed pores and plateau capacity. As shown in Fig. 4e and Fig. S10 (ESI†), smaller rSAXS and larger Sclosed![[thin space (1/6-em)]](https://www.rsc.org/images/entities/char_2009.gif) pores are conducive to the filling of sodium ions in pores, and the plateau capacity of the samples has a amazing linear relationship with the specific surface area of the closed pores (R2 = 0.996), which is conducive to improving the plateau capacities. Therefore, the synergistic effect of acid treatment and the ZnO template enable hard carbon to enables suitable closed pore radius and more closed pores for sodium ions storage, thus contributing to enhanced plateau capacity. Notably, ZHCS6-13 demonstrated exceptional specific capacity/plateau capacity that surpasses the majority of reported biomass derived hard carbon anodes (Table S3, ESI†).
pores are conducive to the filling of sodium ions in pores, and the plateau capacity of the samples has a amazing linear relationship with the specific surface area of the closed pores (R2 = 0.996), which is conducive to improving the plateau capacities. Therefore, the synergistic effect of acid treatment and the ZnO template enable hard carbon to enables suitable closed pore radius and more closed pores for sodium ions storage, thus contributing to enhanced plateau capacity. Notably, ZHCS6-13 demonstrated exceptional specific capacity/plateau capacity that surpasses the majority of reported biomass derived hard carbon anodes (Table S3, ESI†).
Fig. 4f and Fig. S11 (ESI†) show the rate performance of samples. ZHCS6-13 exhibits the highest average capacity. In addition, when the current density is switched back to 25 mA g−1, the capacity of the optimized carbon anodes can be restored to the initial level, demonstrating the robust structure of the closed pores and significant reversibility. Cycling stability tests were conducted at a current rate of 50 mA g−1 (Fig. 4g). As shown in Fig. 4h, the GCD curves of different cycles can coincide well, which indicates the excellent stability of sodium ions storage. This can be attributed to the fact that ZHCS6-13 has abundant and appropriately sized closed pores that provide more sodium ions storage sites in the low-voltage plateau region. The SEI has a significant impact on the ICE, cycling stability and charge transfer kinetics of the battery. Therefore, X-ray photoelectron spec-troscopy (XPS) analysis of ZHCS6-13 was conducted to analyze the composition of SEI after cycling. As shown in Fig. S12 (ESI†), the XPS results of the ZHCS6-13 electrode after cycling indicate that the SEI is composed of C, O and F. The Na–F groups in F 1s peaks may result from the decomposition of FEC.57 The SEI of the ZHCS6-13 electrode contains a high concentration of inorganic components (sodium carbonate, sodium fluoride), particularly those containing F, which helps to improve the interface stability and efficient transport of sodium ions at the anode/electrolyte interphase.45 These findings are consistent with the formation of stable SEI layers and excellent electrochemical properties.
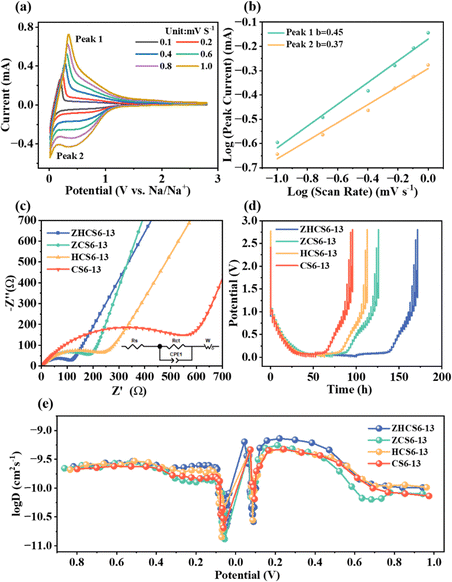
CV measurements were carried out at various scan rates from 0.1 to 1 mV s−1 (Fig. 5a) to gain a deep insight into the reaction kinetics of the hard carbons. The relationship between scan rate (ν) and peak current (i) follows the eqn (1):35
| i = avb | (1) |
| i = k1v + k2v1/2 | (2) |
As displayed in Fig. 5c, the diffusion characteristics of the samples were analyzed by electrochemical impedance spectroscopy (EIS). The Nyquist plot consists of a semicircle at the high/middle-frequency regions and a line at the low- frequency region, corresponding to the charge-transfer resistance and ion diffusion resistance in the electrode, respectively. ZHCS6-13 has the smallest charge transfer resistance of 113 Ω (Table S2, ESI†), which indicates that microstructure regulation improves the electrical conductivity of the hard carbon. In addition, the calculation shows that the sloping line in the low-frequency region of ZHCS6-13 is the steepest and has the smallest impedance coefficient (Fig. S14, ESI†), showing fast transfer kinetics. This may be because the samples after the collaborative treatment have fewer defects and abundant closed pores with appropriate pore size, which collaborately enhance the electrochemical reaction kinetics of sodium ions during charge and discharge processes.
The sodium ions diffusion kinetics of the hard carbon anodes were studied by galvanostatic intermittent titration technique (GITT) measurements,60 which is shown in Fig. 5d. The diffusion coefficient of sodium ions can be calculated by a simplified form of Fick's second law eqn (3).24
 | (3) |
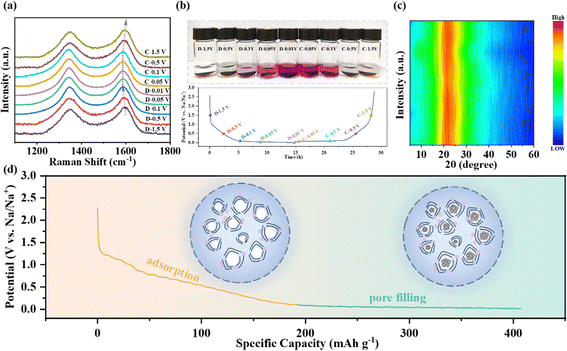
To study the mechanisms of sodium storage in the charge and discharge process, ex situ Raman, ex situ XRD and phenolphthalein tests were carried out. As displayed in Fig. 6a and Fig. S15a (ESI†), the G band shows a gradual red-shift from 1596 to 1586 cm−1 upon sodiation along the sloping region above 0.1 V, demonstrating that the electrons are transferred to the graphene sheets due to the adsorption of sodium ions.62 In the plateau region below 0.1 V, the G band remains almost unchanged, indicating that electrons are no longer transferred to the graphene sheets.53 Additionally, the color change of phenolphthalein ethanol solution was obvious during the whole charge–discharge process, as shown in Fig. 6b and Fig. S15b (ESI†). In particular, a clear red color appears in the voltage range of 0.1–0.01 V, which verifies the formation of quasi-metallic sodium inside the closed pores in the low-voltage plateau region.62 Moreover, the formation and disappearance of the red color indicate the reversible evolution of the quasi-metallic sodium in the process of sodiation/desodiation. Furthermore, ex situ XRD shows that the position of the (002) peak has no obvious shift under different voltages (Fig. 6c), indicating that there is no significant sodium ion intercalation behavior in the pseudo-graphite structure in the whole charge–discharge process. Through comprehensive analysis of the above test results, the mechanism of sodium storage of the hard carbon is summarized in Fig. 6d. The slope capacity in the high-voltage region is attributed to the adsorption of sodium ions at the defect sites, while the plateau capacity in the low-voltage region is due to the closed pore filling of sodium clusters. Therefore, ZHCS6-13 with the largest number of closed pores has the best plateau capacity, which is conducive to the improvement of sodium storage performance.
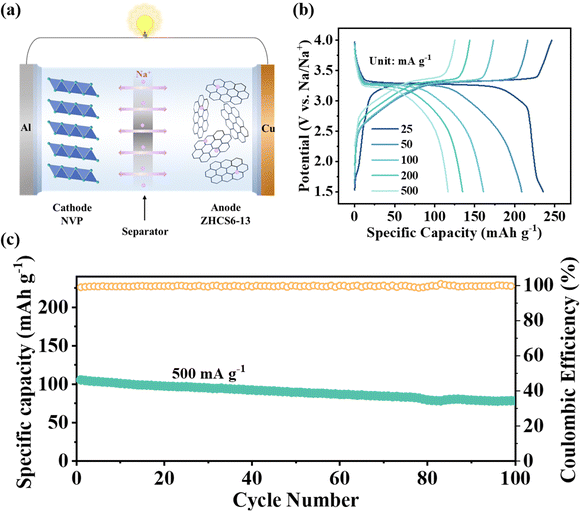
As shown in Fig. 7a, to further evaluate the practical application prospect of the ZHCS6-13 anode, full sodium-ion cells were assembled by using the ZHCS6-13 anode and Na3V2(PO4)3 (NVP) cathode. The electrochemical performances of the NVP cathode in Na half-cells are displayed in Fig. S16 (ESI†). The GCD curves of ZHCS6-13//NVP at different current densities ranging from 25 to 500 mA g−1 are shown in Fig. 7b, clearly demonstrating stable charge/discharge voltage plateaus within the range of 3–3.5 V, indicating distinguished electrochemical stability. In addition, the full cells provide a high reversible capacity of 246 mA h g−1 (based on the mass of the anode material) at a current rate of 25 mA g−1. As displayed in Fig. 7c, high capacity and cycling stability with a retention rate of 75% at a higher current of 500 mA g−1 after 100 cycles. Furthermore, the energy density (E, W h kg−1) and power density (P, W kg−1) of the sodium-ion full cells can be calculated by eqn (4) and (5).32,53
 | (4) |
 | (5) |
Conclusions
In summary, we combined the ZnO template method and acid treatment method to regulate the microstructure of hard carbon materials derived from camellia shells and successfully prepared hard carbon anode with high closed pore content. The acid treatment removed the resulting template ZnO and the inorganic ash from the biomass, leaving open pores, which form closed pores in the subsequent high-temperature treatment. The optimized ZHCS6-13 exhibits a considerable closed pore content and a suitable microstructure, with a reversible capacity of 340 mA h g−1 and a plateau capacity of 174 mA h g−1 at 50 mA g−1. The storage performance of sodium ions is greatly improved. According to the ex situ Raman, ex situ XRD and phenolphthalein tests, the mechanism of sodium storage in the slope region and plateau region corresponds to the filling of defect sites and the formation of sodium clusters in closed pores, respectively. This work inspires precisely regulating the microporous structure of biomass-derived hard carbon materials to improve the performance of sodium ions storage and clarifies the intricate mechanism of hard carbon sodium storage derived from camellia shells, providing a theoretical basis for the design of high-performance hard carbon.Author contributions
Ziying Zhang: methodology, conceptualization, investigation, formal analysis, writing – original draft. Yingxinjie Wang: resources, investigation, visualization. Zerui Chen: resources. Xiaohui Li: resources. Nan Zhang: resources. Zhenjun Wu: project administration, supervision, writing – review & editing. Xiuqiang Xie: project administration, supervision, writing – review & editing.Data availability
The data supporting this article have been included as part of the ESI.†Conflicts of interest
There are no conflicts to declare.Acknowledgements
This research was financially supported by the National Natural Science Foundation of China (51977071, 52272295), the Natural Science Foundation of Hunan Province (2017JJ2040, 2020JJ4192) and the Science and Technology Innovation Program of Hunan Province (2021RC3066).Notes and references
- H. Li, Q. Ma, Y. Yuan, R. Wang, Z. Wang, Q. Zhang, L. Zhang, J. Zhu, S. Zhang, J. Mao, H. Li, S. Eliseeva, V. Kondratiev, Y. Zhang, C. Zhang and Y. Wu, Adv. Funct. Mater., 2024, 34, 2301987 CrossRef CAS.
- S. Zhou, Z. Tang, Z. Pan, Y. Huang, L. Zhao, X. Zhang, D. Sun, Y. Tang, A. S. Dhmees and H. Wang, SusMat, 2022, 2, 357–367 CrossRef CAS.
- C. Liu, K. Chen, H. Xiong, A. Zhao, H. Zhang, Q. Li, X. Ai, H. Yang, Y. Fang and Y. Cao, eScience, 2024, 4, 100186 CrossRef.
- Q. Zhang, Z. Wang, S. Zhang, T. Zhou, J. Mao and Z. Guo, Electrochem. Energy Rev., 2018, 1, 625–658 CrossRef CAS.
- Y. Dong, Y. Chen, Q. Zeng, J. Feng, M. Fang, Z. Shi, J. Liu, Y. Sheng, X. Yue and Z. Liang, Energy Mater. Adv., 2024, 5, 0113 CrossRef.
- E. Gabriel, C. Ma, K. Graff, A. Conrado, D. Hou and H. Xiong, eScience, 2023, 3, 100139 CrossRef.
- H. Tang, M. Wang, T. Lu and L. Pan, Ceram. Int., 2017, 43, 4475–4482 CrossRef CAS.
- A. Rudola, C. J. Wright and J. Barker, Energy Mater. Adv., 2021, 2021, 9798460 Search PubMed.
- R. H. Zhang, V. Raveendran, Y. N. He, A. Yau, A. Chang, C. Chi, S. Bong, F. Cheng, W. G. Ma and J. Chen, Energy Mater. Adv., 2021, 2021, 2124862 Search PubMed.
- Q. Li, D. Yang, H. Chen, X. Lv, Y. Jiang, Y. Feng, X. Rui and Y. Yu, SusMat, 2021, 1, 359–392 CrossRef CAS.
- K. Nobuhara, H. Nakayama, M. Nose, S. Nakanishi and H. Iba, J. Power Sources, 2013, 243, 585–587 CrossRef CAS.
- D. A. Stevens and J. R. Dahn, J. Electrochem. Soc., 2001, 148, A803 CrossRef CAS.
- N. Sun, J. Qiu and B. Xu, Adv. Energy Mater., 2022, 12, 2200715 CrossRef CAS.
- D. Chen, W. Zhang, K. Luo, Y. Song, Y. Zhong, Y. Liu, G. Wang, B. Zhong, Z. Wu and X. Guo, Energy Environ. Sci., 2021, 14, 2244–2262 RSC.
- R. Dong, F. Wu, Y. Bai, Q. Li, X. Yu, Y. Li, Q. Ni and C. Wu, Energy Mater. Adv., 2022, 2022, 9896218 Search PubMed.
- X. Chen, N. Sawut, K. Chen, H. Li, J. Zhang, Z. Wang, M. Yang, G. Tang, X. Ai, H. Yang, Y. Fang and Y. Cao, Energy Environ. Sci., 2023, 16, 4041–4053 RSC.
- N. Sun, Z. Guan, Y. Liu, Y. Cao, Q. Zhu, H. Liu, Z. Wang, P. Zhang and B. Xu, Adv. Energy Mater., 2019, 9, 1901351 CrossRef.
- H. Chen, N. Sun, Y. Wang, R. A. Soomro and B. Xu, Energy Storage Mater., 2023, 56, 532–541 CrossRef.
- T. W. Surta, E. Koh, Z. Li, D. B. Fast, X. Ji, P. A. Greaney and M. R. Dolgos, Adv. Energy Mater., 2022, 12, 2200647 CrossRef CAS.
- Y. Chu, J. Zhang, Y. Zhang, Q. Li, Y. Jia, X. Dong, J. Xiao, Y. Tao and Q. H. Yang, Adv. Mater., 2023, 35, 2212186 CrossRef CAS PubMed.
- X. Chen, J. Tian, P. Li, Y. Fang, Y. Fang, X. Liang, J. Feng, J. Dong, X. Ai, H. Yang and Y. Cao, Adv. Energy Mater., 2022, 12, 2200886 CrossRef CAS.
- C. Delmas, Adv. Energy Mater., 2018, 8, 1703137 CrossRef.
- A. Kamiyama, K. Kubota, D. Igarashi, Y. Youn, Y. Tateyama, H. Ando, K. Gotoh and S. Komaba, Angew. Chem., Int. Ed., 2021, 60, 5114–5120 CrossRef CAS PubMed.
- K. Wang, F. Sun, H. Wang, D. Wu, Y. Chao, J. Gao and G. Zhao, Adv. Funct. Mater., 2022, 32, 2203725 CrossRef CAS.
- M. Yuan, B. Cao, H. Liu, C. Meng, J. Wu, S. Zhang, A. Li, X. Chen and H. Song, Chem. Mater., 2022, 34, 3489–3500 CrossRef CAS.
- Y. Li, Y. Lu, Q. Meng, A. C. S. Jensen, Q. Zhang, Q. Zhang, Y. Tong, Y. Qi, L. Gu, M. M. Titirici and Y. S. Hu, Adv. Energy Mater., 2019, 9, 1902852 CrossRef CAS.
- Q. Meng, Y. Lu, F. Ding, Q. Zhang, L. Chen and Y.-S. Hu, ACS Energy Lett., 2019, 4, 2608–2612 CrossRef CAS.
- W. Shao, Q. Cao, S. Liu, T. Zhang, Z. Song, C. Song, Z. Weng, X. Jian and F. Hu, SusMat, 2022, 2, 319–334 CrossRef CAS.
- Y. Morikawa, S. i Nishimura, R. i Hashimoto, M. Ohnuma and A. Yamada, Adv. Energy Mater., 2020, 10, 1903176 CrossRef CAS.
- Y. Chen, Y. Wang, S. Zhu, K. Fu, X. Han, Y. Wang, B. Zhao, T. Li, B. Liu, Y. Li, J. Dai, H. Xie, T. Li, J. W. Connell, Y. Lin and L. Hu, Mater. Today, 2019, 24, 26–32 CrossRef CAS.
- T. Xu, X. Qiu, X. Zhang and Y. Xia, Chem. Eng. J., 2023, 452, 139514 CrossRef CAS.
- X. Zhang, Y. Cao, G. Li, G. Liu, X. Dong, Y. Wang, X. Jiang, X. Zhang and Y. Xia, Small, 2024, 20, 2311197 CrossRef CAS PubMed.
- P. Strubel, S. Thieme, T. Biemelt, A. Helmer, M. Oschatz, J. Brückner, H. Althues and S. Kaskel, Adv. Funct. Mater., 2015, 25, 287–297 CrossRef CAS.
- J. Yang, T. Feng, H. Zhou, C. Hu, Y. Guo, C. Chen, Z. Chen, J. Liu, G. Huang and M. Wu, Cell Rep. Phys. Sci., 2020, 1, 100186 CrossRef.
- X. Yin, Z. Lu, J. Wang, X. Feng, S. Roy, X. Liu, Y. Yang, Y. Zhao and J. Zhang, Adv. Mater., 2022, 34, 2109282 CrossRef CAS PubMed.
- D. Igarashi, Y. Tanaka, K. Kubota, R. Tatara, H. Maejima, T. Hosaka and S. Komaba, Adv. Energy Mater., 2023, 13, 2302647 CrossRef CAS.
- N. Zhang, Q. Liu, W. Chen, M. Wan, X. Li, L. Wang, L. Xue and W. Zhang, J. Power Sources, 2018, 378, 331–337 CrossRef CAS.
- X. Chen, C. Liu, Y. Fang, X. Ai, F. Zhong, H. Yang and Y. Cao, Carbon Energy, 2022, 4, 1133–1150 Search PubMed.
- Z. Zheng, S. Hu, W. Yin, J. Peng, R. Wang, J. Jin, B. He, Y. Gong, H. Wang and H. J. Fan, Adv. Energy Mater., 2024, 14, 2303064 CrossRef CAS.
- L. Kitsu Iglesias, E. N. Antonio, T. D. Martinez, L. Zhang, Z. Zhuo, S. J. Weigand, J. Guo and M. F. Toney, Adv. Energy Mater., 2023, 13, 2302171 CrossRef CAS.
- L. Xiao, H. Lu, Y. Fang, M. L. Sushko, Y. Cao, X. Ai, H. Yang and J. Liu, Adv. Energy Mater., 2018, 8, 1703238 CrossRef.
- Y. Li, Y. S. Hu, X. Qi, X. Rong, H. Li, X. Huang and L. Chen, Energy Storage Mater., 2016, 5, 191–197 CrossRef.
- Z. Xu, J. Wang, Z. Guo, F. Xie, H. Liu, H. Yadegari, M. Tebyetekerwa, M. P. Ryan, Y. S. Hu and M. M. Titirici, Adv. Energy Mater., 2022, 12, 2200208 CrossRef CAS.
- A. Mahmood, Z. Yuan, X. Sui, M. A. Riaz, Z. Yu, C. Liu, J. Chen, C. Wang, S. Zhao, N. Mahmood, Z. Pei, L. Wei and Y. Chen, Energy Storage Mater., 2021, 41, 395–403 CrossRef.
- Q. He, H. Chen, X. Chen, J. Zheng, L. Que, F. Yu, J. Zhao, Y. Xie, M. Huang, C. Lu, J. Meng and X. Zhang, Adv. Funct. Mater., 2024, 34, 2310226 CrossRef CAS.
- B. E. Warren, Phys. Rev., 1941, 59, 693–698 CrossRef CAS.
- D. Sun, L. Zhao, P. Sun, K. Zhao, Y. Sun, Q. Zhang, Z. Li, Z. Ma, F. Zheng, Y. Yang, C. Lu, C. Peng, C. Xu, Z. Xiao and X. Ma, Adv. Funct. Mater., 2024, 34, 2403642 CrossRef CAS.
- S. Feng, K. Li, P. Hu, C. Cai, J. Liu, X. Li, L. Zhou, L. Mai, B.-L. Su and Y. Liu, ACS Nano, 2023, 17, 23152–23159 CrossRef CAS PubMed.
- W. Xu, H. Li, X. Zhang, T. Y. Chen, H. Yang, H. Min, X. Shen, H. Y. Chen and J. Wang, Adv. Funct. Mater., 2024, 34, 2309509 CrossRef CAS.
- L. Shang, R. Yuan, H. Liu, X. Li, B. Zhao, X. Liu, A. Li, X. Chen and H. Song, Carbon, 2024, 223, 119038 CrossRef CAS.
- Z. Huang, X. Qiu, C. Wang, W. Jian, L. Zhong, J. Zhu, X. Zu and W. Zhang, J. Energy Storage, 2023, 72, 108406 CrossRef.
- D. Saurel, J. Segalini, M. Jauregui, A. Pendashteh, B. Daffos, P. Simon and M. Casas-Cabanas, Energy Storage Mater., 2019, 21, 162–173 CrossRef.
- C. Qiu, A. Li, D. Qiu, Y. Wu, Z. Jiang, J. Zhang, J. Xiao, R. Yuan, Z. Jiang, X. Liu, X. Chen and H. Song, ACS Nano, 2024, 18, 11941–11954 CrossRef CAS PubMed.
- P. Bai, Y. He, X. Zou, X. Zhao, P. Xiong and Y. Xu, Adv. Energy Mater., 2018, 8, 1703217 CrossRef.
- Q. Li, Y. Zhu, P. Zhao, C. Yuan, M. Chen and C. Wang, Carbon, 2018, 129, 85–94 CrossRef CAS.
- F. Wang, Z. Jiang, Y. Zhang, Y. Zhang, J. Li, H. Wang, Y. Jiang, G. Xing, H. Liu and Y. Tang, eScience, 2024, 4, 100181 CrossRef.
- M. Y. Sun, B. Liu, Y. Xia, Y. X. Wang, Y. Q. Zheng, L. Wang, L. Deng, L. Zhao and Z. B. Wang, Adv. Mater., 2024, 36, 2311432 CrossRef CAS PubMed.
- P. Lu, Y. Sun, H. Xiang, X. Liang and Y. Yu, Adv. Energy Mater., 2018, 8, 1702434 CrossRef.
- Z. L. Xu, J. Park, G. Yoon, H. Kim and K. Kang, Small, Methods, 2019, 3, 1800227 CAS.
- H. Chen, N. Sun, Q. Zhu, R. A. Soomro and B. Xu, Adv. Sci., 2022, 9, 2200023 CrossRef CAS PubMed.
- Z. Zhu, W. Zhong, Y. Zhang, P. Dong, S. Sun, Y. Zhang and X. Li, Carbon Energy, 2021, 3, 541–553 CrossRef CAS.
- S. Zhang, N. Sun, X. Li, R. A. Soomro and B. Xu, Energy Storage Mater., 2024, 66, 103183 CrossRef.
Footnote |
| † Electronic supplementary information (ESI) available. See DOI: https://doi.org/10.1039/d4nh00551a |
| This journal is © The Royal Society of Chemistry 2025 |

