
The quantity of ligand–receptor interactions between nanoparticles and target cells†
Kathrin
Schorr
 a,
Sebastian
Beck
a,
Oliver
Zimmer
a,
Felix
Baumann
a,
Max
Keller
b,
Ralph
Witzgall
c and
Achim
Goepferich
*a
a,
Sebastian
Beck
a,
Oliver
Zimmer
a,
Felix
Baumann
a,
Max
Keller
b,
Ralph
Witzgall
c and
Achim
Goepferich
*a
aDepartment of Pharmaceutical Technology, University of Regensburg, 93053 Regensburg, Bavaria, Germany. E-mail: achim.goepferich@ur.de; kathrin.schorr@ur.de; sebastianbeck@magenta.de; oliver.zimmer@ur.de; felix.baumann@ur.de; Tel: +49 941 943-4842
bInstitute of Pharmacy, Faculty of Chemistry and Pharmacy, University of Regensburg, D-93040 Regensburg, Germany. E-mail: max.keller@chemie.uni-regensburg.de
cInstitute for Molecular and Cellular Anatomy, University of Regensburg, 93053 Regensburg, Bavaria, Germany. E-mail: ralph.witzgall@vkl.uni-regensburg.de
First published on 6th February 2025
Abstract
Achieving high target cell avidity in combination with cell selectivity are fundamental, but largely unachieved goals in the development of biomedical nanoparticle systems, which are intricately linked to the quantity of targeting functionalities on their surface. Viruses, regarded as almost ideal role models for nanoparticle design, are evolutionary optimized, so that they cope with this challenge bearing an extremely low number of spikes, and thus binding domains, on their surface. In comparison, nanoparticles are usually equipped with more than an order of magnitude more ligands. It is therefore obvious that one key factor for increasing nanoparticle efficiency in terms of avidity and selectivity lies in optimizing their ligand number. A first step along this way is to know how many ligands per nanoparticle are involved in specific binding with target cell receptors. This question is addressed experimentally for a block copolymer nanoparticle model system. The data confirm that only a fraction of the nanoparticle ligands is involved in the binding processes: with a total ligand valency of 29 ligands/100 nm2 surface area a maximum 5.3 ligands/100 nm2 are involved in specific receptor binding. This corresponds to an average number of 251 binding ligands per nanoparticle, a number that can be rationalized within the biological context of the model system.
New conceptsIn our work, we discuss the number of specific ligand–receptor interactions between engineered nanoparticles and their target cells as a decisive factor for cell specificity and selectivity in comparison to the spike density of viruses. Interactions of nanoparticles carrying an antagonist for the angiotensin II receptor type 1 with receptor positive cells show that only a minority of the ligands on the densely functionalized nanoparticle corona were involved in specific interactions with the target cells. We were able to reveal for the first time that the number of specifically binding ligands on the surface of nanoparticles is of the same order of magnitude as the spike density of viruses that are evolutionary optimized. By considering the receptor structure and surface morphology of the target cell line, we were able to plausibly explain the result in the specific biological context. This reveals further optimization potential for engineered nanoparticles in terms of ligand density and structuring. By presenting an experimental approach to quantify the number of binding ligands, we lay the foundation for design strategies that aim at optimizing the number of ligands, which could be the next step in the development of active targeting concepts for biomedical nanoparticles. |
Introduction
Polymeric nanoparticles, which are investigated as innovative platforms for drug delivery and diagnostics, are often equipped with small molecules or peptides as ligands on their surface to achieve high specificity and selectivity to their target sites.1 To further enhance their efficiency, nature is frequently taken as an example. In particular, viruses, adorned with receptor binding domains on their spikes as evolutionarily optimized recognition structures, serve as excellent role models.1,2 There are numerous research strategies that aim to mimic the recognition mechanisms of viruses on cell surfaces.3 However, while the spike density is strongly regulated in viruses, engineered nanoparticles are usually equipped with a significantly higher number of ligands.4 Evidently, the initial contact between the engineered nanoparticles and cells is decisive for recognition and attachment and therefore determines their success or failure.5 Thus, optimizing the number of ligands on their surface is of utmost importance to balance target cell avidity and selectivity.6 Still, a close look at the literature reveals that there is a knowledge gap regarding how many ligands per nanoparticle are involved in the anchoring process and specifically bind to receptors.Attempts have been made to characterize the mechanisms underlying particle association at the cell surface and consequently affecting the number of binding ligands.5,7–9 It is known from thermodynamic considerations that the avidity of the particles is increased by processes and factors that increase the enthalpy gain in the system, such as the specific binding of a ligand to the receptor.10,11 Conversely, the loss of entropy that occurs in multivalent bonds due to the reduction of degrees of freedom has a negative regulating effect.12 Another important parameter is the geometric congruence of the two counterparts. We have recently examined the role of the geometry and curvature of clathrin-coated pits on the avidity of nanoparticles by increasing the number of potential ligand–receptor contacts.13 Mathematical and computational models provide further insights into the binding processes even at the level of individual receptors and deliver preliminary information to clarify the question concerning the stoichiometry of binding.8,12,14 Farokhirad et al. presented a computational approach to predict the number of binding ligands per nanoparticle for a multivalent system depending on particle rigidity and membrane excess area.12 In their study on the biomimetic design of nanoparticles, Yuan et al. found that the sweet spot of the ligand number for optimal uptake conditions of virus particles is in the range of 10 to 100 ligands per virus particle, regardless of particle size.15 Loading the particles with ligands beyond the optimum only leads to intensified competition for receptors, which are a limited source on the cell surface, and therefore to prolonged endocytic time and a lower cellular uptake of the particles. Oppositely, the concept of multivalence fails when the number of ligands drops below a system-specific threshold,16 as the entropy loss predominates.14,15 This confirms and underlines that adjusting the number of ligands to the number actually required for the anchoring process could significantly increase the efficacy of the engineered nanoparticles, also in terms of better uptake rates and optimized uptake kinetics.15–18 Computational studies have the distinct advantage of well-defined and controlled experimental conditions,8 because they are based on a limited number of assumptions. The resulting mathematical and thermodynamic models are consequently associated with simplifications that cannot fully capture the complexity of real conditions.8,19 Quantifying the number of binding ligands per nanoparticle in further experimental studies, would therefore be of paramount relevance for the development of winning multivalent nanoparticle designs.19
The intention of our study was to provide an experimental approach for the quantification of ligand–receptor interactions between functionalized nanoparticles and target cells, which copes with the complexity of the system. Core–shell nanoparticles composed of poly(D,L-lactide-co-glycolide) (PLGA) and a poly(ethylene glycol)-b-poly(D,L-lactide) (PLA–PEG) copolymer were selected as well-established model.1,2 The nanoparticles were functionalized with losartan carboxylic acid (EXP3174), a high-affinity antagonist at the angiotensin-ll type 1 receptor (AT1R), which leads to an endocytosis inhibition of the nanoparticles and therefore enables the detection of surface effects20 on AT1R expressing rat mesangial cells.1 To make the polymer nanoparticles accessible for quantitative detection on the cellular matrix, we implemented selenium21 into the nanoparticles as an ICP-MS tag.22,23 By defining the average number of binding ligands per nanoparticle as a function of half of the number of target receptors on the cell surface divided by the number of nanoparticles attached to the cell membrane, we were able to formulate an experimentally solvable equation. The equation requires the assumption that exactly half of all receptors on the cell surface are occupied by ligands. This can be achieved experimentally if the applied nanoparticle concentration is equal to their equilibrium inhibition constant, Ki.24 Through successive experiments we were able to calculate the average number of binding ligands and furthermore to draw a comparison with viral systems. With our study, we aimed to contribute to a systematic understanding of the interactions between nanoparticles and cells at the level of individual receptors and to a rational design of target cell selective nanoparticles.
Results
Depiction of the underlying model
The engineered nanoparticles chosen as a model for this study were designed as PLGA/PLA–PEG core–shell nanoparticles with a rigid, tethered and spherically enclosed morphology and functionalized with EXP3174 as ligand (Fig. 1 and Fig. S1–S3, ESI†).12,25 EXP3174 was synthesized with a purity of >95% and coupled to the PLA10k–PEG5k block copolymer with a coupling efficiency of at least 98% (Fig. S4 and S5, ESI†). In a previous study, we established a 25% surface functionalization with EXP3174 as the optimal ligand density to ensure sufficient AT1R binding and anchoring of the nanoparticles to the cell surface2 and the degree of functionalization was adopted in the present study (Fig. 1 and Fig. S6, S7, ESI†). Elemental selenium21 was embedded into the nanoparticle core to serve as an ICP-OES and ICP-MS tag for subsequent nanoparticle quantification in the cellular matrix over a wide concentration range (Fig. 2 and Fig. S8, ESI†).22,23 Elemental selenium is unstable in aqueous solution;21 however, it can be stabilized as an amorphous dispersion through the addition of polymers when produced via in situ reduction of water-soluble sodium selenite.21,26,27 Both nanoparticle types, selenium-tagged nanoparticles (25%-EXP-NPs_selenium-containing) and unlabeled polymer nanoparticles (25%-EXP-NPs), were compared in terms of their morphology (Fig. 2), surface charge and size distribution (Fig. 3 and Fig. S8, ESI†) to characterize the impact of the selenium tag.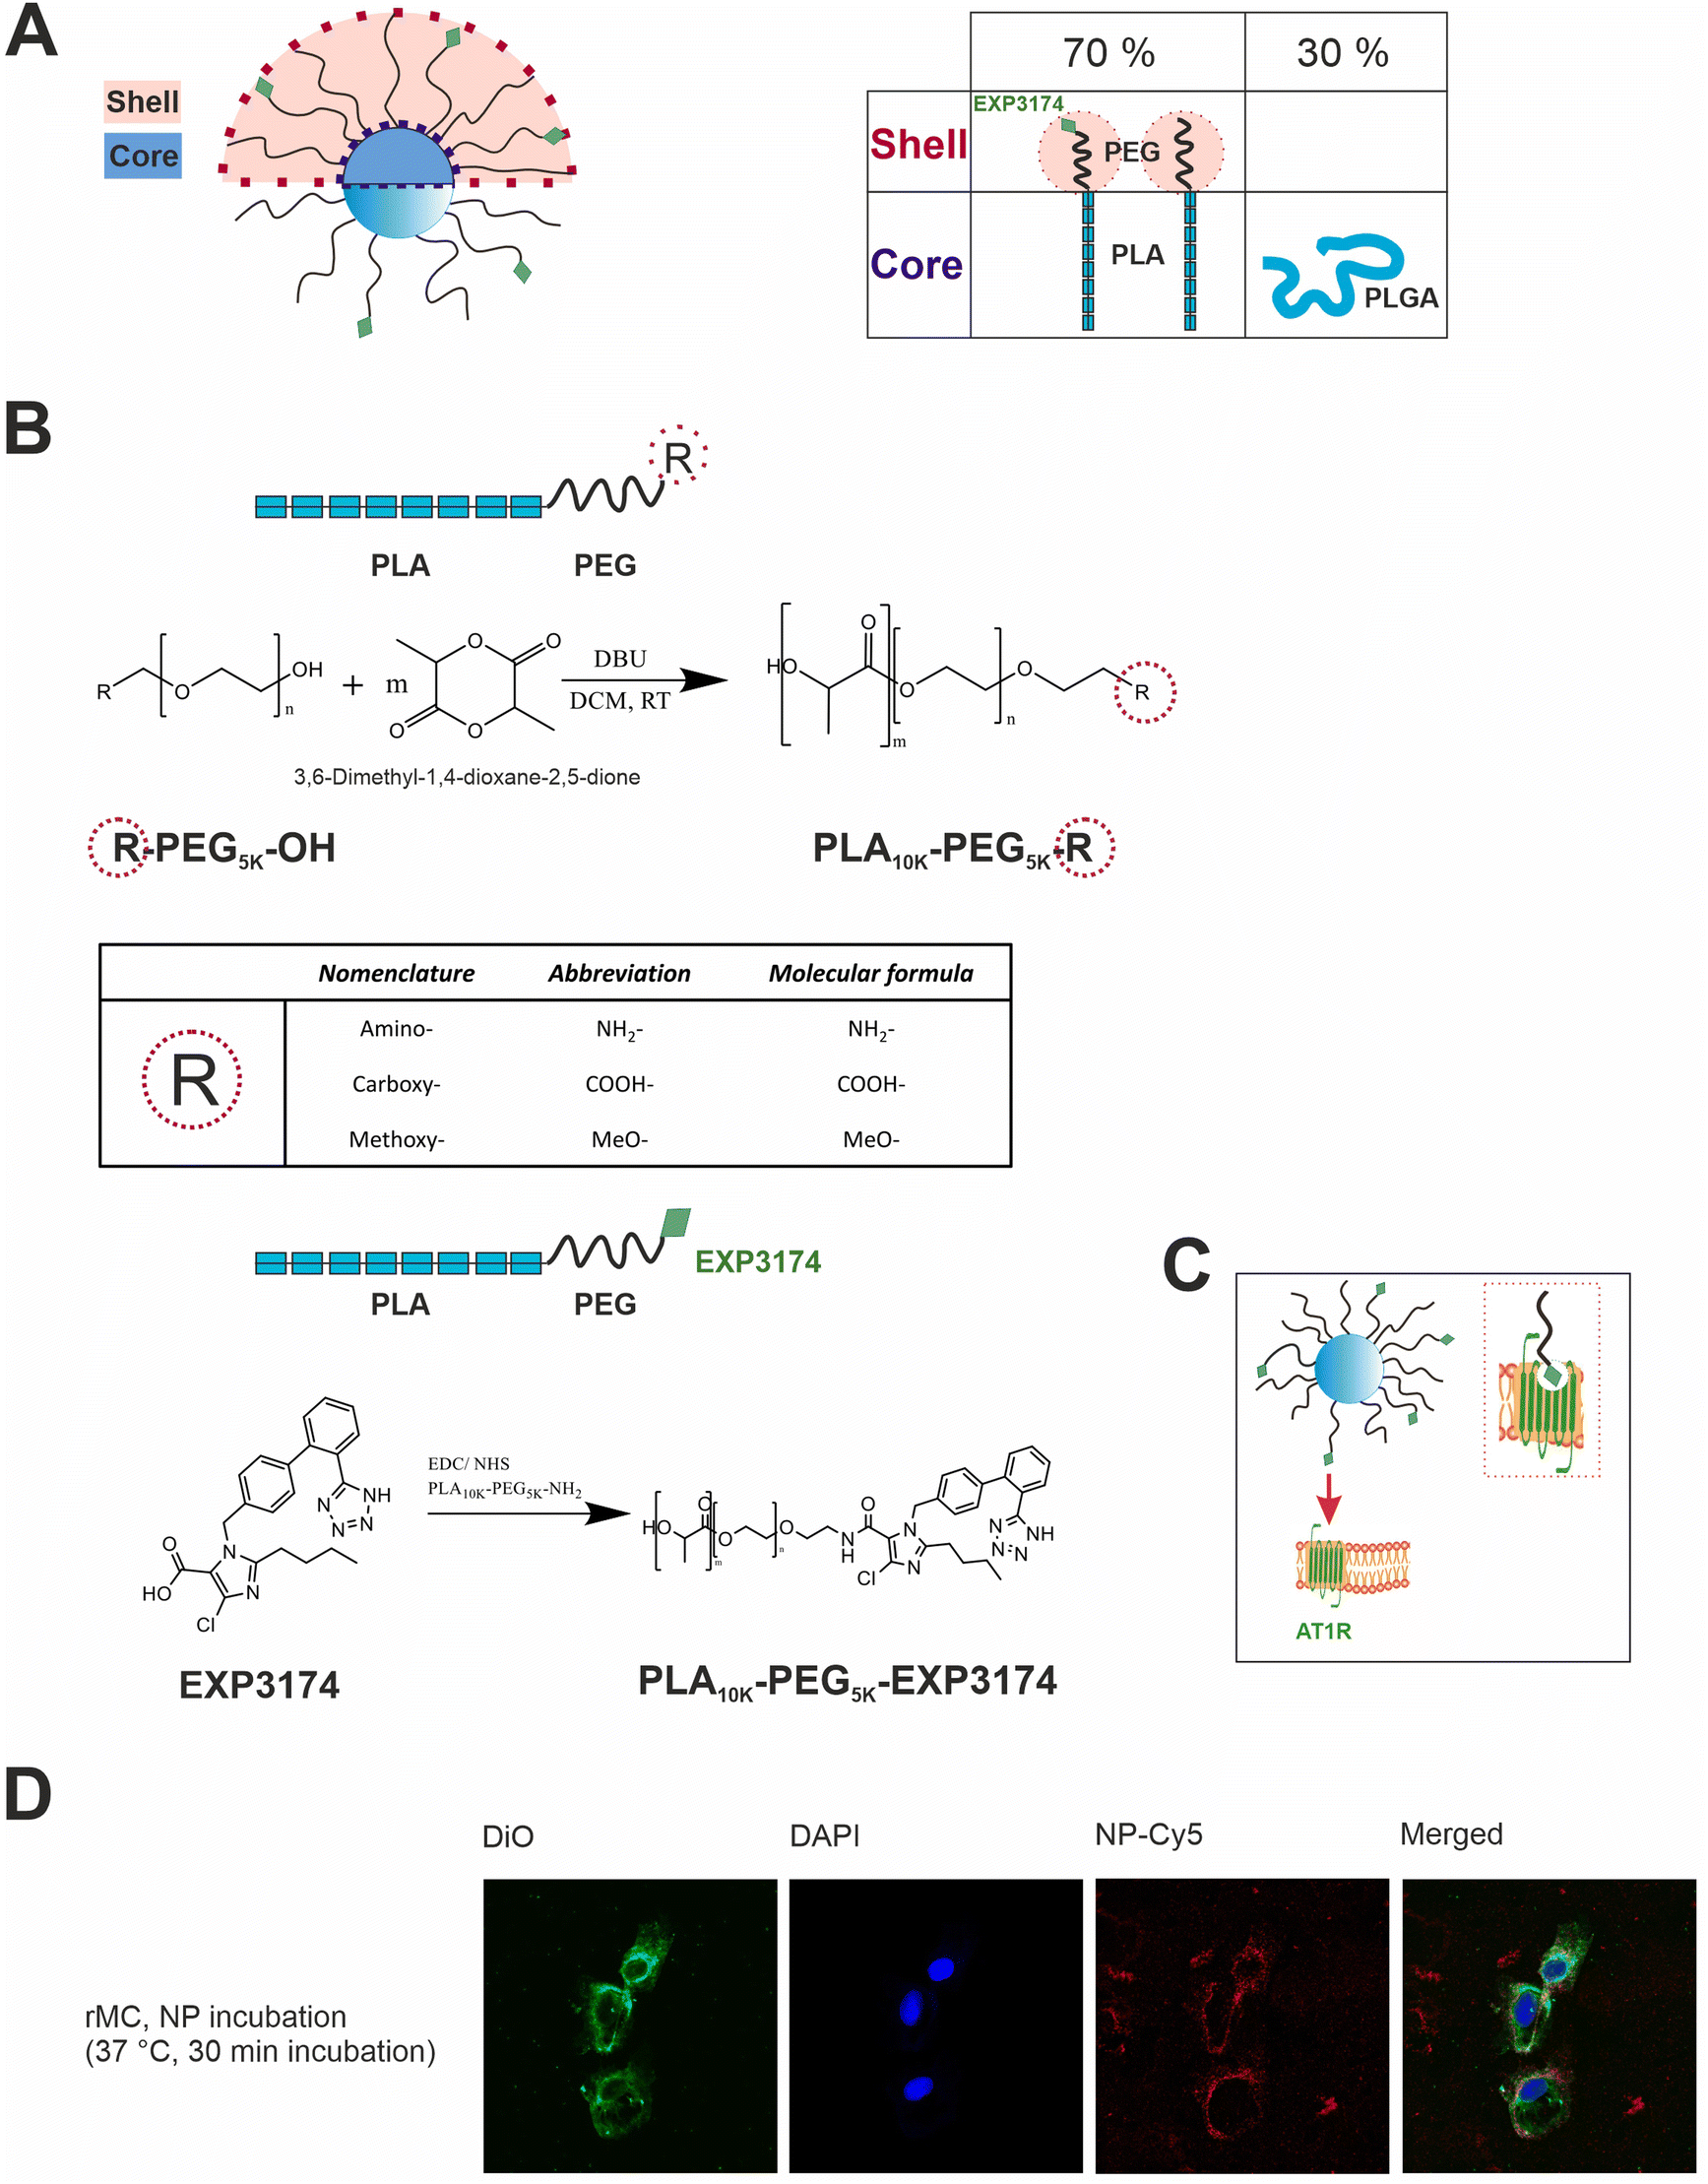 | ||
Fig. 1 Illustration of the design and targeting concept of the polymeric core–shell nanoparticles and their cellular localization. (A) Nanoparticles are obtained by nanoprecipitation of hydrophobic PLGA blends with amphiphilic PLA–PEG block copolymer. By removal of the organic solvent, the water-insoluble polymers self-assemble into core–shell structured nanoparticles. PLGA and PLA are miscible and aggregate in the nanoparticle core due to their higher hydrophobicity,28,29 with the hydrophilic PEG chains extending in a brush-like corona from the core. PLGA and PLA–PEG are used in the ratio 30![[thin space (1/6-em)]](https://www.rsc.org/images/entities/char_2009.gif) :70 (m/m). The use of PLGA as core material enables the incorporation of fluorescent dyes, e.g. CY-5, into the core of the nanoparticles for flow cytometry and microscopic analysis. To create a rigid, tethered and spherically enclosed morphology, both, the ligand-bearing, and the carboxy-terminated spacer chains, which are intended to prevent steric hinderance between the ligand molecules30,31 on the nanoparticle surface, were synthesized as block copolymer chains of the same molecular weight (PEG5k–PLA10k). (B) Schematic reaction equation of ring-opening polymerization, where R indicates the different terminal charges of the PLA–PEG chains, and PLA–PEG chain functionalization with the ligand EXP3174. (C) Illustration of the active targeting concept of the EXP3174-functionalized nanoparticles on the AT1R on the surface of rMCs. EXP3174 acts as a high-affinity antagonist at the AT1R. (D) Confocal laser scanning microscopy images of rMCs incubated with CY-5-labeled 25%-EXP-NPs (red) for 30 min at 37 °C (5% CO2). Cell nuclei were stained with DAPI (blue) and cell membranes were stained with DiO (green). The binding experiment showed that the nanoparticles bound to the cell surface of the rMCs but were not internalized. :70 (m/m). The use of PLGA as core material enables the incorporation of fluorescent dyes, e.g. CY-5, into the core of the nanoparticles for flow cytometry and microscopic analysis. To create a rigid, tethered and spherically enclosed morphology, both, the ligand-bearing, and the carboxy-terminated spacer chains, which are intended to prevent steric hinderance between the ligand molecules30,31 on the nanoparticle surface, were synthesized as block copolymer chains of the same molecular weight (PEG5k–PLA10k). (B) Schematic reaction equation of ring-opening polymerization, where R indicates the different terminal charges of the PLA–PEG chains, and PLA–PEG chain functionalization with the ligand EXP3174. (C) Illustration of the active targeting concept of the EXP3174-functionalized nanoparticles on the AT1R on the surface of rMCs. EXP3174 acts as a high-affinity antagonist at the AT1R. (D) Confocal laser scanning microscopy images of rMCs incubated with CY-5-labeled 25%-EXP-NPs (red) for 30 min at 37 °C (5% CO2). Cell nuclei were stained with DAPI (blue) and cell membranes were stained with DiO (green). The binding experiment showed that the nanoparticles bound to the cell surface of the rMCs but were not internalized. | ||
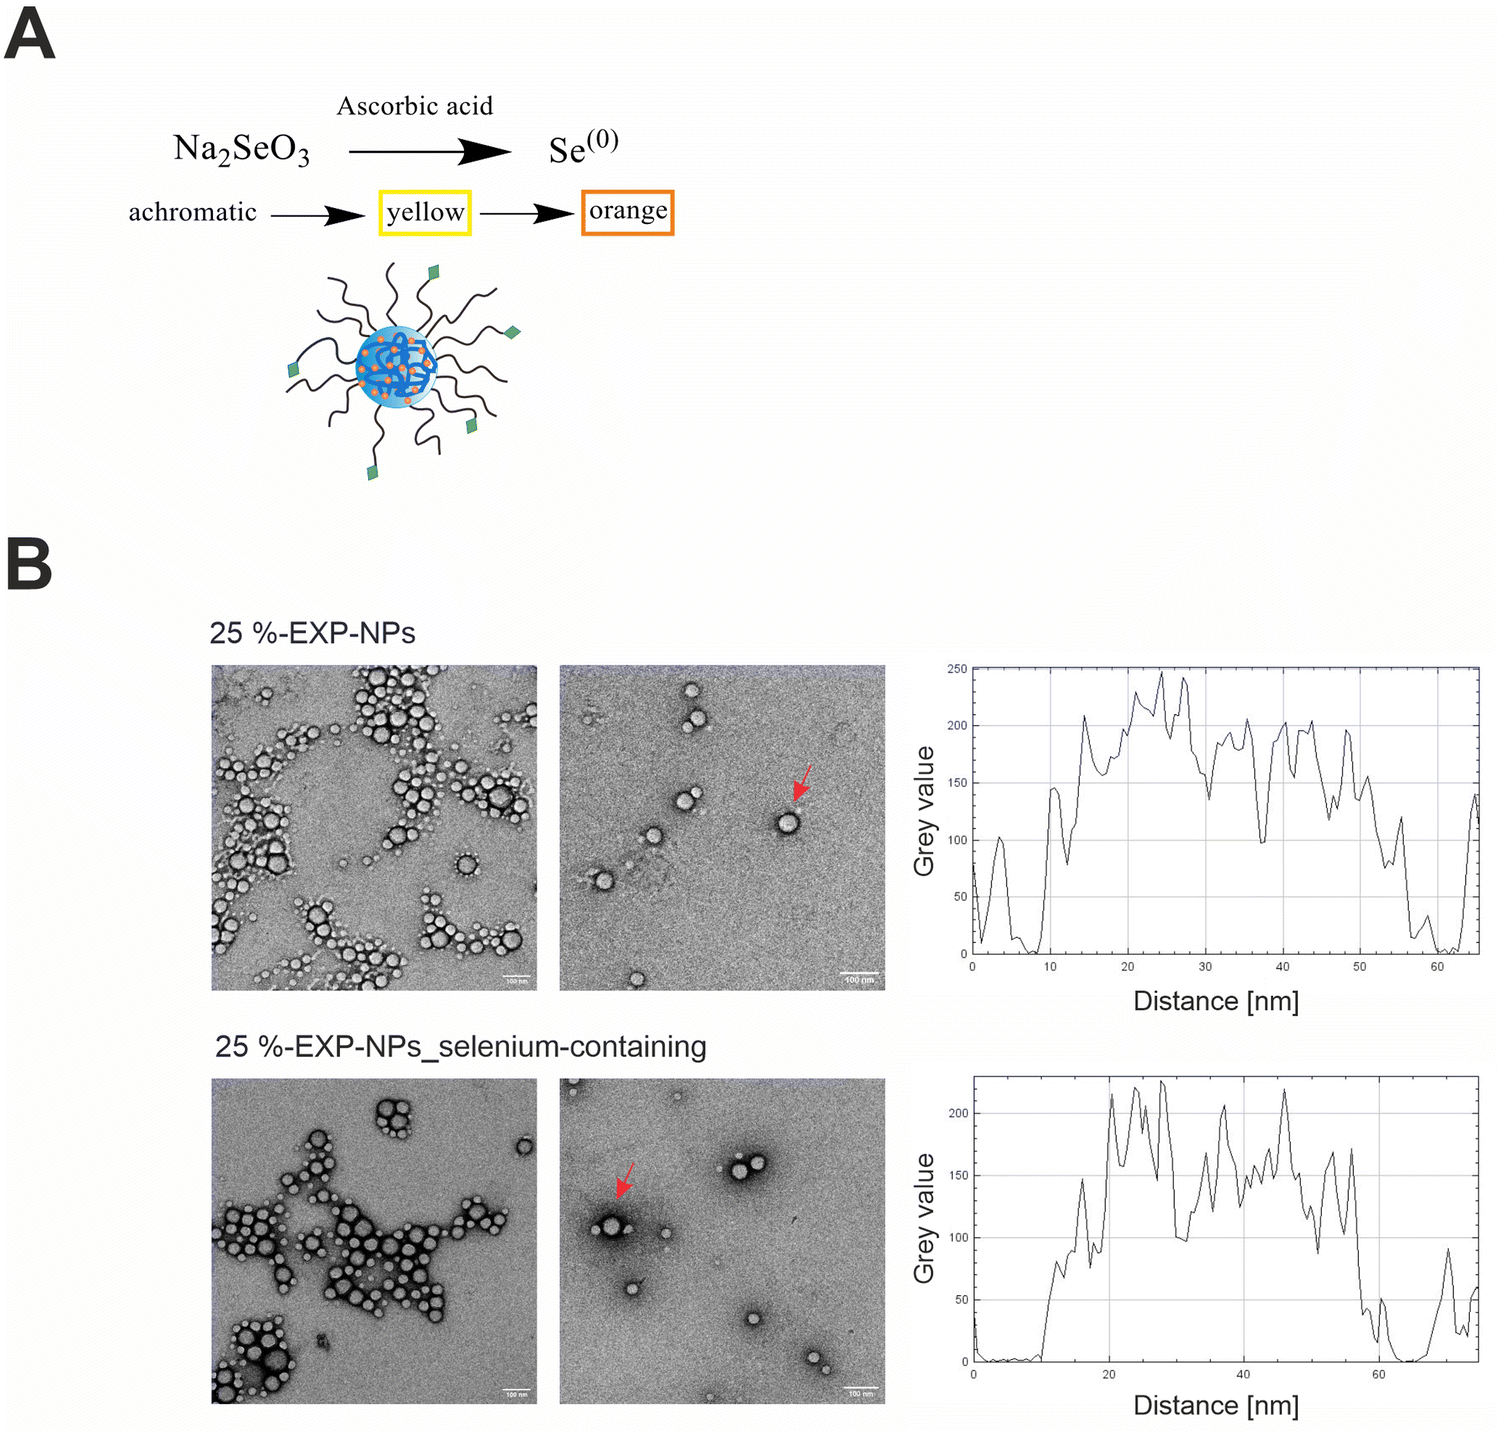 | ||
| Fig. 2 Implementation of selenium as ICP-OES/ICP-MS tag in the polymeric matrix and characterization of the morphology of selenium-containing and selenium-free nanoparticles. (A) Redox reaction of sodium selenite with ascorbic acid to elemental selenium and stabilization of the elemental selenium in the polymeric matrix. The progress of the reaction can be recognized by a color change from achromatic to orange.21 (B) Representative TEM images of selenium-free (25%-EXP-NPs) and selenium-containing nanoparticles (25%-EXP-NPs_selenium-containing) after negative staining with uranyl acetate (scale bar: 100 nm). Shape and integrity of the nanoparticles were confirmed. The grey value of two exemplary nanoparticles, which are comparable in size and marked with red arrows, is plotted. The selenium-containing nanoparticles showed a darker frame, compared to the unlabeled polymeric nanoparticles, indicating an increased atomic mass associated with the incorporated selenium, as more electron beam is absorbed in these areas. | ||
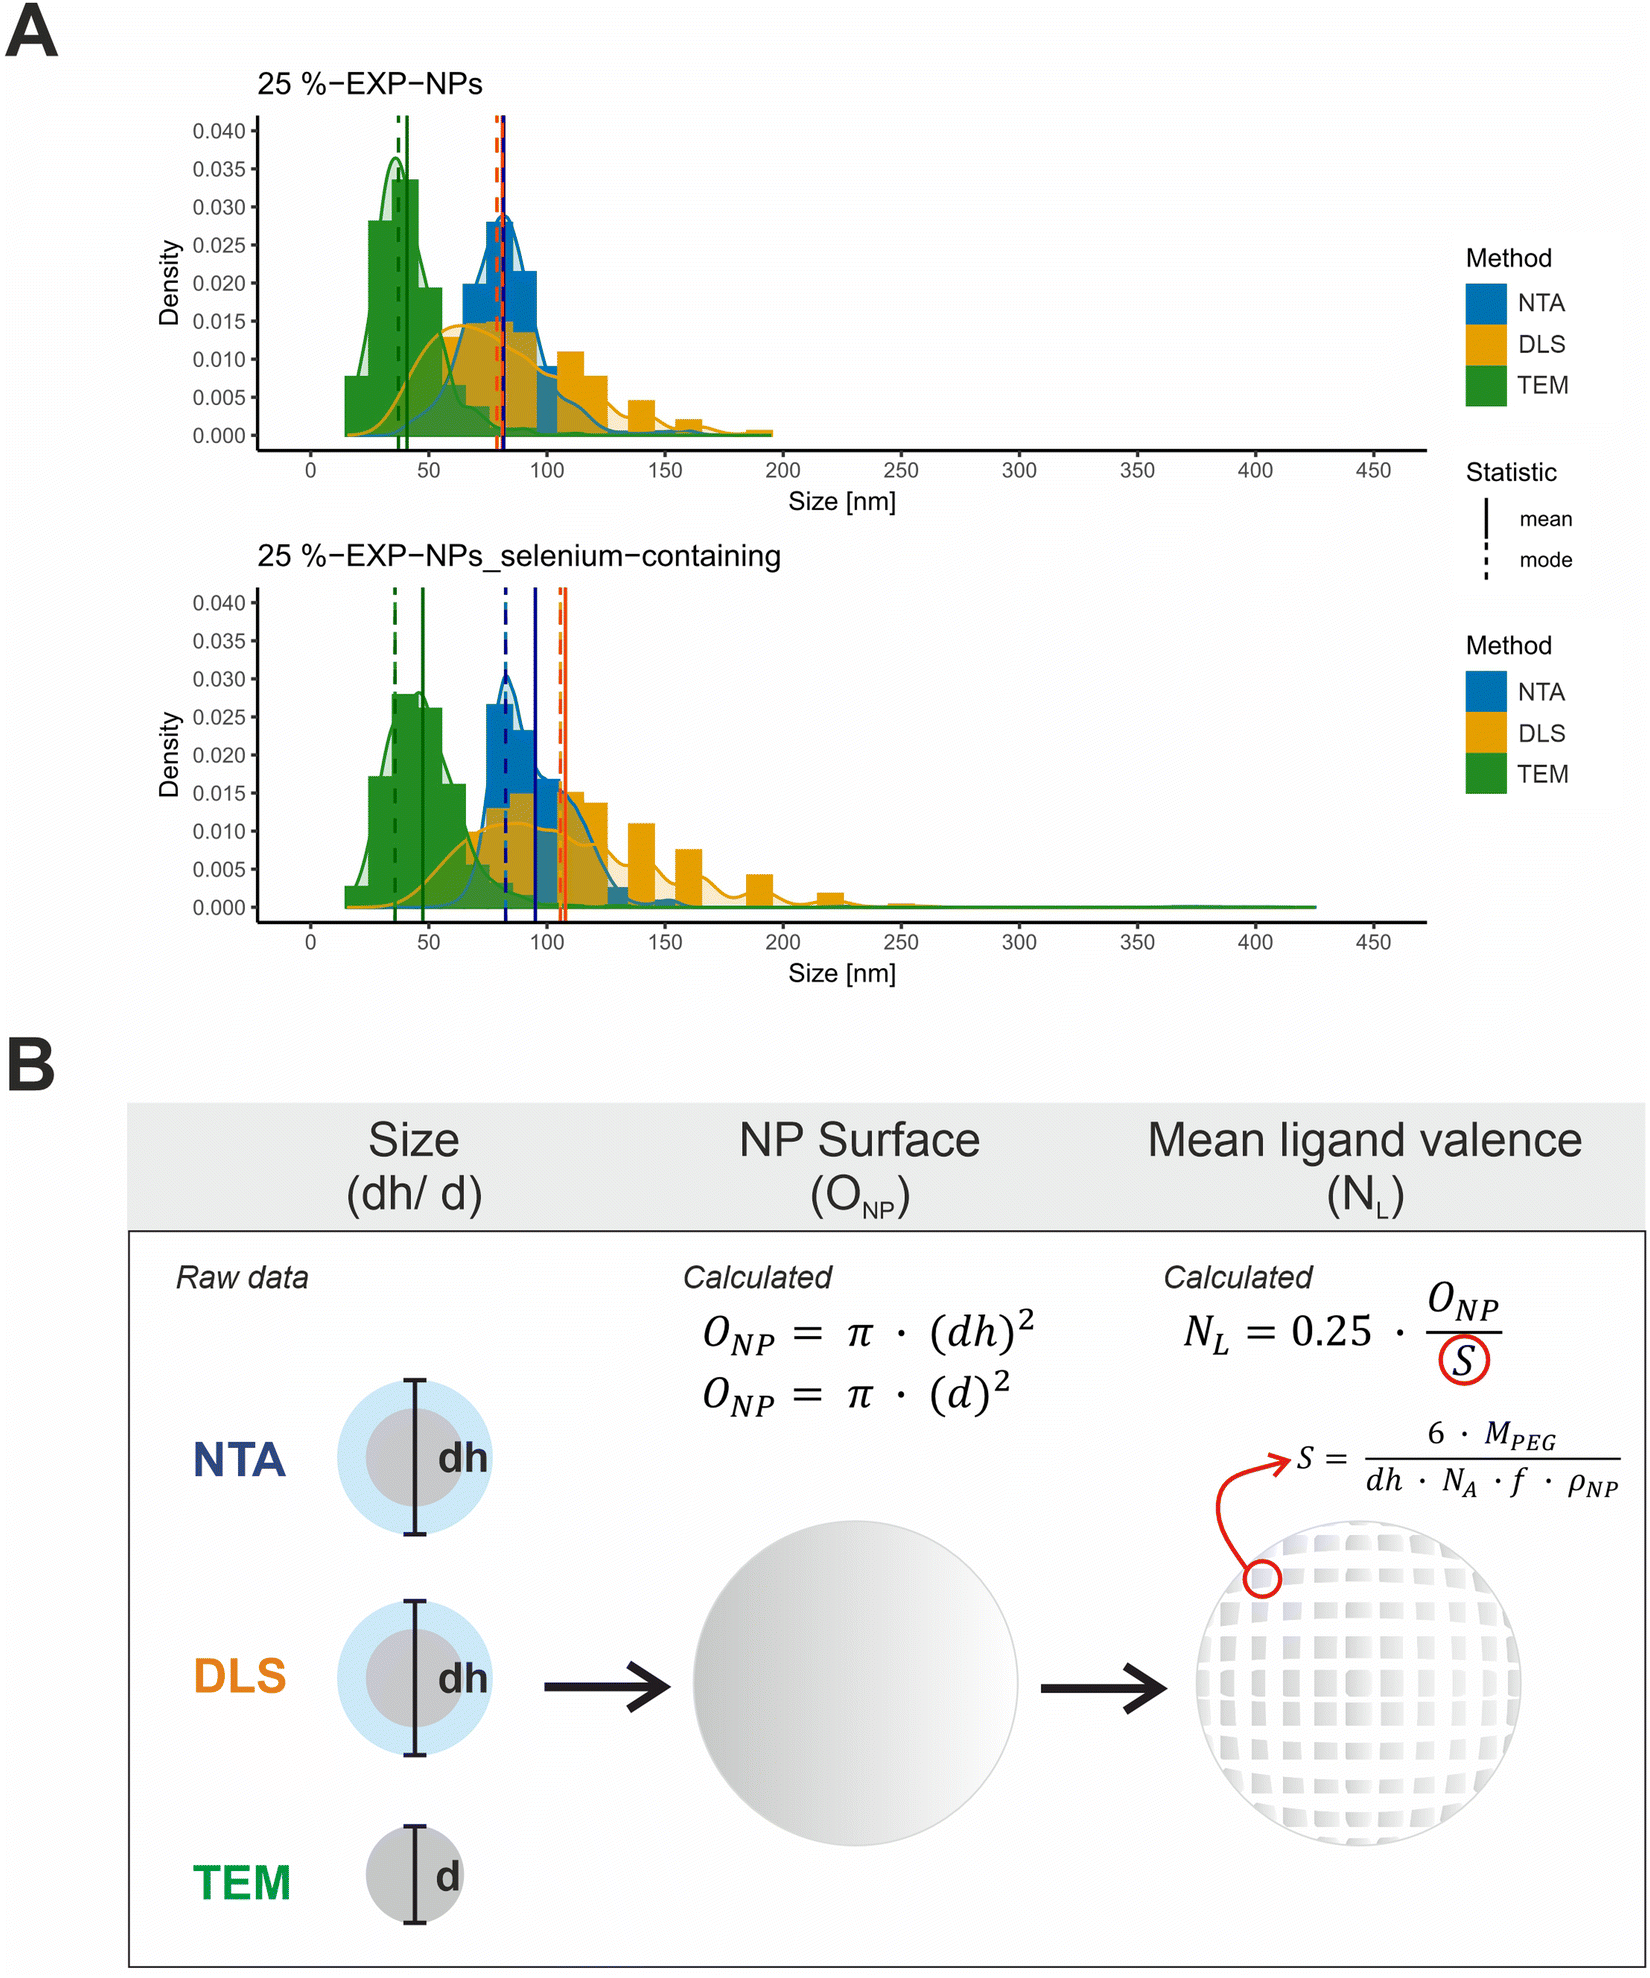 | ||
| Fig. 3 Characterization of size and ligand distribution of the model nanoparticles. (A) Size distributions of 25%-EXP-NPs and 25%-EXP-NPs_selenium-containing plotted as a function of the measurement method. Size values obtained by NTA, DLS, and TEM measurements were compared. NTA and DLS raw data (DLS data as intensity percent) were obtained in a triplicate measurement (n = 3). The DLS data was furthermore analyzed as volume percent (Fig. S9, ESI†). The size of 500 nanoparticles was measured on six independent sections of each TEM grid. The mean and modal values of the distribution curves were highlighted in color of the curves as solid and dashed lines in the figure. (B) Illustration of the assumed mathematical relationship between the measured nanoparticle (hydrodynamic) diameter and the calculated nanoparticle surface area and mean ligand number. The parameters considered were the surface that each PEG chain occupies on the nanoparticle surface (S), the molecular weight of the PEG chain (MPEG), the mass fraction of PEG in the PLA–PEG blends (f) and the assumed density of the nanoparticles (ρNP). | ||
Size distribution data were collected using three analytical methods based on different measurement principles (Table S1, ESI†). DLS and NTA measurements provide hydrodynamic diameters, while TEM-based analyses measure the nanoparticles without their hydration layer.32,33 The obtained size distribution curves were evaluated with regard to the expected total number of ligands on the nanoparticle surface, hereafter referred to as mean ligand valence (Fig. 3 and Table S1, ESI†). To form a mathematical relationship between the measured particle size and the mean ligand valence, the nanoparticles shape was assumed to be a perfect sphere and their surface area (ONP) was subsequently calculated from the (hydrodynamic (dh)) diameter (d), as shown in eqn (1).
| ONP = π·(dh)2 | (1) |
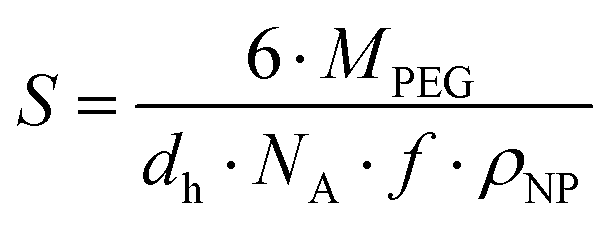
The mean ligand valence per nanoparticle was assessed by dividing ONP by the surface area occupied by each PEG chain (S) in the nanoparticle shell.34,35 We considered this justified under the assumption that S is a circular area, and that the polymer distribution is homogeneous.
 | (2) |
According to eqn (2), S is defined by the molecular weight of a PEG chain (MPEG), which is related to the (hydrodynamic) diameter of the nanoparticles (dh), the Avogadro constant (NA), the mass fraction of PEG in the blends of the PLA10k–PEG5k block copolymer (f), and the density of the nanoparticles (ρNP).35 A density of 1.25 g cm−3 was assumed as a rough estimate for the density of the nanoparticles, a value corresponding to the density of nanoparticles composed of PLA-g-PEG blends.36
A coefficient was introduced to account for the fact that only a percentage of 25% of the PEG chains were functionalized with ligand. The mean ligand valence (NL) was therefore described as a function of the nanoparticles size as follows:
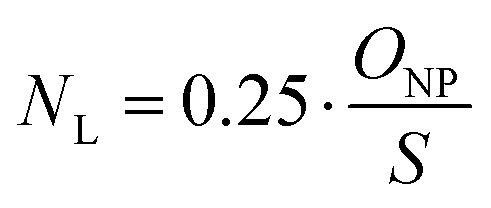 | (3) |
The analysis of the collected data revealed a significantly differing calculated mean ligand valence depending on the underlying measurement method, shown as mean ± SD and mode (Table S1, ESI†). The ligand density on the nanoparticle surface could be calculated from this in the order of magnitude from 10 to 29 ligands per 100 nm2 surface area.
To proceed with determining the average number of binding ligands of the described model nanoparticles, the mean value of specifically binding ligands (Nbound) was defined as a function of the occupied receptors (Noc) on the target cell surface relative to the number of nanoparticles (NNP) attached to the cell membrane as shown in eqn (4) (Fig. 4).
 | (4) |
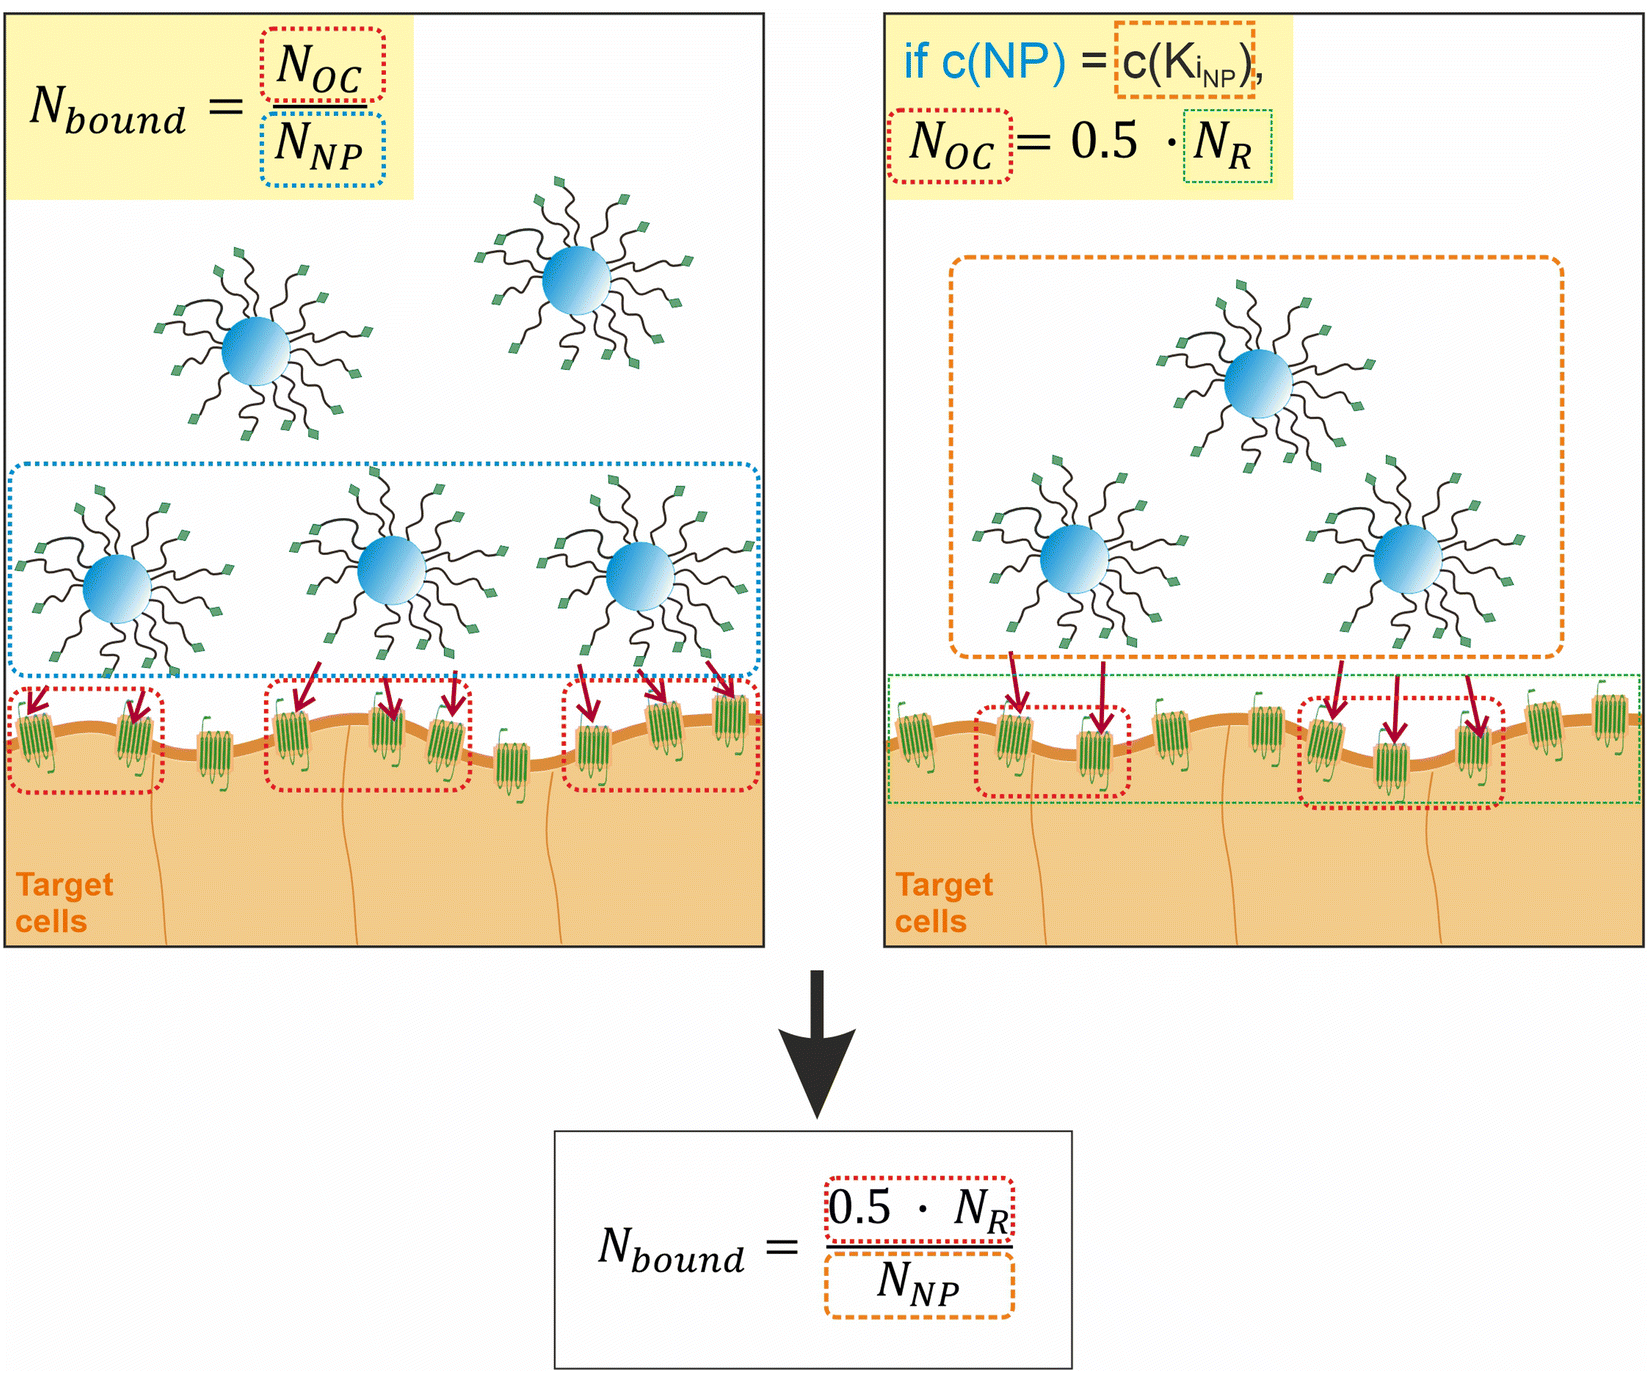 | ||
| Fig. 4 Illustration of the assumptions underlying the formula for calculating the average number of binding ligands per nanoparticle. | ||
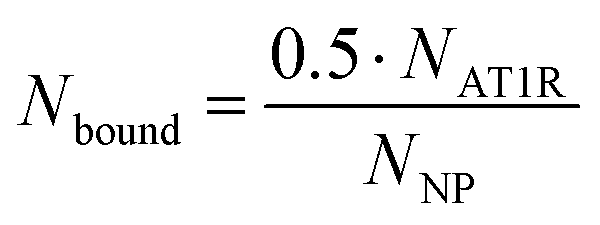
At the concentration of the KD value, half of the maximum specific binding sites (NR) are occupied by ligands.37,38 This correlation also applies, if the number of nanoparticles added to the system corresponds to the concentration of their KD value. This allows us to define Noc as a function of the total number of available receptors (NR) on the cell membrane.
| Noc = 0.5·NR | (5) |
Likewise, Noc can be defined as a function of NR in the region of receptor saturation, when all available receptors on the cell membrane are occupied.39 Then the relationship Noc = NR holds. However, we assumed that this would have experimental disadvantages, as saturation requires the addition of a large unphysiological excess of nanoparticles.
The previously defined expression for Noc as a function of half of NR can be inserted into eqn (4) as shown in eqn (6).
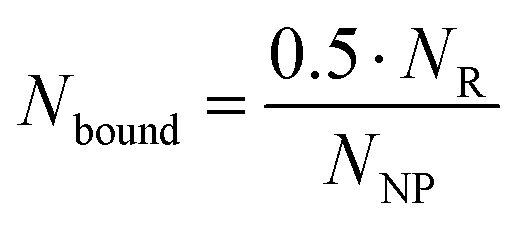 | (6) |
The number of binding ligands was consequently defined as a function of half of the number of target receptors on the cell surface allocated to the number of nanoparticles attached to the cell membrane. We considered this justified if the applied nanoparticle concentration is equal to their KD value or, in the case of the antagonistic functionalized nanoparticle, to their equilibrium inhibition constant, Ki.
Eqn (6) is based on variables that can be obtained through successive experiments on an engineered polymeric nanoparticle system as described in the following.
Determination of the average number of binding ligands per nanoparticle
First, the average number of AT1R expressed on the surface of the target cell line (NR) was determined by saturation binding studies with the tritium-labeled Ang-ll derivative [3H]UR-MK292. The maximal number of binding sites (Bmax) was extracted from the fitting parameters of specific binding and converted to the receptor number related to the total number of rMCs used in the experiment (Fig. 5 and Fig. S10, ESI†). We found NR to be 22000 ± 1500 AT1R per cell (mean ± SD from four independent experiments).
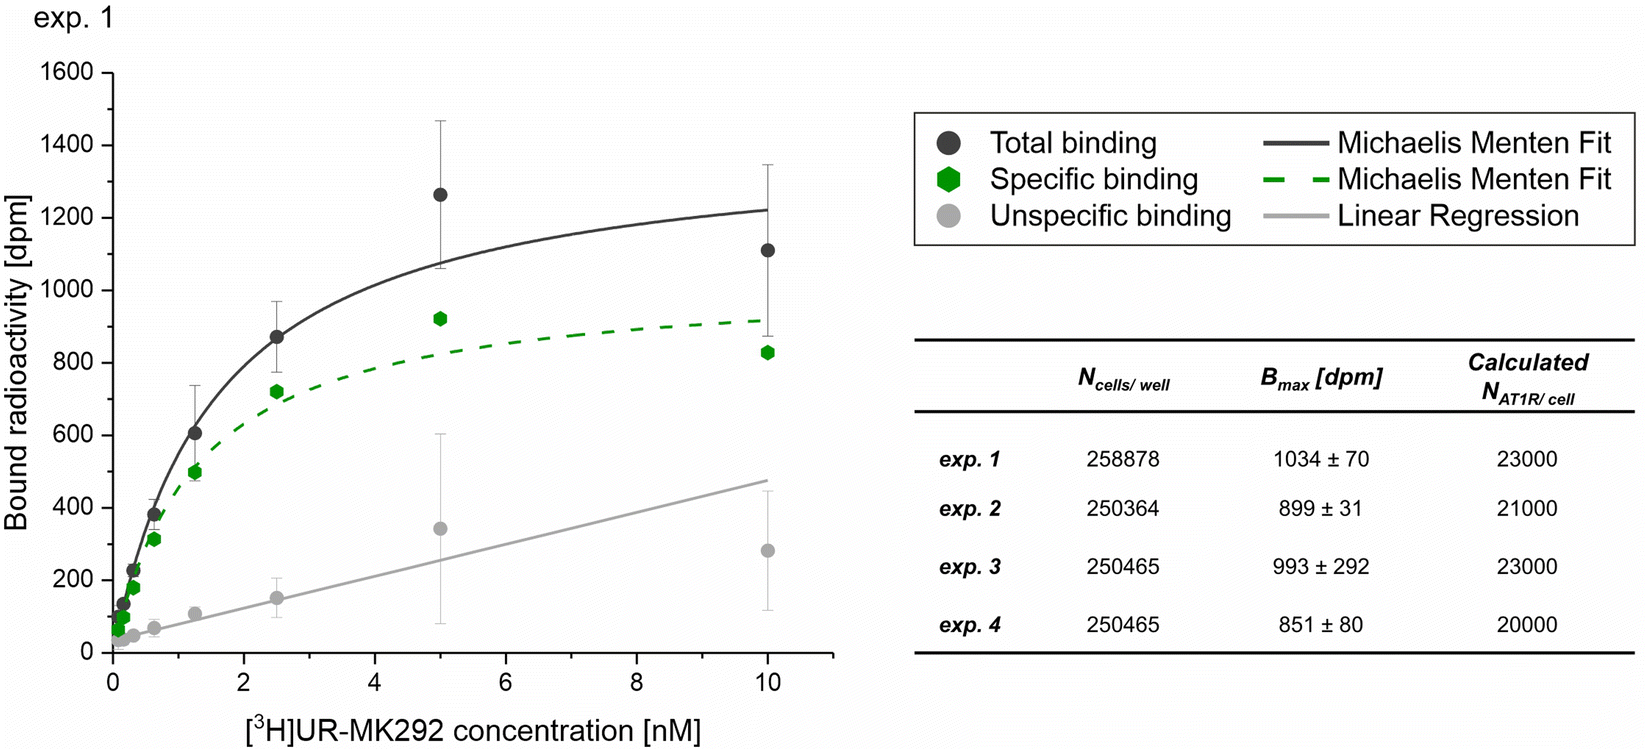 | ||
| Fig. 5 Radiochemical saturation binding studies with the tritium labeled Ang-ll derivative [3H]UR-MK292 performed to determine the average number of AT1R per cell on rMCs. Data obtained from four independent experiments (exp. 1–4), with data from experiment 1 shown as a representative example (mean ± SD; n = 3) with Ncells/well indicating the counted number of cells per well in the experiment, Bmax [dpm] indicating the maximum recorded radioactivity in the total binding experiments, calculated NAT1R/cell indicating the average number of AT1R per cell calculated from the obtained data. Please refer to Fig. S10 (ESI†) for experiments 2–4. | ||
To determine the Ki value of the EXP3174-functionalized nanoparticles, Fura-2 AM based Ca2+ mobilization assay established by Grynkiewicz et al. was utilized.40,41 The assay was selected because its results are unaffected by non-specific binding to the cell surface or receptors. This has been previously demonstrated by our group by proving that both, non-functionalized nanoparticles on AT1R expressing cells and EXP3174-functionalized nanoparticles on off-target cells, showed no activity in the assay.2 The Ki value was derived from the avidity of the particles, which was measured by inhibiting the AT1R under competition with the agonist Lys-Ang-ll. The obtained data sets were plotted as binding curves normalized to the highest value in each data set, and the extracted IC50 values were averaged for each nanoparticle type (25%-EXP-NPs: 0.50 ± 0.09 pM; 25%-EXP-NPS_selenium-containing: 0.70 ± 0.07 pM; mean ± SEM from five independent experiments) (Fig. 6 and Fig. S11, S12, ESI†). The derived IC50 values were found to be statistically equal (Welch's two-sample t-test: Pr(>t) = 0.1039), underscoring that the selenium tag had no influence on the activity of the nanoparticles on the target site. The IC50 values were converted to the corresponding equilibrium inhibitor constant, Ki, using the Cheng–Prusoff transformation,42 where [L] is the competing agonist concentration and KD is its equilibrium dissociation constant:
 | (7) |
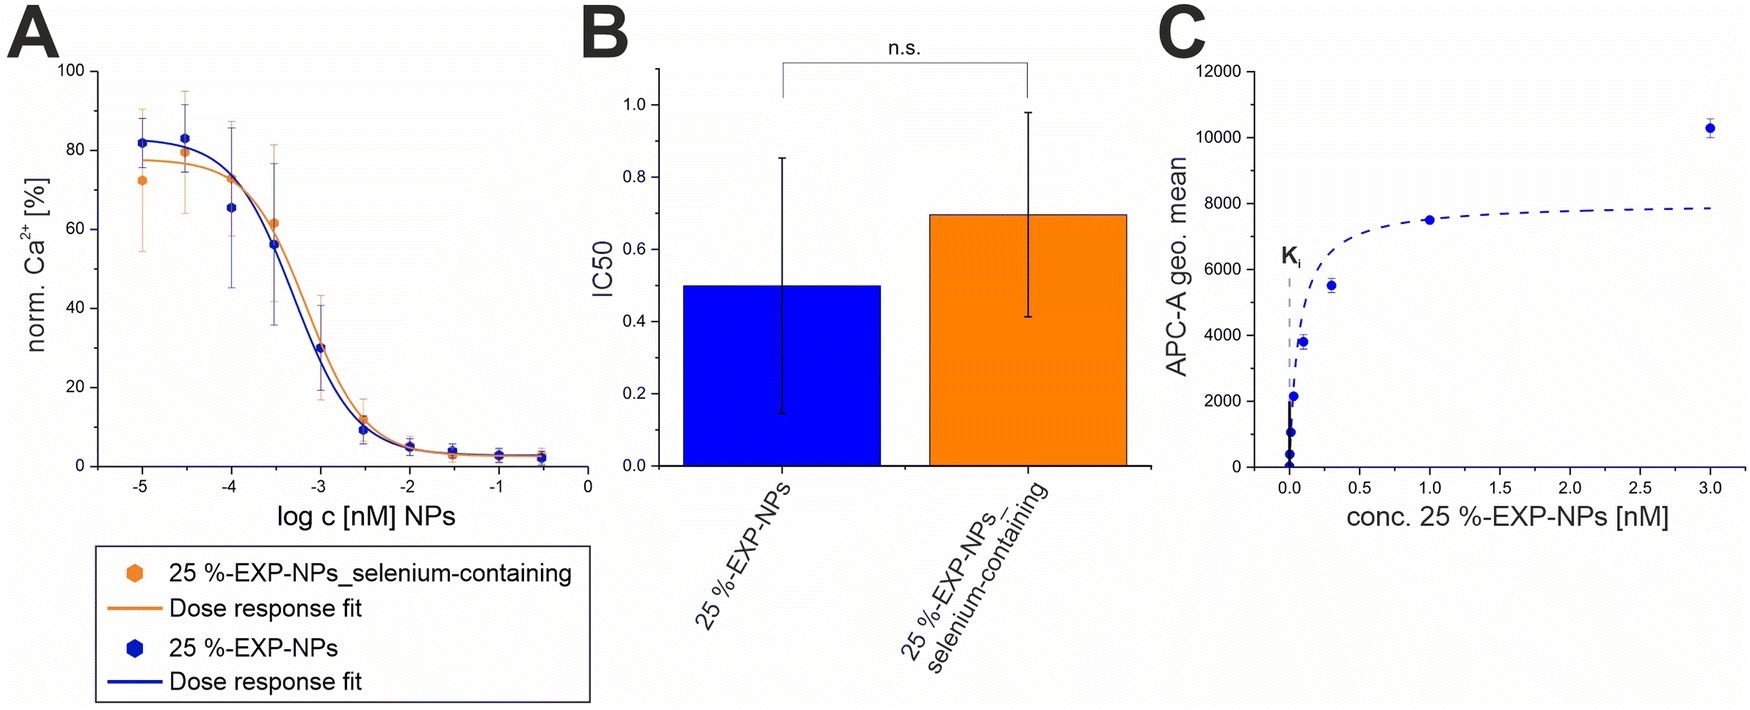 | ||
| Fig. 6 Determination of the Ki values for both types of model nanoparticles. (A) Binding curves of 25%-EXP-NPs and 25%-EXP-NPs_selenium-containing derived from Fura-2 AM based Ca2+ mobilization assay. Binding of the agonist causes an increase of the cytosolic Ca2+ concentration by inducing the G protein-coupled receptor (GPCR) activation cascade,43,44 as indicated by the fluorescent calcium chelator Fura-2 AM. Results represent averaged data from five independent experiments (N = 5, n = 3). (B) IC50 values of both nanoparticle types calculated from the averaged data. Derived IC50 values were compared via Welch's t-test (Pr(>t) = 0.1039). Levels of statistical significance are indicated as n.s. – not significant, *p ≤ 0.05, **p ≤ 0.01, ***p ≤ 0.001. (C) The binding curve of 25%-EXP-NPs fluorescently labeled with CY-5 was recorded on rMCs via FACS measurements. Data represent mean ± SD (n = 3) and the binding curve was plotted with Michales Menten fit. The Ki value of the nanoparticles calculated using Cheng–Prusoff transformation was fitted into the plot as an intercept. | ||
The KD value of Ang-ll at the AT1R is published to be in the range of 1 nM.45 However, since the assay used to determine the IC50 value of the EXP3174-functionalized nanoparticles is coupled to the Ca2+ signal at the receptor, we decided to record the KD value of the competitive agonist under the same conditions. The effect (E) of the Lys-Ang-ll at the receptor was fitted as a function of ligand concentration ([X]) (let X be Lys-Ang-ll) in a classical saturation binding model13,46 as shown in eqn (8).
 | (8) |
The obtained data were averaged to a mean KD value for Lys-Ang-ll of 51.9 ± 20.4 nM (mean ± SEM). Subsequently, the averaged Ki value of EXP3174-functionalized nanoparticles was calculated to be 0.14 pM for the unlabeled polymer nanoparticles and to be 0.19 pM for the selenium-tagged nanoparticles according to eqn (7).
To determine the number of nanoparticles bound to the cell surface (NNP), binding data on rMCs were recorded by flow cytometry as a first approximation (Fig. 6). The derived binding curve showed saturation behavior, i.e. the saturability of the cell surface with nanoparticles. When the Ki value of the nanoparticles was fitted to the graph, the curve was intersected in the slope before the saturation plateau was reached (Fig. 6), indicating a quantitative binding of the nanoparticles in this concentration. To further evaluate the nanoparticle binding quantitatively, the concentration of selenium-tagged nanoparticles adhering to the cell matrix (NNP) at their Ki value concentration was measured using ICP-MS. The selenium content of the cell samples was quantified to be 36 ± 7 μg L−1 (mean ± SD, from three experiments), which corresponds to a nanoparticle concentration of 0.066 ± 0.015 pM associated with the cell surface (Fig. S8, ESI†).
The average number of binding ligands per nanoparticle (Nbound) could be determined by inserting the variables obtained from the successive experiments into eqn (6). Initially assuming quantitative binding of the nanoparticles to the cell surface, as can be derived from flow cytometry data, Nbound was calculated to 85 ligands. Correcting this number by the data obtained from the quantification experiments carried out with selenium-containing nanoparticles, Nbound increased to 251 ligands. Taking these results together led to a range of 85 to 251 binding ligands per nanoparticle: [85; 251] (Fig. 7). It can therefore be summarized that on average a maximum of 251 ligands per nanoparticle bound to targeted receptors on the cell surface. Nbound was related to the determined mean ligand valence to obtain the fraction and density of binding ligands (Fig. 7). Both quantities varied greatly depending on the method used to estimate the mean ligand valence (Table S2, ESI†). With relation to the maximum of 251 binding ligands, a fraction of 3.7% to 65.1% binding ligands could be determined, corresponding to a density of 0.8 to 5.3 binding ligands per 100 nm2 surface area (data represents the geometric mean).
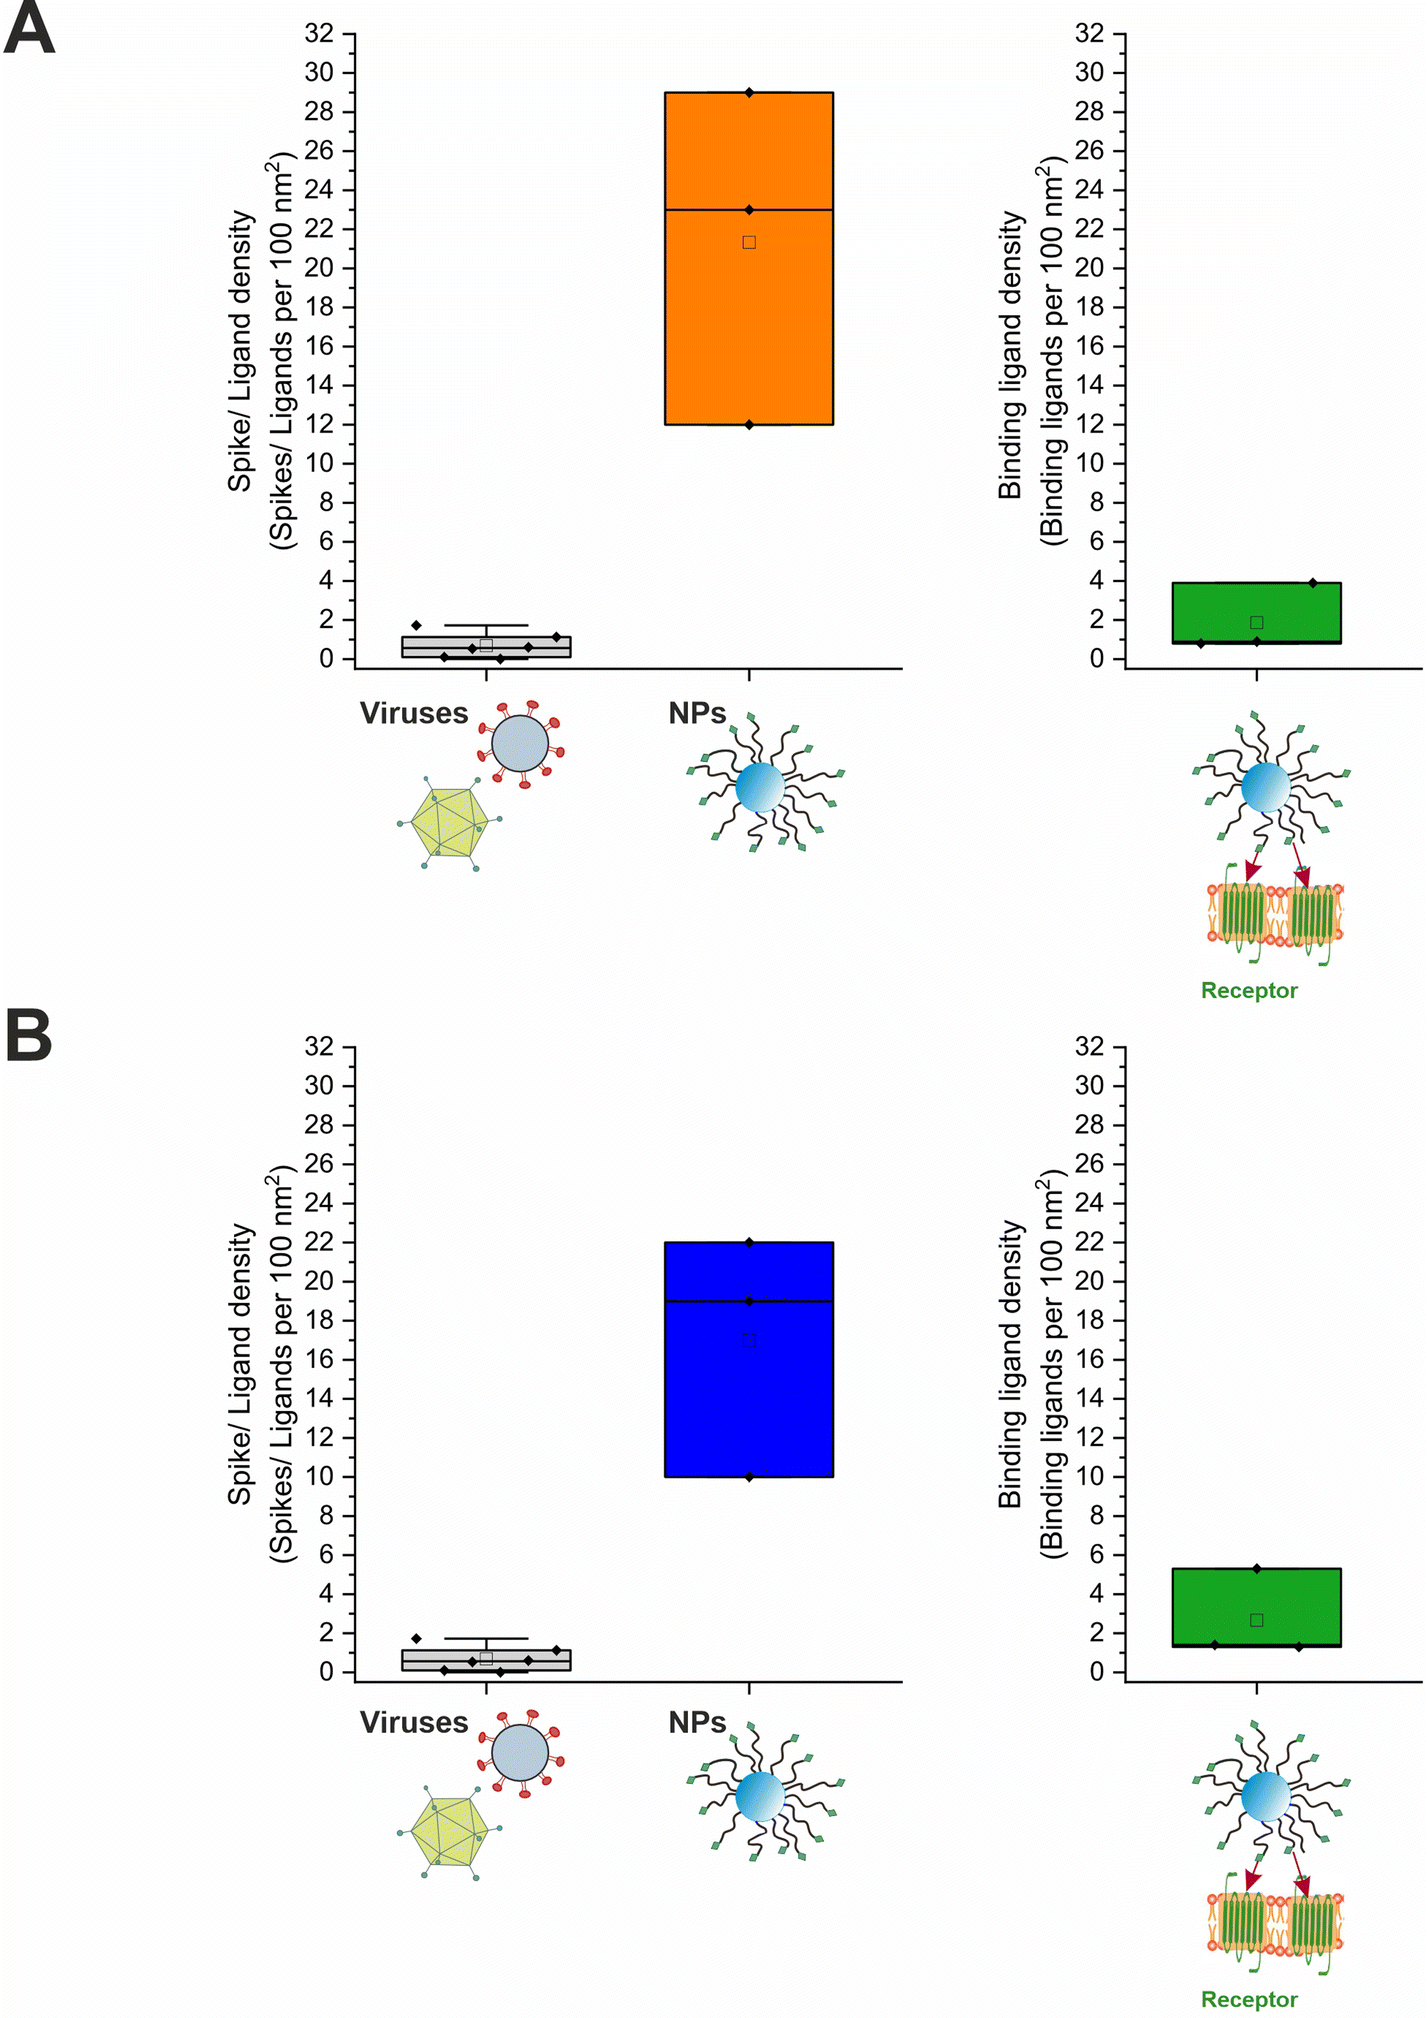 | ||
| Fig. 7 Spike and ligand density on viruses and nanoparticles. (A) Ligands per 100 nm2 nanoparticle surface area in direct comparison to viral role models and binding ligands per 100 nm2 nanoparticle surface area for selenium-tagged and (B) unlabeled nanoparticles. For the underlying evaluation, the DLS data were analyzed as intensity percent. The values for the viruses were taken from the publication by Alkilany et al.4 | ||
Considerations on nanoparticle binding in clathrin coated pits (CCPs)
We have recently demonstrated that the presence or absence of clathrin coated pits (CCPs), which play a crucial role in the receptor-mediated endocytosis of both, viruses, and nanoparticles,47,48 is an influential factor in the avidity of multivalent nanoparticles.13 In terms of their shape and diameter, CCPs align well with the geometry of nanoparticles (spherical geometry, d < 100 nm)49 and thus increase the number of possible ligand–receptor interactions compared to the flat membrane.13 We wanted to evaluate whether our current results could be reconciled with this, and nanoparticles could bind to 251 receptors in CCPs.To the best of our knowledge, there is no data available in the literature regarding the number or density of AT1R in isolated CCPs. Therefore, theoretical considerations were used for an estimation based on available data about CCP geometry and AT1R dimensions (Fig. 8). The geometry of CCPs was simplified to a spherical dome with different diameters (d) and depths (h) depending on their stage of development.49,50 The geometry of the AT1R was described by the facilitated model of a cylinder. In a previous study, we calculated the radius (rR) of a single AT1R to be 2.3 nm,35 however, this does not provide a direct indicator of the space occupied by a receptor on the cell membrane. Aldossary et al. recently published a study on the distribution and clustering of AT1R on rat pheochromocytoma cells (PC12 cells),51 which serves at least as a good approximation for the rat mesangial cells we used due to the origin from the same species. They demonstrated a cluster density of 2.2 × 10⁴ localizations μm−2 in AT1R clusters on the cell surface (data represents the mode). Based on this data, we calculated the minimum area occupied per receptor to be 3.6 nm2. The number of AT1R per CCP (NAT1R/CCP) could be estimated by dividing the surface area of the CCP by the membrane area reserved for a single AT1R. (Please note the ESI† on the calculation and the assumptions made.)
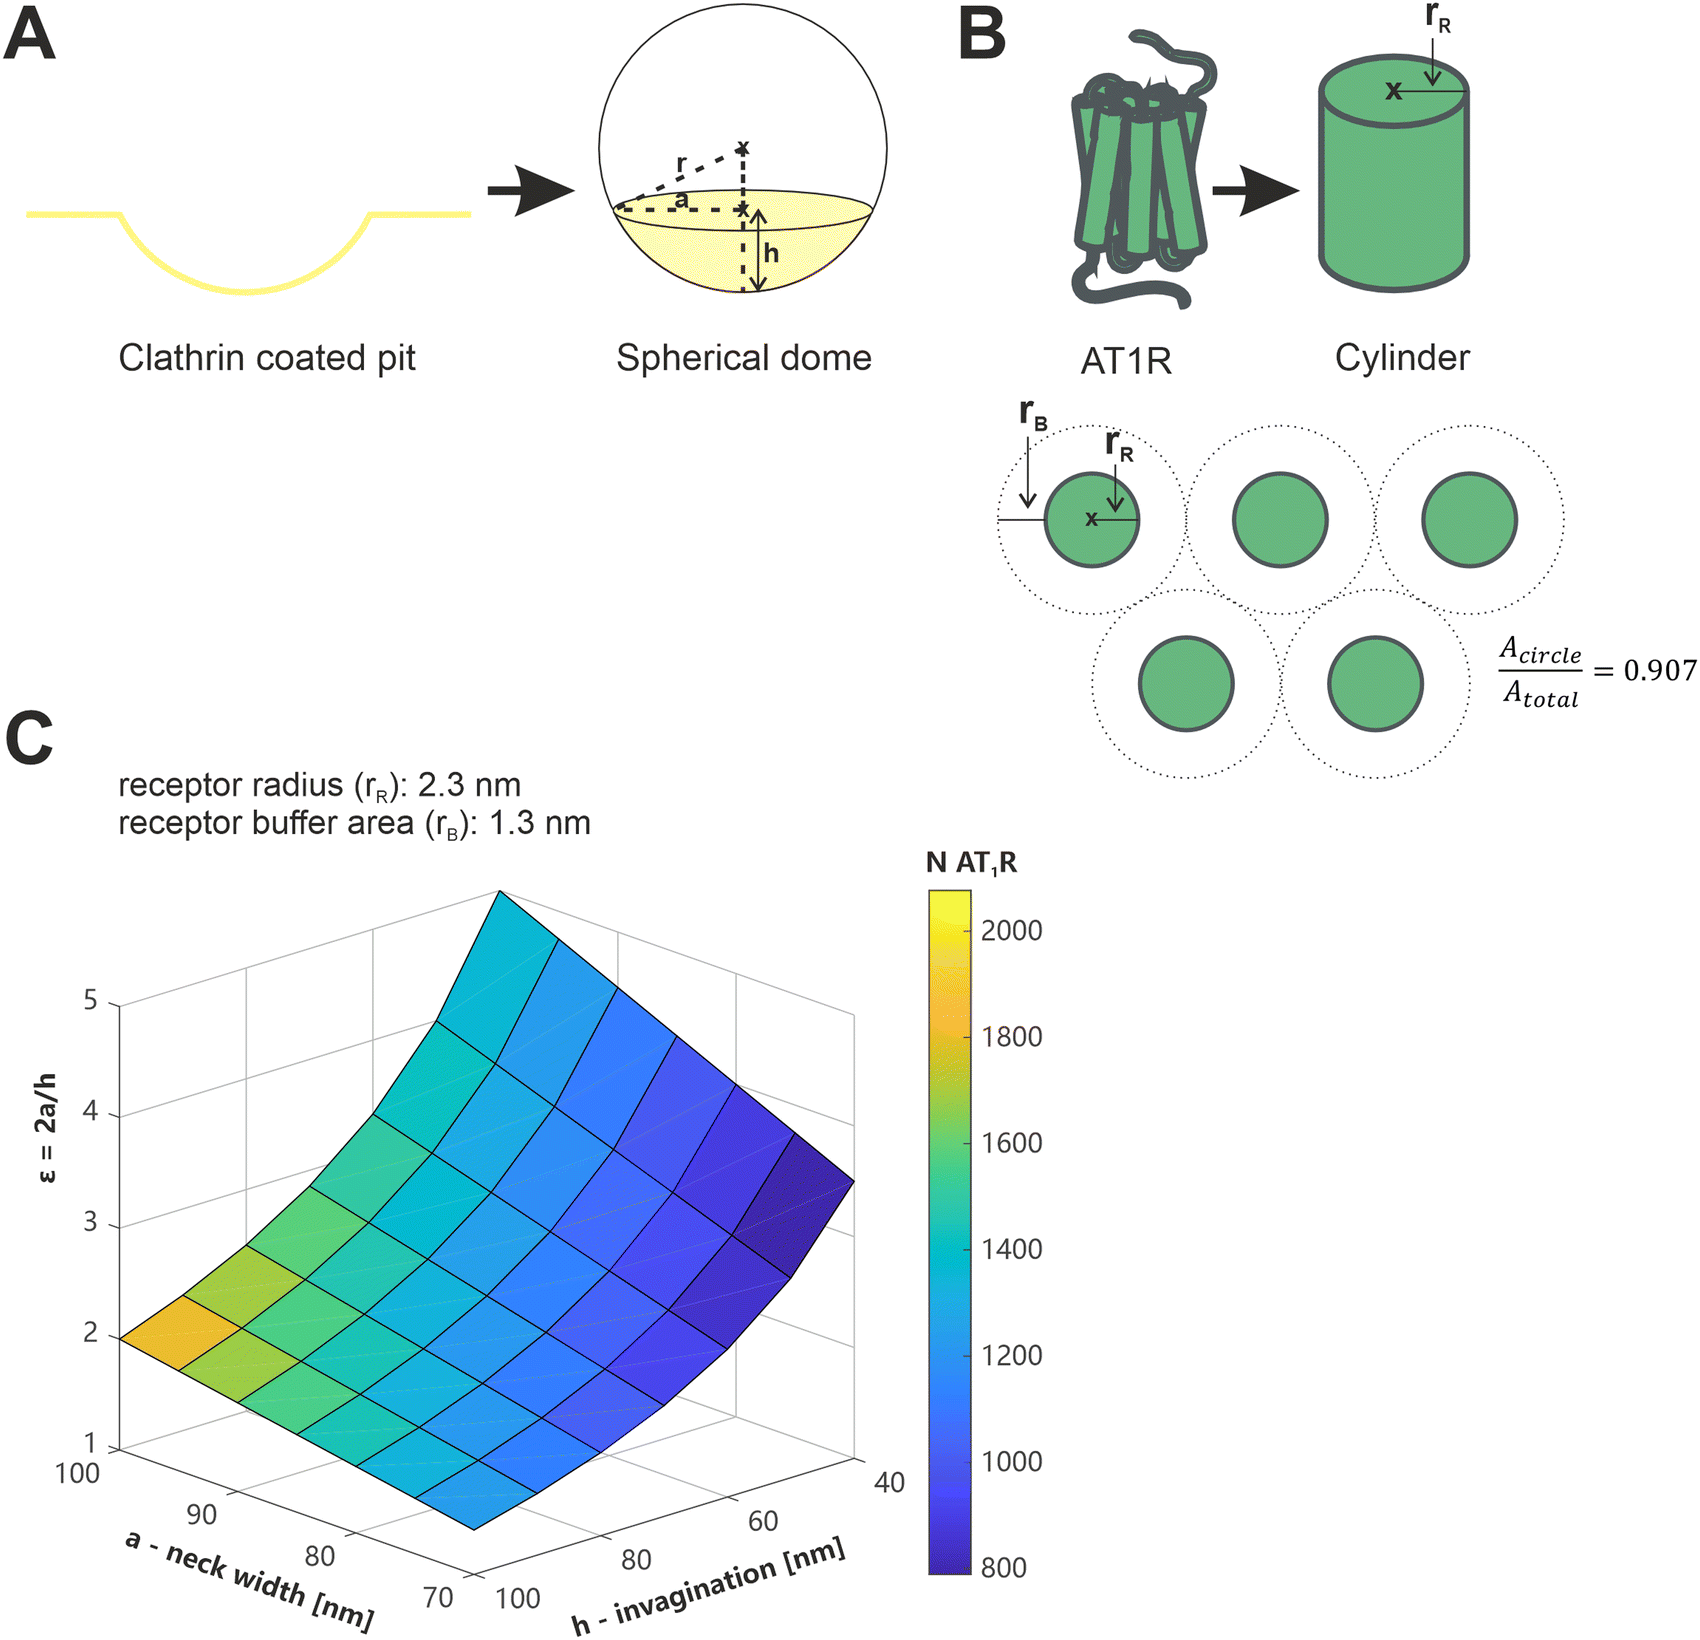 | ||
| Fig. 8 Illustration of the considerations regarding the geometry of AT1R and CCPs, and the calculation of the number of AT1Rs located in CCPs. (A) Simplified model of clathrin coated pits as a spherical dome, with r referring to the radius of the sphere, a indicating the radius of the base circle of the spherical segment and h being the height of the spherical dome. (B) Description of the geometry of the AT1R using the simplified model of a cylinder with the radius rR and illustration of the correction factor for the closest packing of circles (0.907). (C) Color coded plot of the AT1R number in a CCP depending on a, h and ε, with ε accommodating the stage of development of the CCPs depending on a and h, which are described in Fig. 8A. | ||
Data of the geometric features of CCPs in their early stage of development, as they are expected to occur during their initial contact time with nanoparticles, were taken from a study published by Kozik et al. and plotted as a three-dimensional surface.49 The obtained plot showed the calculated NAT1R/CCP color coded (Fig. 8). NAT1R/CCP was estimated on a minimum of 800 and a maximum of 2000 receptors depending on the geometric feature of the CCP under consideration and assuming the densest packing of the receptors. It is therefore mathematically feasible that nanoparticles bind with an average of 251 ligands to the receptors in CCPs, but these figures must be scrutinized against the biological context.
Discussion and conclusion
In the present study, we used engineered polymeric nanoparticles as an example to quantify the average number of ligands per nanoparticle that bind to target cell receptors on the cell surface, finding that the maximum number of binding ligands was 251. A look at the literature reveals that very few studies have addressed this question so far,6,14 which were frequently based on antibody-functionalized model nanoparticle systems. The computational study by Farokhirad et al. provides at least a benchmark for our work as they analyzed a rigid-tethered nanoparticle model.12 They calculated the number of binding ligands as a function of the excess area of the (cell) membrane in a range of 45 to 73 binding ligands. These values are rather comparable to the minimum of 85 binding ligands that we calculated assuming quantitative binding of the nanoparticles to the cells surface. However, it is important to mention that the nanoparticles in our study were investigated within a specific biological context, namely in their interaction with AT1 receptor expressing rMCs. It has been shown that GPCRs are often not randomly distributed on the cell membrane, but rather compartmentalized into functional domains.52 This also applies to AT1Rs, which are organized into microdomains as clusters on various types of kidney cells.51,53 Upon activation by an agonist, such as angiotensin-ll, a partial restructuring of the receptor distribution can be observed, whereas stimulation with antagonists does not induce this restructuring.53 It can therefore be assumed that the binding of EXP3174-functionalized nanoparticles has no effect on the distribution of AT1Rs on the cell surface. For PC12 cells, Aldossary et al. described the organization of AT1Rs in clusters, averaging 252 ± 15 receptors per cluster (with a range of 10–1041 and more than 50% of the clusters containing fewer than 100 receptors).51 The cluster size makes it plausible that up to 251 receptor bindings per nanoparticle could form, given that the membrane undergoes bending. Since we were able to demonstrate in a previous study that the presence of CCPs in the membrane increases the nanoparticles avidity by enhancing binding options due to geometric congruence,13 the question arises as to whether receptor clusters on the membrane are associated with CCPs. Given the high technical complexity, limited data is available on this topic. Nevertheless, the findings of Liu et al. indicate at least for transferrin receptors a positive correlation between receptor clustering and the formation of CCPs.54 Comparing the area of a mean AT1R cluster on PC12 cells of about 9.8 ± 0.6 × 10⁻³ μm2 (with more than 50% of the clusters having an area of less than 3.7 × 10⁻³ μm2) with the average surface area of a typical early-stage CCP of about 6.5 × 10⁻³ μm2 (with a diameter of 100 nm),36 it is quite conceivable that some of the receptor clusters are located in the region of preexisting CCPs or respectively that CCPs could form in the region of receptor clusters. Although the association with CCPs remains to be confirmed experimentally, considering the biological context and the presence of AT1R clusters clearly supports the data obtained in this study.The comparison with viral role models impressively showed that the nanoparticles under consideration exhibited a target cell avidity comparable to viruses, for which KD values in a broad range from mM to pM have been reported.55–59 However, nanoparticles possessed a significantly higher quantity of ligands, as their ligand density exceeded that of viruses by at least a factor of 10.4 The high ligand density on the surface of nanoparticles is certainly a factor that weakens their cell selectivity. This is strongly underlined by the fact that only a maximum of 5.3 ligands per 100 nm2 nanoparticle surface were actually involved in specific ligand–receptor interactions. The density of binding ligand-bearing chains closely approximates to the total spike density of viruses. However, a direct comparison with viruses in terms of the average number of binding ligands is challenging, as it heavily depends on the virus type. It is established that a low spike density is often sufficient for a virus particle to be infectious, with saturation effects on infectivity observed as the number of spikes increases.4,60 The binding events of viruses can be directed by controlled lateral movements on the cell surface,61 surface patterns that negatively regulate the number of binding spikes,62 the specific steric alignment of spikes in the direction of the target63 and the formation of specific binding motifs.64 For instance, the formation of an “entry claw” consisting of five to seven spike receptor rods between SIV/HIV-1 and T Cells has been documented in the literature.64 In other words, mechanisms associated with the movement of spikes can lead to a temporary punctual clustering of the spikes on the surface of viruses. Given that nanoparticles cannot make use of such mechanisms and considering that not all ligands are likely to possess a favorable steric orientation, it is plausible that a more extensive functionalization with ligands is required to achieve comparable avidities. Surface-sensitive techniques such as atomic force microscopy (AFM) or surface plasmon resonance spectroscopy (SPR) have recently also been used to determine the number of binding functionalities of viruses.62,65–67 Delguste et al. functionalized AFM cantilevers via polyethylene glycol-linkers with virions to characterize the multivalent binding of herpesviruses to living cells.62 The use of AFM as a state-of-the-art surface-sensitive technique can also be considered promising for the quantification of binding events between nanoparticles and cell surfaces. However, there are only few studies that have used AFM in the context of characterizing the interactions between nanoparticles and cells.14,68 We posit that AFM offers the advantage of enabling the direct and real-time measurement of surface interactions. Conversely, it has to be considered that the functionalization of AFM cantilever tips with nanoparticles creates highly artificial systems. It restricts the degrees of freedom of movement of the attached particles and consequently influences the binding behavior to the cell surface. Moving the functionalized cantilever tip over the cell surface, the binding of the attached particle to the cell surface can only be measured as a local event. This contradicts our understanding of nanoparticle binding as a global event,5 which also depends on cooperative effects between nanoparticles69 and the competition for a limited number of surface receptors.5 Regardless of the method employed to investigate the question, it must be considered that in a serum-containing environment, proteins and lipids adsorb to the surface of nanoparticles and thus influence their interaction with the cell surface.70–72 The identity of the nanoparticles is significantly affected as a result.73 In case of the nanoparticles under consideration, it can therefore not necessarily be assumed that all ligands on their surface were “visible” and thus available for binding. However, since their avidity was determined in a competition assay, it can be concluded that at least a substantial fraction of the ligands on the nanoparticles surface was available for specific interactions with the receptors.
The implications of our findings go further than a more precise understanding of the interactions between nanoparticles and cells at the level of individual receptors. They contribute directly to tailored development approaches for the design of selective nanoparticles. The aim of a winning multivalent nanoparticle design must be to adjust ligand valency so that an enthalpic gain and therefore the threshold for successful binding is reached.16 Conversely, overloading nanoparticles with ligands beyond the optimum has detrimental effects on the target selectivity and uptake kinetics.6,17,21,74 As target and off-target cells often only express the same receptors to different degrees, it is important that distinguishable binding levels and thus superselectivity for the nanoparticles are achieved.6 Adjusting the number of ligands to the number actually required for anchoring to their target cells, would therefore help to optimize nanoparticle uptake rates and kinetics as well as their target specificity, transforming them into more successful drug-delivery or diagnostic systems. Despite the significant role of the spike density emerging form the viral infection process, this design parameter continues to be largely neglected in current nanoparticle research.15 This could also be due to the fact that simply reducing the ligand number on the nanoparticle surface is likely an oversimplification, as ligand-bearing polymer chains, unlike viral spikes, are not spatially mobile on the surface and therefore cannot locally condense. Our research suggests that the key may therefore lie in focusing on the structures of the biological target (with particular attention to receptor expression patterns) and tailoring the nanoparticle design by adjusting on the one hand the ligand number and on the other their arrangement. E.g. the functionalization of nanoparticles with ligands in form of clusters could be a promising concept as already described by Poon et al.75 By presenting an experimental approach to quantify the number of binding ligands that copes with the complexity of the system, we lay the foundation for such design strategies, which could be the next leap in the development process of active targeting concepts.
Experimental section
Materials
All materials and reagents were purchased from Sigma Aldrich (Taufkirchen, Germany or St. Louis, USA) unless otherwise stated. Dulbecco's phosphate-buffered saline (DPBS) was acquired from Gibco™ (Life Technologies, Paisly, UK), and Leibovitz's L-15 medium was purchased as medium without phenol red from Gibco™ (Life Technologies, New York, USA). The ultrapure water used for the experiments was treated with a Milli-Q EQ 7000 system (Merck, Darmstadt, Germany) equipped with Milli-Q Biopak filter (Merck, Darmstadt, Germany) and taken fresh every day. It is referred to as Milli-Q water in the following.Cell culture
Rat mesangial cells (rMCs) were kindly gifted by Prof. Armin Kurtz (Institute of Physiology, University of Regensburg, Regensburg, Germany). The cell line was chosen as a model cell line for the cell surface interaction studies due to the stable expression of the target receptor, angiotensin-ll type 1 receptor (AT1R), as previously shown by Maslanka et al.1 Cells of passage number 78 were used for all experiments directly relevant to the calculated result, to ensure a constant receptor number in the critical experiments. The cells were cultured in RPMI 1640 medium containing 10% fetal bovine serum (FBS) (South America Origin, Pan-Biotech, Aidenbach, Germany, Lot-No.: P201004) supplemented with insulin-transferrin-selenium (ITS) (Gibco, Life Technologies, New York, USA) and 100 nM hydrocortisone in a water saturated, carbon dioxide enriched (5% CO2) atmosphere at 37 °C.Cell counting
As standard, cell counting with Neubauer improved counting chamber (Marienfeld, Lauda-Königshofen, Germany) was performed as a double sampling in both counting areas of the chamber. Cells were counted in 20 group squares in the middle square on each side of the chamber.Losartan carboxylic acid (EXP3174) synthesis and characterization
Losartan carboxylic acid (EXP3174) was obtained by oxidation of losartan with potassium permanganate as previously described by Abstiens.76 Therefore, losartan potassium (Santa Cruz Biotechnology, Heidelberg, Germany) (2.0 g, 4.4 mmol) was diluted in 1 M sodium hydroxide solution (NaOH) (50 mL) and cooled down to 0 °C. An ice-cold, aqueous solution of potassium permanganate (Merck, Heidelberg, Germany) (1.58 g, 10.0 mmol in 50 mL) was added dropwise. The reaction mixture was stirred for 4.5 h at room temperature (RT). The product was then precipitated by adjusting the pH to acidic conditions with 1 M hydrochloric acid (HCl) and the solid was isolated by centrifugation (3000g, 4 °C, 15 min) and washed twice with ice-cold water. The product was isolated by resuspending the solid in water and adjusting the pH to moderately alkaline conditions with 1 M NaOH. Remaining precipitated manganese dioxide was removed by centrifugation (3000g, 4 °C, 15 min). The product was precipitated from the supernatant by acidification with 1 M HCl and then extracted with ethyl acetate in a separating funnel. The solvent was eliminated through rotary evaporation, the product was dissolved in ethanol, precipitated in an excess of water and then freeze-dried (Alpha 2–4 LSCplus, Christ, Osterode am Harz, Germany) to obtain a dry powder (reaction yield: 50%). Identity and purity of EXP3174 were verified by 1H-NMR and high-resolution mass spectrometry analyses. The 1H-NMR spectrum was recorded on a Bruker Avance lll HD 400 operating at 400 MHz. The product was therefore diluted in deuterated dimethyl sulphoxide (DMSO-d6). Topspin 4.1.4 software was used to evaluate the 1H-NMR spectrum: δ (ppm): 7.65 ppm (m, 2H, aromatic protons, ring B), 7.54 ppm (m, 2H, aromatic protons, ring B), 7.06 ppm (m, 1H, aromatic protons, ring A), 6.95 ppm (m, 1H, aromatic protons, ring A), 5.58 ppm (s, 2H, –NCH2–), 2.56 ppm (t, 2H, –CH2–), 1.48 ppm (m, 2H, –CH2–), 0.80 ppm (t, 3H, –CH3). Signals originating from residual ethanol were identified in the spectrum. δ (ppm): 3.43 ppm (q, 2H, –CH2), 1.04 ppm (t, 3H, –CH3). Mass spectrometry analyses were performed on a Q-TOF 6540 ultrahigh definition (UHD) (Agilent Technologies, Waldbronn, Germany) using an electrospray ionization source (ESI) (Fig. S4, ESI†).Block copolymer synthesis and characterization
COOH–PEG5k–PLA10k, tBoc–NH–PEG5k–PLA10k, and MeO–PEG5k–PLA10k block copolymers were synthesized via ring-opening polymerization (ROP) of the cyclic lactone 3,6-dimethyl-1,4-dioxane-2,5-dione with the organocatalyst 1,8-diazabicyclo[5.4.0]undec-7-ene (DBU) at RT as previously described by our group.77 COOH–PEG5k–OH and tBoc–NH–PEG5k–OH (Jenkem Technology, Plano, USA, Mn = 5000 ± 500 g mol−1, as stated on certificate of analysis) and MeO–PEG5k–OH (Mn = 5000 g mol−1) were used as macroinitiators for the reaction.78,79 In brief, polyethylene glycol (PEG) macroinitiators (800 mg, 160 μmol) were reacted with 3,6-dimethyl-1,4-dioxane-2,5-dione (1.60 g, 11.1 mmol) and DBU (84.2 μL, 553 μmol) in dichloromethane (DCM) as solvent at RT. After 1 h the reaction was quenched with benzoic acid in excess (0.34 g, 2.8 mmol) and the resulting block copolymers were precipitated in ice-cold diethyl ether, filtered, and dried under the nitrogen flow (reaction yield, COOH–PEG5k–PLA10k: 62%; reaction yield, MeO–PEG5k–PLA10k: 34%). In case of tert-butyloxycarbonyl (tBoc)-protected block copolymers, the protecting group was subsequently removed by addition of trifluoroacetic acid (TFA) (reaction yield, NH2–PEG5k–PLA10k: 49%). Identity and purity of the block copolymers were verified by 1H-NMR spectra recorded on a Bruker Avance lll HD 400 operating at 400 MHz; the block copolymers were dissolved in deuterated chloroform (CDCl3).80 Furthermore, the molecular weight of the synthesized polymers was determined from the 1H-NMR spectra as previously described by Zimmer and Goepferich.13 Topspin 4.1.4 software was used to evaluate the 1H-NMR spectra, exemplary shown for PLA10k–PEG5k–NH2: δ (ppm): 5.19 ppm (m, –C(CH3)H–), 4.32 ppm (m, –OCH2CH2–O(CO)–), 3.64 ppm (m, NH2CH2CH2–), 1.57 ppm (m, –C(CH3)H–) (Fig. S2, ESI†). Furthermore, the molar mass of the synthesized polymers was determined from the 1H-NMR spectra as previously described by Zimmer and Goepferich:13
The number-average molar mass of the PLA polymer (MPLA-polymer) was calculated from that of the PEG polymer (MPEG-polymer) by relating the integrals of their signals in the NMR spectrum: IPLA-CH3 corresponds to the lactic acid (–CH3) integral, IPLA-CH corresponds to the lactic acid (–CH–) integral, and IPEG is the PEG (–OCH2–CH2–) integral (Fig. S2, ESI†). MPLA-unit and MPEG-unit are the molar masses of PLA and PEG monomers.
EXP3174 coupling
For EXP3174–PEG5k–PLA10k, deprotected amino-terminated block copolymer was functionalized with EXP3174 using EDC/NHS coupling chemistry. The ligand was coupled via its carboxylic acid functionality to the polymer. To activate the carboxylic function, EXP3174 (80 mg, 0.18 mmol), 1-ethyl-3-(3-dimethylaminopropyl)carbodiimide (EDC) (100 mg, 520 μmol) and N-hydroxysuccinimide (NHS) (30 mg, 0.26 mmol) were dissolved in 3000 μL dry N,N-dimethylformamide (DMF). Subsequently, a solution of NH2–PEG5k–PLA10k (800 mg, 53.3 μmol) and N,N-diisopropylethylamine (DIPEA) (178.5 μL, 1024 μmol) in 1000 μL DMF was added dropwise to the ligand solution. The reaction mixture was stirred for 24 h at RT. For purification, the functionalized polymer was precipitated in a mixture of methanol/diethyl ether (1:15, v/v) and the resulting product was dialyzed (using SpectraPor 6–8 kDa molecular weight cut-off, RC membrane, Spectrum Laboratories, Inc, Los Angeles County, USA) against ethanol/100 mM borate buffer (pH 8.5)/Milli-Q water (1:1:8, v/v) for 24 h followed by Milli-Q water for 12 h. The product was freeze-dried (Alpha 2–4 LSCplus, Christ, Osterode am Harz, Germany) to obtain a dry powder (reaction yield: 95%). The coupling efficiency was determined by detecting free, unreacted amino groups via fluram assay (Fig. S5, ESI†).
Iodine assay/fluram-assay
Iodine assay: the PEG amount was quantified via an iodine assay adapted from Childs81 as previously published by our group.77 In brief, poly(ethylene glycole) monomethyl ether with an average molecular weight of 5000 g mol−1 (mPEG5k) was used as calibration standard in aqueous solutions (0–20 μg mL−1). 140 μL of standard dilutions and polymer micelles as samples were pipetted into a 96-well plate and incubated for 10 min under light exclusion with 60 μL of a solution composed of 5% barium chloride (m V−1) (Merck, Darmstadt, Germany) in 1 M HCl (3 mL, 2 equiv.) and 0.05 M iodine solution (VWR, Lueven, Belgium) (1.5 mL, 1 equiv.). The absorbance was measured at λ 535 nm on a FLUOstar Omega plate-reader (BMG Labtech, Ortenberg, Germany) (Fig. S5, ESI†).Fluram assay: the detection of free amino groups was carried out using the fluram assay adapted from Udenfriend et al.82 Micelles of amino-terminated polymer served as positive control and micelles of methoxy-terminated polymer as negative control. Positive and negative control were mixed at specific concentration ratios (amino- to methoxy-terminated, 100:0/ 80:20/ 60:40/ 40:60/ 20:80/ 0:100) to record a calibration line while maintaining the polymeric matrix. Briefly, 10 μL of the respective test solution (sample, positive or negative control) were added to a white 96-well plate (Greiner Bio One, Frickenhausen, Germany) with 170 μL of borate buffer (pH 8.5, 50 mM) and shaken (150 rpm) for 5 min. Afterwards, 20 μL of a solution of 4′-phenylspiro[2-benzofuran-3,2′-furan]-1,3′-dione, fluorescamine (fluram) in acetone (0.3 mg mL−1) were added and incubated together with the test solutions at RT for 15 min under shaking (150 rpm). The fluorescence was measured on a FLUOstar Omega plate-reader (BMG Labtech, Ortenberg, Germany) with an excitation wavelength of λ = 380 nm, whereby the emission was recorded on a wavelength of λ = 485 nm. The samples were evaluated against the calibration line (Fig. S5, ESI†).
Fluorescence labeling of PLGA with CY-5
Poly(D,L-lactide-co-glycolide) (PLGA) (Resomer RG 502, carboxylic acid-terminated, Mw 7000–17000 g mol−1, Sigma-Aldrich, St. Louis, USA) was fluorescently labeled by covalent linkage with cyanine-5-amine (Lumiprobe GmbH (Europe), Hannover, Germany) as previously described by our group (Fig. S3, ESI†).77 In brief, carboxylic acid-terminated PLGA (0.92 mg, 77 μmol) was dissolved together with cyanine-5-amine (CY-5) (5.0 mg, 7.7 μmol) in dry N,N-dimethylformamide (DMF). The carboxylic acid group was activated by the addition of (2-(1H-benzotriazol-1-yl)-1,1,3,3-tetramethyluronium hexafluorophosphate) (HBTU) (58 mg, 0.15 mmol) and DIPEA (53.5 μL, 306 μmol) and the reaction mixture was stirred overnight at RT under light protection. To remove the excess of free dye, the polymer was precipitated several times in ice-cold diethyl ether until the supernatant was no longer blue. The product was dried under the nitrogen flow (reaction yield: 93%) and characterized by FTIR spectroscopy. FTIR spectra were recorded on an Agilent Technologies Cary 630 FTIR (Agilent, Santa Clara, USA) with 32 scans, 8 cm−1 resolution (Fig. S3, ESI†). Furthermore absorbance spectra of the PLGA and CY-5-PLGA in acetonitrile (4 mg mL−1) were recorded (Fig. S3, ESI†).
NP preparation
Core–shell nanoparticles (NP) were obtained by nanoprecipitation.77,83 For this purpose, the synthesized block-copolymers and poly(D,L-lactide-co-glycolide) (PLGA) (Resomer RG 502, ester-terminated, Mw 7000–17000 g mol−1, Sigma-Aldrich, St. Louis, USA) were dissolved in acetonitrile (ACN) to a concentration of 10 mg ml−1. The ratio of PLGA core to the block-copolymer was 3:7 (m/m). To achieve the desired degree of surface functionalization of the nanoparticles, the appropriate amount of EXP3174-terminated polymer within the block-copolymers was utilized. The organic phase was added dropwise into the 10-fold excess of stirring (930 rpm) aqueous phase (10% DPBS (v/v) in Milli-Q water) and stirred for 3 h to remove the ACN. Subsequently, the volume was concentrated by centrifugation at 3000g for 15 min using Microseps Advance 30 K centrifugal filters (molecular weight cut-off 30 kDa, Pall Corporation, New York, USA).
Selenium-containing NP preparation
Selenium-containing core–shell nanoparticles were prepared by modifying emulsification-solvent evaporation method described above. Selenium was generated in situ by reducing sodium selenite (80.9 μL of 0.1 M aqueous solution) with ascorbic acid (80.9 μL of 0.2 M aqueous solution) (Caesar & Loretz GmbH, Hilden, Germany) in 4.0 mL of the aqueous phase (10% DPBS (v/v) in Milli-Q water), as already described in the literature.21 One minute after the start of the redox reaction, 0.4 mL of the organic, polymer-containing phase was added dropwise into the vigorously stirring aqueous phase. The mixture was stirred for 3 h to evaporate the acetonitrile (ACN) and to embed the elemental selenium in the polymer matrix and thus stabilize it. The selenium-containing nanoparticles were concentrated by centrifugation at 1500g for 15 min using Microseps Advance 30 K centrifugal filters (molecular weight cut-off 30 kDa, Pall Corporation, New York, USA).NP characterization
The nanoparticles were characterized as previously published by our group:77 dynamic light scattering (DLS)-based measurements (particle size distribution, polydispersity index, zeta potential) were carried out with a Malvern Zetasizer Nano ZS (Malvern Instruments, Herrenberg, Germany) equipped with a 633 nm He–Ne laser operating at an angle of 173 °C. The software used for data collecting and processing was Zetasizer software version 7.12 (Malvern Instruments, UK). To determine the size distribution, the concentrated samples were diluted 1:20 with 10% DPBS in Milli-Q water (10% DPBS (v/v)). 90 μL sample volume were measured in micro-UV-cuvettes (Carl Roth, Karlsruhe, Germany) at a controlled temperature of 25 °C (120 s equilibration time). Three repetitions with 11 runs of 10 s duration were performed for each sample. The data was analyzed with the software-integrated analysis model for “general purposes (normal resolution)”. For zeta potential measurements the samples were diluted 1:200 with 10% PBS in Milli-Q water. Samples were measured in folded capillary zeta cells (Malvern, Herrenberg, Germany) at 25 °C. Three repetitions with at least 60 runs were performed for each sample. The data was analyzed by “auto mode”. The result of the measurement is a discretized particle size distribution.
Furthermore, average size (hydrodynamic diameter), size distribution and concentration [particles ml−1] of the nanoparticles were determined using nanoparticle tracking analysis (NanoSight NS300, Malvern, Worcestershire, UK). The device was equipped with an O-Ring top-plate (ORTP) and the data was analyzed with NanoSight NTA 3.4 software (NTA Malvern Panalytical). Before measurement, all samples were diluted with Milli-Q water to achieve a good particle per frame value (20–100 particles per frame). The samples were applied by manual injection with sterile syringes. Each sample was measured in three cycles of 60 s duration (screen gain: 1.0; camera level: 16) at RT. The detection threshold was set at 3.
Fura-2 AM-based Ca2+ mobilization assay
Calcium influx into the cytosol after AT1R activation was measured using Fura-2 AM-based ratiometric Ca2+ assay as previously described in literature.13,40,41 Therefore, rMCs were harvested, centrifuged (0.2g, 5 min) and carefully resuspended in Leibovitz's-based Fura-2 AM loading medium, composed of 25 μg Fura-2 AM (Invitrogen, Thermo Scientific, Oregon, USA) preresoveld in 25 μL cell culture grade DMSO, 10 μL 20% pluronic F-127 and 2.5 mM probenecid in Leibovitz's L-15 medium. After 1 h of incubation on the lab shaker (50 rpm) under light protection, the cells were centrifuged again (0.2g, 5 min) for discarding the Fura-2 AM loading medium and resuspended in Leibovitz's measurement buffer containing 2.5 mM probenecid.To determine the equilibrium dissociation constant (KD) of Ang-ll, the cell number was adjusted to 1.0 × 10⁶ cells mL−1via Neubauer improved counting chamber (Marienfeld, Lauda-Königshofen, Germany). 20 μL of a ten-fold over-concentrated serial dilution of Lys-Ang-ll was pipetted into a white 96-well plate (Greiner Bio One, Frickenhausen, Germany) and 180 μL of the cell suspension were added via FLUOstar Omega pump system set to a speed of 100 μL s−1 (Fig. S11, ESI†).
To determine the half maximal inhibitory concentration (IC50) of EXP3174-functionalized NPs, the cell number was adjusted to 2.0 × 10⁶ cells mL−1via Neubauer improved counting chamber (Germany, Marienfeld). For the experiment 20 μL of a ten-fold over-concentrated serial dilution of NPs were incubated with 90 μL cell suspension in a white 96-well plate for 30 min at RT under moderate shaking (50 rpm). After the incubation period, 90 μL of a 300 nM Lys-Ang-ll solution (sequence: NH2-KDRVYIHPF-COOH, Mw 1173.6 g mol−1; GenScript, Rijswijk, Netherlands) were added via the FLUOstar Omega pump system to activate the non-inhibited part of the AT1R and induce calcium influx (Fig. S11, ESI†). For optimization of assay sensitivity and reproducibility it is recommended to use agonists at the concentration of their EC80 value when antagonism is assessed in competition assays.84 The EC80 value was determined in advance for the free agonist Lys-Ang-ll to 135 nM, also by measuring the Ca2+ influx.41
In both experimental settings, the fluorescence intensity was measured ratiometricly on a FLUOstar Omega plate-reader (BMG Labtech, Ortenberg, Germany) exciting the samples alternately at λ = 340/20 nm and λ = 380/20 nm every 1.5 s, while the emitted light was recorded at λ = 510/20 nm for 30 s. To calculate the intracellular Ca2+ levels the highest measured ratio of each sample was used and the value was entered into Grynkiewicz-equation.40 The maximum ratio (Rmax), required in the equation for calibration, was determined by lysing the cells with 20 μL of 1% Triton® X-100 in PBS. Similarly, the minimum ratio (Rmin) was obtained by incubating the cells with 20 μL of 1% Triton® X-100 in PBS supplemented with 45 mM of ethylene glycol-bis(β-aminoethyl ether)-N,N,N′,N′-tetraacetic acid (EGTA), a strong calcium chelating agent, and 0.5 M NaOH. The KD value for the Fura-2-calcium complex was taken from the literature with a value of 225 nM.40 The data was plotted and analyzed with Origin 2022b software (OriginLab Corporation, Northampton, Ma, USA).
CLSM analysis
Confocal laser scanning microscopy images were recorded on a Zeiss LSM 710 (Carl Zeiss Microscopy GmbH, Jena, Germany) to demonstrate the uptake inhibition by functionalizing the particles with the antagonistic ligand (Fig. S6 and S7, ESI†). The images were processed and analyzed using ZEN 3.5 blue edition software. In preparation for image acquisition, 20000 rMCs per well were seeded in an Ibidi 8-well chamber (Ibidi, Grafelfing, Germany) and incubated for 24 h at 37 °C (5% CO2). Fluorescent nanoparticles were manufactured according to the procedure described above using CY-5-labeled PLGA and adjusted to 3 nM in Leibovitz's L-15 medium. Before sample introduction, the cell medium was removed, and the cells were washed twice with pre-warmed DPBS. Next, the cells were incubated with 200 μL of the nanoparticle dispersion for 30 min at 37 °C (5% CO2) or at RT. After the incubation period, the nanoparticle excess was aspirated, and the cells were washed with DPBS. For fixation, the cells were washed with pre-warmed DPBS once and then incubated with 4% paraformaldehyde (PFA) (Merck, Darmstadt, Germany) solution for 10 min at RT. The nuclei were stained by incubating the cells with 4′,6-diamidino-2-phenylindole (DAPI) staining solution (1 μg mL−1 in PBS) for 10 min at RT. After another washing step with DPBS, the cell membrane was stained with 10 μM organic 3,3-dioctadecyloxacarbocyanine (DiO) staining solution in DPBS for 15 min at RT. Finally, the samples were stored on DPBS in the dark at 2–8 °C.
Flow cytometry
RMCs were seeded in TC-treated 24-well plates (Costar, Corning Incorporated, New York, USA) at a density of 60000 cells per well and cultivated for 24 h (37 °C, 5% CO2) before proceeding for the fluorescence-activated cell sorting (FACS) analysis. On the day of experiment, the cells were at least 90% confluent. To determine the NP binding curve, serial dilutions (3 nM to 3 pM) of EXP3174 functionalized NPs produced with CY5-labeled PLGA were prepared in Leibovitz's L-15 medium. The cells were set up for the experiments by discarding RPMI 1640 medium. They were then incubated with 200 μL of each NP dilution (3 replicates) under gentle shaking (50 rpm) for 30 min (37 °C, 5% CO2). After the incubation period, the NP dilutions were discarded, and the cells were washed once on-plate with 500 μL DPBS. For harvesting, 300 μL of trypsin (PAN-Biotech, Aidenbach, Germany) were added and the cells were incubated for 2 min (37 °C, 5% CO2). After cell detachment 500 μL of ice-cold RPMI 1640 were added to quench trypsinization. The samples were transferred to 2.0 ml Eppendorf-Tubes and centrifuged (0.2g, 5 min, 4 °C). The supernatant was discarded, and cells were washed twice with ice-cold DPBS under centrifugation. The cell pellets obtained after the last washing step were resuspended in 300 μL ice-cold DPBS and kept on ice until measurement. FACS analyses were performed on a FACS Canto ll (Becton Dickinson, Franklin Lakes, USA). The fluorescence of the CY5-labeled NPs was excited at λ = 633 nm and the emission was recorded using a 661/16 nm bandpass filter. The data was analyzed and plotted using Flowing software (v2.5.1, Cell Imaging and Cytometry Core, Turku Bioscience Centre, Turku, Finland, with the support of Biocenter Finland). Further evaluations were carried out based on the determined geometric mean of the fluorescence intensity.
Transmission electron microscopy
For sample preparation 9 nm carbon film coated onto 3.5 nm Cu TEM grids (400 mesh) (Plano GmbH, Wetzlar, Germany) were hydrophilized in the oxygen plasma and 5 μL of the respective nanoparticle dispersion were applied to the grids for 5 s and subsequently for 1 min. Afterwards, the excess sample were removed carefully with a filter paper, and the copper-grids were washed with Milli-Q water and exposed for 30 s to an aqueous dilution of uranyl acetate (1%). A stack of images at different positions was recorded on JEM-2100F Field emission electron microscope (Jeol, Freising, Germany) at 20000-fold magnification using the SerialEM software. The size of 500 NPs of each batch were analyzed using Fiji software.85 The size distribution was plotted with R; mode and mean value as well as the empirical standard deviation were calculated (Table S1, ESI†).
Radiometric saturation binding assay
The radioligand [3H]UR-MK292, a tritium labeled angiotensin-ll derivative, was prepared according to a reported procedure86 with the following modification: as the supplier of the labeling reagent succinimidyl [3H]propionate (Novandi, Södertälje, Sweden) provides a precisely determined molar activity and due the fact that [3H]UR-MK292 bears exactly one tritiated propionyl residue originating from the labeling reagent, the molar activity of [3H]UR-MK292 was not determined by HPLC (calibration curve based on UR-MK292 and UV detection). Instead, it was defined to be equal to the molar activity of the labeling reagent, amounting to 3.44 TBq mmol−1 (it is assumed that under the mild reaction conditions the carbon–tritium bonds remained intact). The molar activity of the labeling reagent succinimidyl [3H]propionate was determined by LC-MS analysis. Coinjection of “cold” succinimidyl propionate allowed the quantification of the incorporated tritium (Novandi, Södertälje, Sweden). [3H]UR-MK292 was obtained with a radiochemical yield of 39%. The radiochemical purity amounted to 99% (Fig. S10, ESI†). The synthesis of the “cold” equivalent (UR-MK292) was described previously.86For the saturation binding studies, the radioligand was stretched in a 1:1 ratio with cold ligand. Leibovitz L-15 medium supplemented with bovine serum albumin (BSA) (0.1%) and the protease inhibitor bacitracin (100 μg ml−1) (Serva, Heidelberg, Germany) was used as binding buffer. For the experiments rMCs were cultured in T150 flasks (Corning, New York, USA) in passage number 78. On the day of experiment the cells were washed with DPBS, harvested with trypsin (PAN-Biotech, Aidenbach, Germany), and resuspended in binding buffer. 160 μL of the cell suspension were pipetted to each well of a 96-well plate (clear 96-well flexible PET microplate, round bottom, 1450 Beta, PerkinElmer), with the concentration adjusted to 250000 cells per well. For total binding, binding buffer (20 μL) and the same volume of binding buffer containing the radioligand 10-fold concentrated, were added. The unspecific binding was determined with the addition of binding buffer containing the radioligand (10-fold concentrated, 20 μL) and binding buffer containing EXP3174 in a 500-fold excess concentration as competitor (20 μL). The plates were incubated for 2 h at 22 ± 2 °C, gently shaken. Afterwards, cells were quantitatively transferred to a filter mat (Whatman cytiva, GF/C™) that had been soaked with a 0.3% polyethylenimine (PEI) solution beforehand, using a harvester for 96 well plates. The wells of the plate and consequently the cells on the filter mat were washed twice with ice-cold PBS (200 μL). Filter pieces were punched out from the filter mat and were transferred into a 96-well plate (1450-401 96-well sample plate, PerkinElmer, Rodgau, Germany). 200 μL of scintillation cocktail (Rotiszint® Routine, NPE-free, Roth, Karlsruhe, Germany) were added and the plate was sealed with a transparent sealing tape (permanent seal for microplates/PerkinElmer). After incubation in the dark under shaking for at least 12 h, radioactivity (dpm) was measured with a MicroBeta2 2450 microplate counter (PerkinElmer).
Quantification of the selenium-tagged nanoparticles on the cellular matrix via ICP-MS
To quantify the number cell-associated nanoparticles when they were applied in the concentration equal to their Ki value, selenium-containing nanoparticles were manufactured, and their concentration was determined in independent triplicates by NTA measurements (N = 3; n = 3). The nanoparticle dispersion was diluted to the concentration of the Ki value (25%-EXP-NPS_selenium-containing: 0.19 pM). RMCs, cultured in passage number 78, were harvested and their concentration was adjusted to 2.0 × 10⁶ cells ml−1 in suspension with Leibovitz's medium. The target cells were incubated with the nanoparticles in the concentration of their Ki value for 30 min at RT under moderate shaking. The experimental setting was chosen in terms of volume ratios of cell suspension to nanoparticles and incubation conditions as for the determination of the Ki of the nanoparticles (please refer to Fura-2 AM-based Ca2+ mobilization assay). After the incubation period, the supernatant was centrifuged and the selenium content in the cell pellets was measured by ICP-MS. In addition, a calibration curve of selenium-containing nanoparticles in the concentration range of 0.01 pM to 0.3 nM nanoparticle concentration was recorded. To compensate for the deviation in selenium content between different batches, which was calculated at 16.7% (Fig. S8, ESI†), the calibration curve and the samples were prepared from the same batch of selenium-containing nanoparticles. The samples were prepared for ICP-MS measurement by adding 1 μg L−1 rhodium (1000 mg L−1 rhodium in 5% HCl, Carl Roth GmbH, Karlsruhe, Germany) as internal standard and then measured according to DIN EN ISO 17294-2:2017-01 (LoQ = 1 μg L−1) on a NexION 2000 ICP-MS (PerkinElmer, Waltham, Massachusetts, USA) operating with the software Syngistix 3.1 (2021). The unit was calibrated against a selenium standard containing 10 mg L−1 selenium (TraceCERT Periodic Table Mix 1).Clustered standard error analysis
Clustered standard error analyses were carried out for the regression models with R software.87 This accounts for the clustering that occurs in the data sets due to the multiple independent collection of regression lines and affects the standard errors, the t-statistics and the p-values of the averaged regression line.88 The corresponding regression tables report the estimators for intercept and gradient, the standard error as a measure of the precision of the estimates, the t-statistic and the p-value associated with the t-statistic.Calculation model
To experimentally determine the average number of simultaneously binding ligands per nanoparticle, the number of specific binding ligands (Nbound) was assumed to be a function of occupied receptors (Noc) relative to the number of nanoparticles (NNP) in the system attached to the cell membrane.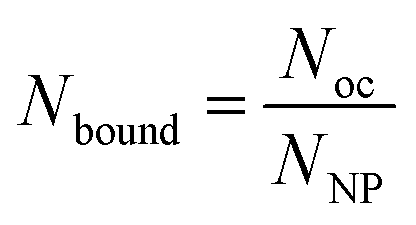 | (9) |
If the number of nanoparticles present in the system corresponds to the concentration of their Ki value, it can be assumed that exactly half of the available receptors (NAT1R) are occupied by ligands. Noc can therefore be described as:
| Noc = 0.5·NAT1R | (10) |
Substituting eqn (10) into eqn (9) yields eqn (11), which can be solved by experimental data.
 | (11) |
The experimental data was collected with a polymeric core–shell nanoparticle whose surface was functionalized with a high affinity ligand, which was losartan carboxylic acid (EXP3174), a full antagonist at the AT1R. Ligand-bearing chains and carboxy-terminated spacer chains in the shell of the model nanoparticle had the same chain length (kDa). The morphology of a rigid tethered nanoparticle was thus assumed. RMCs were chosen as a model cell line because of their stable AT1R expression.1 All assumptions refer to specific ligand–receptor interactions.
Fitting models
The binding curves obtained from the Ca2+ mobilization assays with Lys-Ang-ll, 25%-EXP-NPs and 25%-EXP-NPs_selenium-containing were fitted using a dose–response model (eqn (12)).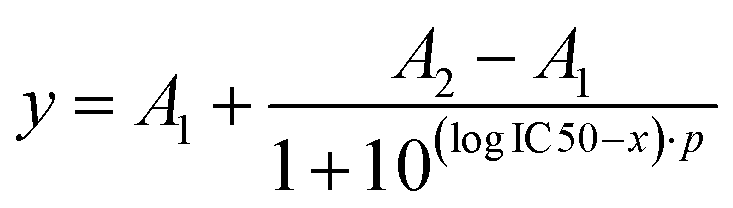 | (12) |
A 2 indicates the maximum response asymptote and A1 the baseline, and p is the slope.
Data for saturation curves obtained from saturation binding studies with CY-5-labeled 25%-EXP-NPs in flow cytometry experiments and from studies with [3H]UR-MK292 were fitted using Michaelis Menten binding model (eqn (13)), with Bmax corresponding to the maximal binding capacity.
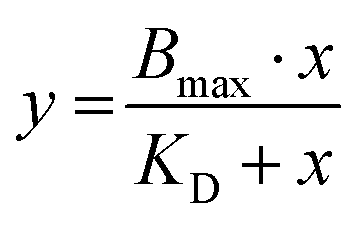 | (13) |
Density functions of nanoparticle size distributions were assessed by non-parametric Kernel density estimation.
The data was fitted using Origin 2022b software (OriginLab Corporation/Northampton/Ma/USA) and R software (R Core Team (2022). R: A language and environment for statistical computing. R Foundation for Statistical Computing, Vienna, Austria. URL https://www.R-project.org/).
Statistics
The statistical significance between means was evaluated with Student's two sample t-test and, in case of unequal variances, with Welch's two sample t-test using Origin 2022b software.The effect of error propagation of the relative uncertainty of the results from different experiments (specified as SD and SEM) is difficult to estimate for the overall result. A particular focus was therefore on minimizing and characterizing the errors of the interim results.
Software
The software used for the different experiments is listed below.TopSpin 4.1.4 software was used for NMR processing and analysis.
Origin 2022b software (OriginLab Corporation/Northampton/Ma/USA) for data plotting and analyzing.
Flowing software (v2.5.1, Cell Imaging and Cytometry Core, Turku Bioscience Centre, Turku, Finland, with the support of Biocenter Finland) for FACS data analyses and plotting.
R software (R Core Team (2022). R: A language and environment for statistical computing. R Foundation for Statistical Computing, Vienna, Austria. URL https://www.R-project.org/) for data plotting and statistical analysis.
Gnuplot (Williams and Kelley. Gnuplot 5.4: an interactive plotting program. 2020. URL https://gnuplot.info (Last accessed: 2022-11-16)).
Fiji software85 for TEM image processing.
Zen 3.5 blue edition software (Carl Zeiss Microscopy/Oberkochen/Germany) was used for confocal laser scanning microscopy image processing.
CorelDRAW 2023 Graphics Suite was used for graphical illustrations.
Abbreviations
| A 1 | Baseline in the dose–response model |
| A 2 | Maximum response asymptote in the dose–response model |
| ACN | Acetonitrile |
| AT1R | Angiotensin-ll type 1 receptor |
| B max | Maximal binding capacity |
| BSA | Bovine serum albumin |
| CCP | Clathrin coated pit |
| CY-5 | Cyanine-5-amine |
| DAPI | 4′,6-Diamidino-2-phenylindole |
| DBU | 1,8-Diazabicyclo(5.4.0)undec-7-ene |
| DCM | Dichloromethane |
| DIN EN ISO | Recognized standard in Germany, Europe and internationally |
| DiO | 3,3-Dioctadecyloxacarbocyanine |
| DIPEA | N,N-Diisopropylethylamine |
| DLS | Dynamic light scattering |
| DMF | N,N-Dimethylformamide |
| DMSO | Dimethyl sulfoxide |
| DMSO-d6 | Deuterated dimethyl sulfoxide |
| DNA | Deoxyribonucleic acid |
| DPBS | Dulbecco's phosphate-buffered saline |
| E | Effect at the receptor |
| EDC | 1-Ethyl-3-(3-dimethylaminopropyl)carbodiimide |
| EGTA | Ethylene glycol-bis(β-aminoethyl ether)-N,N,N′,N′-tetraacetic acid |
| E max | Maximal effect at the receptor |
| equiv. | Equivalent |
| EXP3174 | Losartan carboxylic acid |
| FACS | Fluorescence activated cell sorting |
| FBS | Fetal bovine serum |
| Fluram | Fluorescamine, 4′-phenylspiro[2-benzofuran-3,2′-furan]-1,3′-dione |
| FTIR | Fourier-transformed infrared spectroscopy |
| g | Unit for relative centrifugal force |
| h | Hour |
| HBTU | (2-(1H-Benzotriazol-1-yl)-1,1,3,3-tetramethyluronium hexafluorophosphate) |
| He–Ne laser | Helium–neon laser |
| 1H-NMR | Hydrogen-1 nuclear magnetic resonance spectroscopy |
| [3H]UR-MK292 | Tritium labeled angiotensin-ll derivative |
| IC50 | Half maximal inhibitory concentration |
| ICP-OES | Inductively coupled plasma optical spectrometry |
| ITS | Insulin-transferrin-selenium |
| K D | Equilibrium dissociation constant |
| kDa | Kilodalton |
| K i | Equilibrium inhibition constant |
| LoQ | Limit of quantification |
| Lys-Ang-ll | Lys-angiotensin-ll (Sequence: NH2-KDRVYIHPF-COOH) |
| Milli-Q water | Ultrapure water |
| min | Minutes |
| mPEG5k | Poly(ethylene glycole) monomethyl ether with an average molecular weight of 5000 g mol−1 |
| M w | Molecular weight |
| MWCO | Molecular weight cut-off |
| N AT1R | Number of available AT1 receptors |
| N bound | Number of specifically binding ligands per nanoparticle |
| NHS | N-Hydroxysuccinimide |
| N NP | Number of nanoparticles attached to the cell membrane |
| N oc | Number of occupied receptors |
| NPs | Nanoparticles |
| NTA | Single nanoparticle tracking analysis |
| ORTP | O-Ring top plate |
| p | Slope in the dose–response model |
| PEG | Polyethylene glycole |
| PEI | Polyethylenimine |
| PFA | Paraformaldehyde |
| PLGA | Poly(D,L-lactide-co-glycolide) |
| ppb | Parts per billion |
| Q-TOF | Quadrupole time-of-flight |
| rMC | Rat mesangial cells |
| R max | Maximum ratio in the Grynkiewicz-equation |
| R min | Minimum ratio in the Grynkiewicz-equation |
| ROP | Ring-opening polymerization |
| rpm | Rotations per minute |
| RT | Room temperature |
| s | Seconds |
| TC-treated | Tissue culture treated |
| TEM | Transmission electron microscopy |
| TFA | Trifluoroacetic acid |
| UHPLC | Ultra-high performance liquid chromatography |
Author contributions
A. G., M. K., R. W., K. S., S. B. and O. Z. designed research; M. K., K. S., F. B. and O. Z. performed research; K. S. analyzed data; A. G. and K. S. wrote the paper; A. G. supervised the project.Data availability
The data supporting this article have been included as part of the ESI.†Conflicts of interest
There are no conflicts of interest to declare.Acknowledgements
This work was supported by German Research Foundation (Deutsche Forschungsgemeinschaft, DFG) grant GO 565/20-1. The authors thank Prof. Miriam Breunig, Prof. Reinhard Rachel and Prof. Axel Dürkop for their expert advice. Furthermore, the authors thank Melanie Bresinsky and Johannes Lang for many constructive discussions. The authors like to acknowledge the excellent technical assistance by Renate Liebl, Brigitte Wenzl, Vanessa Tomanek and Olga Maier. The authors like to thank INDIKATOR GmbH (Wilhelm-Muthmann-Str. 15/42329 Wuppertal) for the support and implementation of the ICP-MS measurements against compensation.References
- S. Maslanka Figueroa, A. Veser, K. Abstiens, D. Fleischmann, S. Beck and A. Goepferich, Influenza A virus mimetic nanoparticles trigger selective cell uptake, Proc. Natl. Acad. Sci. U. S. A., 2019, 116, 9831–9836, DOI:10.1073/pnas.1902563116
.
- D. Fleischmann, S. Maslanka Figueroa, S. Beck, K. Abstiens, R. Witzgall, F. Schweda, P. Tauber and A. Goepferich, Adenovirus-Mimetic Nanoparticles: Sequential Ligand–Receptor Interplay as a Universal Tool for Enhanced In Vitro/In Vivo Cell Identification, ACS Appl. Mater. Interfaces, 2020, 12, 34689–34702, DOI:10.1021/acsami.0c10057
- S. Maslanka Figueroa, D. Fleischmann, S. Beck, P. Tauber, R. Witzgall, F. Schweda and A. Goepferich, Nanoparticles Mimicking Viral Cell Recognition Strategies Are Superior Transporters into Mesangial Cells, Adv. Sci., 2020, 7, 1903204, DOI:10.1002/advs.201903204
- A. M. Alkilany, L. Zhu, H. Weller, A. Mews, W. J. Parak, M. Barz and N. Feliu, Ligand density on nanoparticles: A parameter with critical impact on nanomedicine, Adv. Drug Delivery Rev., 2019, 143, 22–36, DOI:10.1016/j.addr.2019.05.010
- S. Zhang, H. Gao and G. Bao, Physical Principles of Nanoparticle Cellular Endocytosis, ACS Nano, 2015, 9, 8655–8671, DOI:10.1021/acsnano.5b03184
- M. Wang, S. R. Ravindranath, M. K. Rahim, E. L. Botvinick and J. B. Haun, Evolution of Multivalent Nanoparticle Adhesion via Specific Molecular Interactions, Langmuir, 2016, 32, 13124–13136, DOI:10.1021/acs.langmuir.6b03014
- A. Verma and F. Stellacci, Effect of surface properties on nanoparticle-cell interactions, Small, 2010, 6, 12–21, DOI:10.1002/smll.200901158
- H. Ding and Y. Ma, Theoretical and computational investigations of nanoparticle-biomembrane interactions in cellular delivery, Small, 2015, 11, 1055–1071, DOI:10.1002/smll.201401943
- D. Septiadi, F. Crippa, T. L. Moore, B. Rothen-Rutishauser and A. Petri-Fink, Nanoparticle-Cell Interaction: A Cell Mechanics Perspective, Adv. Mater., 2018, 30, e1704463, DOI:10.1002/adma.201704463
- P. I. Kitov and D. R. Bundle, On the nature of the multivalency effect: a thermodynamic model, J. Am. Chem. Soc., 2003, 125, 16271–16284, DOI:10.1021/ja038223n
- S. Erlendsson and K. Teilum, Binding Revisited-Avidity in Cellular Function and Signaling, Front. Mol. Biosci., 2020, 7, 615565, DOI:10.3389/fmolb.2020.615565
- S. Farokhirad, R. P. Bradley and R. Radhakrishnan, Thermodynamic analysis of multivalent binding of functionalized nanoparticles to membrane surface reveals the importance of membrane entropy and nanoparticle entropy in adhesion of flexible nanoparticles, Soft Matter, 2019, 15, 9271–9286, 10.1039/c9sm01653h
- O. Zimmer and A. Goepferich, How clathrin-coated pits control nanoparticle avidity for cells, Nanoscale Horiz., 2023, 8, 256–269, 10.1039/d2nh00543c
- J. Liu, G. E. R. Weller, B. Zern, P. S. Ayyaswamy, D. M. Eckmann, V. R. Muzykantov and R. Radhakrishnan, Computational model for nanocarrier binding to endothelium validated using in vivo, in vitro, and atomic force microscopy experiments, Proc. Natl. Acad. Sci. U. S. A., 2010, 107, 16530–16535, DOI:10.1073/pnas.1006611107
- H. Yuan, C. Huang and S. Zhang, Virus-inspired design principles of nanoparticle-based bioagents, PLoS One, 2010, 5, e13495, DOI:10.1371/journal.pone.0013495
- M.-H. Li, S. K. Choi, P. R. Leroueil and J. R. Baker, Evaluating binding avidities of populations of heterogeneous multivalent ligand-functionalized nanoparticles, ACS Nano, 2014, 8, 5600–5609, DOI:10.1021/nn406455s
- H. Yuan and S. Zhang, Effects of particle size and ligand density on the kinetics of receptor-mediated endocytosis of nanoparticles, Appl. Phys. Lett., 2010, 96, 33704, DOI:10.1063/1.3293303
- S. Hong, P. R. Leroueil, I. J. Majoros, B. G. Orr, J. R. Baker and M. M. Banaszak Holl, The binding avidity of a nanoparticle-based multivalent targeted drug delivery platform, Chem. Biol., 2007, 14, 107–115, DOI:10.1016/j.chembiol.2006.11.015
- S. T. Johnston, M. Faria and E. J. Crampin, Understanding nano-engineered particle-cell interactions: biological insights from mathematical models, Nanoscale Adv., 2021, 3, 2139–2156, 10.1039/d0na00774a
- W. Hild, K. Pollinger, A. Caporale, C. Cabrele, M. Keller, N. Pluym, A. Buschauer, R. Rachel, J. Tessmar and M. Breunig,
et al., G protein-coupled receptors function as logic gates for nanoparticle binding and cell uptake, Proc. Natl. Acad. Sci. U. S. A., 2010, 107, 10667–10672, DOI:10.1073/pnas.0912782107
- Y.-Y. Wang, W.-Y. Qiu, L. Sun, Z.-C. Ding and J.-K. Yan, Preparation, characterization, and antioxidant capacities of selenium nanoparticles stabilized using polysaccharide–protein complexes from Corbicula fluminea, Food Biosci., 2018, 26, 177–184, DOI:10.1016/j.fbio.2018.10.014
- T. Sonntag, F. Froemel, W. D. Stamer, A. Ohlmann, R. Fuchshofer and M. Breunig, Distribution of Gold Nanoparticles in the Anterior Chamber of the Eye after Intracameral Injection for Glaucoma Therapy, Pharmaceutics, 2021, 13, DOI:10.3390/pharmaceutics13060901
- A. Ivask, A. J. Mitchell, A. Malysheva, N. H. Voelcker and E. Lombi, Methodologies and approaches for the analysis of cell-nanoparticle interactions, Wiley Interdiscip. Rev.:Nanomed. Nanobiotechnol., 2018, 10, e1486, DOI:10.1002/wnan.1486
- M. S. Salahudeen and P. S. Nishtala, An overview of pharmacodynamic modelling, ligand-binding approach and its application in clinical practice, Saudi Pharm. J., 2017, 25, 165–175, DOI:10.1016/j.jsps.2016.07.002
- J. Sun, L. Zhang, J. Wang, Q. Feng, D. Liu, Q. Yin, D. Xu, Y. Wei, B. Ding and X. Shi,
et al., Tunable rigidity of (polymeric core)-(lipid shell) nanoparticles for regulated cellular uptake, Adv. Mater., 2015, 27, 1402–1407, DOI:10.1002/adma.201404788
- P. A. Tran and T. J. Webster, Antimicrobial selenium nanoparticle coatings on polymeric medical devices, Nanotechnology, 2013, 24, 155101, DOI:10.1088/0957-4484/24/15/155101
- Y. Luo, Z. Ren, R. Bo, X. Liu, J. Zhang, R. Yu, S. Chen, Z. Meng, Y. Xu and Y. Ma,
et al., Designing selenium polysaccharides-based nanoparticles to improve immune activity of Hericium erinaceus, Int. J. Biol. Macromol., 2020, 143, 393–400, DOI:10.1016/j.ijbiomac.2019.12.061
- A. K. Parthipan, N. Gupta, K. Pandey, B. Sharma, J. Jacob and S. Saha, One-step fabrication of bicompartmental microparticles as a dual drug delivery system for Parkinson's disease management, J. Mater. Sci., 2019, 54, 730–744, DOI:10.1007/s10853-018-2819-x
- M. Walter, M. Bresinsky, O. Zimmer, S. Pockes and A. Goepferich, Conditional Cell-Penetrating Peptide Exposure as Selective Nanoparticle Uptake Signal, ACS Appl. Mater. Interfaces, 2024, 16, 37734–37747, DOI:10.1021/acsami.4c07821
-
M. Hiramoto; N. Shimizu; T. Nishi; D. Shima; S. Aizawa; H. Tanaka; M. Hatakeyama; H. Kawaguchi and H. Handa, [8] – High-Performance Affinity Beads for Identifying Anti-NF-κ B Drug Receptors, inMethods in Enzymology: Redox Cell Biology and Genetics Part B, ed. C. K. Sen and L. Packer, Academic Press, 2002, pp. 81–88 Search PubMed
-
Methods in Enzymology: Redox Cell Biology and Genetics Part B, ed. C. K. Sen and L. Packer, Academic Press, 2002 Search PubMed
- S. Zhang and C. Wang, Precise Analysis of Nanoparticle Size Distribution in TEM Image, Methods Protoc., 2023, 6, DOI:10.3390/mps6040063
- D. Bachurski, M. Schuldner, P.-H. Nguyen, A. Malz, K. S. Reiners, P. C. Grenzi, F. Babatz, A. C. Schauss, H. P. Hansen and M. Hallek,
et al., Extracellular vesicle measurements with nanoparticle tracking analysis – An accuracy and repeatability comparison between NanoSight NS300 and ZetaView, J. Extracell. Vesicles, 2019, 8, 1596016, DOI:10.1080/20013078.2019.1596016
- R. Gref, M. Lück, P. Quellec, M. Marchand, E. Dellacherie, S. Harnisch, T. Blunk and R. Müller, ‘Stealth’ corona-core nanoparticles surface modified by polyethylene glycol (PEG): influences of the corona (PEG chain length and surface density) and of the core composition on phagocytic uptake and plasma protein adsorption, Colloids Surf., B, 2000, 18, 301–313, DOI:10.1016/S0927-7765(99)00156-3
- S. Maslanka Figueroa, D. Fleischmann, S. Beck and A. Goepferich, The Effect of Ligand Mobility on the Cellular Interaction of Multivalent Nanoparticles, Macromol. Biosci., 2020, 20, e1900427, DOI:10.1002/mabi.201900427
- J.-M. Rabanel, J. Faivre, S. F. Tehrani, A. Lalloz, P. Hildgen and X. Banquy, Effect of the Polymer Architecture on the Structural and Biophysical Properties of PEG-PLA Nanoparticles, ACS Appl. Mater. Interfaces, 2015, 7, 10374–10385, DOI:10.1021/acsami.5b01423
- S. R. Hoare, The Problems of Applying Classical Pharmacology Analysis to Modern In Vitro Drug Discovery Assays: Slow Binding Kinetics and High Target Concentration, SLAS Discovery, 2021, 26, 835–850, DOI:10.1177/24725552211019653
- C. Dong, Z. Liu and F. Wang, Radioligand saturation binding for quantitative analysis of ligand–receptor interactions, Biophys. Rep., 2015, 1, 148–155, DOI:10.1007/s41048-016-0016-5
- A. D. Attie and R. T. Raines, Analysis of Receptor–Ligand Interactions, J. Chem. Educ., 1995, 72, 119–124, DOI:10.1021/ed072p119
- G. Grynkiewicz, M. Poenie and R. Y. Tsien, A new generation of Ca2+ indicators with greatly improved fluorescence properties, J. Biol. Chem., 1985, 260, 3440–3450, DOI:10.1016/S0021-9258(19)83641-4
- R. Hennig, K. Pollinger, A. Veser, M. Breunig and A. Goepferich, Nanoparticle multivalency counterbalances the ligand affinity loss upon PEGylation, J. Controlled Release, 2014, 194, 20–27, DOI:10.1016/j.jconrel.2014.07.062
- E. C. Hulme and M. A. Trevethick, Ligand binding assays at equilibrium: validation and interpretation, Br. J. Pharmacol., 2010, 161, 1219–1237, DOI:10.1111/j.1476-5381.2009.00604.x
- A. J. Fuller, B. C. Hauschild, R. Gonzalez-Villalobos, M. S. Awayda, J. D. Imig, E. W. Inscho and L. G. Navar, Calcium and chloride channel activation by angiotensin II-AT1 receptors in preglomerular vascular smooth muscle cells, Am. J. Physiol.: Renal Physiol., 2005, 289, F760–7, DOI:10.1152/ajprenal.00422.2004
- S. Greco, M. Elia, A. Muscella, C. Storelli and S. Marsigliante, AT1 Angiotensin II receptor mediates intracellular calcium mobilization in normal and cancerous breast cells in primary culture, Cell Calcium, 2002, 32, 1–10, DOI:10.1016/S0143-4160(02)00077-5
- A. C. Holloway, H. Qian, L. Pipolo, J. Ziogas, S. Miura, S. Karnik, B. R. Southwell, M. J. Lew and W. G. Thomas, Side-chain substitutions within angiotensin II reveal different requirements for signaling, internalization, and phosphorylation of type 1A angiotensin receptors, Mol. Pharmacol., 2002, 61, 768–777, DOI:10.1124/mol.61.4.768
- P. Buchwald, A single unified model for fitting simple to complex receptor response data, Sci. Rep., 2020, 10, 13386, DOI:10.1038/s41598-020-70220-w
- M. Sousa de Almeida, E. Susnik, B. Drasler, P. Taladriz-Blanco, A. Petri-Fink and B. Rothen-Rutishauser, Understanding
nanoparticle endocytosis to improve targeting strategies in nanomedicine, Chem. Soc. Rev., 2021, 50, 5397–5434, 10.1039/d0cs01127d
- A. Banerjee, A. Berezhkovskii and R. Nossal, Kinetics of cellular uptake of viruses and nanoparticles via clathrin-mediated endocytosis, Phys. Biol., 2016, 13, 16005, DOI:10.1088/1478-3975/13/1/016005
- P. Kozik, N. A. Hodson, D. A. Sahlender, N. Simecek, C. Soromani, J. Wu, L. M. Collinson and M. S. Robinson, A human genome-wide screen for regulators of clathrin-coated vesicle formation reveals an unexpected role for the V-ATPase, Nat. Cell Biol., 2013, 15, 50–60, DOI:10.1038/ncb2652
- M. Kaksonen and A. Roux, Mechanisms of clathrin-mediated endocytosis, Nat. Rev. Mol. Cell Biol., 2018, 19, 313–326, DOI:10.1038/nrm.2017.132
- H. S. Aldossary, D. J. Nieves, D. M. Kavanagh, D. Owen, C. J. Ray, P. Kumar, A. M. Coney and A. P. Holmes, Analyzing Angiotensin II Receptor Type 1 Clustering in PC12 Cells in Response to Hypoxia Using Direct Stochastic Optical Reconstruction Microscopy (dSTORM), Adv. Exp. Med. Biol., 2023, 1427, 175–184, DOI:10.1007/978-3-031-32371-3_19
- L. Paparelli, N. Corthout, B. Pavie, W. Annaert and S. Munck, Analyzing Protein Clusters on the Plasma Membrane: Application of Spatial Statistical Analysis Methods on Super-Resolution Microscopy Images, Adv. Anat., Embryol. Cell Biol., 2016, 219, 95–122, DOI:10.1007/978-3-319-28549-8_4
- A. Balla, D. J. Tóth, E. Soltész-Katona, G. Szakadáti, L. S. Erdélyi, P. Várnai and L. Hunyady, Mapping of the Localization of Type 1 Angiotensin Receptor in Membrane Microdomains Using Bioluminescence Resonance Energy Transfer-based Sensors, J. Biol. Chem., 2012, 287, 9090–9099, DOI:10.1074/jbc.M111.293944
- A. P. Liu, F. Aguet, G. Danuser and S. L. Schmid, Local clustering of transferrin receptors promotes clathrin-coated pit initiation, J. Cell Biol., 2010, 191, 1381–1393, DOI:10.1083/jcb.201008117
- P. Gale, Using thermodynamic equilibrium models to predict the effect of antiviral agents on infectivity: Theoretical application to SARS-CoV-2 and other viruses, Microb. Risk Anal., 2022, 21, 100198, DOI:10.1016/j.mran.2021.100198
- V. Reiter-Scherer, J. L. Cuellar-Camacho, S. Bhatia, R. Haag, A. Herrmann, D. Lauster and J. P. Rabe, Force Spectroscopy Shows Dynamic Binding of Influenza Hemagglutinin and Neuraminidase to Sialic Acid, Biophys. J., 2019, 116, 1037–1048, DOI:10.1016/j.bpj.2019.01.041
- J. M. Casasnovas and T. A. Springer, Kinetics and thermodynamics of virus binding to receptor. Studies with rhinovirus, intercellular adhesion molecule-1 (ICAM-1), and surface plasmon resonance, J. Biol. Chem., 1995, 270, 13216–13224, DOI:10.1074/jbc.270.22.13216
- H. L. Nguyen, P. D. Lan, N. Q. Thai, D. A. Nissley, E. P. O’Brien and M. S. Li, Does SARS-CoV-2 Bind to Human ACE2 More Strongly Than Does SARS-CoV?, J. Phys. Chem. B, 2020, 124, 7336–7347, DOI:10.1021/acs.jpcb.0c04511
- R. Creutznacher, T. Maass, J. Dülfer, C. Feldmann, V. Hartmann, M. S. Lane, J. Knickmann, L. T. Westermann, L. Thiede and T. J. Smith,
et al., Distinct dissociation rates of murine and human norovirus P-domain dimers suggest a role of dimer stability in virus-host interactions, Commun. Biol., 2022, 5, 563, DOI:10.1038/s42003-022-03497-4
- E. Bachrach, H. Dreja, Y.-L. Lin, C. Mettling, V. Pinet, P. Corbeau and M. Piechaczyk, Effects of virion surface gp120 density on infection by HIV-1 and viral production by infected cells, Virology, 2005, 332, 418–429, DOI:10.1016/j.virol.2004.11.031
- Y. Yamauchi and A. Helenius, Virus entry at a glance, J. Cell Sci., 2013, 126, 1289–1295, DOI:10.1242/jcs.119685
- M. Delguste, C. Zeippen, B. Machiels, J. Mast, L. Gillet and D. Alsteens, Multivalent binding of herpesvirus to living cells is tightly regulated during infection, Sci. Adv., 2018, 4, eaat1273, DOI:10.1126/sciadv.aat1273
- B. Turoňová, M. Sikora, C. Schürmann, W. J. H. Hagen, S. Welsch, F. E. C. Blanc, S. von Bülow, M. Gecht, K. Bagola and C. Hörner,
et al., In situ structural analysis of SARS-CoV-2 spike reveals flexibility mediated by three hinges, Science, 2020, 370, 203–208, DOI:10.1126/science.abd5223
- R. Sougrat, A. Bartesaghi, J. D. Lifson, A. E. Bennett, J. W. Bess, D. J. Zabransky and S. Subramaniam, Electron tomography of the contact between T cells and SIV/HIV-1: implications for viral entry, PLoS Pathog., 2007, 3, e63, DOI:10.1371/journal.ppat.0030063
- R. Newton, M. Delguste, M. Koehler, A. C. Dumitru, P. R. Laskowski, D. J. Müller and D. Alsteens, Combining confocal and atomic force microscopy to quantify single-virus binding to mammalian cell surfaces, Nat. Protoc., 2017, 12, 2275–2292, DOI:10.1038/nprot.2017.112
- C. Rankl, F. Kienberger, L. Wildling, J. Wruss, H. J. Gruber, D. Blaas and P. Hinterdorfer, Multiple receptors involved in human rhinovirus attachment to live cells, Proc. Natl. Acad. Sci. U. S. A., 2008, 105, 17778–17783, DOI:10.1073/pnas.0806451105
- D. K. Takemoto, J. J. Skehel and D. C. Wiley, A surface plasmon resonance assay for the binding of influenza virus hemagglutinin to its sialic acid receptor, Virology, 1996, 217, 452–458, DOI:10.1006/viro.1996.0139
- G. Pyrgiotakis, C. O. Blattmann and P. Demokritou, Real-Time Nanoparticle-Cell Interactions in Physiological Media by Atomic Force Microscopy, ACS Sustainable Chem. Eng., 2014, 2, 1681–1690, DOI:10.1021/sc500152g
- T. Yue and X. Zhang, Cooperative effect in receptor-mediated endocytosis of multiple nanoparticles, ACS Nano, 2012, 6, 3196–3205, DOI:10.1021/nn205125e
- C. Montis, V. Generini, G. Boccalini, P. Bergese, D. Bani and D. Berti, Model lipid bilayers mimic non-specific interactions of gold nanoparticles with macrophage plasma membranes, J. Colloid Interface Sci., 2018, 516, 284–294, DOI:10.1016/j.jcis.2018.01.064
- C. C. Fleischer and C. K. Payne, Nanoparticle surface charge mediates the cellular receptors used by protein-nanoparticle complexes, J. Phys. Chem. B, 2012, 116, 8901–8907, DOI:10.1021/jp304630q
- A. Lesniak, A. Salvati, M. J. Santos-Martinez, M. W. Radomski, K. A. Dawson and C. Åberg, Nanoparticle adhesion to the cell membrane and its effect on nanoparticle uptake efficiency, J. Am. Chem. Soc., 2013, 135, 1438–1444, DOI:10.1021/ja309812z
- D. Chen, S. Ganesh, W. Wang and M. Amiji, Protein Corona-Enabled Systemic Delivery and Targeting of Nanoparticles, AAPS J., 2020, 22, 83, DOI:10.1208/s12248-020-00464-x
- J. Wang, J. Min, S. A. Eghtesadi, R. S. Kane and A. Chilkoti, Quantitative Study of the Interaction of Multivalent Ligand-Modified Nanoparticles with Breast Cancer Cells with Tunable Receptor Density, ACS Nano, 2020, 14, 372–383, DOI:10.1021/acsnano.9b05689
- Z. Poon, S. Chen, A. C. Engler, H. Lee, E. Atas, G. von Maltzahn, S. N. Bhatia and P. T. Hammond, Ligand-clustered “patchy” nanoparticles for modulated cellular uptake and in vivo tumor targeting, Angew. Chem., Int. Ed., 2010, 49, 7266–7270, DOI:10.1002/anie.201003445
-
K. Abstiens, Heteromultivalent Nanoparticles for Selective Targeting of Renal Cells, Universität Regensburg, 2020 Search PubMed
- K. Schorr, X. Chen, T. Sasaki, A. P. Arias-Loza, J. Lang, T. Higuchi and A. Goepferich, Rethinking Thin-Layer Chromatography for Screening Technetium-99m Radiolabeled Polymer Nanoparticles, ACS Pharmacol. Transl. Sci., 2024, 7, 2604–2611, DOI:10.1021/acsptsci.4c00383
- H. Qian, A. R. Wohl, J. T. Crow, C. W. Macosko and T. R. Hoye, A Strategy for Control of “Random” Copolymerization of Lactide and Glycolide: Application to Synthesis of PEG-b-PLGA Block Polymers Having Narrow Dispersity, Macromolecules, 2011, 44, 7132–7140, DOI:10.1021/ma201169z
- K. Abstiens, M. Gregoritza and A. M. Goepferich, Ligand Density and Linker Length are Critical Factors for Multivalent Nanoparticle-Receptor Interactions, ACS Appl. Mater. Interfaces, 2019, 11, 1311–1320, DOI:10.1021/acsami.8b18843
- H. Zhao, Z. Liu, S.-H. Park, S.-H. Kim, J.-H. Kim and L. Piao, Preparation and Characterization of PEG/PLA Multiblock and Triblock Copolymer, Bull. Korean Chem. Soc., 2012, 33, 1638–1642, DOI:10.5012/bkcs.2012.33.5.1638
- C. E. Childs, The determination of polyethylene glycol in gamma globulin solutions, Microchem. J., 1975, 20, 190–192, DOI:10.1016/0026-265X(75)90038-7
- S. Udenfriend, S. Stein, P. Böhlen, W. Dairman, W. Leimgruber and M. Weigele, Fluorescamine: a reagent for assay of amino acids, peptides, proteins, and primary amines in the picomole range, Science, 1972, 178, 871–872, DOI:10.1126/science.178.4063.871
- C. Vauthier and K. Bouchemal, Methods for the preparation and manufacture of polymeric nanoparticles, Pharm. Res., 2009, 26, 1025–1058, DOI:10.1007/s11095-008-9800-3
- P. A. Neale and F. D. L. Leusch, Considerations when assessing antagonism in vitro: Why standardizing the agonist concentration matters, Chemosphere, 2015, 135, 20–23, DOI:10.1016/j.chemosphere.2015.03.054
- J. Schindelin, I. Arganda-Carreras, E. Frise, V. Kaynig, M. Longair, T. Pietzsch, S. Preibisch, C. Rueden, S. Saalfeld and B. Schmid,
et al., Fiji: an open-source platform for biological-image analysis, Nat. Methods, 2012, 9, 676–682, DOI:10.1038/nmeth.2019
- M. Keller, K. K. Kuhn, J. Einsiedel, H. Hübner, S. Biselli, C. Mollereau, D. Wifling, J. Svobodová, G. Bernhardt and C. Cabrele,
et al., Mimicking of Arginine by Functionalized N(ω)-Carbamoylated Arginine As a New Broadly Applicable Approach to Labeled Bioactive Peptides: High Affinity Angiotensin, Neuropeptide Y, Neuropeptide FF, and Neurotensin Receptor Ligands As Examples, J. Med. Chem., 2016, 59, 1925–1945, DOI:10.1021/acs.jmedchem.5b01495
-
G. Casella; S. Fienberg; I. Olkin and S. Sheather, Modern Approach to Regression With R, Springer Nature, New York, NY, 2009 Search PubMed
- B. I. Graubard and E. L. Korn, Regression analysis with clustered data, Stat. Med., 1994, 13, 509–522, DOI:10.1002/sim.4780130514
Footnote |
| † Electronic supplementary information (ESI) available. See DOI: https://doi.org/10.1039/d4nh00645c |
| This journal is © The Royal Society of Chemistry 2025 |