
 Open Access Article
 This Open Access Article is licensed under a
 Creative Commons Attribution 3.0 Unported Licence
Constructing vertically aligned Li+ transport pathways in a flexible solid polymer composite electrolyte by a soft template approach†
Shaoyin
Li
,
Yunke
Wang
,
Jose
Anguita
,
Kai
Yang
and
S. Ravi P.
Silva
 *
*
Advanced Technology Institute, Department of Electrical and Electronic Engineering, University of Surrey, Guildford, Surrey GU2 7XH, UK. E-mail: s.silva@surrey.ac.uk
First published on 18th February 2025
Abstract
Solid-state electrolytes provide excellent electrochemical stability, mechanical strength, and safety as compared to conventional liquid electrolytes for lithium-ion batteries. Recent advancements in polymer electrolytes mixed with nanofillers have enhanced ionic conductivity and stability owing to the interaction between nanoscale fillers and polymer matrix/lithium salt. However, the dispersion of isolated nanofillers affects the continuous lithium-ion transport pathways, thereby preventing the composite electrolyte from further improving its conductivity and stability. In this study, by using a sol–gel-template method, we prepared Li0.5La0.5TiO3 (LLTO) nano-arrays with vertically aligned structures as nanofillers in composite polymer electrolytes. The elongated, direct Li+ transport pathways formed by the LLTO nano-arrays allow for a 30 wt% filler ratio in the composite electrolyte, achieving a conductivity of 5.6 × 10⁻⁵ S cm−1 at 25 °C and 1.05 × 10⁻³ S cm−1 at 70 °C. This significant conductivity enhancement in the composite electrolyte also contributes to improved electrochemical and thermal stability. The vertical LLTO nano-bundle arrays (VLNA) structure represents a promising approach for high-performance composite polymer electrolytes for next-generation lithium batteries. Furthermore, this sol–gel-template method could be adapted to other kinds of inorganic ceramic electrolytes, expanding its applicability across different electrolyte systems.
1. Introduction
Solid-state electrolytes (SSE), as a promising alternative to flammable liquid electrolytes in lithium-ion batteries (LIBs), have received extensive attention from both academia and industry.1 To date, various SSE materials have been developed, which are typically classified into three main categories: inorganic (ceramic/glass) solid electrolytes (SE),2,3 solid polymer electrolytes (SPE), and composite electrolytes combining these types.4–6 Among widely studied SSEs, inorganic solid electrolytes exhibit a high lithium-ion conductivity (ranging from 10−4 to 10−2 S cm−1). However, the high interfacial impedance between the lithium metal anode and the inorganic electrolyte, resulting from rigid contact, poses a significant barrier to their practical application.7 On the contrary, SPEs improve the electrode/electrolyte interface through their flexibility, facilitating the interfacial Li+ diffusion. Despite this advantage, SPEs generally require elevated temperatures for operation due to their relatively low ionic conductivity (<10−5 S cm−1) at room temperature.8 To harness the benefits of both inorganic solid electrolytes (notably high ionic conductivity and mechanical strength) and SPEs (flexibility and enhanced compatibility), composite polymer electrolytes (CPEs) have been developed, with SE particles embedded as fillers within the polymer matrix.9–11 Numerous ceramic solid electrolyte fillers have been employed to enhance the performance of solid-state batteries (SSBs), including Li3xLa2/3−xTiO3 (LLTO), Li7La3Zr2O12 (LLZO) and Li1+xAlxTi2−x(PO4)3 (LATP).12–14In a conventional CPE structure, illustrated in Fig. 1a, dispersed inorganic fillers within a polymer matrix serve dual roles: reducing the crystallinity of polymer to enhance ionic conductivity and providing mechanical stability to resist lithium dendrite growth. Such CPEs are commonly fabricated through physical mixing and slurry casting techniques. However, the discontinuous nature of these dispersed particles restricts the ionic conductivity, as Li+ transport is significantly hindered by the polymer matrix.8,15 To address this limitation, several strategies have been developed to improve the performance of dispersed inorganic fillers in CPEs. For example, Bao et al. developed a 12 μm-thick sintered garnet ceramic skeleton composed of Li6.5La3Zr1.5Ta0.5O12 (LLZO) to create a composite solid-state electrolyte (CS-CSSE) with a three-dimensional interconnected structure. This approach significantly enhanced ionic conductivity (1.19 × 10⁻³ S cm−1) and the Li+ transference number (0.83), achieving dendrite formation resistance while maintaining high energy densities (376 W h kg−1 and 1186 W h L−1).16 To establish a continuous conductivity pathway, researchers have developed various CPEs with directional structures of ceramic fillers, including continuous nanosheets, nanoparticles, and nanowires (Fig. 1b and c).17–19 For instance, Fu's group introduced an electrospun LLZO-based 3D Li+-conducting ceramic network, which demonstrated a significant improvement in ionic conductivity, achieving 2.5 × 10⁻⁴ S cm−1 at room temperature.19 In this configuration (Fig. 1b), the ceramic fibre network is distributed within the polymer matrix; while this setup benefits from reduced polymer crystallinity, the varied orientations of the ceramic distribution extend the Li+ diffusion path, which can introduce additional impedance.20 Optimising Li+-conducting frameworks with direct diffusion pathways is essential for enhancing the ionic conductivity of CPEs. Recent studies have introduced vertically aligned ceramic conductors (Fig. 1c) to address this challenge.21 Cui et al. developed vertically aligned polymer/polymer interfaces within a CPE by combining PEO with polyimide via melt infiltration, highlighting the importance of continuous interfaces for efficient ion transport.21,22 Zha et al. developed a vertically aligned LAGP/SN hybrid electrolyte using an ice-templated LAGP ceramic framework. The structure enabled continuous ion transport, while the SN-based polymer electrolyte filled the microchannels via in situ thermal polymerisation. This hybrid electrolyte exhibited high ionic conductivity, a Li+ transference number of 0.77, and compatibility with high-voltage cathodes.23 Similarly, Zhai et al. achieved a 3.6-fold increase in conductivity by constructing vertically aligned LATP nanoparticle networks in PEO.13 These studies underscore the effectiveness of aligned structures in advancing CPE performance.
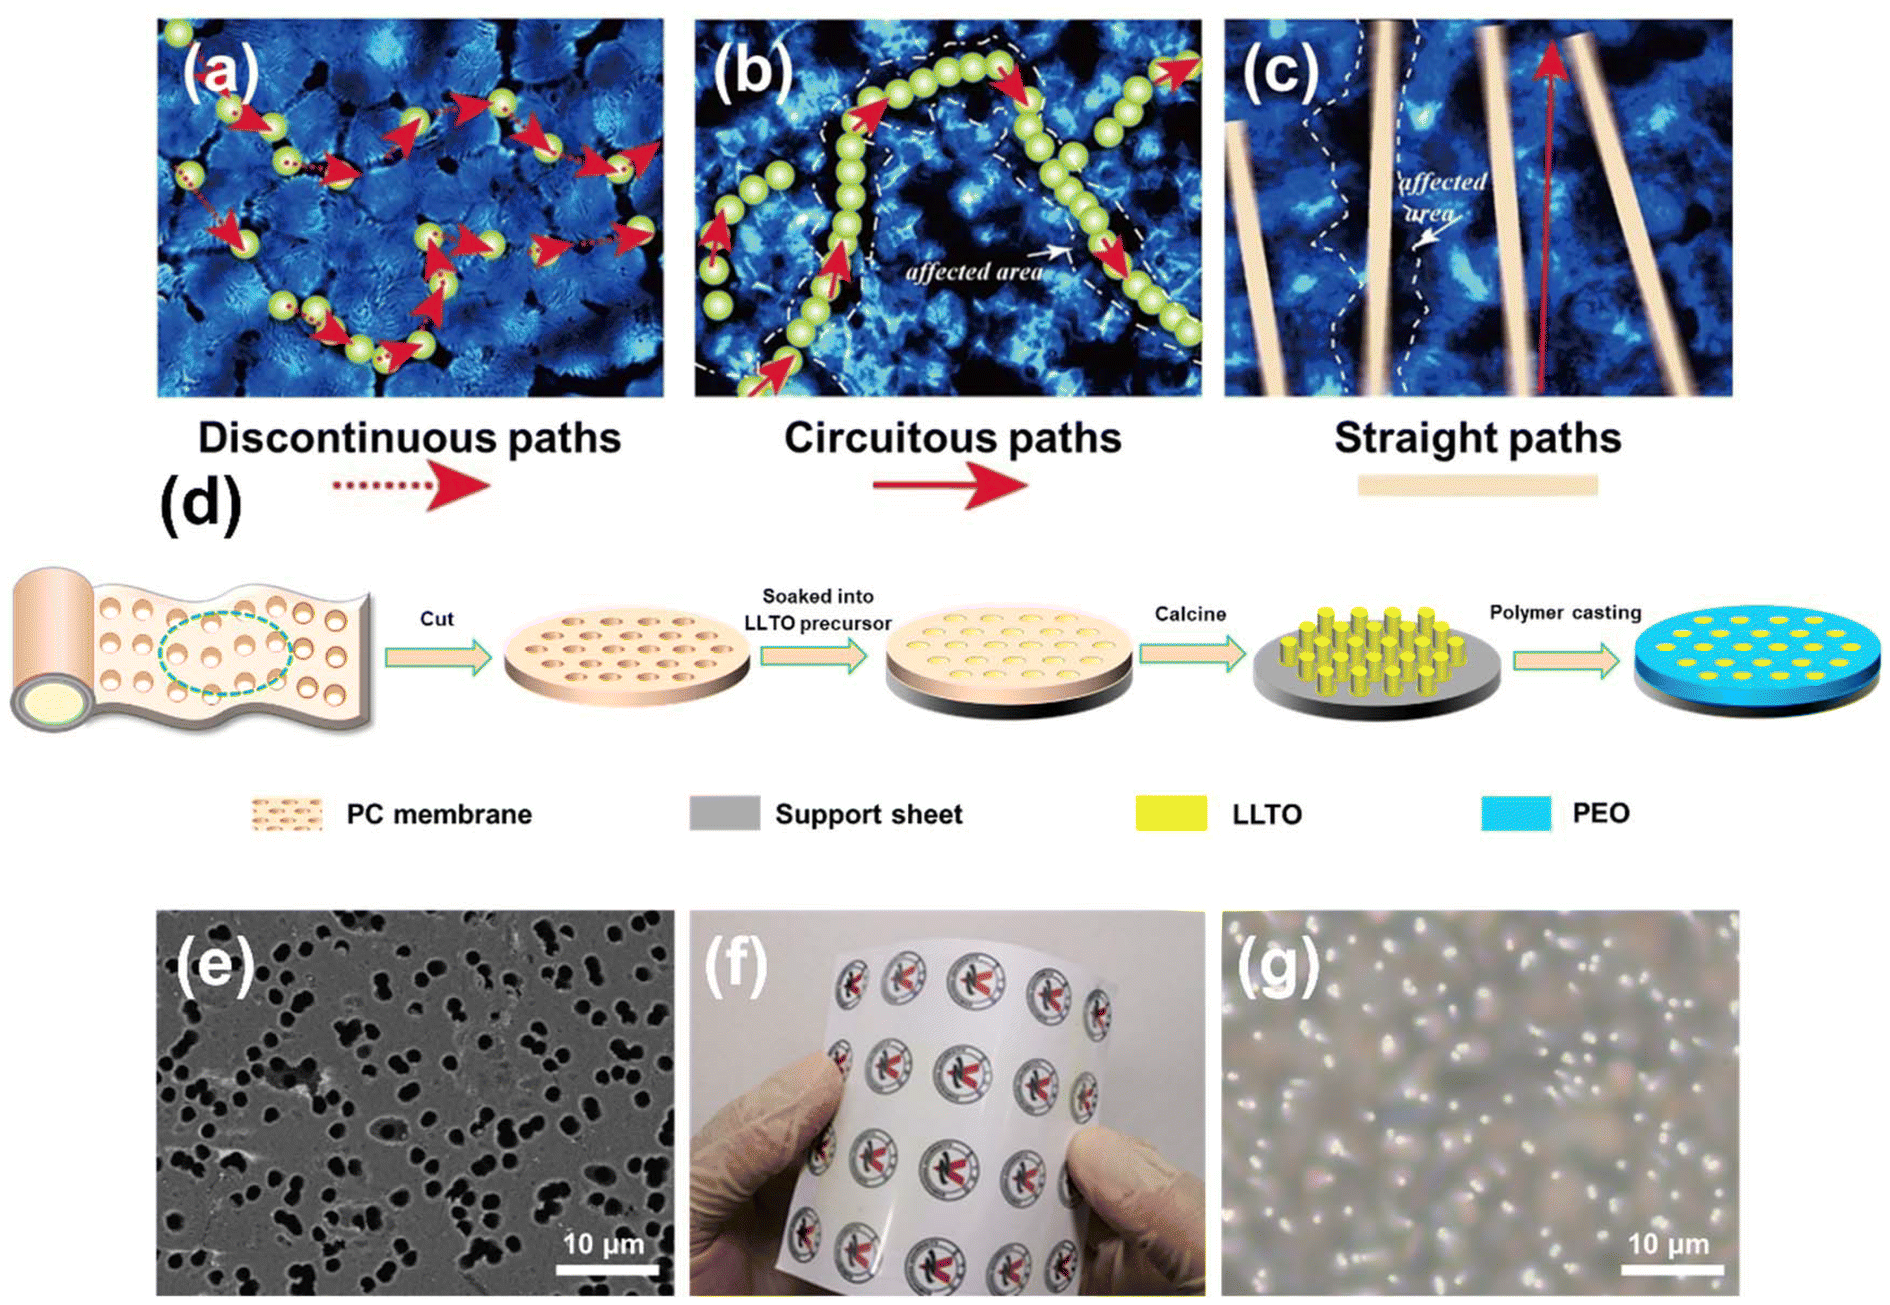 | ||
| Fig. 1 Schematic of three different kinds of ionic conduction mechanisms in composite polymer electrolytes: (a) conventional discontinuous particle filler, (b) random continuous filler, and (c) vertically continuous filler. (d) Schematics of fabrication procedures of vertical LLTO nano-array strengthened polymer. (e) SEM image of a porous polycarbonate (PC) film. (f) Digital photograph of a largescale PC film. (g) Optical microscope image of vertical LLTO nano-array strengthened polymer. | ||
In this work, we propose a novel CPE structure incorporating a vertical LLTO nano-bundle array (VLNA) dispersed within the PEO matrix (Fig. 1d). Li0.5La0.5TiO3 was chosen as the nanofiller due to its ability to combine with templating methods to produce various nanostructures, which provides a tailored platform for exploring the conduction mechanisms in composite electrolytes.24,25 A commercially available flexible and porous polycarbonate (PC) membrane serves as the template for constructing the vertically aligned LLTO structure (Fig. 1e and f). Following the infusion of the PEO electrolyte, the resulting vertical LLTO nano-array strengthened polymer electrolyte (VLSPE) demonstrates significantly enhanced ionic conductivity (Fig. 1g). By optimising the template pore size and thermal treatment, we further elucidate the relationship between ionic diffusion and the tunable electrolyte structure. This electrolyte design introduces a new perspective for constructing structured electrolytes and controlling ionic conductivity, applicable not only to solid-state lithium batteries but also to a broader range of energy storage devices.
2. Results and discussion
In the fabrication process of the VLSPE, the PC membranes were soaked in an LLTO precursor solution and then affixed to supporting silicon substrates. The saturated PC membranes were subsequently heated from 70 to 120 °C, held at 120 °C for 12 hours to evaporate the solvent, and then the samples were calcined at 800 °C for 3 hours to enable the LLTO precursor within the PC template to form a self-supported nano-bundle array on the substrate. Finally, a PEO solution containing LiTFSI was cast onto the vertical LLTO nano-array structure. After drying in a thermostatic oven followed by a vacuum oven at 60 °C for 48 hours, the VLSPE was obtained. As shown in Fig. 1e and Fig. S1,† the commercial porous PC membranes offer various specifications in the pore size (0.1 μm to 2.5 μm) and density (1 × 10⁶ to 1 × 109 cm−2), allowing for tuning of array size and density. Additionally, the thickness of the PC membranes is approximately 10 μm, which is beneficial for reducing electrolytes thickness and increasing overall battery energy density. The excellent flexibility of PC membranes (Fig. 1f) also indicates promising for large-scale electrolyte fabrications. The optical image in Fig. 1g shows the representative surface morphology of the final CPE, revealing that the LLTO arrays are uniformly distributed in the PEO matrix.Based on average pore size, the four types of PC membranes are designated as PC-0.1, PC-0.22, PC-1, and PC-2.5, respectively. Accordingly, VLNA and VLSPE synthesised using these PC membranes are named VLNA-pore size and VLSPE-pore size, respectively. Fig. 2a shows the SEM morphology of the VLNA-0.22 sample prepared with the PC-0.22 template, where LLTO exhibits a nanofibrous morphology with an average diameter of 0.13 μm. Notably, the LLTO nanowires group together to form a nano-bundle structure, as shown in the inset of Fig. 2a. The diameters of LLTO nanowires derived from different PC templates measure 0.07 μm, 0.13 μm, 0.42 μm, and 1.5 μm, respectively (Fig. S8†), which are smaller than the pore sizes of the corresponding templates. This reduction is largely attributed to solvent evaporation in the gel and volume densification during the formation of the inorganic ceramic phase, as is typical in nanomaterial preparation via the sol–gel method. Key parameters, including thickness, pore percentage, and pore density of different VLNAs, are summarised in Fig. S2.† The PC templates with varying pore sizes exhibit thicknesses ranging from 9 to 12 μm. As pore size increases, pore density (micro-holes per square centimetre) decreases, yet the total pore area percentage remains within 7.85% to 15.7%. Detailed microstructures of VLNAs are displayed in Fig. S3.† Notably, LLTO nanowires prepared using the PC-0.1 template lack sufficient strength to maintain a self-supporting vertical structure. In VLNA-1, the nanowire structure is vertically aligned; however, due to its lower pore density (Fig. S2†), the nanowire density is lower than in VLNA-0.22 (Fig. S3b†). Using the largest template pore size, the LLTO nanowires formed by the PC-2.5 template exhibit a coarse, hollow structure (Fig. S3c†). This morphology is likely due to volumetric shrinkage during LLTO calcination, with nanoscale fibres contracting predominantly along the axial direction, producing solid fibres. In contrast, micron-scale fibres undergo more prominent radial shrinkage, resulting in a hollow tube structure (Fig. S3c†). Additionally, the density of LLTO array bundles decreases with increasing pore size. In VLNA-2.5, the fibres stand vertically but lack a bundled structure.
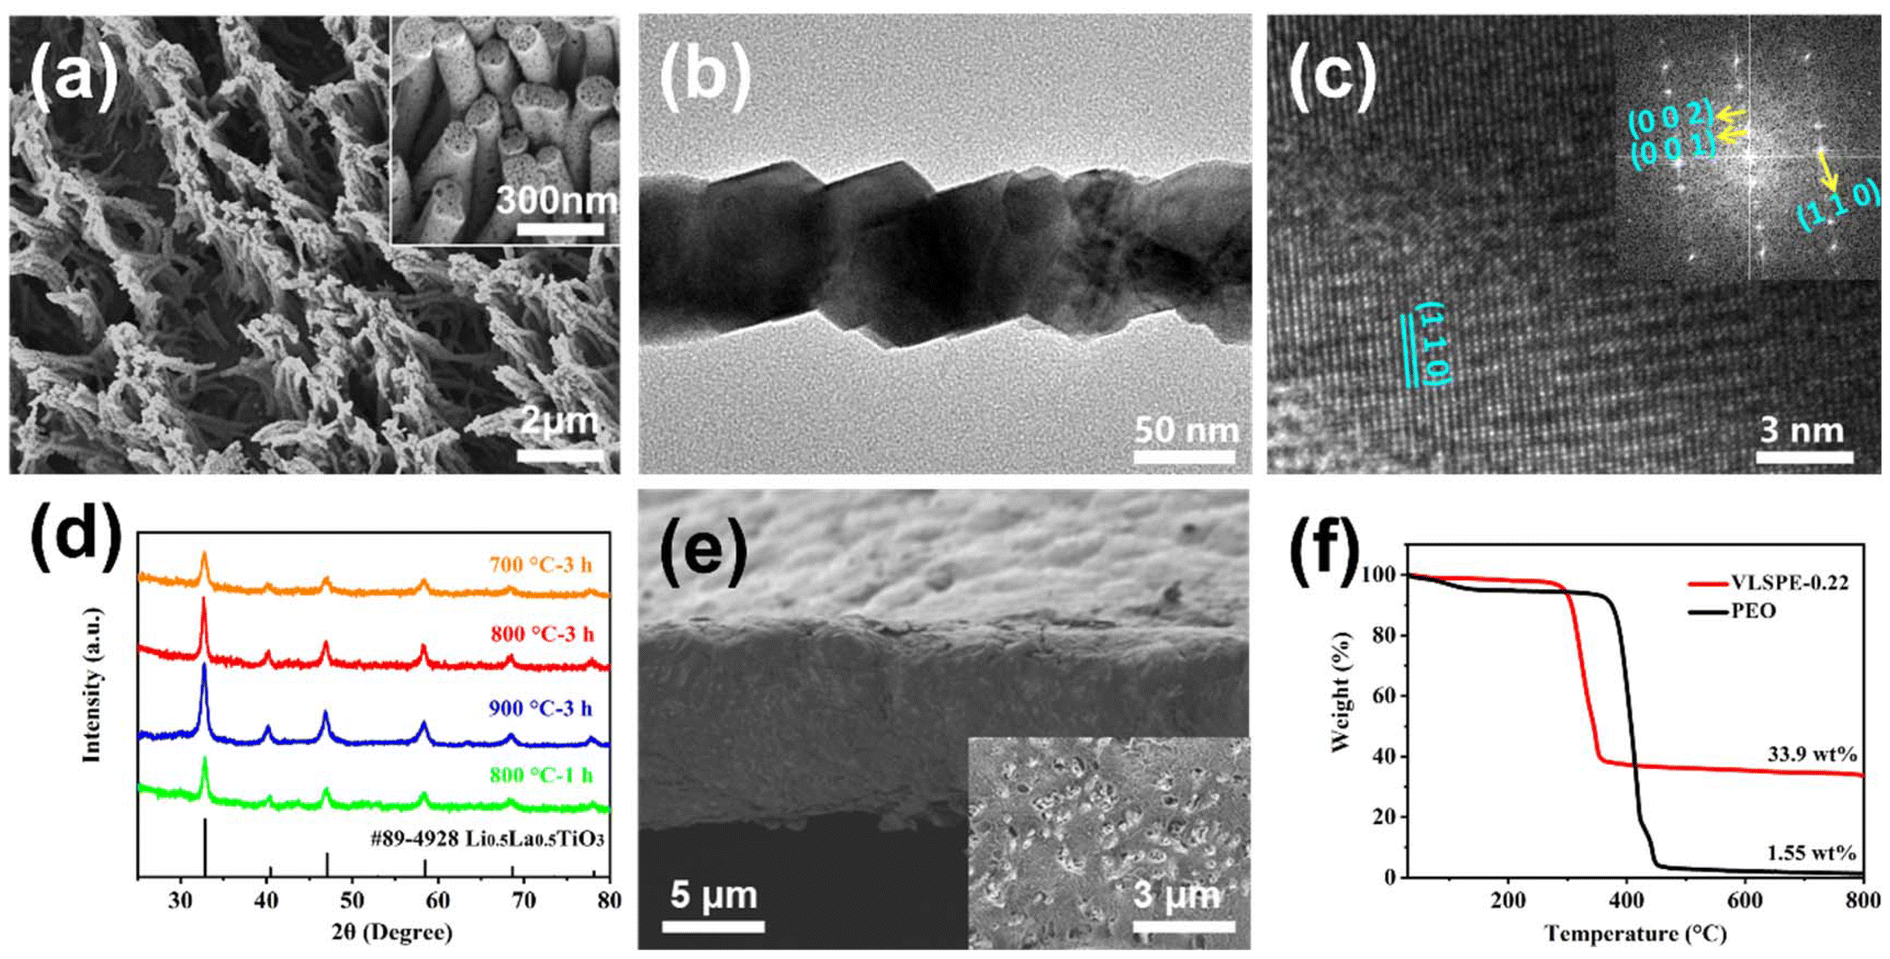 | ||
| Fig. 2 (a) SEM images of VLNA-0.22. (b) TEM image of LLTO nanowires from VLNA-0.22. (c) HRTEM image of an individual LLTO nanowire, with fast-Fourier transform (FFT) pattern inset. (d) X-ray diffraction (XRD) patterns of VLNA-0.22 with different sintering processes. (e) Cross-section morphology of the PEO-VLSPE-0.22 with top view sample inset. (f) TGA curves of pure PEO electrolyte and PEO-VLSPE-0.22. | ||
High-resolution transmission electron microscopy (TEM) was also used to examine the nano-scale morphology and structure of the nanowires. The individual LLTO nanowires calcined with the PC-0.22 template are shown in Fig. 2b, revealing an average diameter of approximately 130 nm, consistent with SEM observations. These nanofibres exhibit the typical crystalline facets of LLTO, as shown in Fig. 2c.26 The corresponding selected area electron diffraction (SAED) pattern in Fig. S4† indicates a polycrystalline structure consistent with a tetragonal cell, which matches the XRD pattern in Fig. 2d.
The effect of temperature on the VLNA structure formation was evaluated by XRD (Fig. 2d). For VLNA-0.22, the low intensity of representative XRD peaks indicates poor crystallinity when held at 700 °C for 3 hours or 800 °C for 1 hour. As shown in Fig. S5a and d,† under these conditions, the LLTO fibre particles appear relatively rough and loose. Conversely, holding at 900 °C for 3 hours causes the LLTO nano-arrays to transform into coarse particles (Fig. S5c†). Calcination of LLTO fibres at 800 °C for 3 hours produces a uniform, dense nanowire structure with enhanced crystallinity (Fig. S5b†). Based on these observations, the optimal sintering conditions for VLNA were determined to be 800 °C with a holding time of 3 hours. Infusing VLNA with PEO resulted in the VLSPE. The cross-sectional morphology of the VLSPE-0.22 sample (Fig. 2e) reveals a smooth surface with a thickness of only 10 μm. The top view of this sample, shown in the inset of Fig. 2e, illustrates a uniform distribution of VLNAs within the PEO matrix. Thermogravimetric analysis (TGA) was conducted to examine the thermal behaviour of both the pure PEO electrolyte and VLSPE-0.22 (Fig. 2f). From the TGA curves, it can be observed that the thermal decomposition temperature of VLSPE-0.22 is approximately 400 °C, which is about 100 °C higher than that of the pure PEO sample. Above 600 °C, the PEO-based electrolyte shows only 1.55 wt% residual LiTFSI, while VLSPE-0.22 exhibits a significantly higher residual weight of 33.9 wt%. This TGA analysis demonstrates the effectiveness of this method in incorporating a high weight percentage of LLTO into the polymer. Additionally, to further verify its superior thermal stability, combustion tests were performed. As detailed in the Supporting Video, VLSPE-PEO did not ignite upon heating, even after several seconds. Moreover, VLSPE-PEO demonstrated good mechanical flexibility, as illustrated in Fig. S14.† Fig. S15† presents the stress–strain curves of PEO-VLSPE, particle-CPE, and PEO-LiTFSI electrolytes. At room temperature, the tensile strength of PEO-LiTFSI is 1.3 MPa. The incorporation of LLTO particles in Particle-CPE increases the tensile strength to 5.4 MPa, indicating improved mechanical properties due to the two-phase composite structure. Further reinforcement with VLNAs in PEO-VLSPE significantly enhances the tensile strength to 7.5 MPa. This improved mechanical performance mitigates lithium dendrite growth and reduces the risk of internal short circuits, thereby enhancing the battery's electrochemical performance and safety.
The electrochemical properties of the VLSPE were further assessed in coin cells. Self-supported VLSPEs were positioned between two stainless steel blocking electrodes for ionic conductivity testing. Fig. 3a compares the ionic conductivities of VLSPEs derived from different PC templates. VLSPE-0.22 exhibits the highest ionic conductivity of 5.63 × 10⁻⁵ S cm−1 at 25 °C, while VLSPE-0.1 displayed the lowest ionic conductivity at room temperature, measuring 8.33 × 10⁻⁶ S cm−1. The ionic conductivity of VLSPE-1 and VLSPE-2.5 at 25 °C were recorded as 3.48 × 10⁻⁵ S cm−1 and 1.42 × 10⁻⁵ S cm−1, respectively. EIS plots for VLSPE samples at 25 °C and the equivalent fitting circuit model are provided in Fig. S7.†Fig. 3b further compares the effect of heat treatment temperature on the ionic conductivity of VLSPE-0.22. The ionic conductivity at 25 °C increased when the heat treatment temperature, rising from 700 °C (2.51 × 10⁻⁵ S cm−1) to 800 °C (5.63 × 10⁻⁵ S cm−1), before declining at higher temperatures. Further temperature rise will decrease the ionic conductivity. This temperature-dependent tendency is attributed to the structural evolution as characterized in Fig. 2a and Fig S3.† At lower temperatures (e.g., 700 °C) or with shorter treatment durations (e.g., 1 hour), the LLTO fibres displayed lower crystallinity and a looser structure, leading to reduced intrinsic ionic conductivity. In contrast, VLNA calcined at 800 °C for 3 hours demonstrated a well-maintained nanowire structure and high crystallinity, optimising ionic diffusion and resulting in the highest ionic conductivity in VLSPE. It should be noted that the VLSPEs-0.22 in Fig. 3a were all prepared at 800 °C with a calcination time of 3 hours.
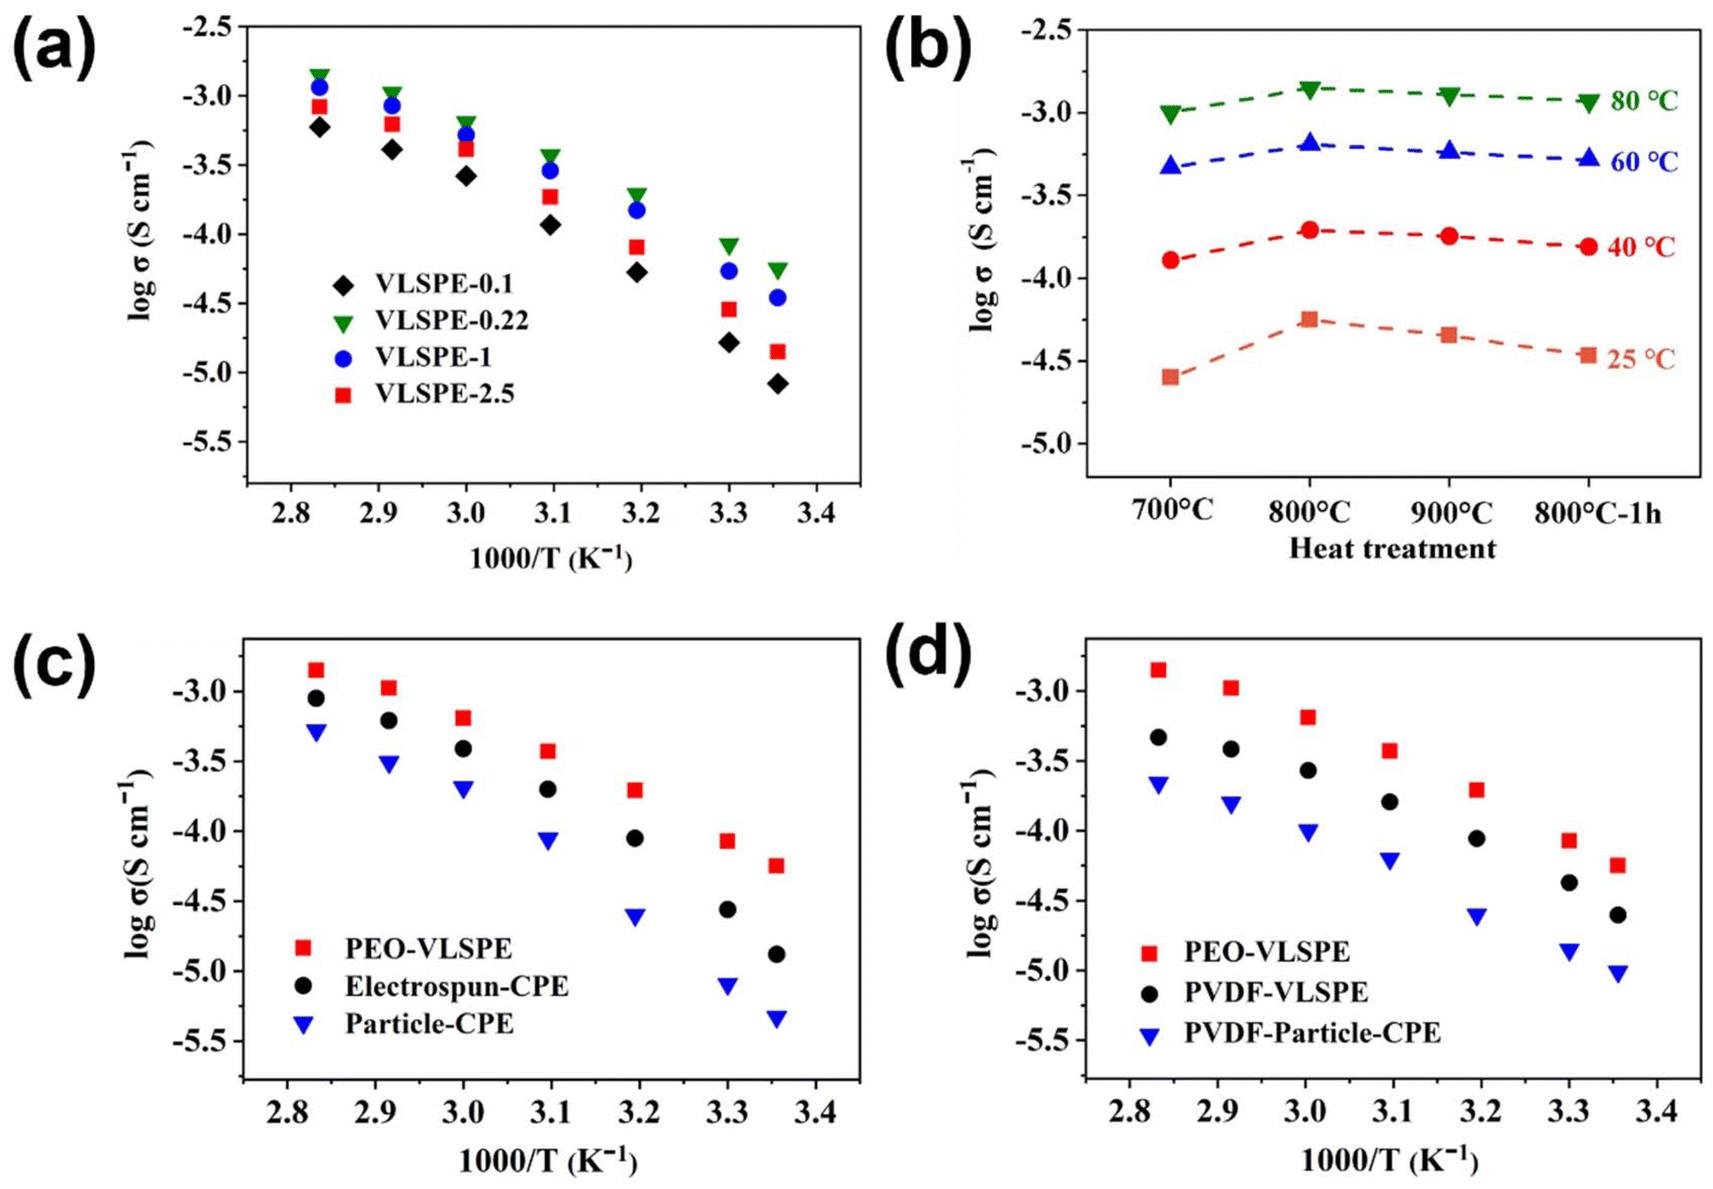 | ||
| Fig. 3 (a) Arrhenius plots of VLSPE samples with different diameters under 800 °C for 3 hours. (b) Conductivities of VLSPE-0.22 calcined of 700 °C 3 h, 800 °C 3 h, 900 °C 3 h and 800 °C 1 h. (c) Arrhenius plots of PEO-VLSPE, electrospun-CPE, and particle-CPE. (d) Arrhenius plots of PEO-VLSPE-0.22, PVDF-VLSP PVDF-particle-CPE. | ||
To further validate the advantages of VLNA, VLSPE-0.22 was chosen to compare the Li+ conductivity of CPEs based on electrospun LLTO and conventional particle LLTO, designated as electrospun-CPE and particle-CPE, respectively. The SEM images of purely electrospun LLTO and sintered particle LLTO are shown in Fig. S10.† In all CPEs prepared with different LLTO morphologies, the weight percentage of LLTO filler was maintained at approximately 30 wt%. In Fig. 3c, upon the addition of particle LLTO, the ionic conductivity of Particle-CPE is 4.71 × 10⁻⁶ S cm−1 at 25 °C, while electrospun-CPE exhibited an ionic conductivity of 1.32 × 10⁻⁵ S cm−1. VLSPE-0.22 achieved the highest ionic conductivity at 5.63 × 10⁻⁵ S cm−1 at 25 °C, approximately 5 times higher than electrospun-CPE and around 20 times greater than the PEO electrolyte. The substantial conductivity enhancement in VLSPE-0.22 over the lower temperature range (25–50 °C) confirmed its facilitated ionic diffusion. To explore the general applicability of this strategy for improving ionic conductivity in CPEs, the PEO electrolyte was replaced with PVDF, and conductivity tests were performed on PVDF-based VLSPEs (Fig. 3d). Although the overall ionic conductivity of the PVDF-based VLSPEs was lower than that of the PEO-based VLSPEs, it showed an improvement compared with particle-type LLTO filler, indicating the universal feasibility of this approach across different CPE systems.
Conventional particle-type fillers in CPEs have been reported to induce interactions between PEO and LLTO, which trigger amorphisation of the polymer matrix and create additional conductive yet discontinuous pathways, offering limited ionic conductivity within the electrolyte. Unlike particle-CPE, the interaction between the VLNA and the polymer matrix forms a vertical amorphisation layer around it, leading to the development of long-range, continuous lithium-ion conduction pathways that synergistically enhance ionic conductivity. As observed in the EIS results of LFP//Li in Fig. S12,† the reduced EIS impedance facilitates better ion transport, mitigates side reactions and energy loss, and ultimately enhances the reversible capacity of the battery. To investigate the polymer-ceramic interaction mechanism in VLSPE, polarised light microscopy was used to analyse the structural features of pure PEO and VLSPE-0.22. The pure PEO electrolyte membrane (Fig. 4a) shows a large number of spherical regions, with an average diameter of approximately 400 microns. After the addition of the VLNA filler, the grain diameter of PEO is significantly reduced (Fig. 4b), aiding the enhancement of ionic conductivity in VLSPE-0.22. This effect was further verified by XRD analysis (Fig. 4c). the XRD pattern of LiTFSI-containing PEO samples still has sharp peaks at 19° and 24°, which can be attributed to the crystalline PEO composition.27 However, the typical peaks of crystalline PEO are substantially weakened in the VLSPE-0.22 samples, indicating the effective decreased crystallinity. This effect can be also observed in the PVDF-VLSPE samples.
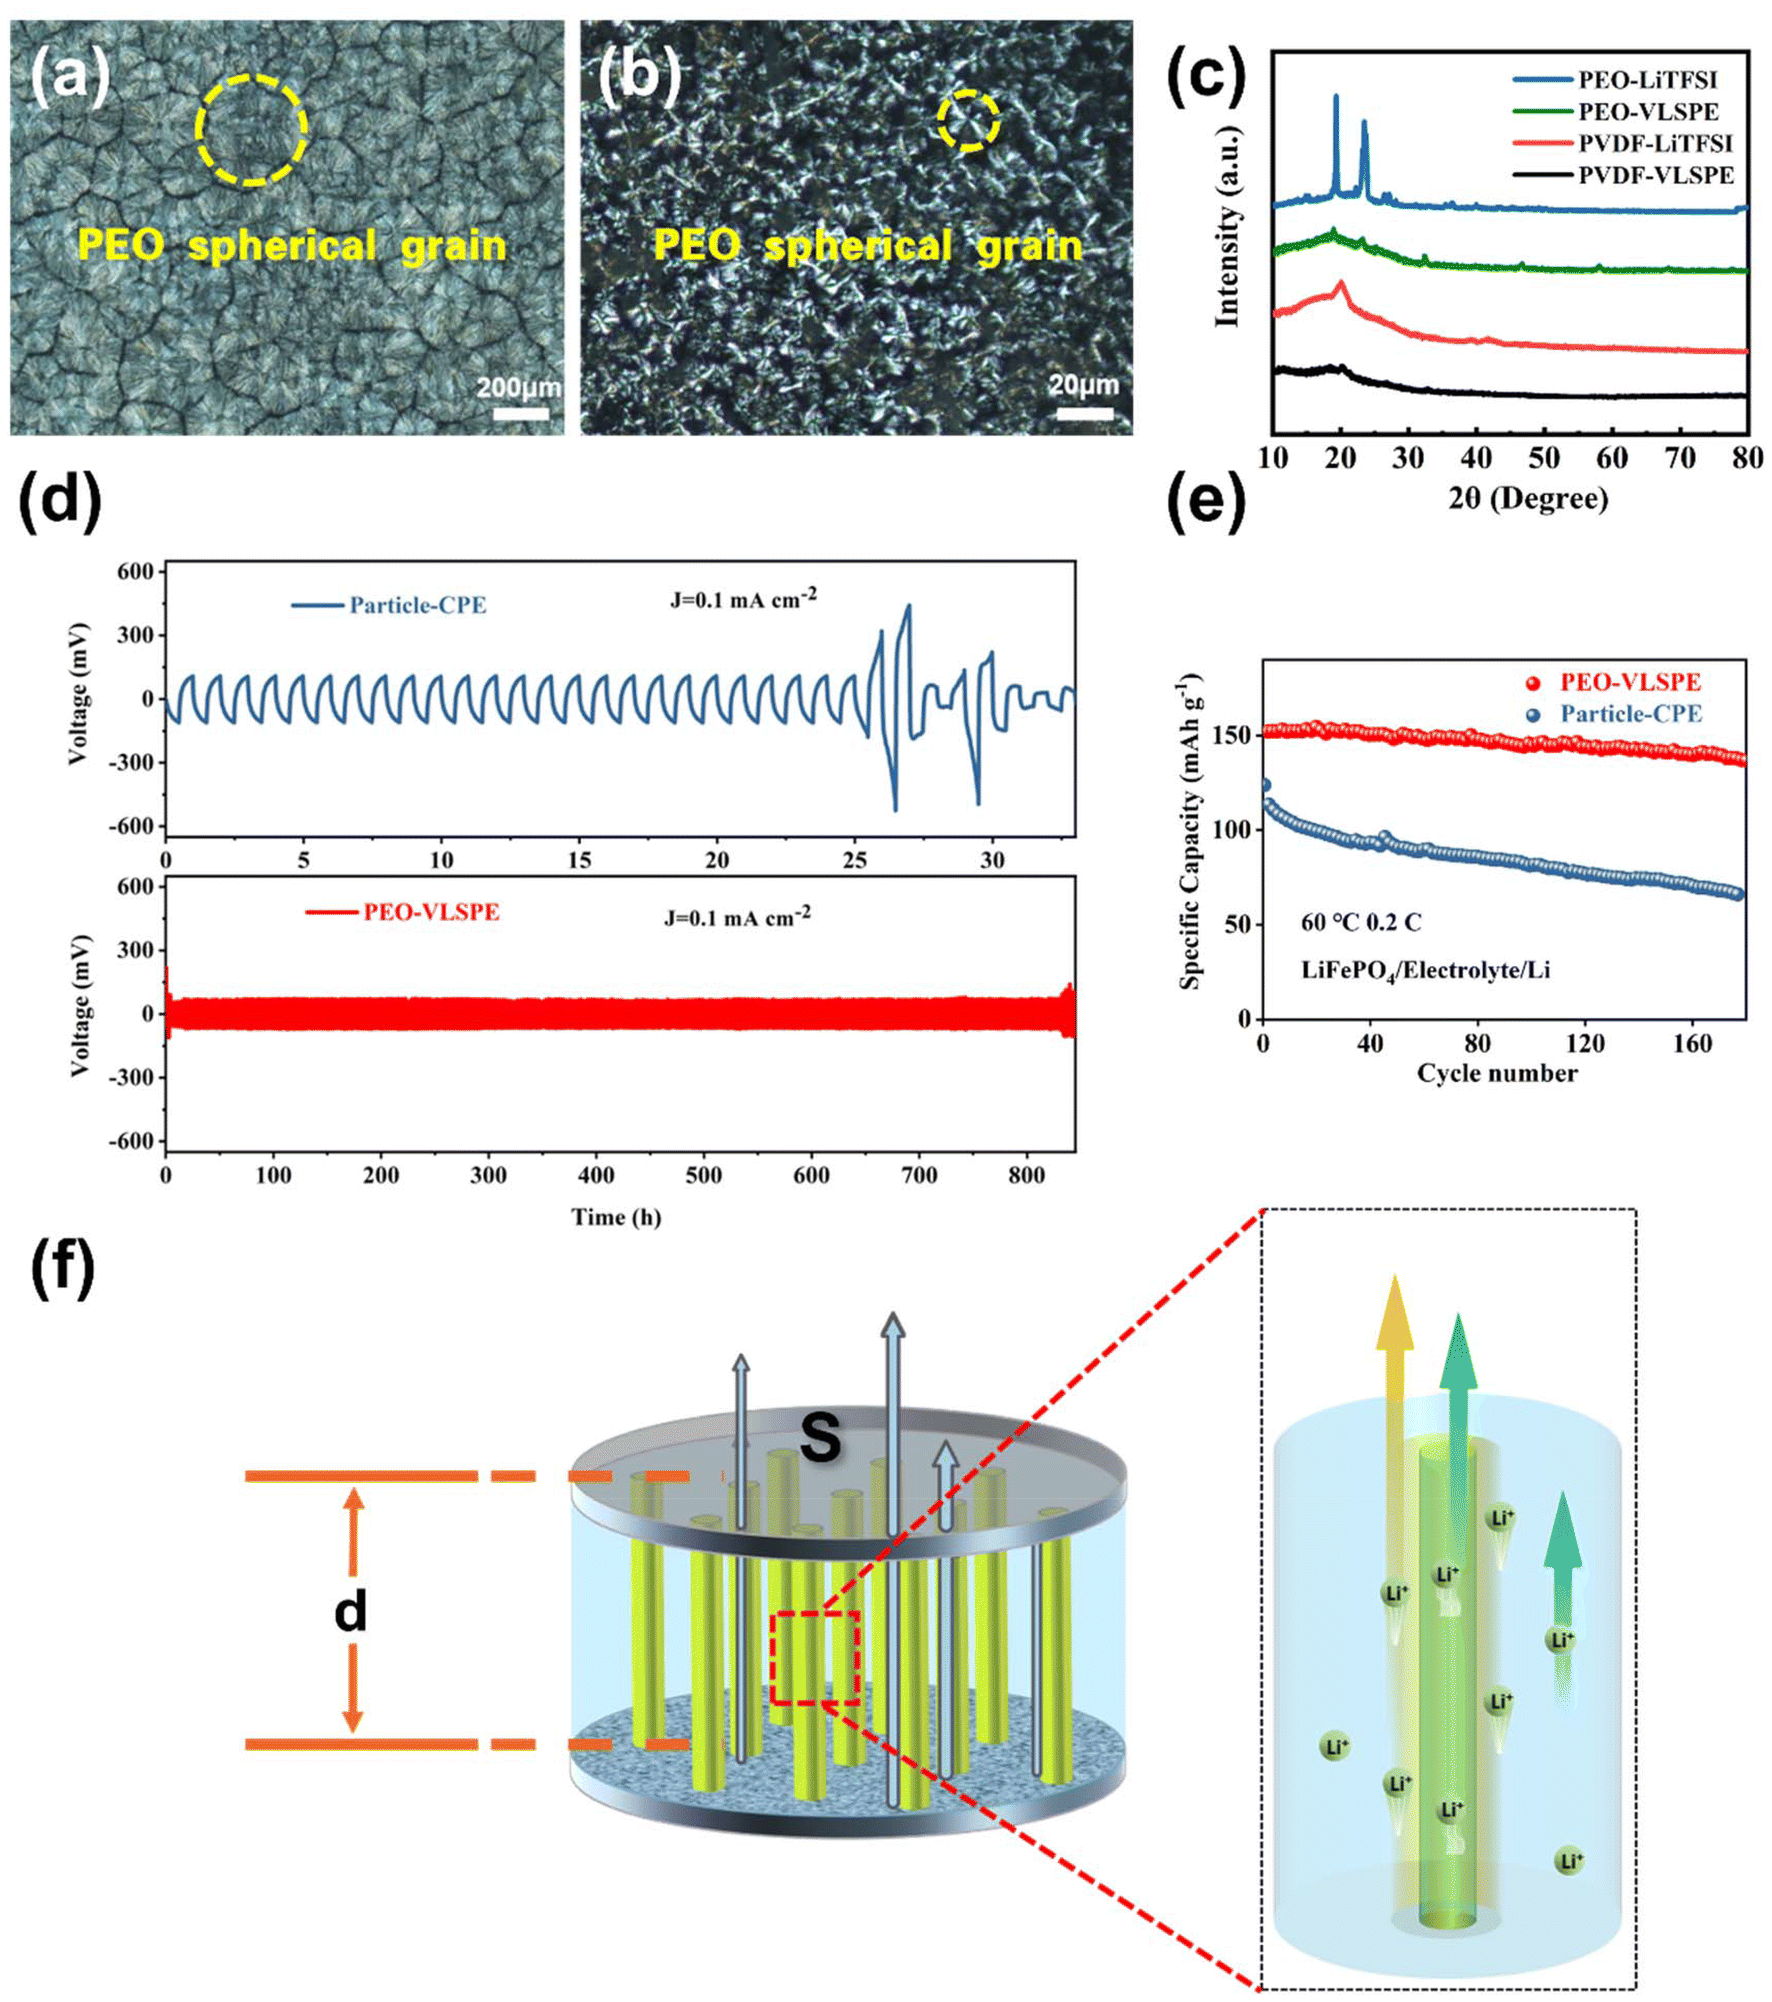 | ||
| Fig. 4 Polarizing microscope images of (a) PEO-LiTFSI electrolyte, and (b) VLSPE-0.22. (c) XRD patterns of different electrolytes based on PEO and PVDF. (d) Symmetric cycles for PEO-VLSPE-0.22 and Particle-CPE. The current density of 0.1 mA cm−2. (e) The cycling performance curves between PEO-VLSPE and particle-CPE. (f) Schematic diagram of the mechanism of VLSPE conduction of lithium ions. | ||
To further evaluate the cycling stability performance of VLSPE, symmetric cell tests were conducted on Particle-CPE and PEO-VLSPE-0.22 at 60 °C. As shown in Fig. 4d, the amorphisation effect induced by the oriented aligned VLNAs not only reduces the overpotential from 100 mV to 70 mV but also significantly extends the cycling stability from approximately 25 hours to over 800 hours. To further demonstrate the uniform deposition stability of lithium metal, SEM analysis was conducted on the electrolyte after cycling. As shown in Fig. S16,† the VLSPE-PEO electrolyte achieved uniform and stable lithium deposition. We attribute this to the local electric field optimisation provided by the VLNA within the SPE, which enhances cycling performance. However, compared to the pristine SPE illustrated in the inset of Fig. 2e, the VLNA nanocolumns in the cycled VLSPE-PEO are less discernible due to the substantial coverage of deposited lithium metal. To evaluate the cycling performance of VLSPE, a sandwich-structured cell comprising VLSPE, LiFePO4 (LFP) as the cathode, and lithium metal as the anode was fabricated and tested at 60 °C under a 0.2 C rate. As presented in Fig. 4e, the cell demonstrated remarkable cycling stability, with the mass-specific capacity maintaining a consistent value of 137 mA h g−1 after 170 cycles. We conducted rate performance tests on both PEO-VLSPE and Particle-CPE. As shown in Fig. S11,† the reduced impedance of PEO-VLSPE resulted in a higher specific capacity. Even at a high rate of 2 C, PEO-VLSPE achieved a specific capacity of 122 mA h g−1, compared to 98 mA h g−1 for Particle-CPE, demonstrating a significant improvement. The charge–discharge curves for the specific cycling process and rate performance are shown in Fig. S13.†
As previously discussed, various composite types significantly influence the ionic transport pathways within composite electrolytes, though the exact impact of each component on ionic conduction requires further investigation. To elucidate the mechanism by which VLNA enhances the performance of composite electrolytes, we constructed a model of VLSPE to analyse the contribution of each component to its ionic conductivity. This model is depicted in Fig. 4f. First, the model can be represented as a parallel resistance (conductance) model:
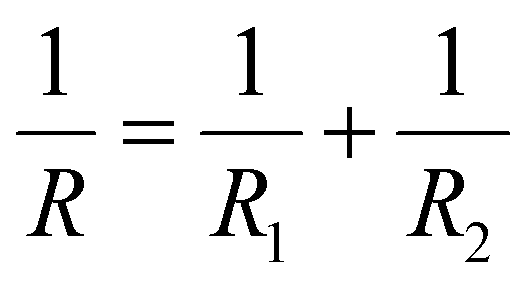
Or equivalently,
| GV = GP + GN |
Using the relation 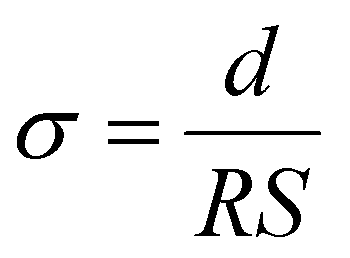 and
and 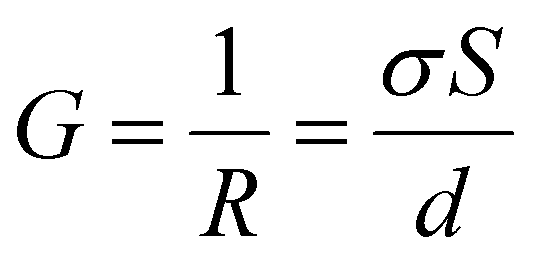 , and noting that the thicknesses (d) are consistent, we derive:
| σV·SV = σP·SP + σN·SN, |
with
| SV = SP + SN, SN = 4%SV, and SP = 96%SV. |
Substituting these relationships, we obtain:
| σV = 0.96σP + 0.04σN | (1) |
By substituting empirical data into eqn (1):
For PEO-VLSPE-0.22:
| x × 4% + 2.82 × 10−6 × 96% = 5.63 × 10⁻⁵, |
For PVDF-VLSPE-0.22:
| y × 4% + 8.72 × 10−8 × 96% = 2.50 × 10⁻⁵ |
In this case, both x and y represent σN, which include the ionic conductivity contributions from the nanowire component and the organic/inorganic interface. From previous observations, it is known that VLNA consists of polycrystalline nanowires formed by LLTO nanocrystals with varying microscopic orientations and good crystallinity. Based on references, the intrinsic Li+ conductivity of LLTO is <10−6 S cm−1i.e., σN ≪ x, y. Therefore, the enhanced values of x and y can be attributed to high Li+ conductivity at the interface, driven by the interaction of the polymer electrolytes (PEO and PVDF) with LLTO nanowires. This mechanism is illustrated in Fig. 4f, where the yellow arrow in the highlighted yellow region signifies regions of high lithium conductivity. This provides a plausible explanation for the elevated ionic conductivity observed in the VLSPE.
3. Conclusion
In summary, we developed a composite polymer electrolyte (CPE) incorporating vertically aligned LLTO nano-arrays within a flexible PC membrane. The vertically aligned structure provides direct diffusion channels for Li+ transport, resulting in significantly enhanced ionic conductivity. The solid-state electrolyte achieves an ionic conductivity of 0.56 × 10⁻⁴ S cm−1 at room temperature (25 °C), which is 4.3 times higher than that of a PEO electrolyte containing randomly dispersed LLTO nanoparticles. Lithium ions are able to conduct rapidly along the interior of the LLTO nanowires and the interfaces between the LLTO nanowires and the PEO matrix. In addition to the facilitated ionic diffusion, the electrolyte demonstrates superior thermal and electrochemical stability, enabling stable cycling of lithium symmetrical cells for over 800 hours without short-circuiting. As a universal optimisation strategy, this demonstrated method could be extended to other CPE systems, such as PVDF-based electrolytes. This novel structural design and fabrication approach for engineering ionic diffusion frameworks offers a promising pathway for the development of practical solid-state electrolytes.Author contributions
Shaoyin Li: conceptualization, data curation, visualization, writing – original draft. Yunke Wang: data curation. Jose Anguita: writing – review & editing. Kai Yang: writing – review & editing, Supervision. S. Ravi P. Silva*: funding acquisition, methodology, supervision, writing – review & editing.Data availability
The data supporting this article have been included as part of the ESI.†Conflicts of interest
There are no conflicts to declare.Acknowledgements
S. L. thanks China Scholarship Council (no. 202007040033) for financial support. We acknowledge the Advanced Technology Institute and the University of Surrey for this programme of research.References
- A. Manthiram, X. W. Yu and S. F. Wang, Nat. Rev. Mater., 2017, 2, 1–16 CrossRef
.
- T. Famprikis, P. Canepa, J. A. Dawson, M. S. Islam and C. Masquelier, Nat. Mater., 2019, 18, 1278–1291 CrossRef CAS PubMed
- Z. Gao, H. Sun, L. Fu, F. Ye, Y. Zhang, W. Luo and Y. Huang, Adv. Mater., 2018, 30, e1705702 CrossRef PubMed
- Z. Cheng, T. Liu, B. Zhao, F. Shen, H. Jin and X. Han, Energy Storage Mater., 2021, 34, 388–416 CrossRef
- A. M. Stephan and K. S. Nahm, Polymer, 2006, 47, 5952–5964 CrossRef CAS
- E. Fu, H. Wang, Y. Zhang, Z. Xiao, X. Zheng, S. Hao and X. Gao, Energy Environ. Mater., 2024, 7, e12745 CrossRef CAS
- X. X. Zeng, Y. X. Yin, N. W. Li, W. C. Du, Y. G. Guo and L. J. Wan, J. Am. Chem. Soc., 2016, 138, 15825–15828 CrossRef CAS PubMed
- W. Yu, N. Deng, Y. Feng, X. Feng, H. Xiang, L. Gao, B. Cheng, W. Kang and K. Zhang, eScience, 2024, 100278, DOI:10.1016/j.esci.2024.100278
- B. Guo, Y. Fu, J. Wang, Y. Gong, Y. Zhao, K. Yang, S. Zhou, L. Liu, S. Yang, X. Liu and F. Pan, Chem. Commun., 2022, 58, 8182–8193 RSC
- Z. Y. Kou, Y. Lu, C. Miao, J. Q. Li, C. J. Liu and W. Xiao, Rare Met., 2021, 40, 3175–3184 CrossRef CAS
- D. Zhang, X. Meng, W. Hou, W. Hu, J. Mo, T. Yang, W. Zhang, Q. Fan, L. Liu, B. Jiang, L. Chu and M. Li, Nano Res. Energy, 2023, 2, e9120050 CrossRef
- W. M. Wang, E. Y. Yi, A. J. Fici, R. M. Laine and J. Kieffer, J. Phys. Chem. C, 2017, 121, 2563–2573 CrossRef CAS
- H. Zhai, P. Xu, M. Ning, Q. Cheng, J. Mandal and Y. Yang, Nano Lett., 2017, 17, 3182–3187 CrossRef CAS PubMed
- W. Liu, N. Liu, J. Sun, P. C. Hsu, Y. Li, H. W. Lee and Y. Cui, Nano Lett., 2015, 15, 2740–2745 CrossRef CAS PubMed
- L. Chen, Y. Li, S.-P. Li, L.-Z. Fan, C.-W. Nan and J. B. Goodenough, Nano Energy, 2018, 46, 176–184 CrossRef CAS
- C. Bao, C. Zheng, M. Wu, Y. Zhang, J. Jin, H. Chen and Z. Wen, Adv. Energy Mater., 2023, 13, 2204028 CrossRef CAS
- Y. Zhao, J. H. Yan, W. P. Cai, Y. M. Lai, J. Song, J. Y. Yu and B. Ding, Energy Storage Mater., 2019, 23, 306–313 CrossRef
- T. Yang, J. Zheng, Q. Cheng, Y. Y. Hu and C. K. Chan, ACS
Appl. Mater. Interfaces, 2017, 9, 21773–21780 CrossRef CAS PubMed
- K. K. Fu, Y. Gong, J. Dai, A. Gong, X. Han, Y. Yao, C. Wang, Y. Wang, Y. Chen, C. Yan, Y. Li, E. D. Wachsman and L. Hu, Proc. Natl. Acad. Sci. U. S. A., 2016, 113, 7094–7099 CrossRef CAS PubMed
- D. Lin, J. Zhao, J. Sun, H. Yao, Y. Liu, K. Yan and Y. Cui, Proc. Natl. Acad. Sci. U. S. A., 2017, 114, 4613–4618 CrossRef CAS PubMed
- J. Wan, J. Xie, X. Kong, Z. Liu, K. Liu, F. Shi, A. Pei, H. Chen, W. Chen, J. Chen, X. Zhang, L. Zong, J. Wang, L. Q. Chen, J. Qin and Y. Cui, Nat. Nanotechnol., 2019, 14, 705–711 CrossRef CAS PubMed
- X. Zhang, J. Xie, F. Shi, D. Lin, Y. Liu, W. Liu, A. Pei, Y. Gong, H. Wang, K. Liu, Y. Xiang and Y. Cui, Nano Lett., 2018, 18, 3829–3838 CrossRef CAS PubMed
- W. Zha, W. Li, Y. Ruan, J. Wang and Z. Wen, Energy Storage Mater., 2021, 36, 171–178 Search PubMed
- G. B. Kunshina, I. V. Bocharova and E. P. Lokshin, Inorg. Mater., 2015, 51, 369–374 CrossRef CAS
- A. Lakshmanan, R. Gurusamy, A. Ramani, N. Srinivasan and S. Venkatachalam, Ceram. Int., 2024, 50, 30240–30251 CrossRef CAS
- X. Lin, H. Wang, H. Du, X. Xiong, B. Qu, Z. Guo and D. Chu, ACS Appl. Mater. Interfaces, 2016, 8, 1486–1492 CAS
- N. Zhang, J. He, W. Han and Y. Wang, J. Mater. Sci., 2019, 54, 9603–9612 CrossRef CAS
Footnote |
| † Electronic supplementary information (ESI) available. See DOI: https://doi.org/10.1039/d4nr05093b |
| This journal is © The Royal Society of Chemistry 2025 |