 Open Access Article
Elucidation of the nano-sized molecular structure of methylaluminoxane using synchrotron X-ray total scattering†
Toru
Wada
 * and
Toshiaki
Taniike
*
Graduate School of Advanced Science and Technology, Japan Advanced Institute of Science and Technology, Asahidai 1-1, Nomi, Ishikawa, Japan. E-mail: toruwada@jaist.ac.jp; taniike@jaist.ac.jp
First published on 18th February 2025
Abstract
Methylaluminoxane (MAO) is commonly employed to activate molecular pre-catalysts in polyolefin synthesis, both industrially and in the laboratory. Despite the extensive use of this compound, the ambiguity related to its structure hampers the understanding of its structure–function relationship. The current study therefore employed synchrotron X-ray total scattering to elucidate the nano-sized molecular structure of MAO. The MAO samples, which were prepared using various synthetic protocols, exhibited consistent X-ray scattering patterns and atomic pair distribution function curves, indicating similar molecular structures. However, the scattering intensity in the small-angle region revealed differences in the higher-order structures. A fitting study performed using 172 molecular models showed that small molecule and tube models were inadequate to reproduce the experimental results, whereas cage and sheet models provided comparably better fits. The sheet model was found to be consistent with the observed molecular weight and the molecular weight distribution, in addition to accounting for the intensity in the small-angle scattering region. These results align with recent crystallographic findings reported in Science, where a stacked sheet model successfully reproduced an experimental X-ray diffraction pattern. Ultimately, determination of the structural motif of MAO is expected to be beneficial for systematic research and development using this compound.
Introduction
Methylaluminoxane (MAO) is pivotal in activating molecular pre-catalysts for polyolefin synthesis and has been extensively utilized in areas ranging from basic research to commercial applications. Although many different classes of pre-catalysts have been developed through ligand design and the selection of appropriate central metal elements,2 MAO remains the first choice of activators in terms of its availability and high performance.3 It has been revealed that cationization through ligand subtraction and subsequent ion pair formation are essential steps during pre-catalyst activation; MAO covers both of these roles simultaneously (Scheme 1).3–5 However, despite its long history, only limited information is available regarding the molecular structure of MAO, and hence its structure–function relationship is poorly understood. Indeed, to date, almost no systematic studies have been reported on the research and development of MAO. | ||
| Scheme 1 Generally accepted activation mechanism of a metal dichloride complex pre-catalyst using MAO as an activator. | ||
MAO is generally considered to be a polymeric material composed of (AlMeO)n frameworks, since it is formed by the partial hydrolysis and condensation of trimethylaluminum (TMAL). Previous cryoscopy studies performed using benzene or TMAL as a solvent have estimated its average molecular weight to be ∼1000–1200,6 while a recent electrospray ionization mass spectrometry (ESI-MS) study suggested a molecular weight of ∼1000–2000 g mol−1.4,6–8 Studies using diffuse nuclear magnetic resonance (NMR) spectroscopy have suggested that the number of AlMeO units ranges from 26 to 41,9 roughly corresponding to a molecular weight of 1500–2500 g mol−1. In addition, gel permeation chromatography performed using extensively dried MAO suggested the presence of a molecular weight distribution.10 The elemental composition of MAO has been estimated to be Me1.4–1.5AlO0.75–0.80,4 wherein the greater Me content compared to that of Al and O is due to the chemisorption of TMAL on the (AlMeO)n framework. TMAL stabilizes the exposed three-coordinated Al and two-coordinated O atoms in the (AlMeO)n framework, undergoing homolysis to generate –Me and –AlMe2.4 These chemisorbed species are in equilibrium with the “free” TMAL molecules in solution.11 These structural characteristics conform with the 27Al magic angle spinning NMR study performed by Simeral et al., wherein MAO was found to be dominantly composed of four-coordinated Al and three-coordinated O atoms.12
The mechanism of molecular catalyst activation has been debated since the discovery of MAO.3–5 The ability of MAO to cationize the metal center can be attributed to its Lewis acidic properties, which have been confirmed by electron paramagnetic resonance (EPR) radical trapping and CO-probing Fourier transform infrared spectroscopy (FT-IR).13,14 More specifically, at least two types of Lewis acid sites were confirmed, and it was suggested that the stronger site played a role in activation.15 Recently, it has been widely accepted that the release of [AlMe2]+ cations from the MAO surface is key to the activation process,9,13 although its structural origin is still under debate. For example, it has been proposed that the release of [AlMe2]+ from the TMAL molecules chemisorbed on the (AlMeO)n framework, or cleavage of the unstable Al–Me or Al–O bonds present at the edges, leads to the generation of transient Lewis acidic sites.7,11 Other factors may also be involved in the activation mechanism, including anion delocalization, and steric hindrance around the cationic/anionic sites. Although computational chemistry is expected to be the most effective solution to clarify these points, the fact that the molecular structure of MAO itself remains unconfirmed renders it difficult to reach a reliable conclusion.
Experimental analysis of the MAO structure is particularly challenging because it is a nanomaterial that can contain a degree of disorder in addition to various particle size distributions. For example, commonly used analytical methods such as NMR and FT-IR spectroscopy are microscopic in nature, and so are not suitable for evaluating the overall structure of nano-sized MAO. In addition, the isolation of single crystal samples has only been successful for extremely low molecular weight components (Fig. 1). In fact, the molecular structure obtained from these crystals did not correlate with the solid-state NMR results. Although a recent X-ray diffraction study by Luo et al. determined that MAO has a sheet-like structure,1 further confirmation is required.
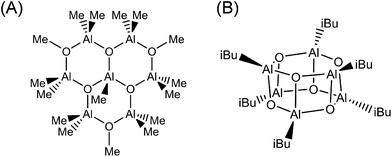 | ||
| Fig. 1 Experimentally determined molecular models of MAO based on: (A) isolation from an MAO solution by Atwood et al.16 and (B) isolation from isobutylaluminoxane by Barron et al.17 | ||
Considering the above experimental difficulties, numerous attempts have been made to determine the molecular structure of MAO through computational chemistry. In the majority of cases, molecular models exhibiting various shapes and molecular weights were created based on the experimentally suggested hexagonal prismatic structure (Fig. 1B), and their corresponding stabilities were investigated. These studies generally agree on two key points, namely that molecules with lower molecular weights tend to be unstable and the fact that the adsorption of TMAL stabilizes the MAO molecules. However, complete structure determination has not been possible due to varying structural motifs (e.g., cages, tubes, and sheets; Fig. 2) being reported by different groups. More specifically, Zurek et al., Boudene et al., and others made the assumption that MAO has a cage structure.18,19 In addition, Falls et al. reported that tube structures bearing chemisorbed TMAL molecules predominated at 298 K, while at elevated temperatures, TMAL desorption led to the predominance of cage structures.20 They hypothesized that this TMAL leaching could contribute to deactivation of the molecular catalysts at high temperatures. In another study, Linnolahti et al. emphasized the impact of TMAL adsorption on structural variation. They calculated the Gibbs free energies for various (AlOMe)n(AlMe3)m clusters, where n is the number of Al atoms in the MAO framework and m is that of the adsorbed TMAL molecules.7 Their findings indicated that sheet structures are more stable than cage structures, when the number of chemisorbed TMAL molecules increases and when n ≤ 13. However, cage structures appeared to be the most stable structures when n > 14, irrespective of the number of adsorbed TMAL molecules. Furthermore, they initially concluded that the cage (AlOMe)16(AlMe3)6 was the most representative molecule in MAO, although the sheet (AlOMe)16(AlMe3)6 was more stable.21
 | ||
| Fig. 2 Three key structural motifs for MAO, namely the (A) cage, (B) tube, and (C) sheet structures. The Me groups are omitted from the tube and sheet structures for clarity. | ||
Recently, the total scattering technique has emerged as a promising approach for the structural analyses of nanomaterials.22–24 This technique involves irradiating the sample with short-wavelength X-rays or neutron beams and recording the scattering patterns across a wide range of scattering vectors (Q = 4πsin![[thin space (1/6-em)]](https://www.rsc.org/images/entities/char_2009.gif) θ/λ). The structure function (S(Q)), which is derived by normalizing the total scattering pattern with the elemental composition and the atomic scattering factors, is Fourier-transformed to yield the atomic pair distribution function (PDF). Consequently, two kinds of structural information are obtained, wherein the X-ray scattering pattern highlights long-range periodic atomic arrangements through Bragg reflections, and the PDF accentuates local atomic configurations in the real space, thereby allowing a comprehensive analysis of the nanostructure.
θ/λ). The structure function (S(Q)), which is derived by normalizing the total scattering pattern with the elemental composition and the atomic scattering factors, is Fourier-transformed to yield the atomic pair distribution function (PDF). Consequently, two kinds of structural information are obtained, wherein the X-ray scattering pattern highlights long-range periodic atomic arrangements through Bragg reflections, and the PDF accentuates local atomic configurations in the real space, thereby allowing a comprehensive analysis of the nanostructure.
Thus, in the current study, the nano-sized molecular structure of MAO is elucidated using synchrotron total X-ray scattering. For this purpose, a library of molecular models is constructed, including previously proposed structures and structures of small molecular compounds for reference. The compatibility between the experimental results and the simulation results obtained using the library is evaluated.
Experimental
Sample preparation
All MAO samples used in this study were generously provided by Tosoh Finechem, Inc. (Yamaguchi, Japan) and were utilized without further purification. A brief description of these samples is provided below.Four MAO samples were subjected to structural investigation, considering that the molecular structure of MAO is possibly affected by the method employed and the form of the final product. MAO-H (13.9 wt%-Al, 67 wt%-toluene) was synthesized by the reaction between TMAL and water, which is the most traditional and common approach. MAO-T (13.7 wt%-Al, 55 wt%-toluene) was synthesized by the reaction between TMAL and benzoic acid, which was recently reported to control the reaction and suppress gelation.25–27 A solid-state variant of MAO, namely MAO-powder, was produced from MAO-T through controlled gelation. The resulting particle size (d50) was determined to be 9.3 μm.28–30 Using MAO-powder as an activator, the morphology of the resulting polymer particles can be controlled to a spherical shape and reactor fouling can be prevented.28 MAO-powder was insoluble in toluene and therefore completely gelatinized. Modified MAO (MMAO) was also prepared from a mixture of TMAL and isobutylaluminum.31
In addition to the provided MAO samples, a dried sample was also prepared from MAO-H, which is commonly applied to remove free TMAL and prevent catalytic deactivation. More specifically, MAO-H (3.0 mL) was transferred to a nitrogen-purged Schlenk tube and subjected to vacuum drying at 25 °C for 4 h. The obtained white powder product was denoted as MAO-dried. The degree of gelation during drying was negligible since the powder was completely soluble in toluene.
Synchrotron X-ray total scattering experiments
The X-ray total scattering experiments were performed at the SPring-8 BL04B2 beamline (61 keV, maximum Q = 25 Å−1). Each MAO sample was used to fill a quartz capillary tube (2 mm diameter) for performing the desired measurements. Background subtraction was performed using an empty capillary for the solid samples, and a capillary filled with toluene for solution samples. After the polarization and absorption corrections, the structure factor (S(Q)) was obtained by normalizing with the elemental composition and atomic scattering factors. The PDF (G(r)) was obtained by Fourier-transforming the obtained S(Q),22,32 where the minimum value of Q was set to 1.5 Å−1. The PDF is defined by the following equation:| G(r) = 4πr[ρ(r) − ρ0], | (1) |
Library of molecular models
Although any MAO species can be represented by the formula (AlOMe)n(TMAL)m, different motifs are possible even for the same values of n and m. In this study, the structural code xnym_z was employed, where x is the number of AlOMe units, y is the number of chemisorbed TMAL molecules, and z is the motif (c: cage, t: tube, and s: sheet). For structures bearing both cage and sheet characters, the formula xnym_c/s was applied, while for small structures without a clear motif, the final “z” component was omitted.The molecular model library consists of 172 molecular structures mainly consisting of those reported by Falls et al. and Linnolahti et al.7,20,33Fig. 3 shows a number of representative structures from the library. The models published by Falls et al. cover both cage and tube motif structures in a realistic molecular weight range (∼1449), and include a hexagonal prismatic structure (6n0m_c) isolated from isobutylaluminoxane by Barron et al. (Fig. 2A). The models proposed by Linnolahti et al. consisted of various structures, with the number of AlOMe units ranging from 1 to 18, and the number of adsorbed TMAL molecules ranging from 0 to 6. These models were designed to simulate the synthesis of MAO through the controlled hydrolysis of TMAL.7 To confirm the effects of the calculation methods on the simulated PDF results, PDF simulations were performed using 16n6m_c structures, which were geometry optimized using various methods. Importantly, it was found that that the impact was negligible (Fig. S1†).
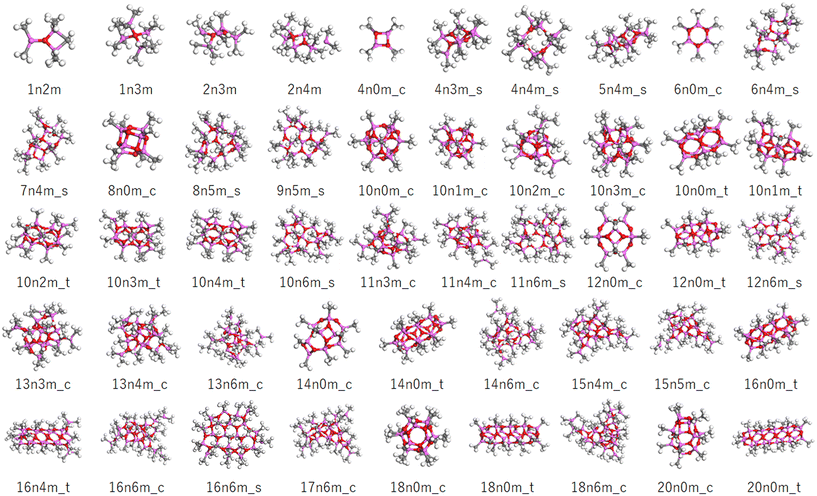 | ||
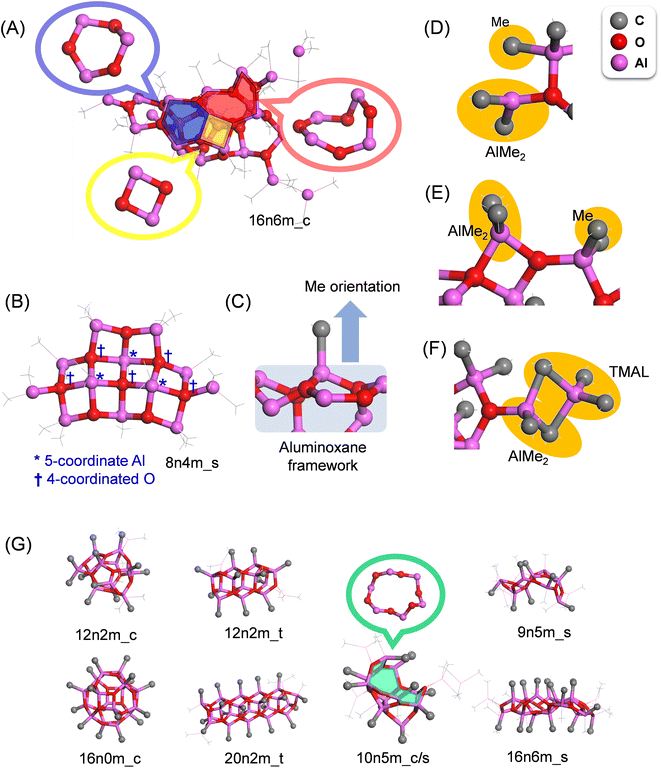
| Fig. 3 Representative molecular models in the constructed library. The pink, red, gray, and white balls correspond to the Al, O, C, and H atoms. The sample codes are described in the text. | ||
Structural features of the MAO motifs
The aluminoxane framework of MAO consists of 4-, 6-, and 8-membered rings with alternate arrangements of Al and O atoms (Fig. 4A). The proportions of these three ring structures in the entire library were determined to be 25, 68, and 7%, respectively, indicating that the 6-membered ring is the most common, while the 8-membered ring is the minority. Basically, the Al atoms are either 4- or 3-coordinated, and the O atoms are 3-coordinated; however, when two or more 4-membered rings are adjacent to one another, exceptionally, 5-coordinated Al and 4-coordinated O atoms are observed (Fig. 4B). In addition, with the exception of the edges, the majority of Al atoms are four-coordinated and bonded to three oxygen atoms, generating two variations in the methyl group orientation with regards to the aluminoxane framework (i.e., front and back; Fig. 4C).Two possible chemisorption mechanisms exist for the reversible chemisorption of TMAL on the (AlMeO)n framework termini. More specifically, one mechanism involves a single Me–Al bond of the TMAL dissociating, wherein AlMe2 and Me cap the under-coordinated O and Al atoms of the framework termini, respectively (Fig. 4D). Occasionally, two O atoms share one AlMe2 moiety, forming a four-membered ring at the terminal (Fig. 4E). In the second mechanism, the TMAL molecule adsorbs onto the (AlMeO)n framework by sharing two Me units to generate a terminal AlMe2 moiety (Fig. 4F).
To illustrate the differences between the different motifs, typical structures for each motif are shown in Fig. 4G, wherein it can be seen that the cube and tube structures consist of closed connections of 4-, 5-, and 6-membered rings, with all methyl groups facing outwards from the framework. The tube structures are created by connecting the hexagonal prismatic structure (Fig. 1B) in a single direction, and TMAL molecules adsorb on the 4-membered rings present at the ends. The cage/sheet structure is similar to the cage structure, although the presence of a large ring (i.e., >10-membered ring) gives the appearance of a partially broken cage. The sheet structures are also composed of 4-, 6-, and 8-membered rings, but instead of generating a closed structure, such as in the tube and cage motifs, the sheet structures are planar and possess numerous edges for TMAL adsorption. In this structure, the methyl groups do not adopt any particular direction in relation to the aluminoxane framework.
Simulation and fitting
Simulation of the X-ray scattering patterns was performed using DISCUS,34 and the optimization function (scipy.optimize) in the SciPy Python package35 was employed for fitting to the experimental results. All PDF simulations and fittings were performed using the Diffpy-CMI Python package.36 Fitting was performed according to the following procedure. Initially, an X-ray scattering pattern or a PDF curve acquired experimentally was compared against a simulation result obtained using a molecular model, and the parameters for the simulation were optimized to minimize the difference. To quantify the difference, the residual parameters (Rw values) were calculated for the X-ray scattering patterns and PDF curves based on the following equations: | (2) |
 | (3) |
For the X-ray scattering patterns, adjustments were made only for the scale and the background intensity. The broadening effect attributed to the thermal vibration (Debye–Waller factor) was not considered significant, as it had minimal impact on the shape of the diffraction peaks within the realistic range (Uiso = < approximately 0.02 [Å2], Fig. S2†).
In the fitting of the PDF curve, the atomic displacement parameter (ADP) was optimized for each atom (H, C, O, and Al), as were the scale factor and the delta 1 value. The ADP reflects the distribution of atomic positions, including thermal vibrations (Debye–Waller factor), and hence the ADP influences the peak width in the PDF curve. For the purpose of this study, atomic position variations were assumed to be isotropic.
In addition, the scale factor is related to the overall intensity of the PDF, while delta 1 is an r-dependent peak sharpening factor related to the correlated motion of atoms. In principle, the direction of thermal vibrations of each atom is random, and so no thermal vibration-induced r-dependence exists in the peak broadening. However, the experimental results tend to exhibit sharper peaks compared to the simulation results, particularly in the shorter r region. This can be attributed to the fact that the motion of atoms in the vicinity is correlated rather than random.37 A larger delta 1 value corresponds to a greater r-dependent peak sharpening, which reflects a stronger tendency for atomic correlated motion. The determined parameters are visualized in Fig. S3,† wherein Qmax and Qmin were set as equal for the experimental system, and Qdamp, the parameter related to the Q-dependent attenuation of the scattering intensity, was determined from the measurement results obtained for Ni powder (Junsei Chemical Co., Ltd, Tokyo, Japan) under the same conditions. The atomic configurations of the molecular models were not refined in either the PDF curve or in the X-ray scattering pattern fitting since they had been optimized through DFT calculations.
Results and discussion
Experimental X-ray scattering patterns and PDF results
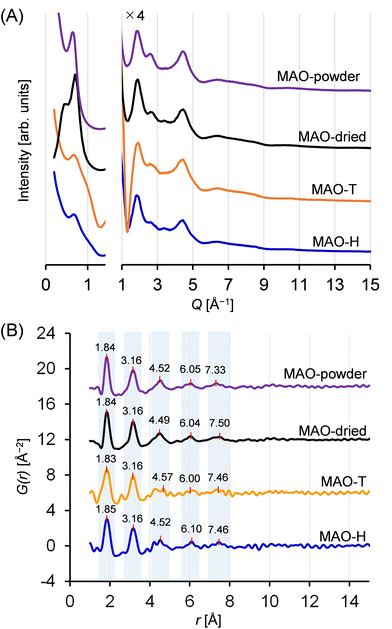
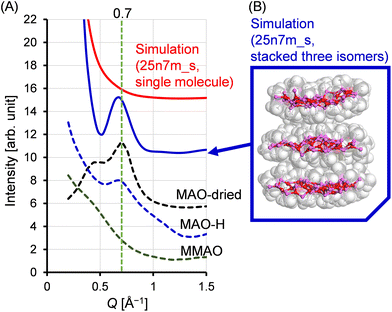
Fig. 5A displays the scattering patterns obtained for the MAO samples. All samples exhibited pronounced scattering within the small-angle scattering region (Q < 1.5 Å−1, corresponding to d > 4.2 Å). Notably, the scattering profiles in this region depend on the samples, suggesting that the higher-ordered structures of the MAO samples, potentially generated through intermolecular aggregation, were influenced by both the preparation method and the sample form. More specifically, although all samples exhibited a peak at 0.7 Å−1, the peaks recorded for the solid samples were more intense. Conversely, in the region of Q > 1.5 Å−1, two broad scattering peaks were consistently observed for all samples at Q-values of 1.9 and 4.5 Å−1 (d = 3.3 and 1.4 Å). This observation implies the existence of some degree of periodicity, wherein all samples possess a similar molecular structure.The PDF curves calculated from these scattering patterns are shown in Fig. 5B. Remarkably, the number and positions of the peaks were similar for all samples. The curves displayed two pronounced peaks at r = 1.8 and 3.2 Å, a minor peak at r = 4.5 Å, and two subtle, upward convex features at r = 6.0 and 7.5 Å. The features in a PDF curve reflect the abundances and interatomic distances of the atomic pairs in a sample. The contributions from hydrogen-containing atomic pairs are negligible, given the extremely low atomic scattering factor. The first peak at 1.8 Å is attributed to Al–O and Al–C atomic pairs, while the second peak at 4.5 Å is associated with Al–Al and O–O atomic pairs, situated diagonally in the four-membered rings (–Al–O–Al–O–) or six-membered rings (–Al–O–Al–O–Al–O–) within the aluminoxane framework. The features observed at r > 4 Å are presumed to originate from atomic pairs involving atoms located outside such ring structures. At r > 9 Å, all curves flattened, suggesting that the dimensions of the periodicity fell below 9 Å. Thus, both the X-ray scattering patterns and the PDF curves confirmed the presence of similar molecular structures for all synthesized MAO samples, regardless of the preparation method and the sample form.
Fitting of the experimental results with the molecular model library
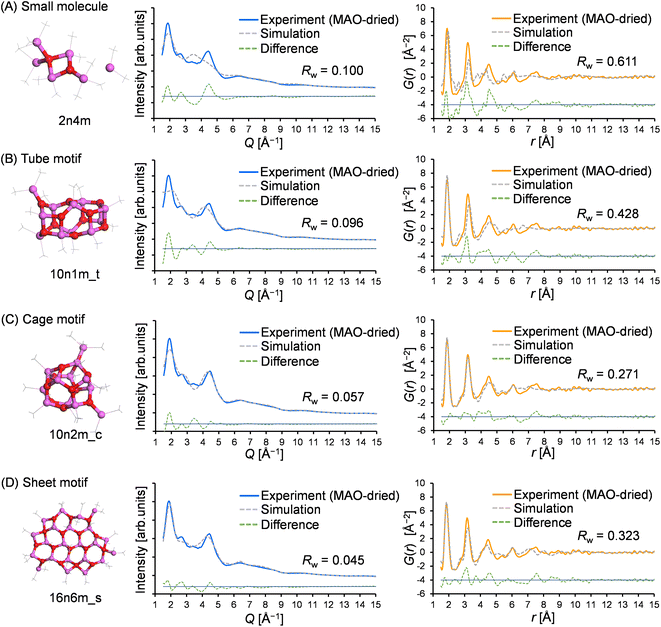
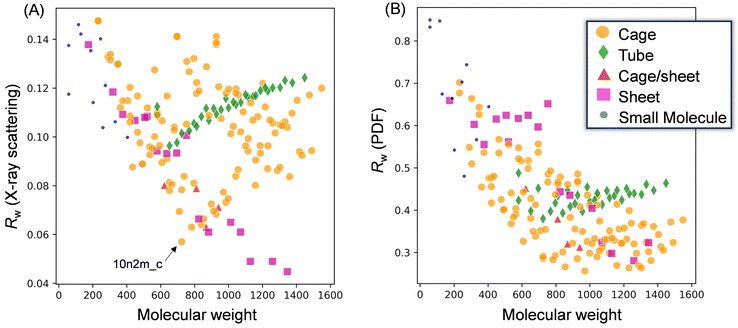
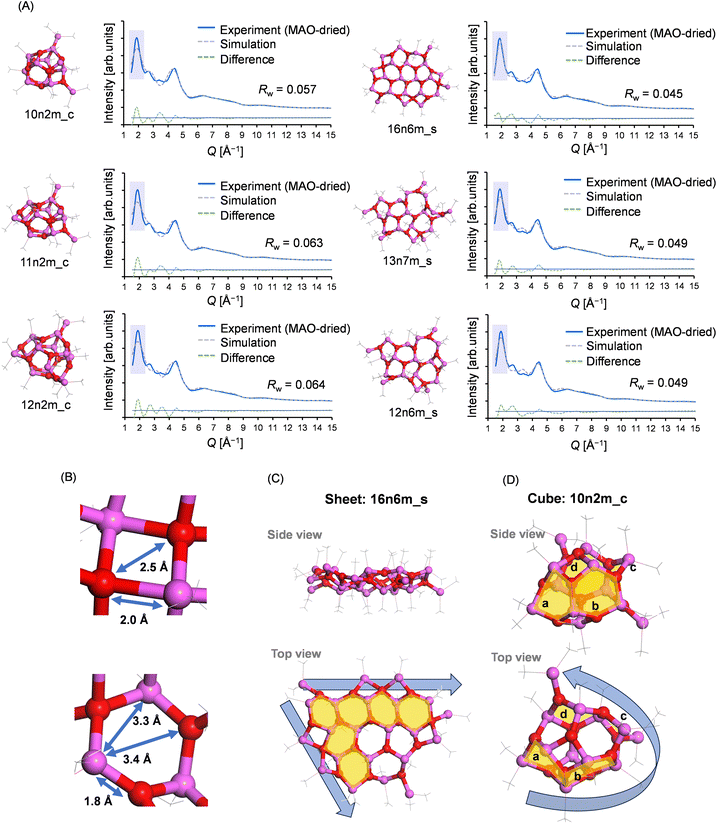
To gain insight into the molecular structure of MAO, the experimental results were fit using the molecular library. Since the X-ray scattering patterns and PDF curves were similar among the samples, one representative sample was selected for fitting. More specifically, the MAO-dried sample was chosen as it possessed the highest signal-to-noise ratio in the PDF curve due to its more concentrated nature. Thus, Fig. 6 presents the typical fitting results for the X-ray scattering pattern and the PDF curve, which show the best agreement with the experimental values for each motif. Furthermore, Fig. 7 illustrates the relationship between the accuracy of fitting for the MAO-dried sample (quantified by the residual parameter, Rw) and the molecular weight of the library models.More specifically, Fig. 7A presents the fitting results for the X-ray scattering pattern, wherein it is evident that small molecular models (blue circles) could not reproduce the experimental result because of their significantly smaller dimensions. Similarly, the tube models (green diamonds) were unsuccessful in reproducing the experimental result. Among the cage models (orange circles), 10n2m_c exhibited the lowest Rw value (Rw = 0.057, Mw = 724.3), and it was observed that the Rw value increased upon increasing or decreasing the molecular weight. For the sheet models (pink squares), Rw decreased with an increasing molecular weight until becoming independent of the molecular weight above 1100. The largest sheet model in the library, 16n6m_s, exhibited the best degree of fitting (Rw = 0.046, MW = 1345.7). Moreover, Fig. 7B shows the results of the PDF fitting. Similar to the X-ray scattering pattern fitting results, the small molecule models and the tube models exhibited higher Rw values than the cage and sheet models. Focusing on the sheet models, the Rw value fell from 0.65 (MW = 752) to 0.45 (MW = 825), while at molecular weights >800, the Rw values decreased with an increase in the molecular weight up to 1100. For the cage models, the Rw values gradually decreased with an increasing molecular weight up to ∼800, became stable between 800 and 1300, and then deteriorated at molecular weights >1300.
Thus, based on the above results, it is evident that the small molecule and tube models are the least representative of the MAO molecular structure. On the other hand, the cage and sheet models may more appropriately represent the structure of MAO because of their superior Rw values.
Plausibility verification of the cage and sheet motifs
To understand the origin of these motif-dependent trends, their fitting results were carefully compared. The three best fitting results of the X-ray scattering pattern for the cage and sheet motifs, which are characterized by the lowest Rw values, are presented in Fig. 8A. As noted above, the two peaks at Q = 1.9 and 4.5 Å−1 are distinctive in the X-ray scattering pattern of MAO. The scattering patterns simulated from the sheet models accurately reproduce both peaks, whereas the patterns derived from the cage models exhibit a broader peak at 1.9 Å−1, resulting in a higher Rw value (as highlighted by the blue shading in the figure). The peak at 1.9 Å−1 corresponds to a real-space distance of 3.3 Å, indicative of the Al–Al or O–O distance within the distorted six-membered aluminoxane rings in the framework (Fig. 8B). For reference, Fig. S4† displays the distribution of Al–Al distances in typical structures.As previously reported, the sharpness of the scattering peaks in the reciprocal space is a direct consequence of the structural periodicity,38 and this can be attributed to the fact that a crystalline material exhibits distinct Bragg reflection peaks in the bulk form, but broader scattering peaks in the nanoparticle state. In sheet models, the two-dimensional periodic arrangement of the six-membered aluminoxane rings most likely contributes to the sharp peak at Q = 1.9 Å−1 (Fig. 8C). Conversely, in smaller cage models such as 10n2m_c, this periodic arrangement is not present due to the significant curvature, leading to a broadening of the peak (Fig. 8D). The increase in Rw observed in larger cage models stems from the six-membered aluminoxane rings being arranged in a curved plane along the walls of the cage model, thereby disrupting the periodicity. On the other hand, the Rw values for the sheet models decreased with an increasing molecular weight, likely due to the edges of the sheet model extending laterally with an increasing molecular weight, thereby maintaining the periodic arrangement of the six-membered aluminoxane rings.
Similarly, the PDF fitting results for the cage and sheet motifs were compared in detail; Fig. 9 shows the three best fitting results for the cage and sheet models in the PDF fitting of the MAO-dried sample. Interestingly, the deviation of the r range was found to depend on the motif, wherein for the cage models, the feature intensity at r > 4 Å was weaker in the simulation. This likely resulted from distortion of the planar periodic arrangement of the aluminoxane rings. This trend becomes more pronounced with an increase in the molecular weight, as demonstrated in Fig. S5.† This hypothesis is further supported by the observation that the r > 4 Å feature is more accurately reproduced in the sheet models, wherein the aluminoxane rings are arranged periodically in a two-dimensional plane. In the sheet models, the intensity of the second peak at r = 3.2 Å is consistently weaker in the simulation. The cause of this is hypothesized to be the inclusion of four-membered rings formed through the adsorption of TMAL molecules onto the edges of the aluminoxane sheet. The first peak at 1.8 Å corresponds to the edges of the rings (Al–O atomic pair), and the second peak at 3.2 Å corresponds to the diagonals of the rings (Al–Al and O–O atomic pairs); therefore, the relative intensities of the first and second peaks are governed by the proportion of four- and six-membered rings, as depicted in Fig. S6.† In sheet models with molecular weights >800, the chemisorbed TMAL molecules formed four-membered rings (–Al–O–Al(Me)2–O–) at the edges (Fig. S7†). This hypothesis was confirmed by creating a modified sheet model wherein the TMAL molecules were removed without further optimization (16n0m_s, derived from 16n6m_s), leading to a remarkable improvement in fitting (Fig. S8†). This leads to another hypothesis, wherein increasing the molecular weight leads to an expansion of the lateral sheet dimension, and the proportion of four-membered rings present at the edges decreases. In other words, the actual MAO molecule is probably a sheet with an even larger molecular weight than that of 16n6m_s, which is the largest sheet structure investigated in the current library.
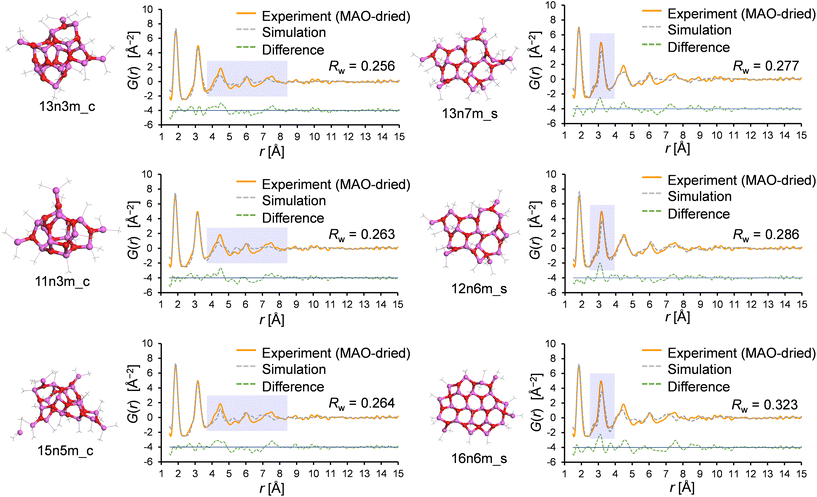 | ||
| Fig. 9 The three results with the lowest Rw values for the cage and sheet motifs, as determined by PDF fitting. | ||
The experimentally determined Me/Al ratio also supports the above assumption. More specifically, elemental analysis and quantitative solution NMR spectroscopy estimated the Me/Al ratio of the MAO-H sample, i.e., the precursor of the MAO-dried sample, as 1.46![[thin space (1/6-em)]](https://www.rsc.org/images/entities/char_2009.gif) :
:![[thin space (1/6-em)]](https://www.rsc.org/images/entities/char_2009.gif) 1 (mol/mol; excluding free TMAL). As explained in the introduction, the Me/Al ratio of a pure aluminoxane ((MeAlO)n) framework is 1
1 (mol/mol; excluding free TMAL). As explained in the introduction, the Me/Al ratio of a pure aluminoxane ((MeAlO)n) framework is 1![[thin space (1/6-em)]](https://www.rsc.org/images/entities/char_2009.gif) :
:![[thin space (1/6-em)]](https://www.rsc.org/images/entities/char_2009.gif) 1; therefore, deviation to a higher ratio indicates that the chemisorption of TMAL has taken place. Notably, the theoretical Me/Al ratio of 16n6m_s is 1.55
1; therefore, deviation to a higher ratio indicates that the chemisorption of TMAL has taken place. Notably, the theoretical Me/Al ratio of 16n6m_s is 1.55![[thin space (1/6-em)]](https://www.rsc.org/images/entities/char_2009.gif) :
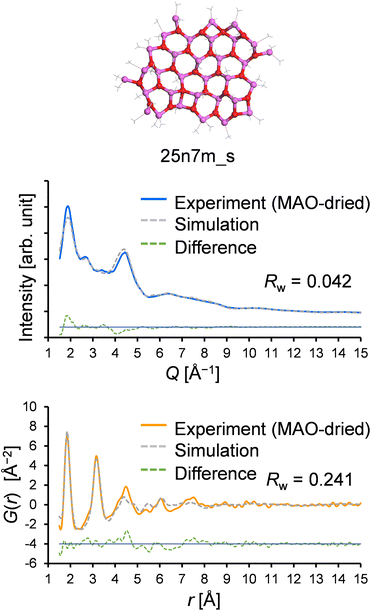
:![[thin space (1/6-em)]](https://www.rsc.org/images/entities/char_2009.gif) 1 (mol/mol), suggesting a greater number of TMAL molecules compared to those obtained experimentally, further confirming that a larger sheet model would be more plausible. Thus, a larger sheet model was created that matches the experimentally determined Me/Al ratio (25n7 m, Me/Al = 1.44 mol/mol, Mw = 1954.9, the structure was geometry-optimized by DFT calculations: DMol3 implemented in Materials Studio 2021
1 (mol/mol), suggesting a greater number of TMAL molecules compared to those obtained experimentally, further confirming that a larger sheet model would be more plausible. Thus, a larger sheet model was created that matches the experimentally determined Me/Al ratio (25n7 m, Me/Al = 1.44 mol/mol, Mw = 1954.9, the structure was geometry-optimized by DFT calculations: DMol3 implemented in Materials Studio 2021![[thin space (1/6-em)]](https://www.rsc.org/images/entities/char_2009.gif) 39 with meta GGA SCAN40 for the exchange–correlation function and DNP41 for the basis functions), and its optimized atomic configuration is given in Table S1.† Using this model, the resulting Rw values for the X-ray scattering pattern and the PDF fitting were determined to be 0.042 and 0.241, respectively, both of which are superior to the results obtained with existing models in the library (Fig. 10).
39 with meta GGA SCAN40 for the exchange–correlation function and DNP41 for the basis functions), and its optimized atomic configuration is given in Table S1.† Using this model, the resulting Rw values for the X-ray scattering pattern and the PDF fitting were determined to be 0.042 and 0.241, respectively, both of which are superior to the results obtained with existing models in the library (Fig. 10).
Several key conclusions can be drawn from the above discussion. Firstly, the tube motif was deemed implausible due to consistently high Rw values being observed in both the X-ray scattering pattern and the PDF fittings. In contrast, the cage and sheet models showed lower Rw values in the X-ray scattering pattern fitting. However, while the Rw values for the cage models varied significantly with the molecular weight, the sheet models consistently exhibited low Rw values irrespective of the molecular weight, even above 1100. This divergence in trends was attributed to the inherent structural characteristic of the motifs, wherein cage models undergo considerable structural changes upon varying the number of AlMeO units in the framework, whereas sheet models simply expand their lateral dimensions, avoiding any drastic structural changes. As previously noted, the molecular weight distribution exhibited by MAO can only be accommodated by the sheet motif. Furthermore, PDF fitting revealed that both the cage and sheet models achieved similar Rw values; however, the cage models displayed poor agreement in the regions beyond the dimensions of their six-membered aluminoxane ring (r < 4 Å). In contrast, the second peak at 3.2 Å was less pronounced for the sheet models, likely due to the presence of four-membered rings (–Al–O–Al(Me)–O–) formed by TMAL adsorption at the edges. Notably, the Rw value in the PDF fitting was improved by either excluding the TMAL molecule or employing a sheet model with a higher molecular weight. Therefore, considering both the X-ray scattering pattern and PDF analysis, the sheet motif emerges as the most plausible structure for MAO.
Stacked MAO sheets
If the sheet motif indeed represents the structure of MAO, the characteristic peak observed in the small-angle scattering region can be elucidated. Fig. 11 shows the small-angle region of the X-ray scattering patterns for both the experimental and simulated situations. In addition to the patterns recorded for the MAO-dried and MAO-H samples, that of MMAO is also shown for reference. It can be seen that the MAO-dried and MAO-H samples both exhibited a peak at approximately Q = 0.7 Å−1; however, this peak was absent in the simulated patterns, including that of the 25n7m_s model (red solid curve). It was therefore considered that, in a sheet-like MAO structure, molecular stacking could result in scattering peaks analogous to the (002) Bragg diffraction peaks observed in graphite. To investigate this further, three variants of the 25n7m_s molecule were constructed. These variants were then stacked, ensuring that the van der Waals radii of the vertically protruding methyl groups did not overlap, and their X-ray scattering patterns were simulated. The simulation yielded a scattering peak at approximately Q = 0.7 Å−1, similar to that obtained experimentally, and supporting the notion that this peak originates from inter-sheet stacking. The broader peak observed for MAO-H compared to that of the MAO-dried sample could be attributed to variations in the number of stacked MAO molecules and the distances between them, which are influenced by their dispersion in toluene. Interestingly, similar peaks were not observed in MMAO, potentially due to the bulky isobutyl group present in MMAO, which hinders its stacking. This observation is consistent with the enhanced solubility of MMAO in aliphatic hydrocarbon solvents.Conclusions
In this study, the nanostructure of methylaluminoxane (MAO) was investigated using the X-ray total scattering technique, which allows structural information to be accessed beyond the closest neighbor bond distance. By comparing the experimental results with previously proposed molecular models, a number of key findings were made. Firstly, it was found that the MAO samples exhibited almost identical features in their atomic PDFs irrespective of their preparation method (hydrolysis or thermal decomposition with benzoic acid) and form (toluene solution or solid). The X-ray scattering features were also similar among the samples, although the features in the small-angle scattering region differed. These results suggest that the inner molecular structure was similar among the samples, whereas the aggregation states were different. It was also deduced that the tube models were implausible because they were unable to reproduce the experimental X-ray scattering pattern and PDF curve, irrespective of the molecular weight. In addition, independent of the motif, the structures possessing molecular weights of <600–800 were also considered to be less plausible. This was attributed to the absence of a six-membered aluminoxane ring (–Al–O–Al–O–Al–O–) in these structures, which is essential to reproduce the first and the second peaks in the experimental PDF curve. The obtained results also suggested that the sheet motif was more plausible than the cage motif, since above a certain molecular weight, sheet structures do not undergo significant structural changes with respect to the molecular weight, which is consistent with the presence of a molecular weight distribution. Moreover, stacking of the sheet structures accounts for the peak observed in the small-angle region of the X-ray scattering pattern (Q = 0.7 Å−1), and this assumption was also supported by very recent crystallographic observations.1 Notably, sheet models containing fewer four-membered rings (i.e., 16n0m_s and 25n7m_s) effectively reproduced the experimental PDF curve. Although the results of this study allowed the conclusion to be drawn that the primary motif of MAO molecules is the sheet motif, the co-existence of the other motifs was not completely excluded. Additionally, no molecular model has yet fully reproduced the experimental PDF curve. Resolving these questions may require more multifaceted investigations, including systematic sample variations, control of the adsorbed trimethylaluminum molecules through in situ heating measurements, and comparison of the performance indicators of MAO as a pre-catalyst activator for polymerization. Ultimately, determination of the structural motif of MAO is expected to be beneficial for systematic research and development using this compound.Data availability
The data supporting this article have been included as part of the ESI.†Author contributions
T. W.: data curation, investigation, methodology, and writing – original draft. T. T.: conceptualization, supervision, and writing – review & editing.Conflicts of interest
There are no conflicts to declare.Acknowledgements
The authors gratefully acknowledge Tosoh Finechem corporation for kindly providing the MAO samples used in this study. Their generous support greatly contributed to the successful completion of our research. A part of this work was supported by the “Grant for Research” of The Japan Petroleum Institute. The synchrotron radiation experiments were performed at BL04B2 of SPring-8 with the approval of the Japan Synchrotron Radiation Research Institute (JASRI) (proposal no. 2020A1231 and 2022A1329).References
- L. Luo, J. M. Younker and A. V. Zabula, Structure of methylaluminoxane (MAO): Extractable [Al(CH3)2]+ for precatalyst activation, Science, 2024, 384(6703), 1424–1428, DOI:10.1126/science.adm7305.
- F. Zaccaria, C. Zuccaccia, R. Cipullo, P. H. M. Budzelaar, A. Vittoria, A. Macchioni, V. Busico and C. Ehm, Methylaluminoxane's Molecular Cousin: A Well-defined and “Complete” Al-Activator for Molecular Olefin Polymerization Catalysts, ACS Catal., 2021, 11(8), 4464–4475, DOI:10.1021/acscatal.0c05696.
- W. Kaminsky and H. Sinn, Methylaluminoxane: Key Component for New Polymerization Catalysts, in Polyolefins: 50 years after Ziegler and Natta II: Polyolefins by Metallocenes and Other Single-Site Catalysts, ed. W. Kaminsky, Springer Berlin Heidelberg, 2013, pp. 1–28 Search PubMed.
- H. S. Zijlstra and S. Harder, Methylalumoxane – History, Production, Properties, and Applications, Eur. J. Inorg. Chem., 2015, 2015(1), 19–43, DOI:10.1002/ejic.201402978.
- R. Tanaka, O. A. Ajala, Y. Nakayama and T. Shiono, Control of coordination polymerization behavior by counter-anionic effects, Prog. Polym. Sci., 2023, 142, 101690, DOI:10.1016/j.progpolymsci.2023.101690.
- J.-N. Pédeutour, K. Radhakrishnan, H. Cramail and A. Deffieux, Reactivity of Metallocene Catalysts for Olefin Polymerization: Influence of Activator Nature and Structure, Macromol. Rapid Commun., 2001, 22(14), 1095–1123, DOI:10.1002/1521-3927(20011001)22:14<1095::AID-MARC1095>3.0.CO;2-R.
- M. Linnolahti and S. Collins, Formation, Structure, and Composition of Methylaluminoxane, ChemPhysChem, 2017, 18(23), 3369–3374, DOI:10.1002/cphc.201700827.
- A. Joshi, S. Collins, M. Linnolahti, H. S. Zijlstra, E. Liles and J. S. McIndoe, Spectroscopic Studies of Synthetic Methylaluminoxane: Structure of Methylaluminoxane Activators, Chem. – Eur. J., 2021, 27 (34), 8753–8763, DOI:10.1002/chem.202100271.
- F. Zaccaria, C. Zuccaccia, R. Cipullo, P. H. M. Budzelaar, A. Macchioni, V. Busico and C. Ehm, BHT-Modified MAO: Cage Size Estimation, Chemical Counting of Strongly Acidic Al Sites, and Activation of a Ti-Phosphinimide Precatalyst, ACS Catal., 2019, 9(4), 2996–3010, DOI:10.1021/acscatal.9b00076.
- D. Cam, E. Albizzati and P. Cinquina, Characterization of methylalumoxane by means of gel permeation chromatography, Makromol. Chem., 1990, 191(7), 1641–1647, DOI:10.1002/macp.1990.021910716 , acccessed 2023/11/16.
- F. Zaccaria, P. H. M. Budzelaar, R. Cipullo, C. Zuccaccia, A. Macchioni, V. Busico and C. Ehm, Reactivity Trends of Lewis Acidic Sites in Methylaluminoxane and Some of Its Modifications, Inorg. Chem., 2020, 59(8), 5751–5759, DOI:10.1021/acs.inorgchem.0c00533.
- P. L. Bryant, C. R. Harwell, A. A. Mrse, E. F. Emery, Z. Gan, T. Caldwell, A. P. Reyes, P. Kuhns, D. W. Hoyt and L. S. Simeral, et al., Structural Characterization of MAO and Related Aluminum Complexes. 1. Solid-State 27Al NMR with Comparison to EFG Tensors from ab Initio Molecular Orbital Calculations, J. Am. Chem. Soc., 2001, 123(48), 12009–12017, DOI:10.1021/ja011092a.
- K. P. Bryliakov, N. V. Semikolenova, V. N. Panchenko, V. A. Zakharov, H. H. Brintzinger and E. P. Talsi, Activation of rac-Me2Si(ind)2ZrCl2 by Methylalumoxane Modified by Aluminum Alkyls: An EPR Spin-Probe, 1H NMR, and Polymerization Study, Macromol. Chem. Phys., 2006, 207(3), 327–335, DOI:10.1002/macp.200500443.
- M. E. Z. Velthoen, A. Muñoz-Murillo, A. Bouhmadi, M. Cecius, S. Diefenbach and B. M. Weckhuysen, The Multifaceted Role of Methylaluminoxane in Metallocene-Based Olefin Polymerization Catalysis, Macromolecules, 2018, 51(2), 343–355, DOI:10.1021/acs.macromol.7b02169.
- E. P. Talsi, N. V. Semikolenova, V. N. Panchenko, A. P. Sobolev, D. E. Babushkin, A. A. Shubin and V. A. Zakharov, The metallocene/methylaluminoxane catalysts formation: EPR spin probe study of Lewis acidic sites of methylaluminoxane, J. Mol. Catal. A: Chem., 1999, 139(2–3), 131–137 CrossRef CAS . article.
- J. L. Atwood, D. C. Hrncir, R. D. Priester and R. D. Rogers, Decomposition of high-oxygen content organoaluminum compounds. The formation and structure of the [Al7O6Me16]- anion, Organometallics, 1983, 2(8), 985–989, DOI:10.1021/om50002a008.
- M. R. Mason, J. M. Smith, S. G. Bott and A. R. Barron, Hydrolysis of tri-tert-butylaluminum: the first structural characterization of alkylalumoxanes [(R2Al)2O]n and (RAlO)n, J. Am. Chem. Soc., 1993, 115(12), 4971–4984, DOI:10.1021/ja00065a005.
- E. Zurek and T. Ziegler, Theoretical studies of the structure and function of MAO (methylaluminoxane), Prog. Polym. Sci., 2004, 29(2), 107–148, DOI:10.1016/j.progpolymsci.2003.10.003.
- Z. Boudene, T. De Bruin, H. Toulhoat and P. Raybaud, A QSPR Investigation of Thermal Stability of [Al(CH3)O]n Oligomers in Methylaluminoxane Solution: The Identification of a Geometry-Based Descriptor, Organometallics, 2012, 31 (23), 8312–8322, DOI:10.1021/om300916q.
- Z. Falls, N. Tymińska and E. Zurek, The Dynamic Equilibrium Between (AlOMe)n Cages and (AlOMe)n·(AlMe3)m Nanotubes in Methylaluminoxane (MAO): A First-Principles Investigation, Macromolecules, 2014, 47(24), 8556–8569, DOI:10.1021/ma501892v.
- S. Collins, G. Hasan, A. Joshi, J. S. McIndoe and M. Linnolahti, Are Methylaluminoxane Activators Sheets?, ChemPhysChem, 2021, 22(13), 1326–1335, DOI:10.1002/cphc.202100268.
- T. Egami and S. J. L. Billinge, Underneath the Bragg peaks : structural analysis of complex materials, Elsevier, 2012 Search PubMed.
- T. Wada, G. Takasao, A. Piovano, M. D'Amore, A. Thakur, P. Chammingkwan, P. C. Bruzzese, M. Terano, B. Civalleri and S. Bordiga, et al., Revisiting the identity of δ-MgCl2: Part I. Structural disorder studied by synchrotron X-ray total scattering, J. Catal., 2020, 385, 76–86, DOI:10.1016/j.jcat.2020.03.002.
- A. Piovano, T. Wada, A. Amodio, G. Takasao, T. Ikeda, D. Zhu, M. Terano, P. Chammingkwan, E. Groppo and T. Taniike, Formation of Highly Active Ziegler–Natta Catalysts Clarified by a Multifaceted Characterization Approach, ACS Catal., 2021, 11(22), 13782–13796, DOI:10.1021/acscatal.1c03067.
- H. Cramail, K. Radhakrishnan and A. Deffieux, New synthetic route to methylaluminoxane for ethylene polymerisation in the presence of zirconocene, C. R. Chim., 2002, 5(1), 49–52, DOI:10.1016/S1631-0748(02)01350-4.
- R. J. Becker, S. Gurtzgen and R. Schrader, Process for the preparation of aluminoxanes, EP0623624B1, 1998.
- G. K. H. Robarge, E. Robert and E. A. Bart, Continuous Manufacturing Method for Hydrocarbylaluminoxanes, Japan P2000-512622A, 2000.
- E. Kachi and E. Yoshioka, Solid Polymethylaluminoxane Composition and Its Manufacturing Method, Japan P5611833, 2014.
- E. Kachi and T. Yamane, olid-State PMAO Composition and Its Manufacturing Method. Japan P6259549, 2017.
- P. Unruean, W. Apisuk, Y. Kawabata, T. Murayama, B. Kitiyanan and K. Nomura, Effect of supported MAO cocatalysts in ethylene polymerization and ethylene/1-hexene copolymerization using Cp*TiCl2(O-2,6-iPr2C6H3) catalyst, Mol. Catal., 2019, 475, 110490, DOI:10.1016/j.mcat.2019.110490.
- E. Kachi, K. Toyota, T. Takasugi and H. Kanazawa, Method for Producing Modified Methylaluminoxane for Olefin Polymerization Catalyst and Co-Catalyst. Japan P3914502, 2007.
- S. Kohara, M. Itou, K. Suzuya, Y. Inamura, Y. Sakurai, Y. Ohishi and M. Takata, Structural studies of disordered materials using high-energy X-ray diffraction from ambient to extreme conditions, J. Phys.: Condens. Matter, 2007, 19(50), 506101, DOI:10.1088/0953-8984/19/50/506101.
- S. Collins and M. Linnolahti, Ionization of Cp2ZrMe2 and Lewis Bases by Methylaluminoxane: Computational Insights, ChemPhysChem, 2023, 24(4), e202200759, DOI:10.1002/cphc.202200759.
- T. Proffen and R. Neder, DISCUS: A program for diffuse scattering and defect-structure simulation, J. Appl. Crystallogr., 1997, 30(2), 171–175 CrossRef CAS.
- P. Virtanen, R. Gommers, T. E. Oliphant, M. Haberland, T. Reddy, D. Cournapeau, E. Burovski, P. Peterson, W. Weckesser and J. Bright, et al., SciPy 1.0: fundamental algorithms for scientific computing in Python, Nat. Methods, 2020, 17(3), 261–272, DOI:10.1038/s41592-019-0686-2.
- P. Juhas, C. L. Farrow, X. Yang, K. R. Knox and S. J. L. Billinge, Complex modeling: a strategy and software program for combining multiple information sources to solve ill posed structure and nanostructure inverse problems, Acta Crystallogr., Sect. A, 2015, 71 (6), 562–568, DOI:10.1107/S2053273315014473.
- I.-K. Jeong, T. Proffen, F. Mohiuddin-Jacobs and S. J. L. Billinge, Measuring Correlated Atomic Motion Using X-ray Diffraction, J. Phys. Chem. A, 1999, 103(7), 921–924, DOI:10.1021/jp9836978.
- R. E. Dinnebier and S. J. L. Billinge, Powder Diffraction Theory and Practice, The Royal Society of Chemistry, 2009 Search PubMed.
- B. Delley, From molecules to solids with the DMol3 approach, J. Chem. Phys., 2000, 113(18), 7756–7764, DOI:10.1063/1.1316015 , acccessed 1/9/2024.
- J. Sun, A. Ruzsinszky and J. P. Perdew, Strongly Constrained and Appropriately Normed Semilocal Density Functional, Phys. Rev. Lett., 2015, 115(3), 036402, DOI:10.1103/PhysRevLett.115.036402.
- B. Delley, An all–electron numerical method for solving the local density functional for polyatomic molecules, J. Chem. Phys., 1990, 92(1), 508–517, DOI:10.1063/1.458452 , acccessed 1/9/2024.
Footnote |
| † Electronic supplementary information (ESI) available: Simulated atomic pair distribution function (PDF) curves for molecular models optimized with various calculation methods; parameter distributions for PDF curve fitting; influence of Debye–Waller factors on simulation for X-ray scattering patterns and PDF curves; distributions of Al–Al distances in selected molecular models; examples of PDF curve fitting results; atomic configurations of the DFT-optimized molecular model; and graphical explanations supporting the discussions. See DOI: https://doi.org/10.1039/d4nr05188b |
| This journal is © The Royal Society of Chemistry 2025 |

